Article

VirtFogSim: A Parallel Toolbox for Dynamic Energy-Delay Performance Testing and Optimization of 5G Mobile-Fog-Cloud Virtualized Platforms

by
Michele Scarpiniti
*,
Enzo Baccarelli
and
Alireza Momenzadeh
Department of Information Engineering, Electronics and Telecommunications (DIET), Sapienza University of Rome, via Eudossiana 18, 00184 Rome, Italy
*
Author to whom correspondence should be addressed.
Appl. Sci. 2019, 9(6), 1160; https://doi.org/10.3390/app9061160
Submission received: 14 February 2019 / Revised: 13 March 2019 / Accepted: 14 March 2019 / Published: 19 March 2019

Abstract

:
It is expected that the pervasive deployment of multi-tier 5G-supported Mobile-Fog-Cloudtechnological computing platforms will constitute an effective means to support the real-time execution of future Internet applications by resource- and energy-limited mobile devices. Increasing interest in this emerging networking-computing technology demands the optimization and performance evaluation of several parts of the underlying infrastructures. However, field trials are challenging due to their operational costs, and in every case, the obtained results could be difficult to repeat and customize. These emerging Mobile-Fog-Cloud ecosystems still lack, indeed, customizable software tools for the performance simulation of their computing-networking building blocks. Motivated by these considerations, in this contribution, we present VirtFogSim. It is a MATLAB-supported software toolbox that allows the dynamic joint optimization and tracking of the energy and delay performance of Mobile-Fog-Cloud systems for the execution of applications described by general Directed Application Graphs (DAGs). In a nutshell, the main peculiar features of the proposed VirtFogSim toolbox are that: (i) it allows the joint dynamic energy-aware optimization of the placement of the application tasks and the allocation of the needed computing-networking resources under hard constraints on acceptable overall execution times; (ii) it allows the repeatable and customizable simulation of the resulting energy-delay performance of the overall system; (iii) it allows the dynamic tracking of the performed resource allocation under time-varying operational environments, as those typically featuring mobile applications; (iv) it is equipped with a user-friendly Graphic User Interface (GUI) that supports a number of graphic formats for data rendering; and (v) its MATLAB code is optimized for running atop multi-core parallel execution platforms. To check both the actual optimization and scalability capabilities of the VirtFogSim toolbox, a number of experimental setups featuring different use cases and operational environments are simulated, and their performances are compared.

1. Introduction

Modern mobile devices are equipped with a number of both heterogeneous Network Interface Cards (NICs) and multimedia sensors that allow them to host emerging perception-related applications, such as face/gesture detection/classification, visual text translation, fusion of sensed data, and video image processing, just to cite a few. Typically, these applications are delay-sensitive and computation-intensive, while the computing and battery capacities of current mobile devices are still limited. In order to cope with these limitations, the so-called Mobile Cloud Computing (MCC) paradigm proposes to offload computation-intensive tasks to the remote Cloud for the execution [1]. However, task offloading towards remote large-size cloud-based data centers undergoes large network latencies, mainly induced by the limited bandwidth still offered by multi-hop cellular Wide Area Networks (WANs) [1]. In principle, a more appealing approach could be, indeed, to allow mobile devices to exploit both the simultaneous utilization of the hosted NICs and the sub-millisecond network latencies featuring the forthcoming Fifth-Generation (5G) communication technology, in order to distribute task offloading suitably to both the remote Cloud and nearby small-sized virtualized data centers, generally referred to as Fog nodes [2].
The reason why the convergence of the three-pillar paradigm of Fog Computing (FC) [3], Cloud Computing (CC) [4] and 5G [5,6] is expected to improve both the energy and delay performance of task offloading of computing-intensive mobile applications relies on their complementary native features (see Table 1 for a synoptic comparison).
Overall, it is expected that the forthcoming 5G paradigm will be capable of simultaneously exploiting the benefits of centralized CC infrastructures, distributed FC infrastructures, and heterogeneous radio technologies, in order to provide seamless resource-augmentation to resource-limited mobile devices. The pivotal idea is to take full advantage of the cooperative radio resource management and distributed computing capability at nearby Fog nodes, in order to: (i) shorten the communication latencies for the execution of delay-sensitive light tasks; and (ii) resort to centralized remote cloud data centers only for the execution of delay-tolerant workload-intensive tasks.

1.1. The Multi-Tiered Networked Simulated Environment

According to these considerations, Figure 1 reports the general architecture of the virtualized 5G-enabled Mobile-Fog-Cloud technological platform that is considered in this paper.
The platform is composed of a virtualized Mobile device, a proximate virtualized Fog node, and a remote virtualized Cloud node. These nodes inter-communicate through Transport -layer TCP/IP connections that are supported, in turn, by the underlying 5G networking infrastructure. Specifically, in Figure 1, we have that:
  • Mobile-Fog communication is supported by a two-way WiFi-based (possibly, mobile) single-hop TCP/IP connection. R U (resp., R D ) is the steady-state throughput of the Mobile-to-Fog (resp., Fog-to-Mobile) upstream (resp., downstream) TCP/IP one-way connection. Their peak values depend, in turn, on the adopted WiFi technology;
  • Mobile-Cloud communication is supported by a two-way 3G/4G cellular (possibly, mobile and/or multi-hop) TCP/IP connection. B U (resp., B D ) is the steady-state throughput of the Mobile-to-Cloud (resp., Cloud-to-Mobile) upstream (resp., downstream) TCP/IP one-way connection;
  • Cloud-Fog communication is supported by a two-way (possibly, wired and multi-hop) backhaul TCP/IP connection. R 0 is the corresponding steady-state throughput.
From a technological perspective, the key role of the 5G paradigm is to allow the computing nodes of Figure 1 to exploit simultaneously multiple heterogeneous radio technologies, in order to perform bandwidth pooling and/or trading network energy versus access latency (see the last column of Table 1). According to this consideration, the reference architecture of Figure 1 assumes that: (i) the mobile device is equipped with at least two Network Interface Cards (NICs), typically, a WiFi NIC and a 3G/4G Cellular NIC; (ii) the Fog node is equipped with a WiFi NIC and an Ethernet NIC; and (iii) the Cloud node is equipped with a Cellular NIC and an Ethernet NIC.
The mobile device must run a given application that is composed of multiple inter-connected tasks (i.e., subroutines or methods). Being energy limited and equipped with limited computing resources, the mobile device may decide to execute each task locally or offload it to the Fog node or the Cloud node. For this purpose, the Fog node (resp., the Cloud node) is virtualized, in order to host a Fog clone (resp., a Cloud clone) of the mobile device. These clones act as virtual processors and execute the offloaded tasks on behalf of the mobile device. At the Application layer, inter-task communications exploit the (aforementioned) Mobile-Fog, Mobile-Cloud, and Cloud-Fog 5G-supported TCP/IP connections.
In the considered reference scenario, the mobile clones at the Fog and Cloud nodes are implemented by resorting to the emerging CoNTainer (CNT)-based technology [7]. Its main peculiar feature is that it uses an Execution Engine, in order to dynamically carry out resource allocation (see Figure 2 of the VirtFogSim user guide for a description of the virtualized clone organization). As a consequence, the physical resources required by a container may be scaled up/down in real time by the corresponding Execution Engine. For this purpose, each server at the Mobile, Fog, and Cloud nodes hosts a number n c 1 of containers. All the containers hosted by a same physical server share the pool of computing (e.g., CPU cycles) and networking (e.g., I/O bandwidth) physical resources made available by the physical CPU and NICs that equip the host server. The main task of the Execution Engine managing each container is to allocate dynamically the bandwidth and computing resources made available by the host server. In so doing, the containers at the Fog and Cloud nodes play the role of virtual clones for the associated mobile device and execute the tasks offloaded by the mobile device on behalf of it. For this purpose, each container acts as a Multi-core Virtual Processor, that comprises a number of (typically, homogeneous) Virtual Cores (VCs), whose processing frequencies are dynamically scaled up/down by the execution engine. The final goal of the Execution Engine is to allocate the pending application tasks over the set of available virtual cores according to the actually adopted task allocation strategy.

1.2. A Motivational Example

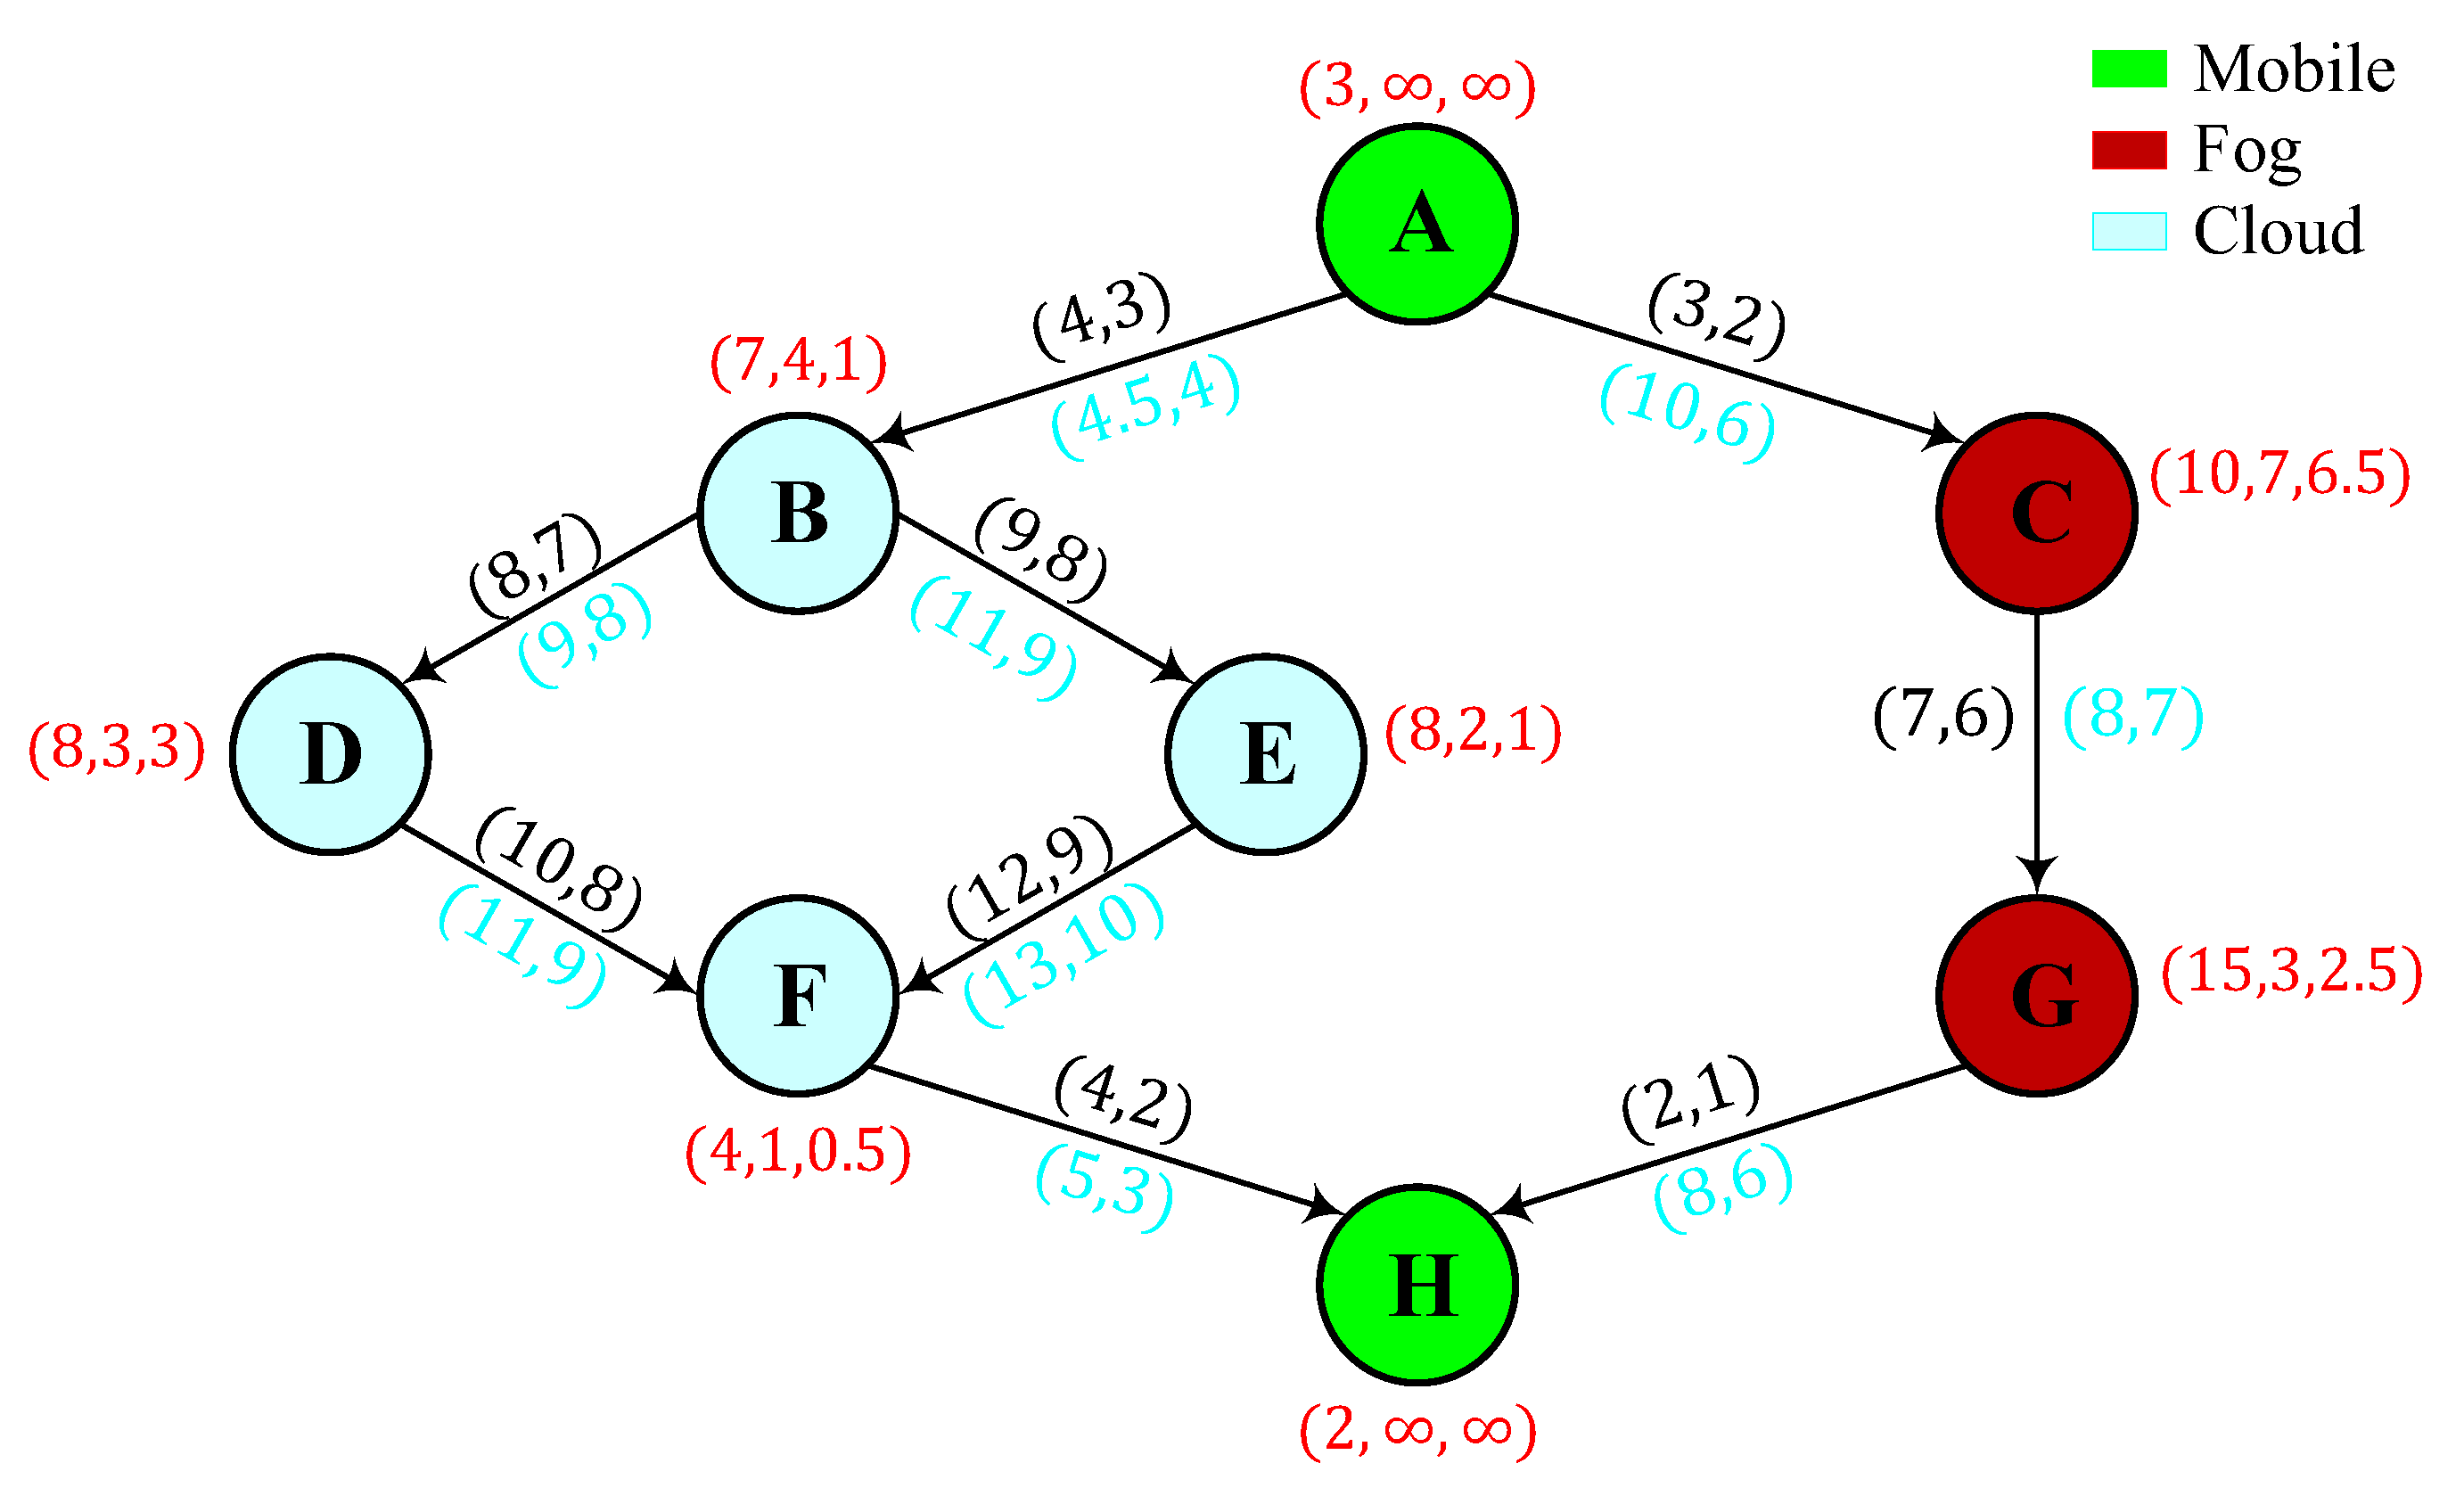
In order to gain a first intuitive insight about the potential energy-saving capability of the three-tiered networked computing platform of Figure 1, let us consider the toy example of Figure 2. It illustrates a “wise” strategy for allocating the tasks of an application DAG. The considered DAG is composed of eight tasks and nine (directed) edges. Each red-marked label ( a , b , c ) on the nodes reports the (possibly, profiled) energies needed for the execution of the corresponding task at the Mobile, Fog, and Cloud, respectively. In the considered example, Nodes A and H are the input and output tasks of the overall DAG, respectively. Hence, by design, they are forced to be executed on the Mobile device (hence, the energies needed for their executions on the Fog and Cloud nodes are infinite; see the corresponding red-marked labels of Figure 2). Furthermore, in Figure 2, each blue-marked (resp., black-marked) label ( f , g ) on the edges indicates the Mobile-to-Cloud and Cloud-to-Mobile (resp., Mobile-to-Fog and Fog-to-Mobile) energies needed for the inter-node transport of the data in the corresponding DAG edge. The computing energy E C M P and the networking energy E N E T can be easily evaluated by summing the related elements in the red-marked, black marked, and blue-marked labels of Figure 2. These energies will be formally defined in Equations (5) and (6) of Section 3.2. The considered DAG being quite simple, it may be analyzed by hand. The analysis leads to the conclusion that the task allocation strategy that minimizes the total computing-plus-networking consumed energy E T O T E C M P + E N E T allocates: (i) tasks A , H to the Mobile device (see the green-colored tasks); (ii) tasks C , G to the Fog (see the red-colored tasks); and (iii) tasks B , D , E , F to the Cloud (see the blue-colored tasks). In so doing, the total energy consumed by the optimal task allocation strategy equates: E T O T = 32.0 (Joule), with the computing energy E C M P = 20.5 (Joule) and the networking energy E N E T = 11.5 (Joule). By contrast, the more direct (but sub-optimal) strategies that execute all tasks at the Mobile, Fog, and Cloud would require: E T O T = 57.0 , 35.0 , and 43.0 (Joule), respectively. This confirms that a “wise” task allocation strategy that exploits all the available Mobile-Fog-Cloud computing nodes may lead to energy saving, even in the presence of non-negligible inter-node network energy consumption.

1.3. Motivations, Main Contributions, and Organization of the Paper

Barring toy examples, it may be very challenging to plan online “wise” decisions about which tasks should be offloaded and towards which computing nodes, especially when the executions of the considered applications must be in real time, so that hard upper limits are present on the overall computing-plus-communication delays. Roughly speaking, the challenging issue stems from two main factors. First, since the combination of offloading decisions generally increases exponentially with the number of tasks of the considered DAG, exhaustive searches quickly become very time consuming, or even infeasible. Second, it is challenging to calculate analytically in closed-form the execution time of an application described by a DAG with a general (possibly, pseudo-random) topology, especially when the communication latencies must be also accounted for. In fact, the execution time generally depends on many factors like, for example, the parallelism of the Mobile-Cloud-Fog computing nodes, their (possibly, scalable) computing speeds, the number of virtual cores available at the Cloud and Fog nodes, as well as the available (and possibly scalable) inter-node network bandwidths, just to name a few.
Hence, to enable an energy-efficient real-time exploitation of the mobile technological platform of Figure 1, we need a flexible evaluation environment for the dynamic test of different task offloading and resource allocation strategies under programmable (e.g., settable by the user) models for the energy-delay profiles of the virtualized computing and network blocks composing the reference architecture of Figure 1. The hardware implementation of the 5G-supported Mobile-Fog-Cloud test-bed, although valuable, could be too cumbersome, and (moreover) it could not guarantee a repeatable and controllable performance environment.
Motivated by these considerations, in this paper, we present the general architecture and test the main functionalities of the VirtFogSim package. It is a new software toolbox that allows:
  • simulation on parallel hardware machines;
  • dynamic optimization;
  • dynamic tracking;
  • comparison;
  • graphic rendering through an ad-hoc-designed Graphic Use Interface (GUI),
of the energy-delay performances of heuristic and meta-heuristic strategies for joint task offloading and dynamic resource allocation of application DAGs with general topologies over the three-tiered networked virtualized computing platform of Figure 1, under hard real-time constraints on the overall (i.e., computing-plus-communication) execution times. VirtFogSim allows the users to:
  • test their desired application DAGs by customizing the simulation environment of Figure 1 through the setting of the 67 input parameters of the simulator package;
  • track dynamically the energy-delay DAG performance against abrupt (possibly, unpredictable) changes of the simulated environment of Figure 1, like mobility-induced changes of the available up/down Cellular-WiFi bandwidths;
  • optimize the obtained DAG performance against a number of metrics, like total consumed energy, network consumed energy, network bandwidth, computing frequency, and execution delays, just to name a few.
On the basis of an overview of the related work available in the open literature (see the next Section 2), we anticipate that the major peculiar features of the proposed VirtFogSim toolbox are the following ones:
  • it allows the numerical evaluation of the delay-constrained minimization of the overall computing-plus-network energy consumed by the execution of the input DAG. The optimization is performed by task offloading and allocation of the per-core computing frequencies and up/down Cellular-WiFi bandwidths of the platform of Figure 1 in a joint and adaptive way;
  • resource allocation is performed by explicitly accounting for the container-based virtualized nature of the reference platform of Figure 1. For this purpose, the VirtFogSim toolbox relies on a gradient-based primal-dual iterative procedure that implements a set of ad-hoc designed adaptive (e.g., time-varying) step-sizes: The goal is to speed up the convergence to the corresponding steady-states of the per-core computing frequencies and per-connection bandwidths to be dynamically allocated;
  • it allows the user to test the energy-delay performances of six different task allocation strategies, namely the Genetic, Only-Mobile, Only-Fog, Only-Cloud, Only-Task Allocation, and Exhaustive-Search strategies (see Section 4), and to add new user-defined strategies;
  • the code of the core engine of the simulator leverages the Parallel Toolbox of MATLAB, in order to exploit automatically the multi-core capability possibly retained by the execution environment of the simulator.
Furthermore, regarding the consideration of the formats of rendering data supported by the proposed VirtFogSim toolbox, we point out that it is equipped with a GUI that allows:
  • the display of the dynamic time behavior of the performed resource allocation under the time-varying simulation environment set by the user and;
  • the rendering of the data output by the simulator in tabular, bar-plot, and colored map graph formats (see Section 5).
Finally, a last contribution of the paper concerns the actual test of the numerical and scalability capabilities of the proposed VirtFogSim toolbox. In this regard, we point out that:
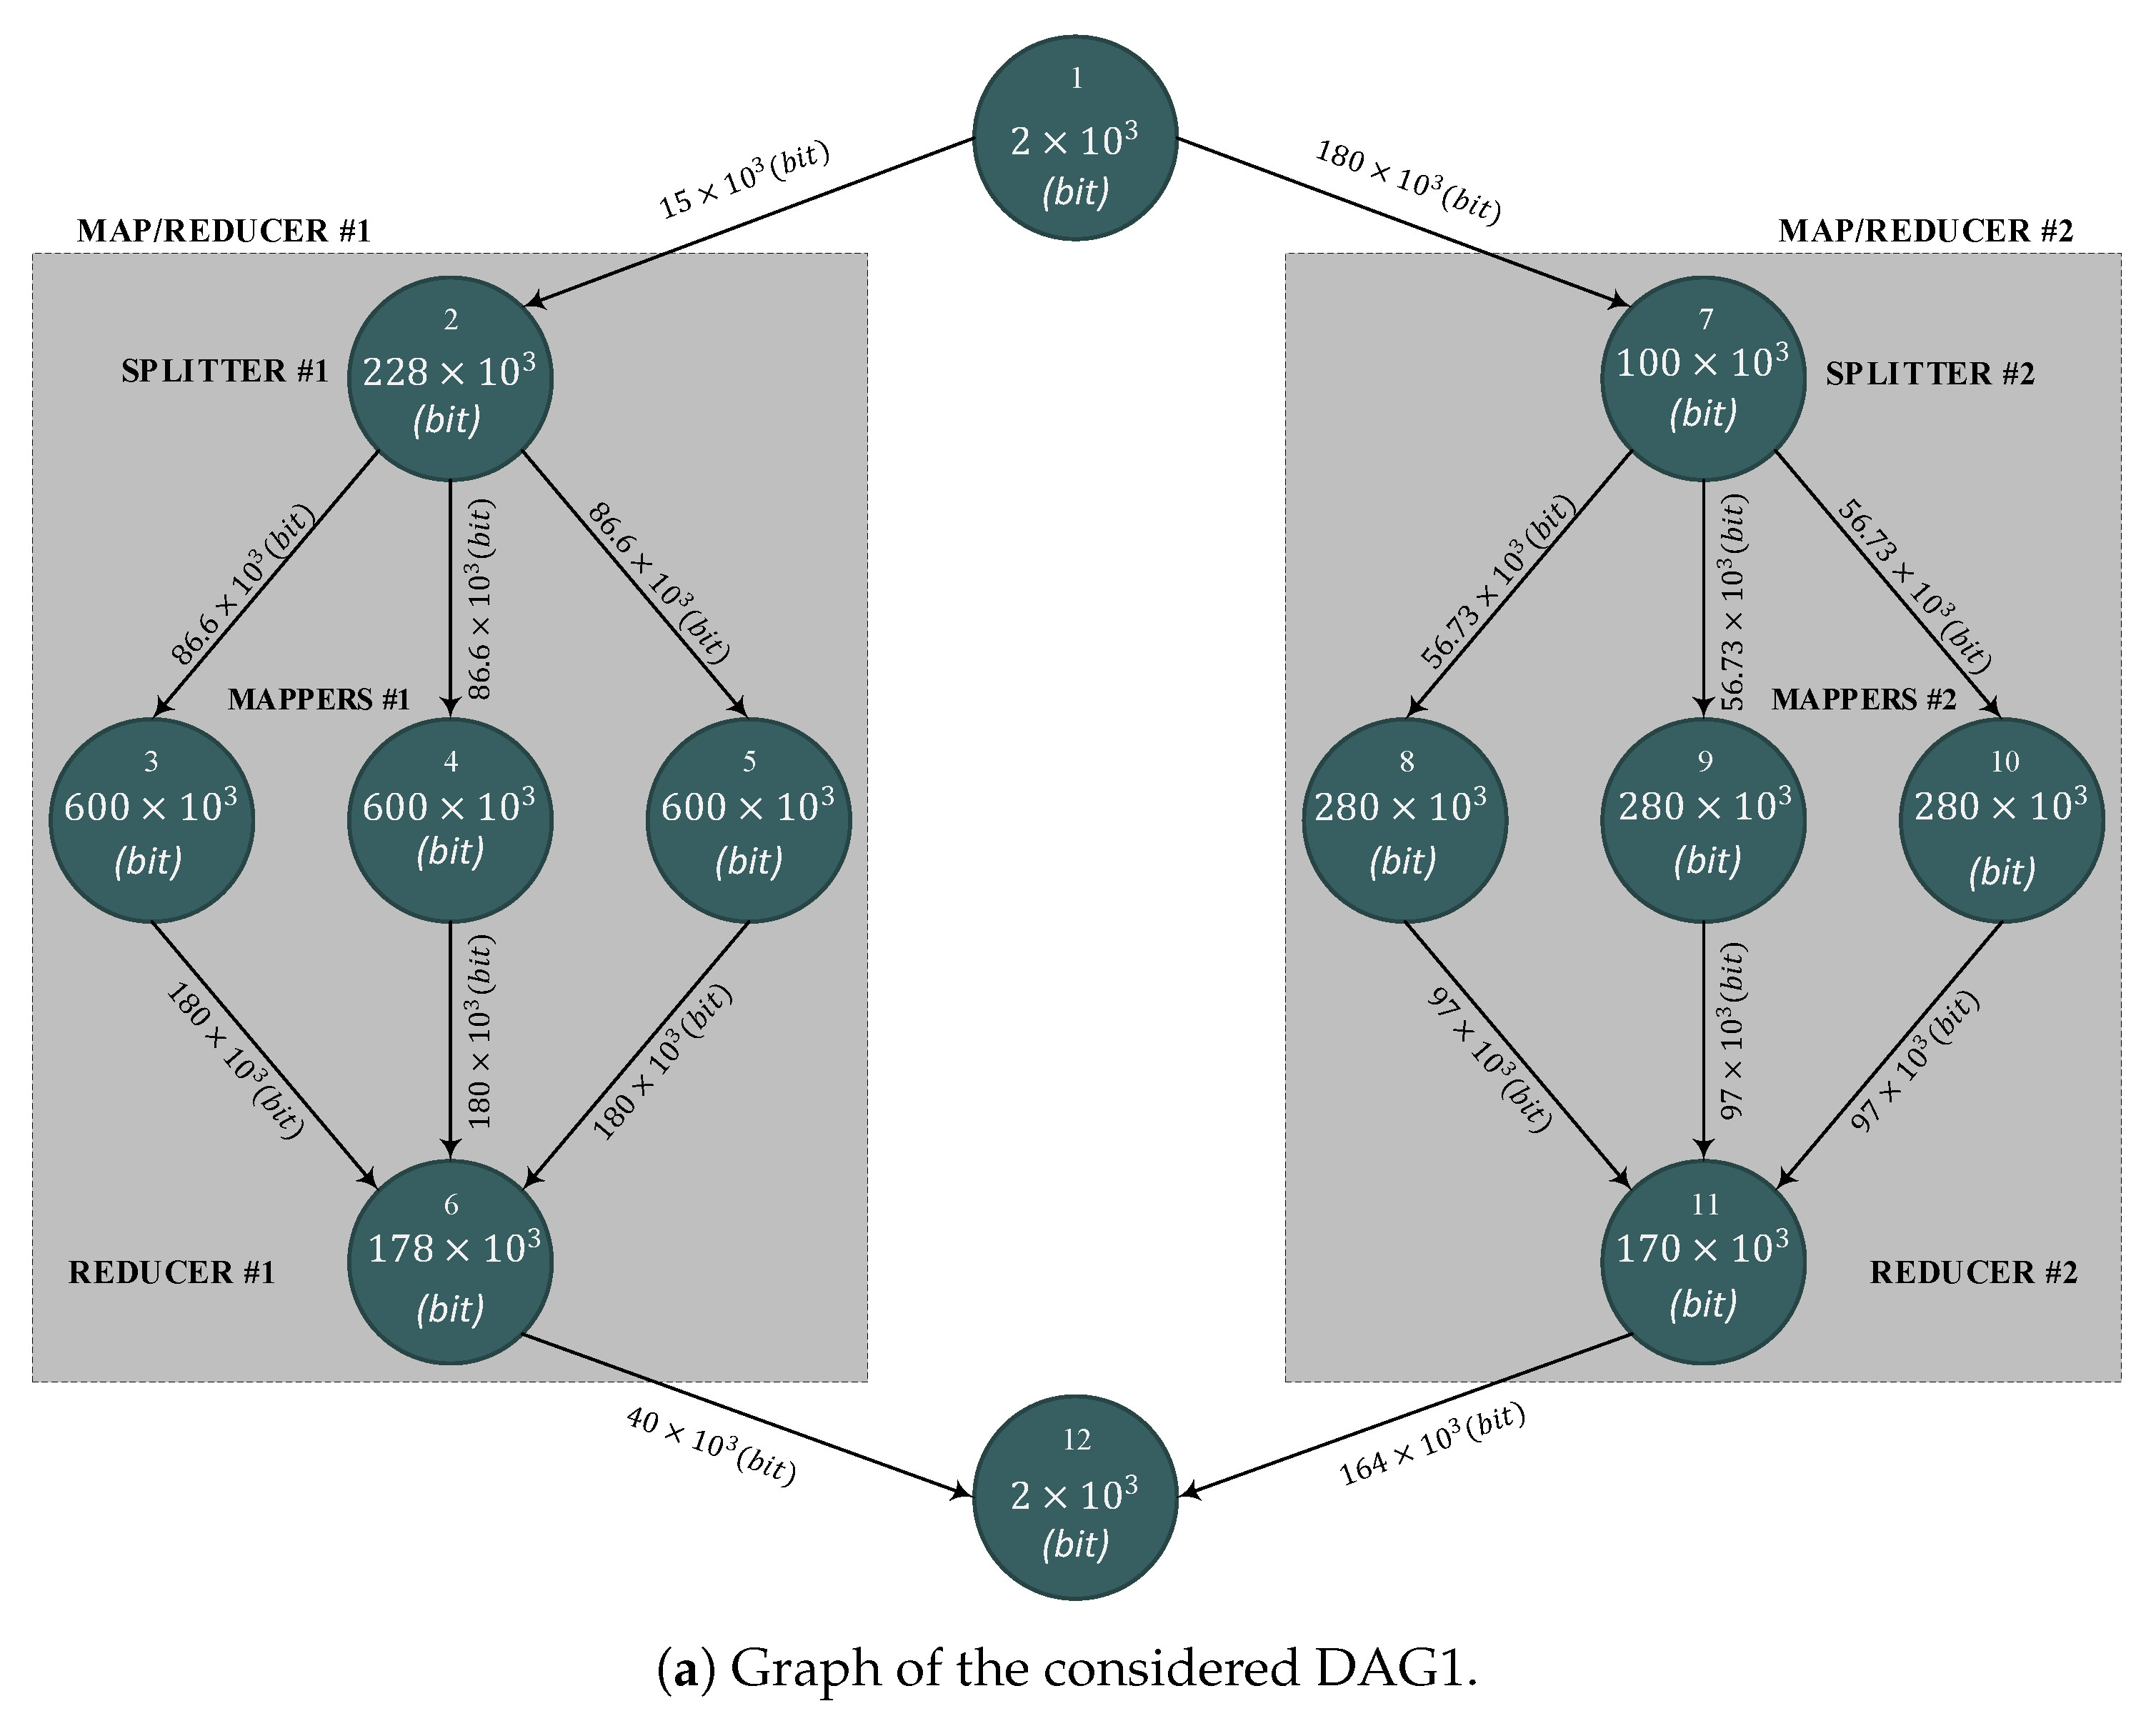
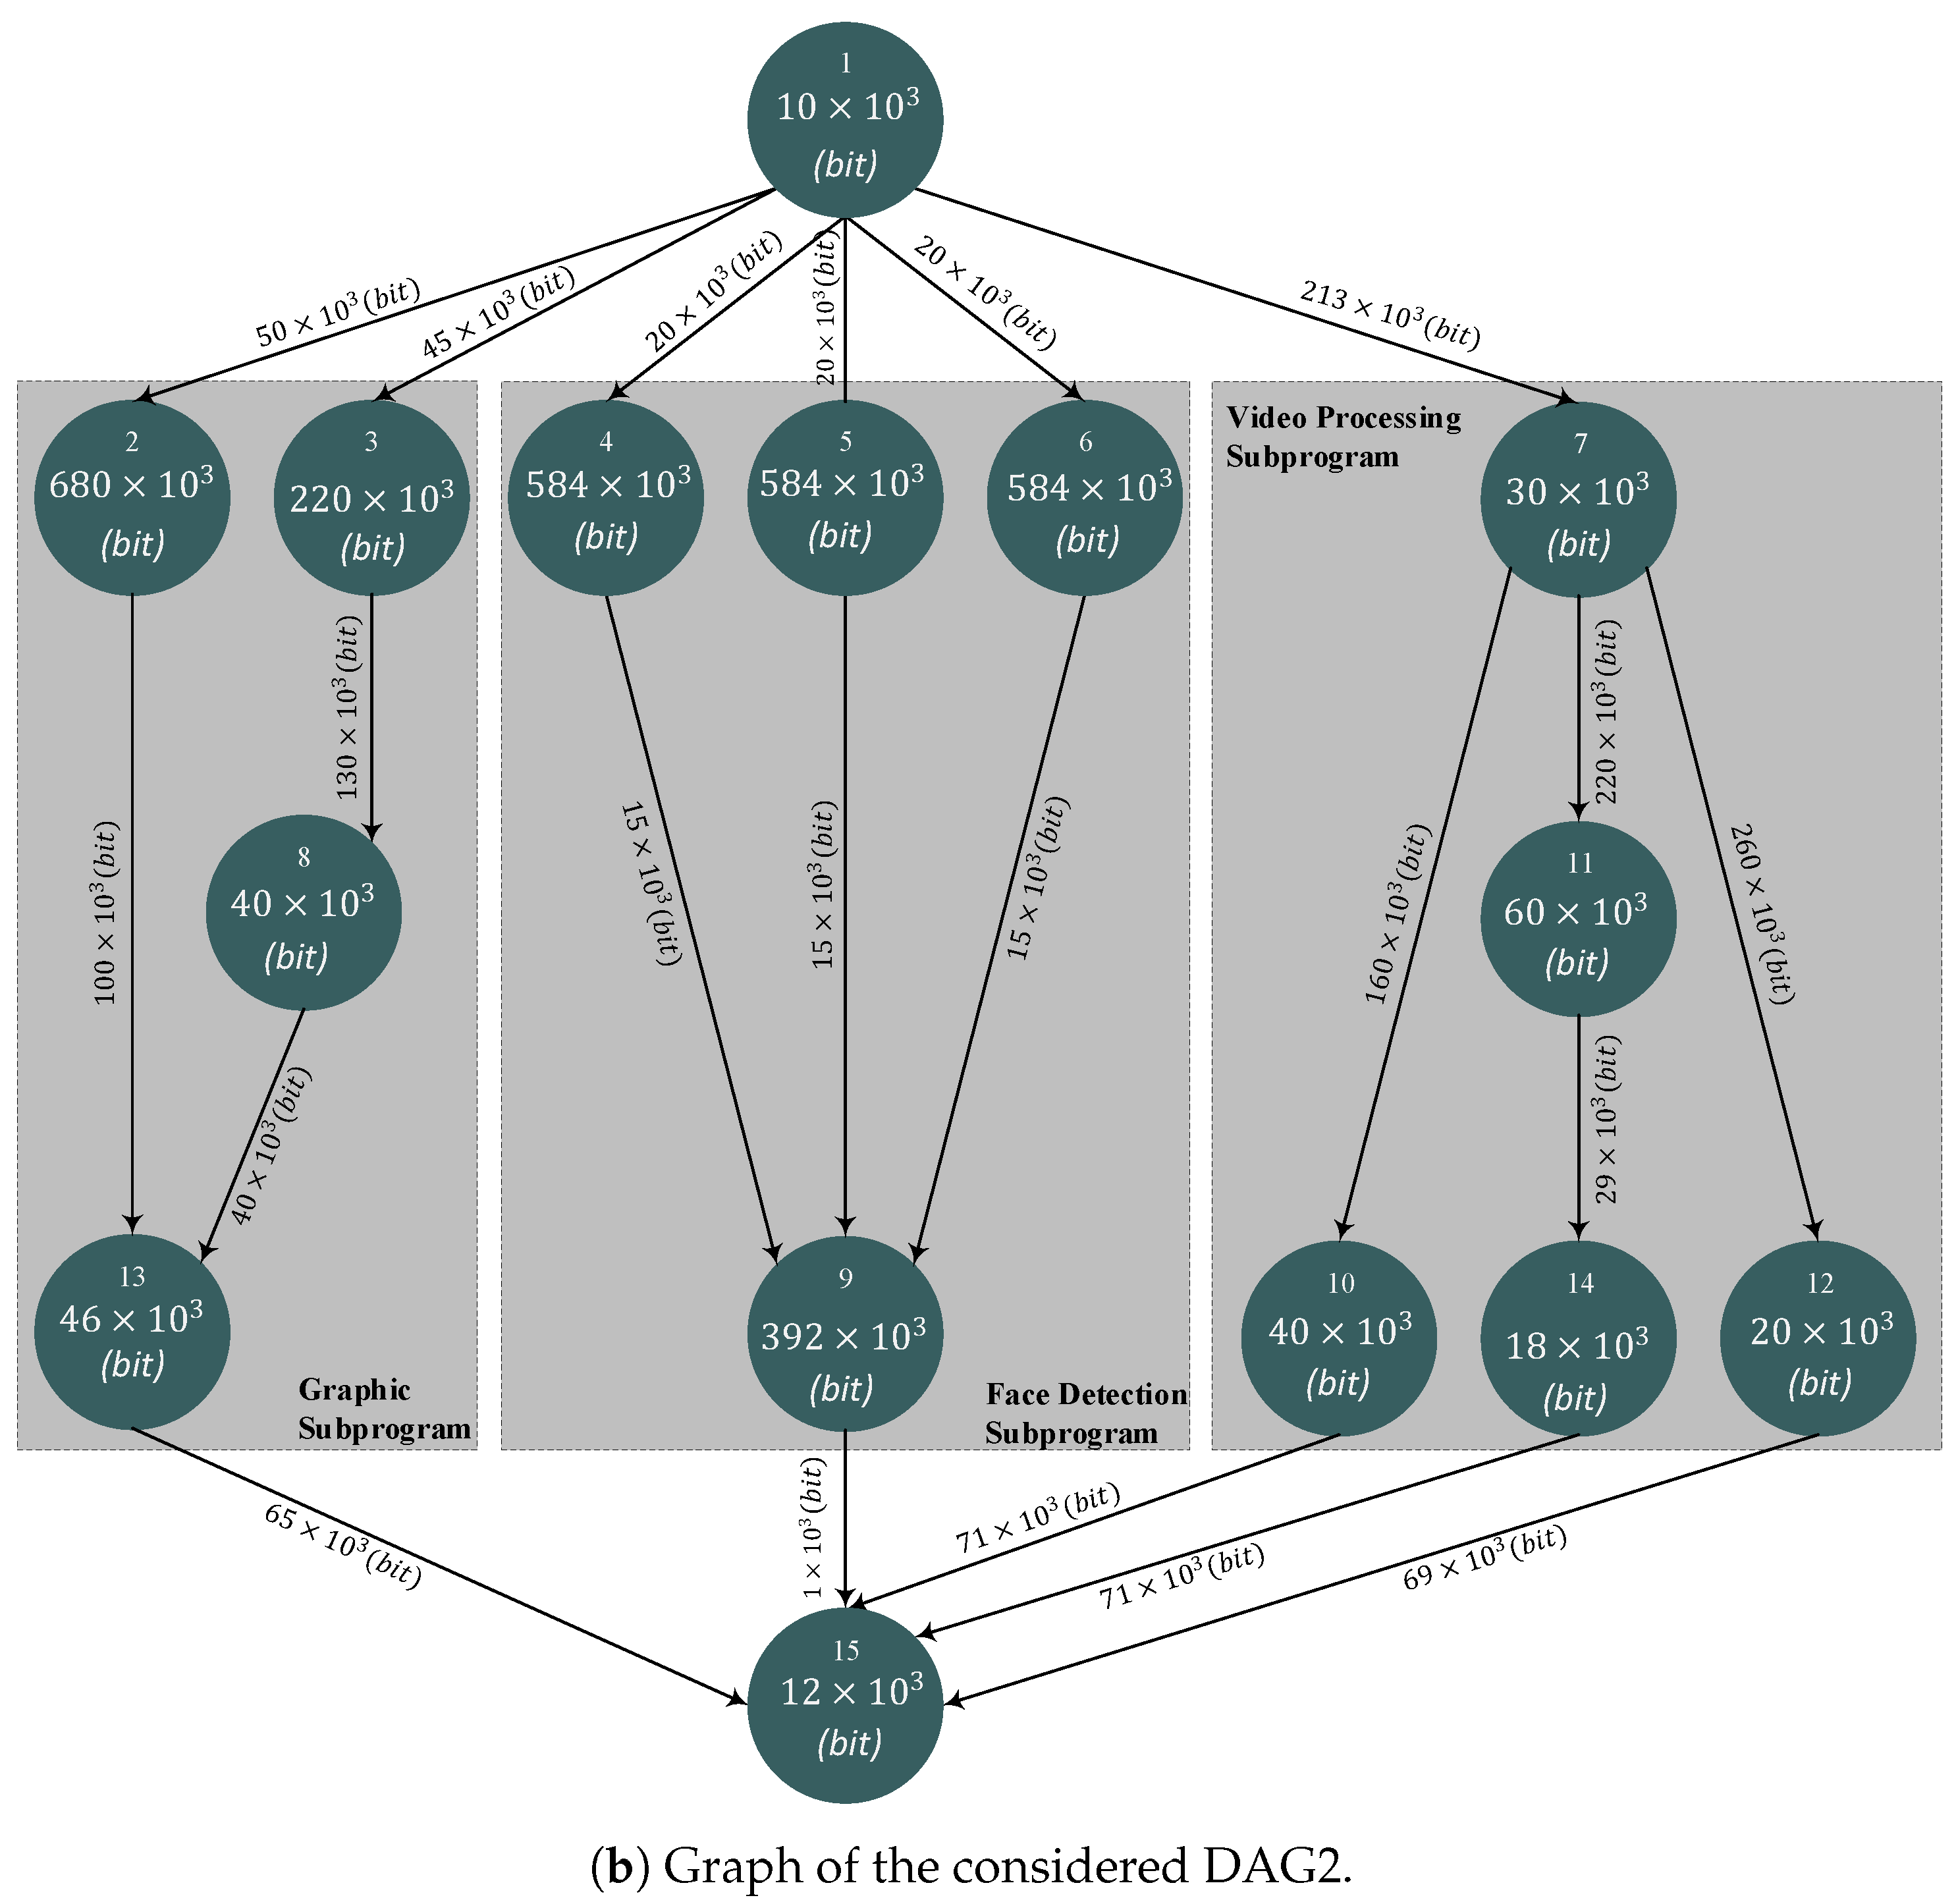
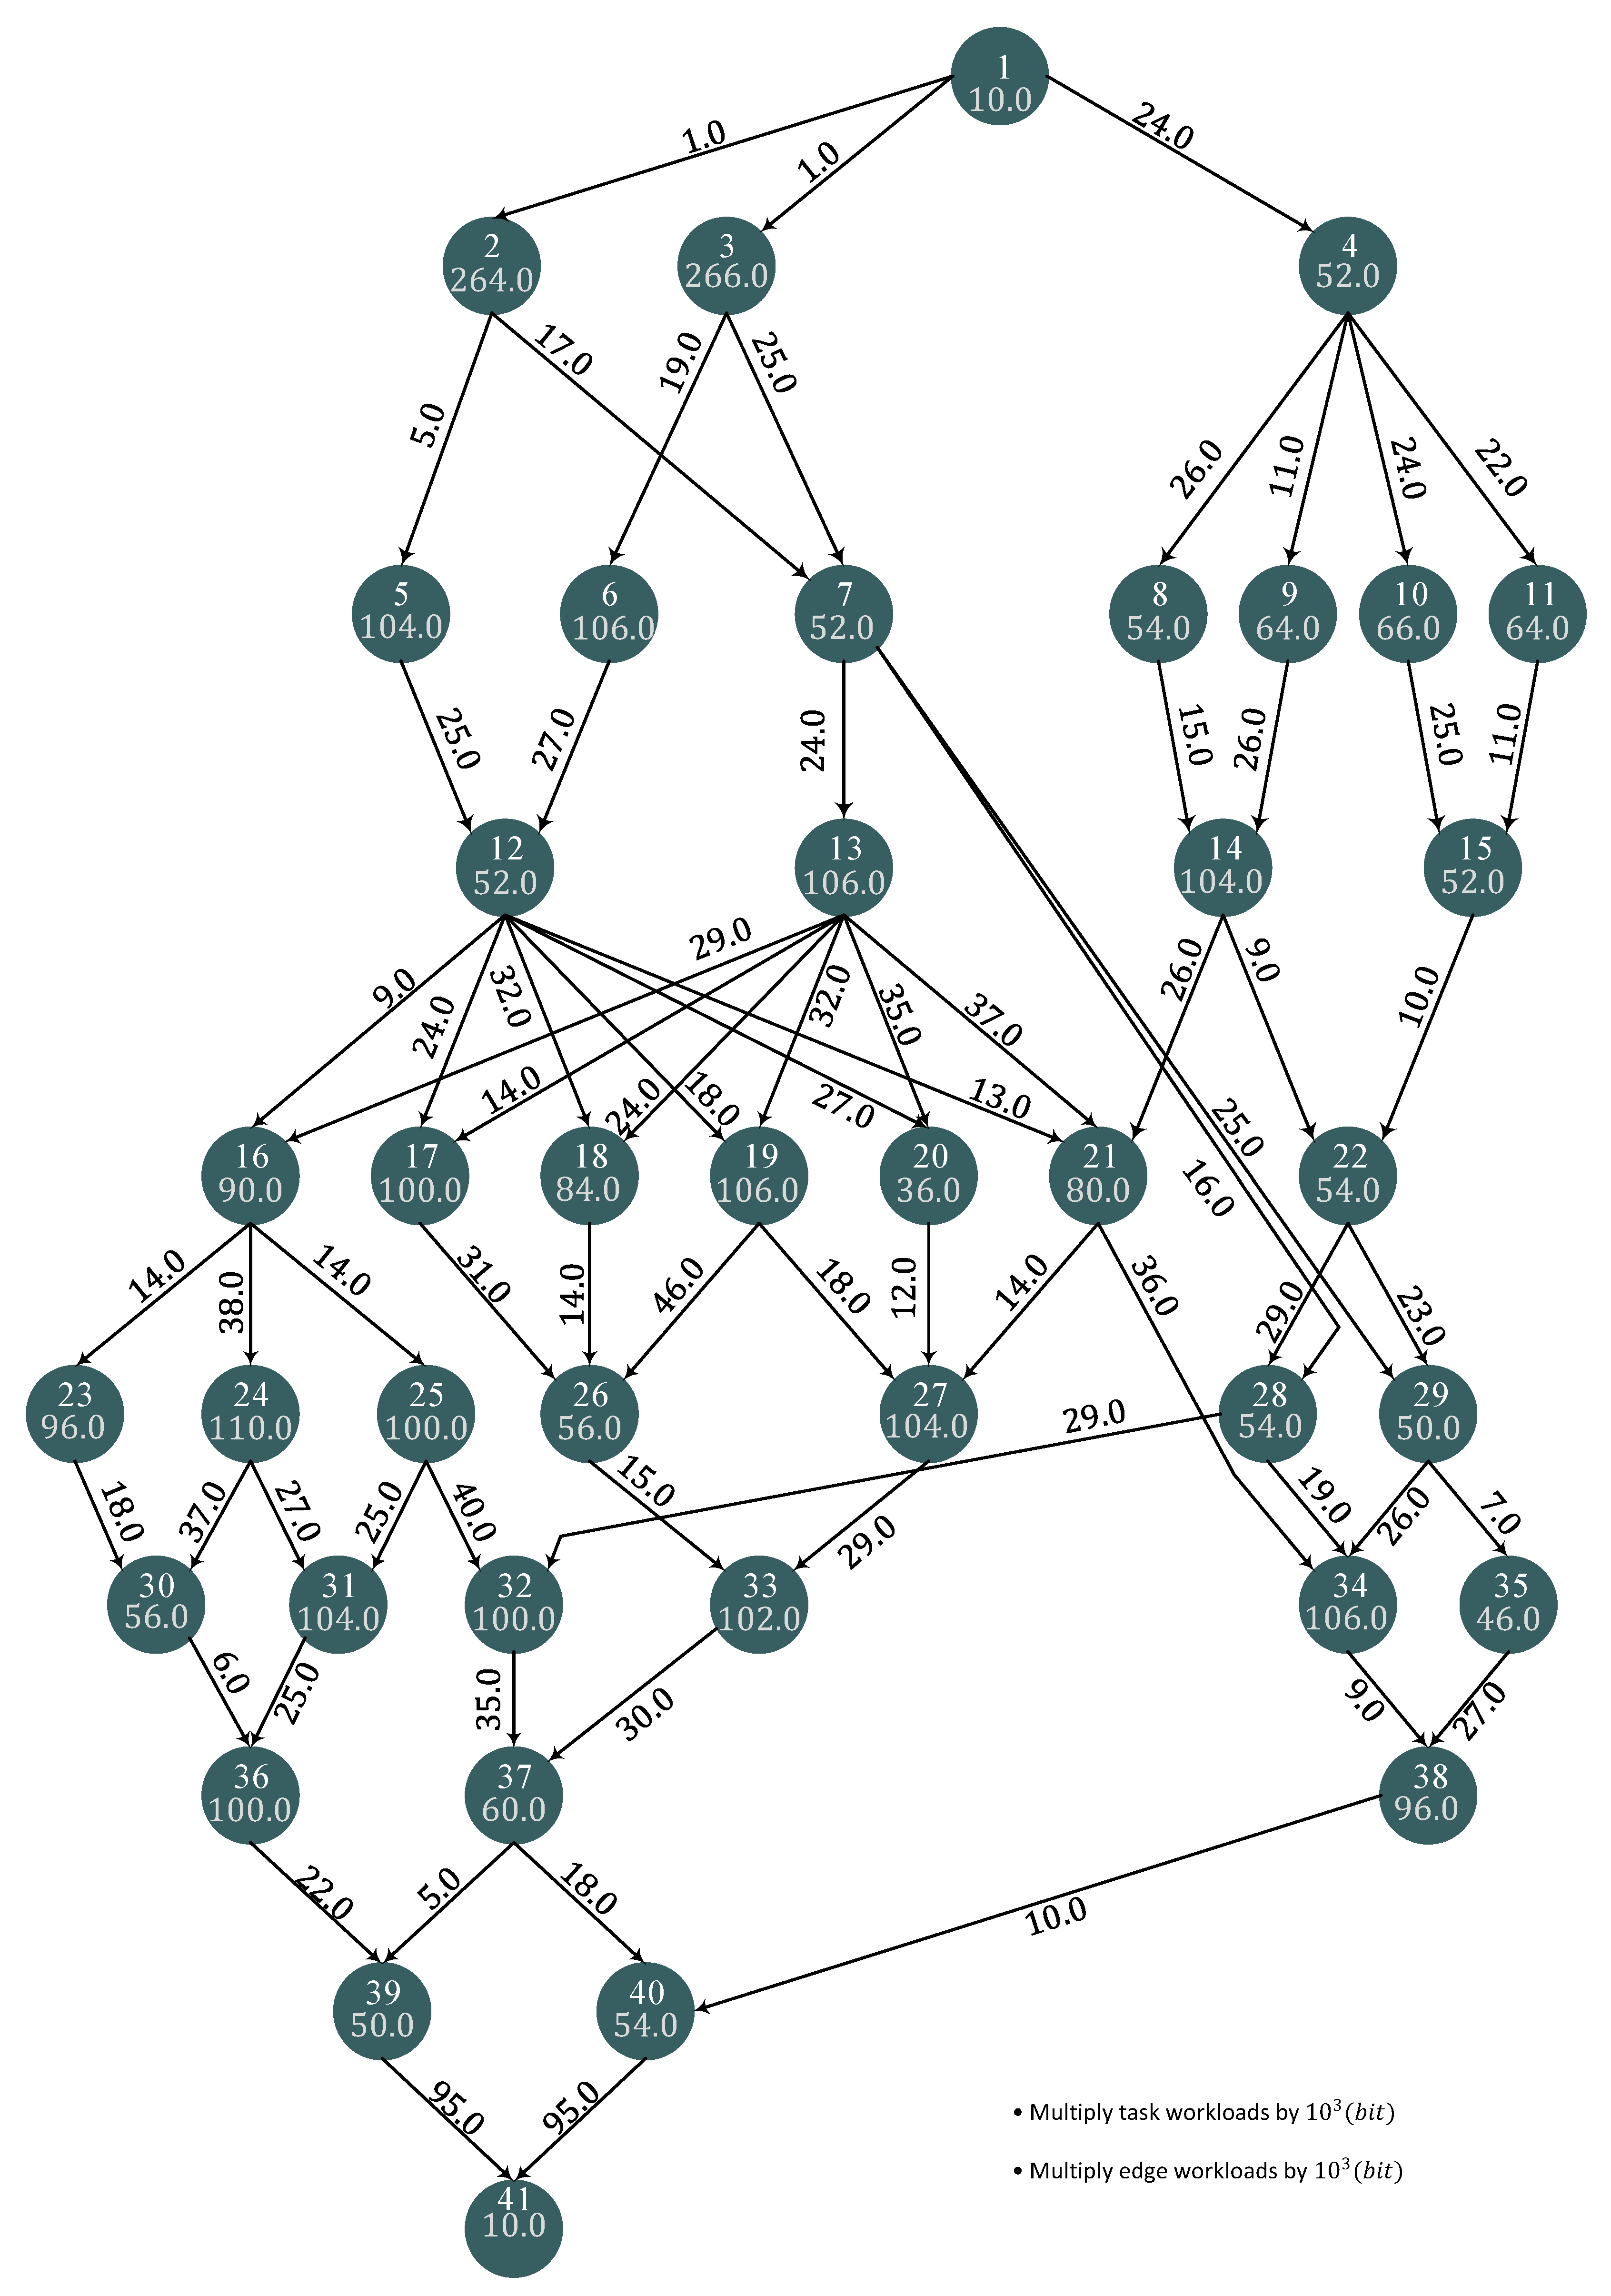
  • the adaptive capability and the energy-delay performance of the (aforementioned) six task allocation strategies have been checked and compared under three benchmark DAGs. They refer to different use cases featuring some computing, multimedia, and scientific applications of practical interest and exhibit different symmetric/asymmetric/pseudo-random topologies of various sizes and in/out node degrees;
  • the scaling capability of the simulator has been numerically profiled in terms of both simulation times and volumes of data that are exchanged among the running cores.
The rest of this contribution is organized as follows. After reviewing in Section 2 the related work on the current software tools for the simulation of Fog-Cloud computing platforms, in Section 3, we present the formal models describing the simulated technological platform of Figure 1. Section 4 is devoted to an in-depth description of the task offloading and dynamic resource allocation strategies supported by the current Version 4.0 of the VirtFogSim toolbox, as well as their implementation on multi-core parallel hardware execution platforms. Afterward, Section 5 describes the associated graphic formats for the display of the rendered data. Section 6 focuses on: (i) checking the numerical capability of VirtFogSim; and (ii) testing the scalability of the simulator in terms of both simulation time and memory consumption on multi-core parallel hardware execution platforms. Some hints for possible future developments and the availability of the VirtFogSim package are reported in the conclusive Section 7 and Section 8. The reader may refer to Appendix A for the presentation of the dual-mode user interfaces of the VirtFogSim toolbox and to the final Appendix B for the full list of the (settable) input parameters of the VirtFogSim simulator and the corresponding meaning, roles, and measuring units.

2. Related Work

The development of simulation tools for Fog computing is still in its infancy. Roughly speaking, the major part of the current contributions constitute the follow up of some (quite recent) toolkits designed for the simulation of the (somewhat more consolidated) environment of Cloud computing and, then, account for a limited number of specific aspects of the Fog computing paradigm. Under this perspective, an overview of the current open literature leads to the conclusion that the development of simulation tools for Cloud-Fog computing platforms has proceeded along three main research lines.
The first (somewhat more traditional) research line leads to the development of toolboxes for the software simulation of networked large-scale Cloud data centers [8,9,10].
In this regard, CloudSim [8] is a broad simulation toolkit that allows modeling and simulation of applications on a remote Cloud platform according to the Infrastructure-as-a-Service provisioning model. It allows the user to setup a customized modeling of the major building blocks of conventional Cloud infrastructures, like Virtual Machines (VMs), resource provisioning policies, resource consolidation policies, and VM migration policies. As a consequence, at the present time, CloudSim seems to be the most popular simulator for Cloud computing scenarios. However, although the Fog and Cloud computing paradigms share some virtualization features that, in principle, enable the re-use of some Cloud solutions even for Fog computing (see Table 1), the Fog environment mainly targets the support of delay-sensitive (possibly mobile) applications. From this point of view, the CloudSim toolkit presents three main deficiencies. First, it does not allow the customized setup of network-related parameters, like the per-link wireless access bandwidths and the round-trip-times of Transport-layer TCP/IP connections. Second, it relies on VM-based virtualization and does not allow the modeling of emerging CNT-based virtualization. Third, the implemented resource allocation policies are of the static-type, and no support for dynamic resource tracking is provided.
GreenCloud [9] is a follow up of the NS2 network simulator. Its main focus is on the modeling and simulation of the energy profiles of some main computing and network components of the Cloud ecosystem. Being an extension of the NS2 toolkit, GreenCloud allows the customized setting and simulation of the full TCP/IP protocol stacks equipping the switches of the intra-cloud network. However, it does not account for the Mobile-to-Cloud wireless access links and does not allow the characterization of the submitted application as DAGs.
The main goal of iCanCloud [10] is the simulation of Cloud-supported large ecosystems with thousands of served devices through a suitable extension of the native OMNeT++ platform. Hence, scalability being the main concern of this toolkit, it does not support dynamic resource tracking and per-device performance optimization.
A second more recent research line attempts to address the (aforementioned) deficiencies of Cloud-oriented toolkits by explicitly accounting for the specific features of real Fog platforms for the support of IoT-based sensor applications [11,12,13].
Under this perspective, SimIOT [11] equips the (previously-developed) SimIC [14] simulator by including a bottom IoT layer, in order to allow the user to model the request of Cloud resources of a settable number of sensor/actuator devices. This is obtained by including a communication broker module atop the native SimIC platform, in order to gather the sensed data and redirect them to the SimIC Cloud agents. As a consequence, SimIOT explicitly lacks support of an intermediate Fog layer.
IOTSim [12] is implemented as an extension of (aforementioned) CloudSim. It is targeted to the simulation of Fog computing environments in which sensor-acquired big data streams have to be quickly processed. For this purpose, the IOTSim platform equips the native CloudSim architecture with a storage layer and, then, provides the software primitives for the simulation and storage-induced delays. However, the core processing engine supported by the current IOTSim release is MapReduce-compliant, so that it implements batch processing models for the support of delay-tolerant big data applications.
iFogSim [13] is another toolbox whose implementation is an extension of CloudSim. It aims to simulate IoT-based Fog platforms by providing: (i) suitable software Java-based primitives for modeling the energy-delay performances of sensors, actuators, Fog, and Cloud nodes; (ii) two service models, e.g., the Sense-Process-Actuate and the Stream processing services; and (iii) two heuristic task allocation policies, namely the All-Cloud and Edge -ward task placement policies. However, in the current release of iFogSim, we have that: (i) all the supported devices’ profiling facilities and task allocation policies are inherently static; (ii) the network delays are assumed fixed; and (iii) support for the dynamic allocation and/or tracking of network bandwidths and computing frequencies is not provided.
Very recently, a third research line focused on the development of the software toolkit EdgeCloudSim [15], for the simulation and performance evaluation of general multi-tiered Cloud-Fog computing platforms. The main feature of EdgeCloudSim is the provisioning of a software environment for the setting and dynamic simulation of the profiles of WLAN/WAN networks, wireless network traffic, device mobility, Fog nodes, and Cloud nodes. For this purpose, EdgeCloudSim: (i) provides a customizable edge orchestration module for the performance evaluation of different task placement policies under different time scales; (ii) implements a customizable load generator that allows simulating the workload of the served mobile devices as streams of independent tasks with Poisson-distributed arrival times; and (iii) relies on the CloudSim support for the creation/management/migration/shut-down of VMs. Hence, like the proposed VirtFogSim, EdgeCloudSim aims at simulating the performance of multi-tiered networked Fog-Cloud platforms for the support of time-critical tasks. However, unlike VirtFogSim, EdgeCloudSim: (i) does not support the utilization of application DAGs and, then, does not allow the characterization of the inter-task dependency; (ii) being VM-oriented, does not support the characterization of container-based virtualization; (iii) does not provide software primitives for the tracking of the allocated network/computing resources; and (iv) being mainly focused on the delay-performance of the simulated platform, does not provide support for the modeling of the power/energy profiles of the Mobile, Fog, and Cloud nodes.

3. VirtFogSim: A View of the Simulated Formal Models

In this section, the basic definitions and formal assumptions about the constrained optimization problem tackled by the VirtFogSim engine are briefly explained. The reference framework is that already reported in Figure 1.

3.1. Profiling the Simulated Workflows

By definition, a task allocation vector:
x = def x 1 1 , x 2 , , x V 1 , x V 1 ,
is a dimensionless 1 × V ternary vector, whose components are defined as follows:
x i = def 0 , if the i th task is executed at the Fog clone , 1 , if the i th task is executed at the Mobile Device , i = 1 , , V . 2 , if the i th task is executed at the Cloud clone ,
By design, the first and last tasks are always executed at the Mobile device, and therefore, x 1 x V 1 (see Equation (1)). Hence, the size of the set of the admissible task allocation vectors is 3 V 2 .
By definition, a resource allocation vector:
R S = def f M , f F , f C , R U , R D , B U , B D bit / s ,
is a 1 × 7 non-negative row vector whose components are measured in bit/s. It reports the values assumed by (see Figure 1) in the order:
  • the processing frequency f M at the Mobile device;
  • the processing frequency f F at the Fog clone;
  • the processing frequency f C at the Cloud clone;
  • the throughput R U of the Mobile-to-Fog TCP/IP connection;
  • the throughput R D of the Fog-to-Mobile TCP/IP connection;
  • the throughput B U of the Mobile-to-Cloud TCP/IP connection;
  • the throughput B D of the Cloud-to-Mobile TCP/IP connection.

3.2. The Considered Throughput-Constrained Joint Task and Dynamic Resource Allocation Problem

In this section, we give a glimpse of the constrained optimization problem whose solution is numerically evaluated by VirtFogSim. For this purpose, let E M , E F , and E C (Joule) be the computing energies consumed by the Mobile device, Fog clone, and Cloud clone of Figure 1 in order to process the assigned tasks of the considered application DAG. Furthermore, let E W i F i , E C E L L , and E W D (Joule) be the energies consumed by the Mobile-Fog, Mobile-Cloud, and Cloud-Fog two-way TCP/IP connections, in order to transport the inter-task data among the Mobile, Cloud, and Fog computing nodes. Finally, let:
E T O T = def ϑ M × E M + ϑ F × E F + ϑ C × E C + E W i F i + E C E L L + E W D Joule ,
be the resulting computing-plus-communication total consumed energy, with ϑ M , ϑ F , and ϑ C being binary 0 , 1 -valued constants.
Hence, the considered Joint Optimization Problem (JOP) is defined as follows:
min R S , x E T O T , s . t . :
1 / T D A G T H 0 M I N ,
0 f M f M M A X ,
0 f F f F M A X ,
0 f C f C M A X ,
0 R U R U M A X ,
0 R D R D M A X ,
0 B U B U M A X ,
0 B D B D M A X ,
x 1 = x V = 1 ,
x i 0 , 1 , 2 , i = 2 , , V 1 .
In the above equations, we have that:
  • R S is the resource allocation vector defined in Equation (2);
  • x is the task allocation vector defined in Equation (1);
  • T D A G (s) is the overall time needed to execute the assigned application DAG, in short, the DAG execution time. It generally depends on the optimization variables R S and x ;
  • T H 0 M I N (app/s) is the required minimum application throughput, i.e., the minimum number of application DAGs to be performed in the time interval of one second. It is a non-negative real number;
  • Equations (4c)–(4g) account for the maximum available resources;
  • Equations (4j)–(4k) account for the ternary nature of the considered task allocation vectors.
The considered JOP is solved in VirtFogSim by the RAP_p function described in Section 4.2. Before proceeding, four main remarks about the formulated JOP are in order.
First, it aims to jointly optimize the allocation of the tasks over the Mobile, Fog, and Cloud computing nodes of Figure 1 and the corresponding computing-plus-communication resources. Formally speaking, it is a mixed-integer non-convex optimization problem, that resists closed-form solution. In the sequel, we will denote as: R S and x the solution of the constrained JOP in Equations (4a)–(4k).
Second, for positive T H 0 M I N , the constraint in Equation (4b) enforces a hard (e.g., deterministic) QoS constraint on the minimum desired application throughput. As a consequence, too many larger values of T H 0 M I N may give rise to infeasible JOP.
Third, the actual values of the binary constants: ϑ M , ϑ F , and ϑ C depend on the application service model adopted by the Service Provider. Specifically, ϑ M and/or ϑ F and/or ϑ C are unit valued (resp., vanish) when the energies consumed by the Mobile, Fog, and Cloud computing nodes are for free (resp., are taxed).
Fourth, the summation of the first three terms in the objective function in (3) represents the consumed computing energy, i.e.,
E C M P = def ϑ M × E M + ϑ F × E F + ϑ C × E C Joule ,
while the summation of the remaining three terms is the corresponding wasted network energy E N E T , formally defined as follows:
E N E T = def E W i F i + E C E L L + E W D Joule .

3.3. Simulated Computing and Networking Energy Profiles

In this section, we (briefly) present the analytical expressions of the computing and network energies involving the objective function in (4a), together with the corresponding analytical expression of the (constrained) T D A G in (4b). The goal is to allow the VirtFogSim user to acquire basic insight about the roles played and the possible impacts of the input parameters in Table A2 of the simulator on the resulting solution R S , x of the underlying JOP in Equations (4a)–(4k). In this regard, four introductory remarks are in order.
First, since the Mobile device of Figure 1 may both upload to and download from the connected Fog an Cloud clones, the previously-defined network energies: E W i F i and E C E L L split in the summation of the corresponding up and down network energies plus the underlying idle energies, so that we can write:
E W i F i = E W i F i ( I D L E ) + E W i F i U + E W i F i D Joule ,
and:
E C E L L = E C E L L ( I D L E ) + E C E L L U + E C E L L D Joule .
Second, in the considered framework of Figure 1, the Fog-Cloud (typically wired) backhaul is assumed sustained by a two-way TCP/IP transport connection that operates in the steady-state. Hence, according to the seminal analysis reported for example in [16], the corresponding transport throughput R 0 may be directly evaluated as in:
R 0 = 1.22 × M S S R T T W D × P r o b L O S S bit / s ,
where (see Figure 1): (i) M S S (bit) is the maximum size of a TCP segment; (ii) R T T W D (s) is the steady-state Round-Trip-Time of the two-way Fog-Cloud TCP/IP connection; and (iii) P r o b L O S S is the associated steady-state segment loss probability.
Third, according to a number of both analytical and experimental models (see, for example, [17,18] and the references therein), the computing and network energy present in the objective function in Equations (4a)–(4k) is the summation of static energy and dynamic energy. Specifically, we note that:
  • the static energy accounts for the energy wasted by the device in the idle state (e.g., the device is turned ON, but it is not running). As a consequence, since the power consumed by the device in the idle state P I D L E (Watt) does not depend on the optimization variables, the static energy depends on the optimization variables R S and x only through the corresponding DAG execution time T D A G (s);
  • the dynamic energy accounts for the energy wasted by the device when it is in the running state. As a consequence, since the resulting dynamic power depends on the operating computing frequency or communication bit rate, the dynamic energy of each device depends on the optimization variables R S and x through both the DAG execution time T D A G (s) and the corresponding dynamic power P D Y N (Watt).
Fourth, a number of both analytical and experimental studies recently appeared in the open literature [18,19,20,21,22,23], supporting the conclusion that the dynamic power P D Y N y (Watt) consumed by a computing (resp., network) device operating at the computing frequency (resp., bit-rate) y may be accurately profiled by a power-like relationship, e.g., P D Y N = K y γ (Watt), where both the coefficient K and exponent γ depend on the specifically considered device and operating conditions. Hence, by definition, the corresponding dynamic energy P D Y N y (Joule) equates to:
E D Y N y = def P D Y N y / y = K y γ 1 Joule .
Therefore, after indicating by:
  • δ x Kronecker’s delta (e.g., δ x = 1 for x = 1 and δ x = 0 , otherwise); and by:
  • u 1 x the unit-step function (e.g., u 1 x = 1 for x > 0 and u 1 x = 0 , otherwise),
the above considerations lead to the following sum-power-like analytical models for the profiles of the (previously-introduced) computing energies:
E M = P C P U M ( I D L E ) n c M × T D A G × u 1 i = 1 V δ x i 1 + i = 1 V s i δ x i 1 K M 1 r M f M γ M 1 ,
E F = P C P U C ( I D L E ) n c C × T D A G × u 1 i = 1 V δ x i 2 + i = 1 V s i δ x i 2 K C 1 r C f C γ C 1 ,
E C = P C P U C ( I D L E ) n c C × T D A G × u 1 i = 1 V δ x i 2 + i = 1 V s i δ x i 2 K C 1 r C f C γ C 1 ,
where all the device-depending parameters: P C P U ( I D L E ) , n c , K, r, and γ involved in the above energy-profiling relationships are detailed in Table A2, together with their meaning/role and proper measuring units.
In order to introduce the energy profiles of the five up/down WiFi, up/down Cellular, and two-way backhaul connections referenced by Equations (7)–(9), let: V M F , V F M , V M C , V C M , and V F C indicate the volumes (in bit) of data transported (see Figure 1): (i) from Mobile to Fog; (ii) from Fog to Mobile; (iii) from Mobile to Cloud; (iv) from Cloud to Mobile; and (v) exchanged between Fog and Cloud, respectively. Hence, directly from the basic definitions of the adjacency (binary-valued) A a i j and (real-valued) D a d i j connection matrices, featuring the assigned DAG, as well as the task allocation vector x in Equation (1), these volumes may be formally expressed as:
V M F = 1 + N F ¯ W i F i i , j = 1 V a i j δ x i 1 δ x j d i j ,
V F M = 1 + N F ¯ W i F i i , j = 1 V a i j δ x i δ x j 1 d i j ,
V M C = 1 + N F ¯ C E L L i , j = 1 V a i j δ x i 1 δ x j 2 d i j ,
V C M = 1 + N F ¯ C E L L i , j = 1 V a i j δ x i 2 δ x j 1 d i j ,
V F C = 1 + N F ¯ W D i , j = 1 V a i j δ x i 2 δ x j + δ x i δ x j 2 d i j ,
where N F ¯ is the average number of failures of the considered connection [22,23] (see also Table A2) and V is the number of tasks of the considered DAG. Hence, the idle, up, and down energies of the WiFi and Cellular network connections in Equations (7) and (8) may be profiled as follows:
E W i F i ( I D L E ) = ϑ M + ϑ F × P W i F i M ( I D L E ) × T D A G × u 1 i = 1 V δ x i ,
E W i F i U = V M F × ϑ M Ω W i F i ( T X ) R U ξ W i F i ( T X ) 1 + ϑ F Ω W i F i ( R X ) R U ξ W i F i ( R X ) 1 ,
E W i F i D = V F M × ϑ M Ω W i F i ( R X ) R D ξ W i F i ( R X ) 1 + ϑ F Ω W i F i ( T X ) R D ξ W i F i ( T X ) 1 ,
and:
E C E L L ( I D L E ) = ϑ M + ϑ C × P C E L L M ( I D L E ) × T D A G × u 1 i = 1 V δ x i 2 ,
E C E L L U = V M C × ϑ M Ω C E L L ( T X ) B U ξ C E L L ( T X ) 1 + ϑ C Ω C E L L ( R X ) B U ξ C E L L ( R X ) 1 ,
E C E L L D = V C M × ϑ M Ω C E L L X ( R X ) B D ξ C E L L ( R X ) 1 + ϑ C Ω C E L L ( T X ) B D ξ C E L L ( T X ) 1 .
Finally, the energy consumed by the backhaul connection reads as:
E W D = ϑ C P E T H C ( I D L E ) + ϑ F P E T H F ( I D L E ) × T D A G × u 1 i , j = 1 V a i j δ x i δ x j 2 + δ x i 2 δ x j + V F C × P W D R 0 ,
where the corresponding wasted dynamic power P W D (Watt) is given by the product:
P W D = n o H O P × P H O P ,
of the number of hops n o H O P of the connection by the per-hop consumed power P H O P (Watt) (see Table A2).

3.4. Simulated Profiles of the per-DAG and per-Task Execution Times

The analytical expression assumed by T D A G in Equation (4b) depends on the vectors R S , x , as well as the adopted inter-node Task Scheduling and intra-node Task Service disciplines. The current implementation of VirtFogSim assumes that the adopted Task Scheduling discipline over the computing nodes and the adopted Task Service discipline at each computing node are both of the sequential type. They are, indeed, the Task Scheduling and Task Service disciplines currently adopted by a number of middleware software tools for the support of mobile computing, such as MAUI, Volare, Cuckoo, and CloneCloud (see, for example, [24,25] and the references therein for an overview of state-of-the-art middleware solutions for the support of computing-intensive smartphone-based applications).
As direct consequence, the following sum expression holds for the analytical profile of T D A G :
T D A G = i = 1 V δ x i 1 T M i + δ x i T F i + δ x i 2 T C i ,
where T M i , T F i , and T C i are the total execution times of the i th task of the considered DAG when it is executed at the Mobile, Fog, and Cloud node, respectively.
In this regard, two main remarks are in order. First, each total execution time T N i , N { M , F , C } , in Equation (17), is, by design, the summation of two terms. The first term is the computing time (e.g., the service time): T N S E R i , N { M , F , C } , wasted for the processing of the i th task at the computing node N, while the second term is the communication delay: T N N E T i , N { M , F , C } , induced by the transport from the other two computing nodes of the input data needed for the processing of the i th task at the computing node N. Second, when a set of tasks is processed by the same computing node, the resulting overall communication delay is, by design, zero [23,26,27].
Therefore, according to these two remarks, the following analytical expressions hold for the profiles of the per-node execution times in Equation (17):
T M i = T M S E R i + T M N E T i = j = 1 V s j δ x j 1 n M f M + 1 + N F ¯ W i F i j = 1 V a j i d j i δ x j R D + 1 + N F ¯ C E L L j = 1 V a j i d j i δ x j 2 B D ,
T F i = T F S E R i + T F N E T i = j = 1 V s j δ x j n F f F + 1 + N F ¯ W i F i j = 1 V a j i d j i δ x j 1 R U + j = 1 V a j i d j i δ x j 2 R 0 ,
T C i = T C S E R i + T C N E T i = j = 1 V s j δ x j 2 n C f C + 1 + N F ¯ C E L L j = 1 V a j i d j i δ x j 1 B U + j = 1 V a j i d j i δ x j R 0 ,
where i = 1 , , V and n M , n F , and n C are the number of cores equipping the Mobile, Fog, and Cloud nodes, respectively (see Table A2).

3.5. Simulated Adaptive Resource Allocation Framework

In this subsection, we briefly present the general analytical framework implemented by the RAP_p and FogTracker functions of Section 4.2 and Section 4.4, in order to perform the adaptive updating of the computing frequencies: f M , f F , f C , the wireless network bandwidths: R U , R D , B U , B D , and the Lagrange multiplier λ associated with the throughput constraint in Equation (4b). The final goal is to allow the user to acquire insights about the role played by the input step-size a M A X and related input step-size vector a M A X F T on the adaptive capability of the resource allocation engine implemented by VirtFogSim.
For this purpose, after indicating by L the Lagrangian function of the JOP of Equation (4), let: y { f M , f F , f C , R U , R D , B U , B D , λ } indicate a (scalar and non-negative) variable to be optimized, and let y M A X be its allowed maximum value. Furthermore, after denoting by t an integer-valued iteration index, let y L t be the derivative of the Lagrangian function L with respect to the considered optimization variable y at iteration t. Hence, according to the so-called primal-dual iteration-based approach recently customized in [28] for broadband networked application scenarios, the adaptive updating of y t + 1 reads as follows:
y t + 1 = max { 0 , min { y M A X , y t g y t y L t } } ,
where the outer max { . } (resp., the inner min { . } ) accounts for the non-negative (resp., maximum) value of y.
The peculiar feature of the updating relationship in (19) is that it resorts to a y-depending and time-varying gain function: g y t , in order to guarantee quick adaptation of the optimization variable y in response to abrupt changes of the wireless environment of Figure 1. On the basis of the general results of [28] about the convergence to the steady-state of the iterations in (19), we planned to implement in the current version of VirtFogSim the following time-varying gain formula:
g y t + 1 = max { a M A X , min { a M A X × y M A X , 1 2 y t 2 } } .
An examination of the above formula unveils the role played by the (positive) step-size a M A X , as well as its potential impact on the adaptive capability of the overall simulator. Specifically, on the basis of (20), we expect that large (resp., small) values of a M A X lead to quick (resp., slow) response to abrupt environmental changes, together with large (resp., small) possible oscillations in the steady-state. In this regard, we anticipate that the final goal of the FogTracker function of Section 4.4 is to guide the user towards the right trade-off among these two a M A X -depending contrasting behaviors.

4. VirtFogSim: Supported Task Allocation Strategies and Their Parallel Execution

The engine of the VirtFogSim simulator is built of a main core of eight software routines that implement a number of strategies (e.g., optimization policies), in order to check the feasibility and, then, solve numerically the constrained optimization problem in (4). MATLAB is the native environment under which the optimization routines are developed and run.
In this regard, it must be remarked that the VirtFogSim package is capable of automatically turning ON and exploiting the multi-core capability retained by the supporting hardware platform, in order to run parallel programming and, then, speed up the execution of the implemented task allocation policies. This is done in a fully-transparent way, e.g., without any direct user involvement. For this purpose, some instructions for parallel programming on multi-core hardware platforms specifically supported by the Parallel Toolbox of MATLAB are utilized by the VirtFogSim package. However, VirtFogSim is capable of automatically switching to the sequential execution mode when the underlying hardware platform is single-core or the MATLAB Parallel Toolbox is not installed.

4.1. General Architecture of the Developed Simulation Platform

The main functionalities of VirtFogSim are implemented by the functions listed in Table 2. In the sequel of the paper, these functions are briefly described. A deep explanation about the usage of such functions can be found in the VirtFogSim User Guide, which can be downloaded along with the software package (see Section 8). The main functions in Table 2 use some auxiliary functionalities implemented in the set of routines listed in Table 3.
Regarding the description of the general software architecture of the simulator, VirtFogSim acts as the main program that:
  • allows the user to setup 67 input parameters that characterize the scenario to be simulated by the user (see Figure 1);
  • calls the GeneticTA_par function for parallel execution and returns the corresponding:
    (a)
    x b e s t 0 , 1 , 2 V , i.e., ternary V-tuple best allocation vector;
    (b)
    R S b e s t = def f M , f F , f C , R U , R D , B U , B D (bit/s), i.e. the seven-tuple vector of the optimal resource allocation of the Mobile computing frequency, Fog computing frequency, Cloud computing frequency, Mobile-to-Fog transport throughput, Fog-to-Mobile transport throughput, Mobile-to-Cloud transport throughput, and Cloud-to-Mobile transport throughput (see Figure 1);
    (c)
    E b e s t (Joule), i.e., the total computing-plus-network energy consumed by the infrastructure of Figure 1 under the returned x b e s t task allocation vector. For this purpose, the GeneticTA function calls, in turn, the auxiliary functions RAP, Crossover, and Mutation;
  • optionally, calls the OM_S function and returns:
    (a)
    R S O M = def f M , f F , f C , R U , R D , B U , B D (bit/s), i.e., the seven-tuple vector of the optimal resource allocation under the 1 × V All-Mobile task allocation vector: x O M = def 1 , 1 , , 1 , 1 ;
    (b)
    E O M (Joule), i.e., the total computing-plus-network energy consumed by the infrastructure of Figure 1 under x O M . If the returned E O M is infinite, then the All-Mobile task allocation x O M is infeasible. The OM_S function calls, in turn, the RAP function;
  • optionally, calls the OF_S function and returns:
    (a)
    R S O F = def f M , f F , f C , R U , R D , B U , B D (bit/s), i.e., the seven-tuple vector of the optimal resource allocation under the 1 × V All-Fog task allocation vector: x O F = def 1 , 0 , , 0 , 1 ;
    (b)
    E O F (Joule), i.e., the total computing-plus-network energy consumed by the infrastructure of Figure 1 under x O F . If the returned E O F is infinite, then the All-Fog task allocation x O F is infeasible. The OF_S function calls, in turn, the RAP function;
  • optionally, calls the OC_S function and returns:
    (a)
    R S O C = def f M , f F , f C , R U , R D , B U , B D (bit/s), i.e., the seven-tuple vector of the optimal resource allocation under the 1 × V All-Cloud task allocation vector: x O C = def 1 , 2 , , 2 , 1 ;
    (b)
    E O C (Joule), i.e., the total computing-plus-network energy consumed by the infrastructure of Figure 1 under x O C . If the returned E O C is infinite, then, the All-Cloud task allocation x O C is infeasible. The OC_S function calls, in turn, the RAP function;
  • optionally, calls the O_TAS_par function for parallel execution and returns:
    (a)
    x O T A S 0 , 1 , 2 V , i.e., the ternary V-tuple best allocation vector computed by O_TAS under the assumption that the optimization of the resource allocation is not performed;
    (a)
    E O T A S (Joule), i.e., the total computing-plus-network energy consumed by the infrastructure of Figure 1 under x O T A S . If the returned E O T A S is infinite, then the O_TAS task allocation x O T A S is infeasible. The O_TAS function calls, in turn, the Crossover, Mutation, and evaluatestaticenergy_p functions;
  • optionally, calls the ES_S_par function and returns:
    (a)
    x E S S 0 , 1 , 2 V , i.e., the ternary V-tuple best task allocation vector computed by performing the exhaustive search over the full population of task allocation vectors of the size 3 V 2 ;
    (b)
    R S E S S = def f M , f F , f C , R U , R D , B U , B D (bit/s), i.e., the seven-tuple vector of the optimal resource allocation under x E S S ;
    (c)
    E E S S (Joule), i.e., the total computing-plus-network energy consumed by the infrastructure of Figure 1 under x E S S . If the returned E E S S is infinite, then the overall afforded optimization problem is infeasible. The ES_S function calls, in turn, the RAP function and requires that the task allocation vectors x b e s t and x O T A S are already available;
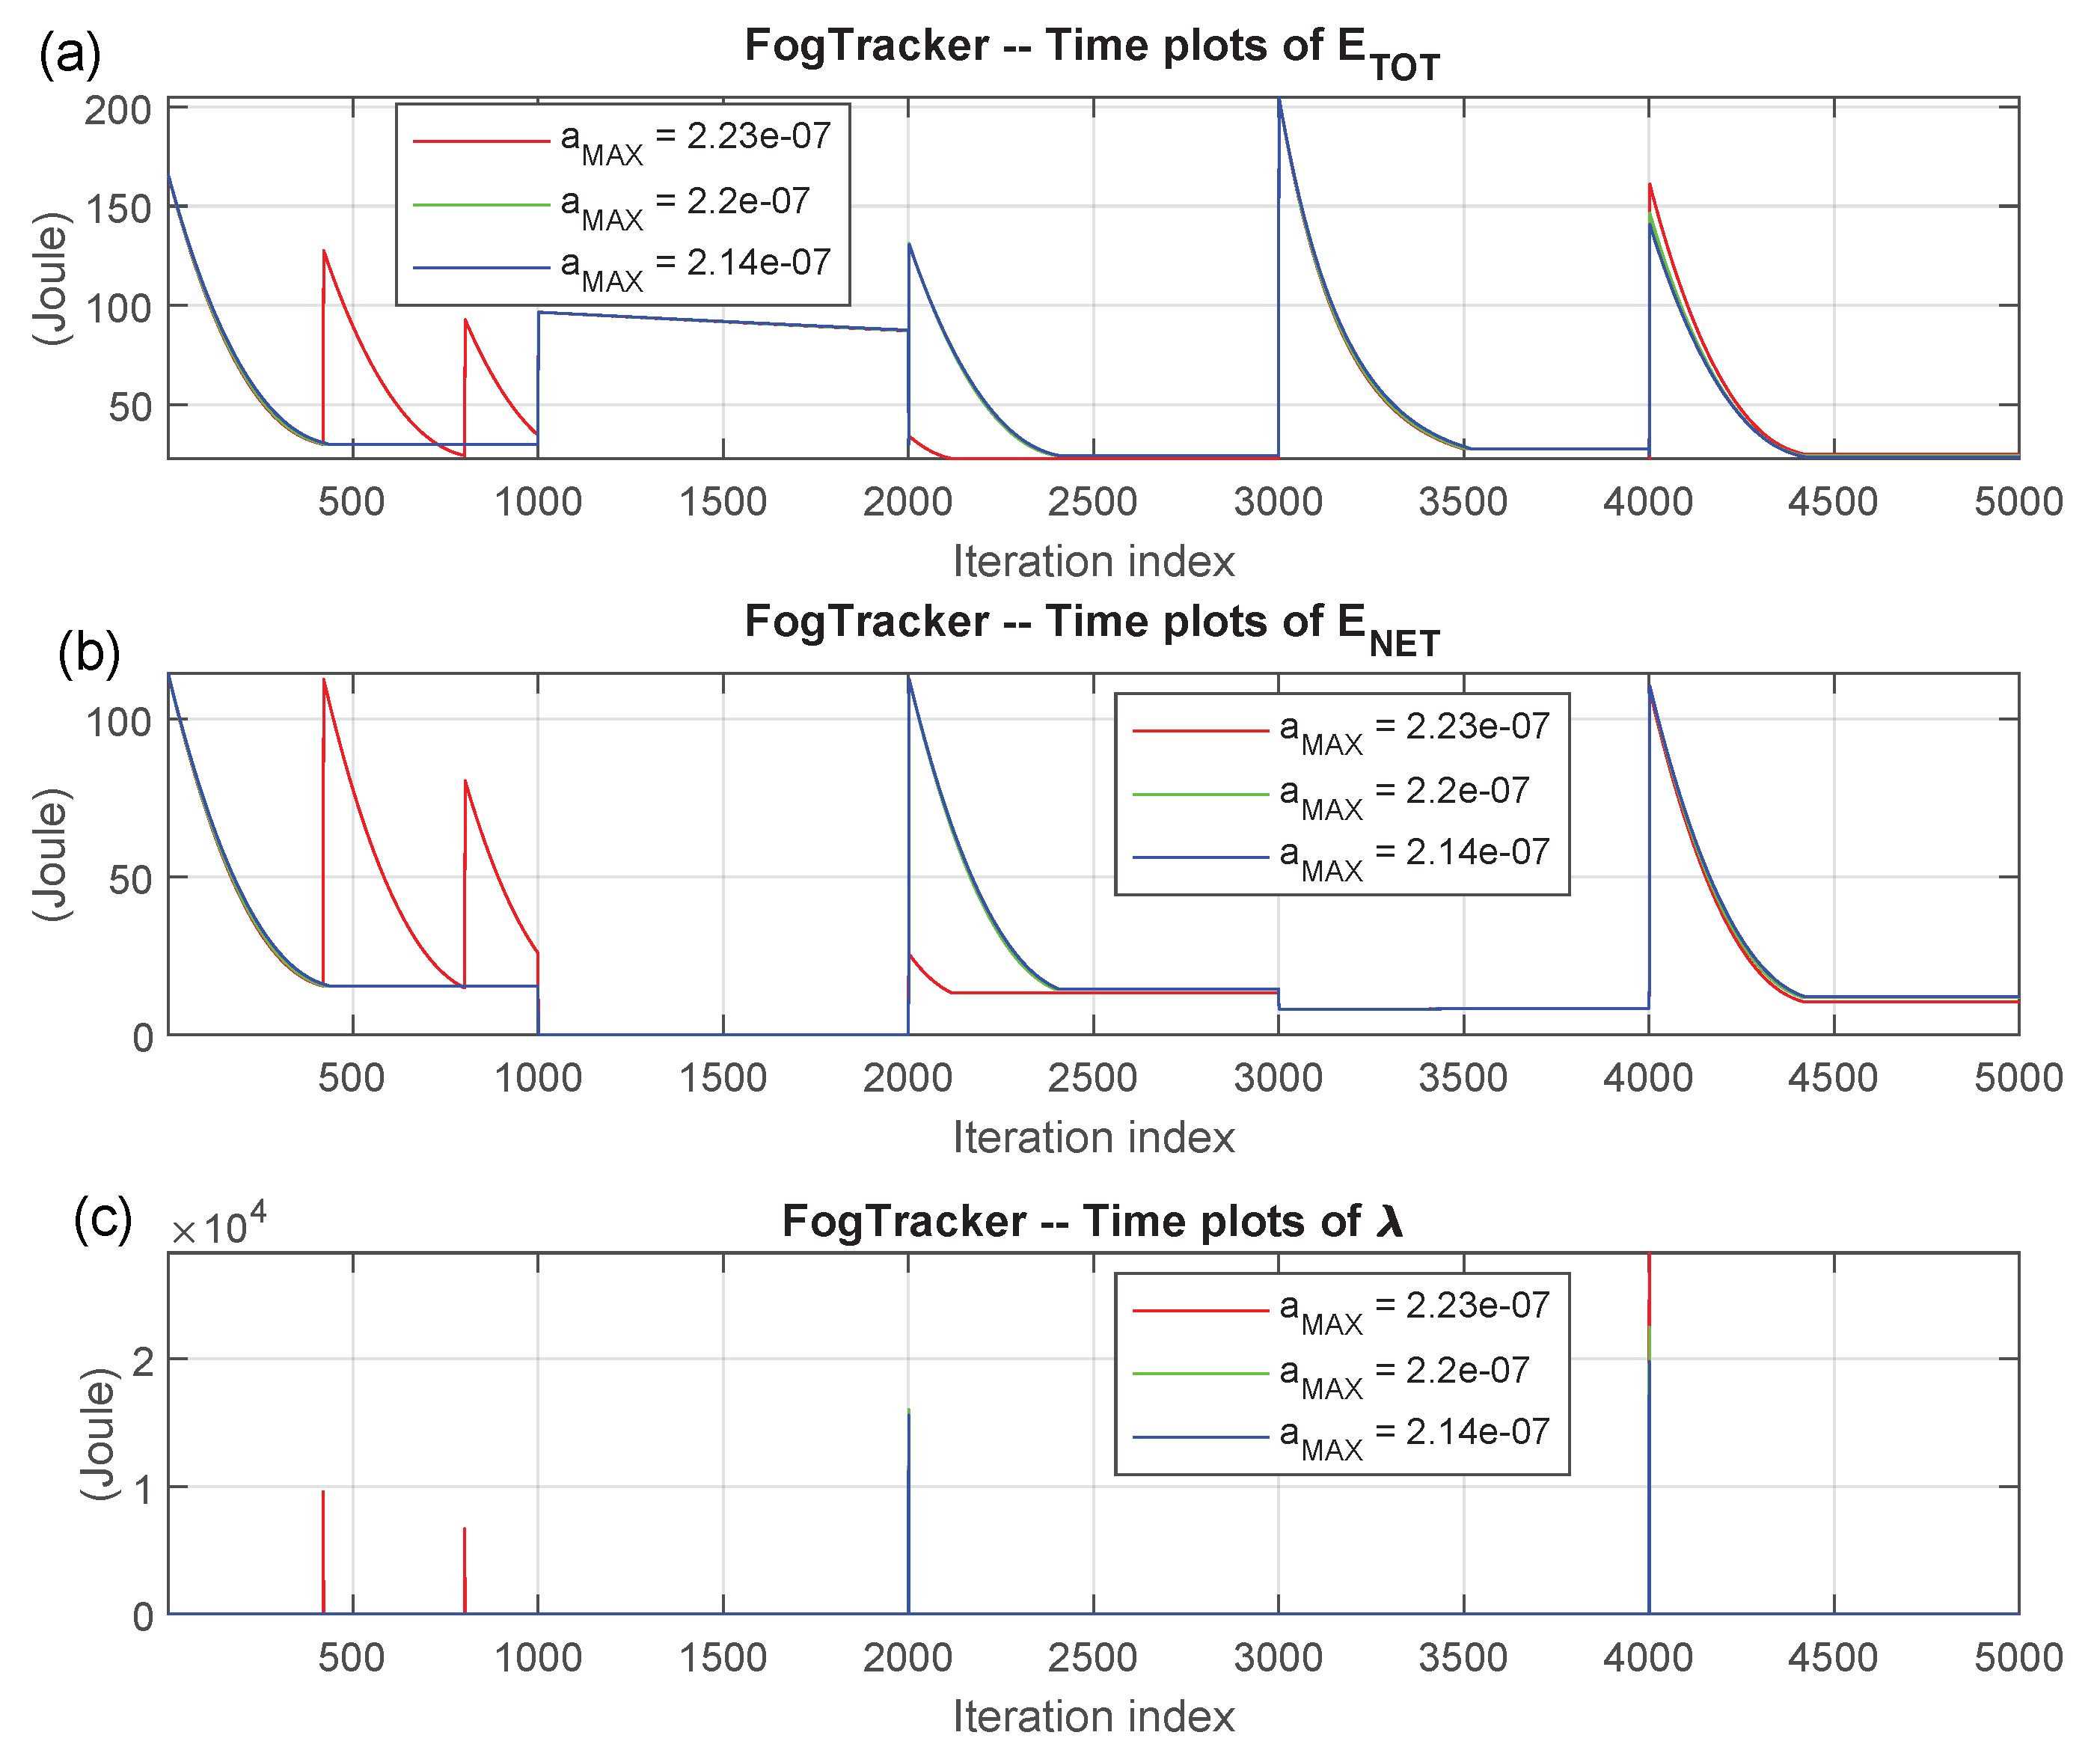
  • optionally, calls the FogTracker function. It returns the time plots over the interval: 1 , i t e r a t i o n _ n u m b e r of the:
    (a)
    total energy E T O T consumed by the overall Mobile-Fog-Cloud ecosystem;
    (b)
    the corresponding energy E N E T consumed by the up/down WiFi, Cellular, and Backhaul connections of Figure 1; and,
    (c)
    the behavior of the lambda multiplier associated with the hard throughput constraint of Equation (4b),
    when abrupt changes in the pattern of the allocated tasks and/or maximum bandwidths of the WiFi/Cellular connections occur. The user may set the magnitude of these changes, in order to test various (possibly mobility induced) time-fluctuations of the simulated environment of Figure 1 (see Section 4.4 in the sequel for a full description of the FogTracker function and supported options).
The current version of the VirtFogSim simulator is equipped with a (rich) Graphical User Interface (GUI) that displays:
  • the numerical values of the up/down WiFi-Cellular-Backhaul bandwidths and Mobile-Fog-Cloud computing frequencies returned by the allocation policies GeneticTA_par, O_TAS_par, ES_S_par, OM_S, OF_S, and OC_S in the form of colored bar plots;
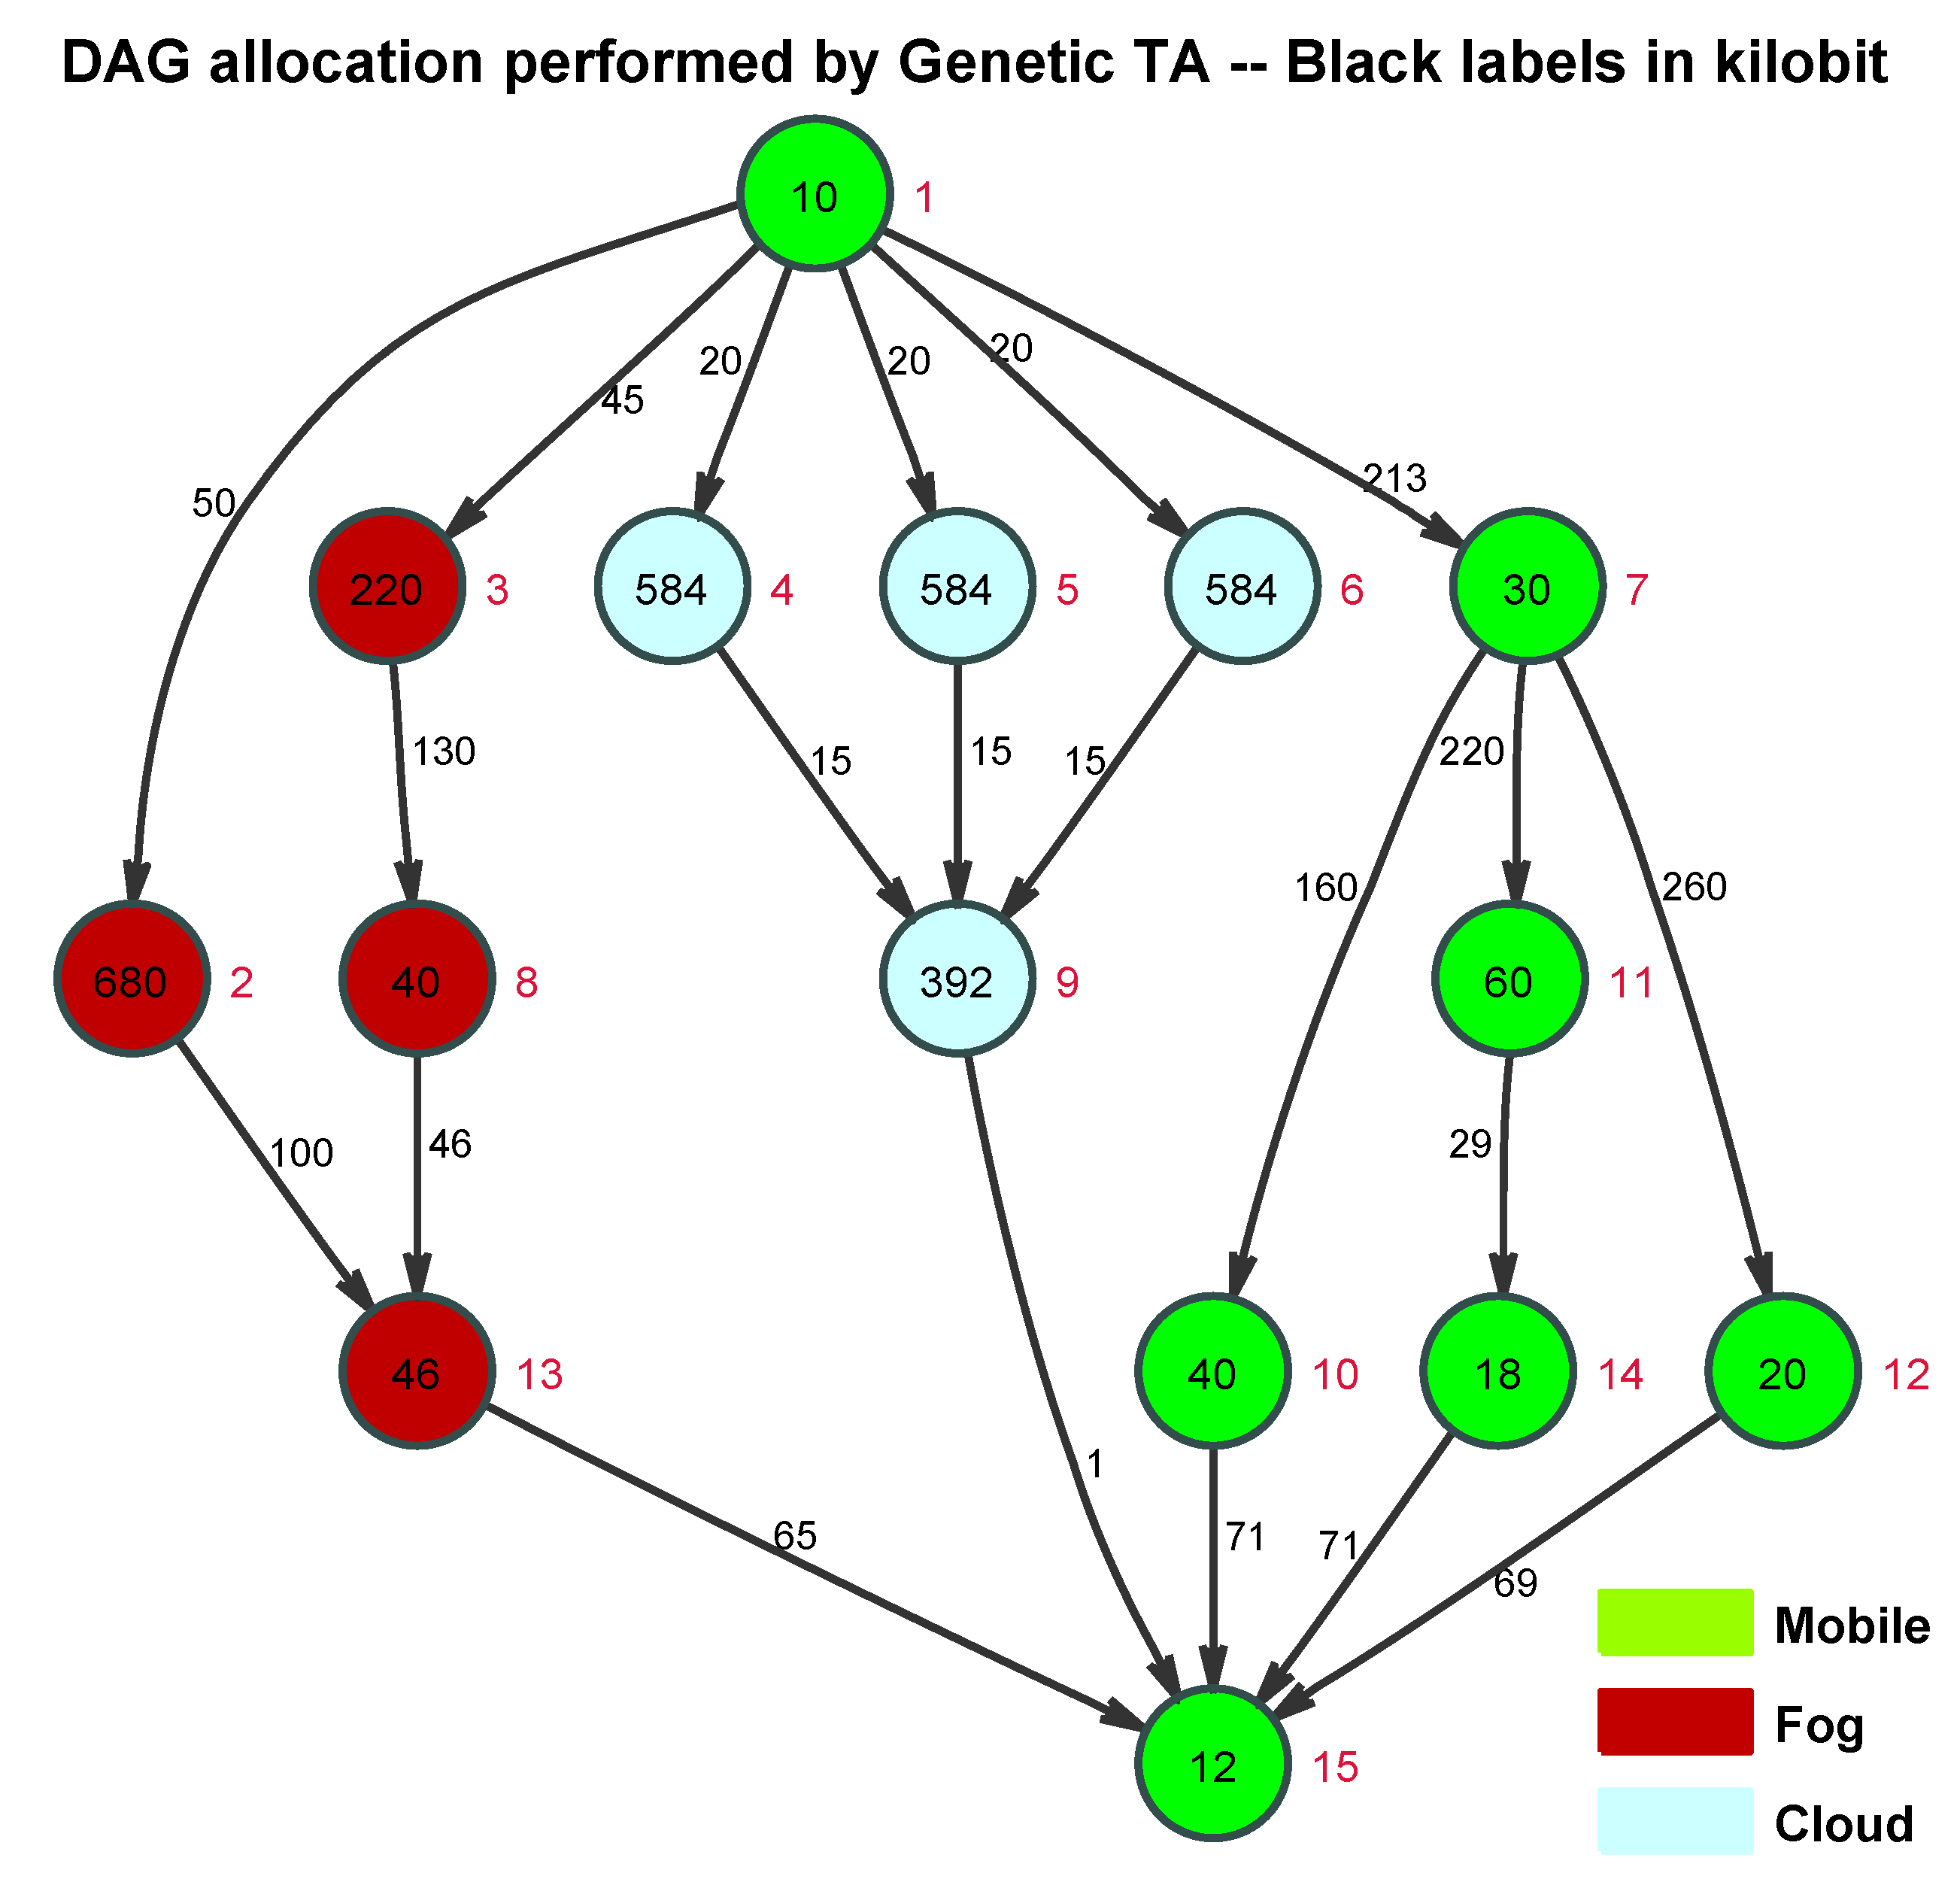
  • the (generally different) task allocation patterns performed by GeneticTA_par, O_TAS_par, ES_S_par, OM_S, OF_S, and OC_S in the form of suitably-colored labeled graphs of the underlying application DAG (see Appendix A.2 in the sequel for a description of the main screen-shoots returned by the GUI of VirtFogSim).
Furthermore, VirtFogSim allows the user to:
  • set 67 input parameters, in order to customize the desired computing and communication setup of the infrastructure of Figure 1;
  • select any subset of the (aforementioned) GeneticTA_p, OM_S, OC_S, OF_S, O_TAS_ par, ES_S_par, and FogTracker functions, in order to test and compare various task and/or resource allocation strategies under the scenario dictated by the desired input parameters.

4.2. Supported Task Allocation Strategies and Adaptive Resource Allocation

In this subsection, we describe the supported task allocation strategies provided by the VirtFogSim and listed in Table 2.
We begin with the parallel Only-Task Allocation Strategy (O_TAS_par) function that acts as follows:
  • it performs task allocation by implementing (in a parallel way) a genetic algorithm. For this purpose, O_TAS_par calls the Crossover and Mutation functions over a randomly-generated population of 0 , 1 , 2 -ternary task allocation vectors of size P S ;
  • it evaluates the energy of each tested ternary allocation vector by computing the corresponding energies: E M , E F , E C , E W i F i , E W D , and E C E L L under the static (e.g., not optimized) maximal resource allocation vector: R S M A X = f M M A X , f F M A X , f C M A X , R U M A X , R D M A X , B U M A X , B D M A X , R 0 (bit/s). For this purpose, O_TAS_par not longer calls the RAP_p function, but calls the evaluatestaticenergy_ p function.
The O_TAS_ par outputs are:
  • the V-tuple ( 0 , 1 , 2 ) -ternary minimum-energy task allocation vector: x _ O T A S , which is computed by applying the genetic algorithm run by O_TAS_par under R S M A X ;
  • the corresponding total energy: E O T A S (Joule) and network energy: E O T A S N E T (Joule) consumed by x O T A S under the (aforementioned) fixed maximal resource allocation vector R S M A X .
The function O_TAS_ par assumes that all the global variables of parallel VirtFogSim are already setup. It also utilizes the following main set of local variables: P o p m a t r i x , C h i l d l i s t , M u t a t i o n l i s t , and C a n d i d a t e l i s t , all of dimensions P S × ( V + 1 ) .
Algorithm 1 reports a pseudo-code of the O_TAS_ par function. Due to the utilization of the parfor-cycle, the resulting asymptotic computational complexity of the O_TAS_ par function scales up as: O P S × G M A X / n c o r e , where:
  • P S is the population size of the checked task allocation vectors;
  • G M A X is the number of iterations (that is, the number of generations) run by the genetic algorithm implemented by O _ T A S _ p a r ; and,
  • n c o r e 1 is the number of available parallel cores that support the execution of VirtFogSim.
Algorithm 1O_TAS_ par function.
function: x O T A S , E O T A S , E O T A S N E T = O _ T A S _ p a r P S , C F , G M A X , M N .
Output: 1 × V ternary vector of the best task allocation x O T A S 0 , 1 , 2 V under the fixed maximal resource allocation vector; scalar total energy E O T A S (Joule) and network energy E O T A S N E T (Joule) consumed by x O T A S under the fixed maximal allocation vector.
Begin O_TAS_ par function
Initialization phase
1:Randomly generate a list x i 0 , 1 , 2 V , i = 1 , , P S of task allocation vectors and store it into P o p m a t r i x ;
2:Compute and store into the V + 1 th column of P o p m a t r i x the energy consumed by each x P o p m a t r i x by calling P S times the evaluatestaticenergy_p function;
3:Sort the P S elements of P o p m a t r i x for increasing values of their energies;
4:Copy the first row of the sorted P o p m a t r i x into x O T A S , E O T A S , and E O T A S N E T ;
5:Set the number Q = C F × P S of the elements of P o p m a t r i x for crossover at each generation;
6:for j = 1 : G M A X doIterative phase
7:    Perform the pair-wise crossover of the first Q elements of P o p m a t r i x by calling Q / 2 times the Crossover function and store the Q crossover elements in C h i l d l i s t ;
8:    Randomly mute M N positions of the last P S Q elements of P o p M a t r i x by calling P S Q times the Mutation function and store the mutated elements into M u t a t i o n l i s t ;
9:    Compute and store the consumed energy of each element of C h i l d l i s t and M u t a t i o n l i s t by calling P S times the function evaluatestaticenergy_p;
10:    Copy the first Q elements of P o p m a t r i x and the overall C h i l d l i s t and M u t a t i o n l i s t into C a n d i d a t e l i s t ;
11:    Sort the P S + Q elements of C a n d i d a t e l i s t for increasing values of their energies;
12:    Copy the first P S elements of C a n d i d a t e l i s t into P o p m a t r i x ;
13:    if the total energy of the first element of P o p m a t r i x is lower than E O T A S then
14:        Copy the first row of P o p m a t r i x into x O T A S , E O T A S and E O T A S N E T ;
15:    end if
16:end for
17:return x O T A S , E O T A S , E O T A S N E T .End O_TAS_ par function
The RAP_p function implements primal-dual adaptive iterations on the cluster of available parallel workers that supports the execution of VirtFogSim. The goal is to perform the optimal resource allocation under the input task allocation vector x . Its input formal variables are the vectors x , z , and s and the matrices A, D a , and S R A P . The corresponding output variables are the vector y ˜ and the scalars E ˜ T O T and E ˜ N E T .
Specifically, we have that:
  • x is a 1 × V -dimensional 0 , 1 , 2 -ternary vector. It fixes the allocation to the Fog/Mobile/Cloud nodes of the V tasks that compose the considered application DAG. Specifically, x i = 0 , 1 , and 2 means that the i th application task is executed at the Fog clone, Mobile device, and Cloud clone, respectively;
  • z f M 0 , f F 0 , f C 0 , R U 0 , R D 0 , B U 0 , B D 0 , λ 0 is a 1 × 8 vector of real-valued non-negative scalars. It fixes the vector starting point of the primal-dual iterations to be performed. Its first seven components are measured in bit/s, while the starting Lagrange multiplier λ 0 is measured in Joule.
  • y ˜ f ˜ M , f ˜ F , f ˜ C , R ˜ U , R ˜ D , B ˜ U , B ˜ D is a 1 × 7 vector of real-valued non-negative scalars. It returns the vector of the optimal resource allocation attained by the performed primal-dual iterations. Its seven components are measured in bit/s;
  • E ˜ T O T is the total communication-plus-computing energy consumed by the computed optimal resource allocation y ˜ under the given task allocation x. E ˜ T O T is measured in Joule.
  • E ˜ N E T is the overall network energy consumed by the computed optimal resource allocation y ˜ under the given task allocation x. E ˜ N E T is measured in Joule;
  • s, A and D a are respectively the global workload vector, adjacency matrix, and edge matrix of the underlying DAG;
  • S R A P is the 1 × 54 -dimensional vector of all other global variables used by R A P _ p for its execution.
Since RAP_p is executed by the calling functions in the body of parfor-cycles, the global variables: s, A, D a , and S R A P must be passed to the RAP_ p function as input parameters, in order to guarantee the synchronization of the parfor-cycles performed by multiple parallel workers.
The RAP_ p function requires 110 + 6 × V scalar local variables and two 1 × I M A X vector local variables. The I M A X parameter is stored by S R A P and fixes the maximum number of allowed primal-dual iterations. The asymptotic implementation complexity of the RAP_ p function scales as: O 8 × I M A X .
The parallel Exhaustive Search-Strategy (ES_S_par) function returns:
  • the V-tuple ( 0 , 1 , 2 ) -ternary x E S S . It is the globally best task allocation vector, which is generated by performing the exhaustive search over the full population of the 3 ( V 2 ) ternary task allocation vectors. The first and last components of each ternary task allocation vector are unit valued, i.e., the first and last tasks of the application DAG are executed, by design, at the Mobile device;
  • the seven-tuple resource allocation vector: R S E S S = f M , f F , f C , R U , R D , B U , B D (bit/s), corresponding to the returned global task allocation vector x E S S ;
  • the total communication-plus-computing energy E E S S (Joule), network energy E N E T E S S (Joule), and bandwidth R B E S S (bit/s) of the backhaul connection consumed under the returned searched global best task allocation vector x E S S .
Being obtained through an exhaustive search, E E S S is, by design, the global minimum total energy consumed under the considered application scenario of Figure 1.
In order to guarantee that the full search space of the the task allocation vectors is actually explored, the ES_S_par function calls the auxiliary function: find_ allocations, which returns the: 3 V 2 × V -dimensional P O P matrix of all possible ( 0 , 1 , 2 ) -ary task allocation patterns. Afterward, ES_S_par calls the RAP_p function under each ternary task allocation vector returned by find_allocations, in order to evaluate the resulting best resource allocation vector, the corresponding total and network consumed energies, and the utilized backhaul bandwidth. After checking all the 3 ( V 2 ) task allocations, ES_S_par sorts them for increasing values of their total consumed energies and, then, picks out the first element of the attained sorted list. This last comprises the globally best task allocation x E S S , its associated resource allocation vector R S E S S , the corresponding consumed energies E E S S and E N E T E S S , and the utilized backhaul bandwidth R B E S S .
A pseudo-code of the ES_E_ par function is reported in Algorithm 2. The resulting asymptotic computational complexity scales up as: O 3 V 2 × 8 × G M A X / n c o r e .
Algorithm 2ES_S_par function.
function: x E S S , R S E S S , E E S S N E T , R B E S S = E S _ S _ p a r .
Output: 1 × V ternary vector of the best task allocation over the full population x E S S ; ( 1 × 7 ) resource allocation vector: R S E S S f M , f F , f C , R U , R D , B U , B D (bit/s) under x E S S ; total energy E E S S (Joule) and network energy E E S S N E T (Joule) and backhaul bandwidth R B E S S (bit/s) consumed by x E S S .
Begin ES_S_par function
1:Call the find-allocation function, in order to generate the full set list: x i 0 , 1 , 2 V , i = 1 , , 3 V 2 of ternary V-tuple candidate task allocation vectors, with the first and last elements set to the unit;
2:Store (by row) x i into the first V columns of the P O P matrix;
3:for i = 1 : 3 V 2 do
4:    Compute the resource allocation vector and the total consumed energy of each x i by calling the RAP_p function, and store them (by row) into the last columns of the P O P matrix;
5:end for
6:Sort the 3 V 2 elements of the P O P matrix for increasing values of their total energies;
7:Store the first row of the sorted P O P matrix into x E S S , R S E S S , E E S S , E E S S N E T and R B E S S ;
8:return x E S S , R S E S S , E E S S , E E S S N E T , R B E S S .End ES_S_par function
The parallel Genetic Task Allocation (GeneticTA_par) function assumes that all the global variables of parallel VirtFogSim are already setup. The GeneticTA_ par function jointly optimizes the task allocation and the resource allocation in an adaptive way. It returns:
  • the 0 , 1 , 2 -ternary V-long vector x b e s t of the best searched task allocation;
  • the corresponding 1 × 7 vector: R S b e s t = f M , f F , f C , R U , R D , B U , B D (bit/s), of the optimal resource allocation computed by the RAP_p function under the best task allocation vector x b e s t ;
  • the total and network energies: E b e s t , E b e s t N E T (Joule) that are consumed under the returned R S b e s t ;
  • the actual transmission rate: R B b e s t (bit/s) of the two-way Fog ↔ Cloud backhaul connection.
Task allocation is performed by GeneticTA_ par by running a genetic algorithm. For this purpose, GeneticTA_ par calls the Crossover and Mutation functions.
Resource allocation is performed by GeneticTA_ par in an adaptive way. For this purpose, at each parallel iteration called by a parfor-cycle, GeneticTA_ par calls the RAP_ p function. Afterward, GeneticTA_ par picks up and stores:
  • the best (that is, the minimum energy) task allocation vector x b e s t ;
  • the corresponding resource allocation vector R S b e s t ;
  • the total consumed energy E b e s t and the corresponding network energy E b e s t N E T computed up to the current generation.
P S is the size of each generation of task allocation vectors; G M A X is the number of carried out generations; C F is the fraction of crossover elements of the current generation; and M N is the number of mutated locations on a per-task-allocation basis.
Let n c o r e 1 be the number of parallel cores (e.g., parallel workers) managed by the Parallel Toolbox of MATLAB, in order to support the execution of the VirtFogSim package. Hence, the resulting asymptotic implementation complexity scales as in: O P S × G M A X × 8 × I M A X / n c o r e .
The Only Mobile Strategy (OM_S) function assumes that all the V tasks of the assigned application DAG are executed at the Mobile device. Then, it returns the 1 × 7 vector R S O M = f M , f F , f C , R U , R D , B U , B D (bit/s) of the corresponding resource allocation, the corresponding total computing-plus-communication consumed energy E O M (Joule), and the (vanishing) network energy: E N E T O M (Joule). It is expected that the returned f M is not zero, while the returned f C , f F , R U , R D , B U , B D , and E N E T O M vanish. The asymptotic complexity of the OM_S function scales up as in: O 8 × I M A X .
The Only Fog Strategy (OF_S) function assumes that the first and last tasks of the assigned application DAG are executed at the Mobile device, while all the remaining inner ( V 2 ) tasks are executed at the Fog clone. Then, OF_S returns the 1 × 7 vector R S O F = f M , f F , f C , R U , R D , B U , B D (bit/s) of the corresponding resource allocation, the corresponding total computing-plus-networking consumed energy E O F , and the network energy E N E T O F (Joule). It is expected that the returned f M , f F , R U , and R D are not zero, while the returned f C , B U , and B D vanish.
The Only Cloud Strategy (OC_S) function assumes that the first and last tasks of the assigned application DAG are executed at the Mobile device, while all the remaining inner ( V 2 ) tasks are executed at the Cloud clone. Then, it returns the 1 × 7 vector R S O C = f M , f F , f C , R U , R D , B U , B D (bit/s) of the corresponding resource allocation, the corresponding total computing-plus-networking consumed energy E O C (Joule), and the network energy E N E T O C (Joule).
It is expected that the returned f M , f C , B U , and B D are not zero, while the returned f F , R U , and R D vanish. The functions OM_S, OF_S, and OC_S call a sequential version RAP of the RAP_p function, with the following initialization vector: z = 0 , 0 , 0 , 0 , 0 , 0 , 0 , 1 .

4.3. Implemented Auxiliary Functions

In this subsection, we provide the description of some auxiliary functions called from the previous allocation routines. These auxiliary functions are listed in Table 3.
In the Crossover function, P a r e n t v 1 and P a r e n t v 2 are two V-tuple parent vectors to crossover, while C h i l d v 1 and C h i l d v 2 are the resulting V-tuple vectors produced by the performed crossover operation. The crossover operation generates an integer index I over the set 2 , 3 , , ( V 1 ) . It is the pointer to the crossover point. Afterward, C h i l d v 1 and C h i l d v 2 are obtained by swapping the first I components of P a r e n t v 1 and P a r e n t v 2 with the last V I components of P a r e n t v 2 and P a r e n t v 1 , respectively.
In the Mutation function, the global input parameter M N fixes the number of the components of the input vector x v to be mutated. x v is the V-tuple 0 , 1 , 2 -ternary input vector to be mutated. o u t v is the V-tuple 0 , 1 , 2 -ternary mutated output vector. It is guaranteed that the first and last components of o u t v are unit valued. The function Mutation generates M N random positions (with 1 M N V 2 ) and M N random 0 , 1 , 2 -ternary mutation numbers. Then, it mutates x v at the generated M N positions by replacing the generated M N mutation numbers for the corresponding components of x v .
In the evaluatestaticenergy_p function for parallel execution, x v is the ( 1 × V ) -long input ( 0 , 1 , 2 ) -ternary task allocation vector to be checked. Since the function evaluatestaticenergy_p is called in the body of the parfor-cycle by the O _ T A S _ p a r function, all the needed global variables: s , A, D a , and S R A P must be passed to evaluatestaticenergy_p as input parameters. This guarantees the synchronization of the used global variables under parallel execution. If x v is a feasible task allocation pattern, E a u x and E N E T are the total and network energies consumed by x v under the static maximal resource allocation vector defined as: R S M A X = f M M A X , f F M A X , f C M A X , R U M A X , R D M A X , B U M A X , B D M A X (bit/s). If x v is an infeasible task allocation pattern, then E a u x = E N E T = is returned. The asymptotic complexity of the evaluatestaticenergy_p function is: O ( 7 ) , where seven is the number of the computed resource variables.
Finally, the find_allocations function returns in the matrix T A all the possible: K N patterns of N numbers that can assume the first K integer values: 0 , 1 , 2 , , K 1 . This function is used by the ES_S_par strategy function to obtain all the possible allocations to be tested in the exhaustive search.

4.4. Dynamic Performance Tracking Function

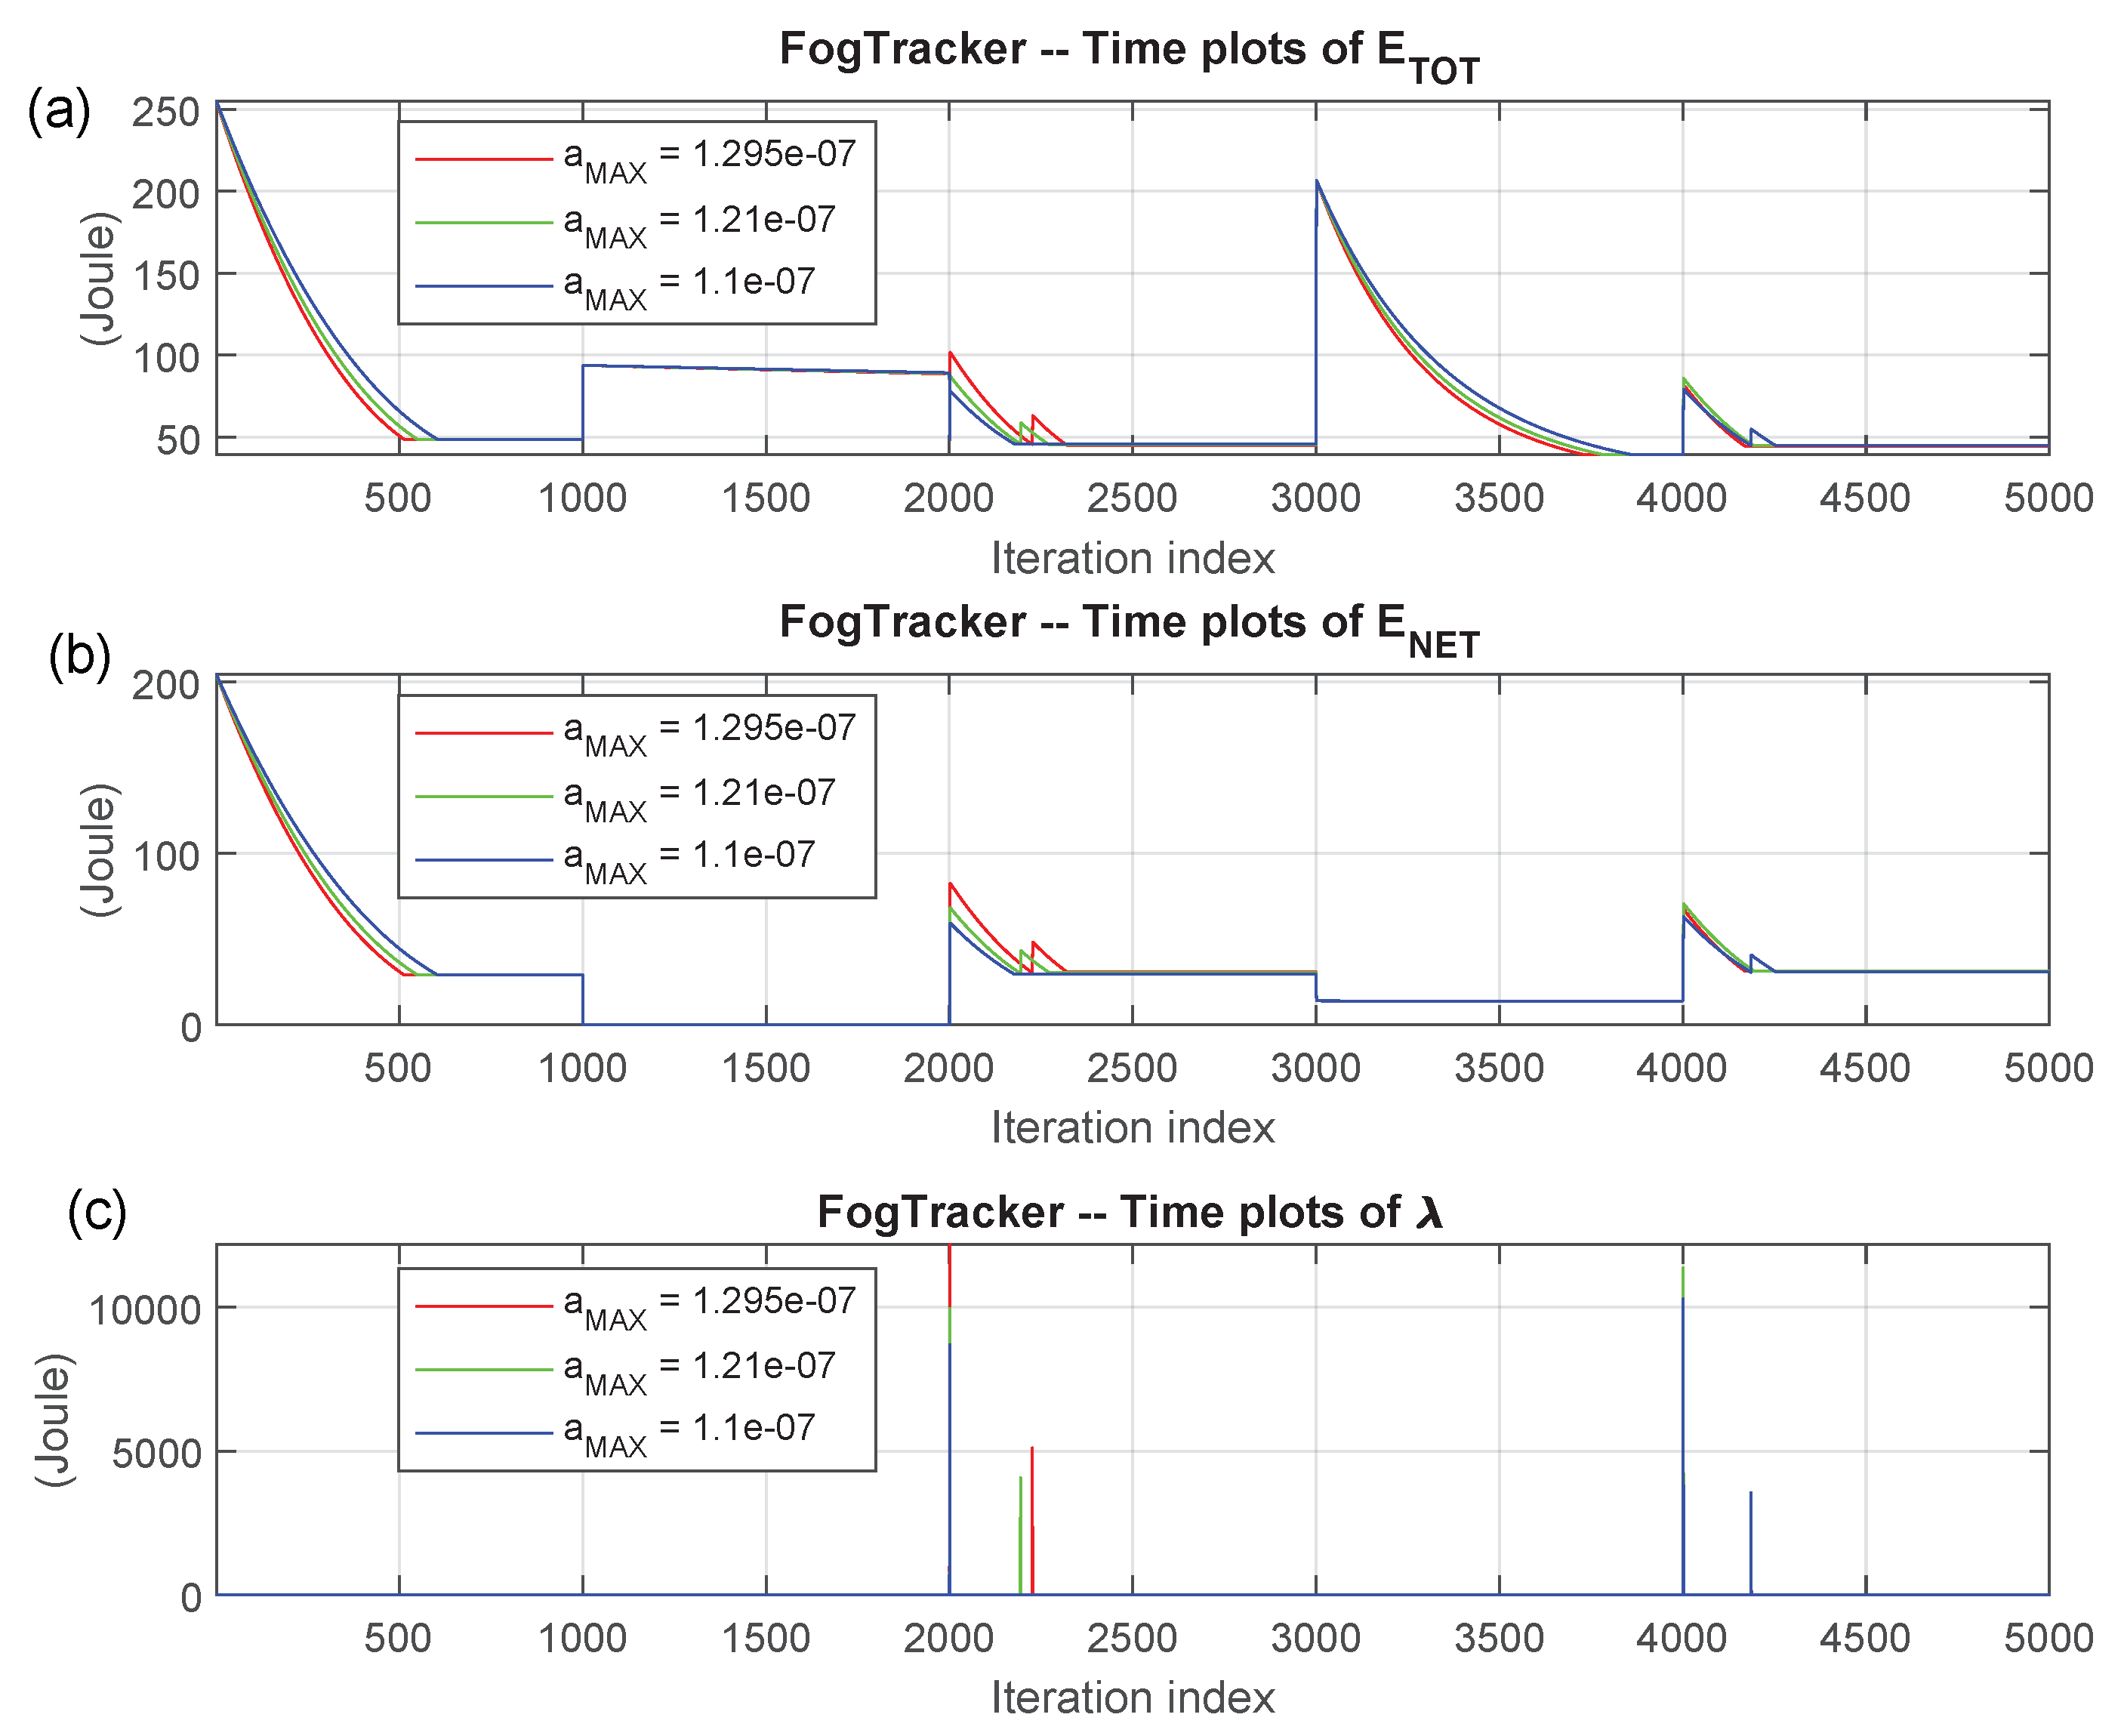
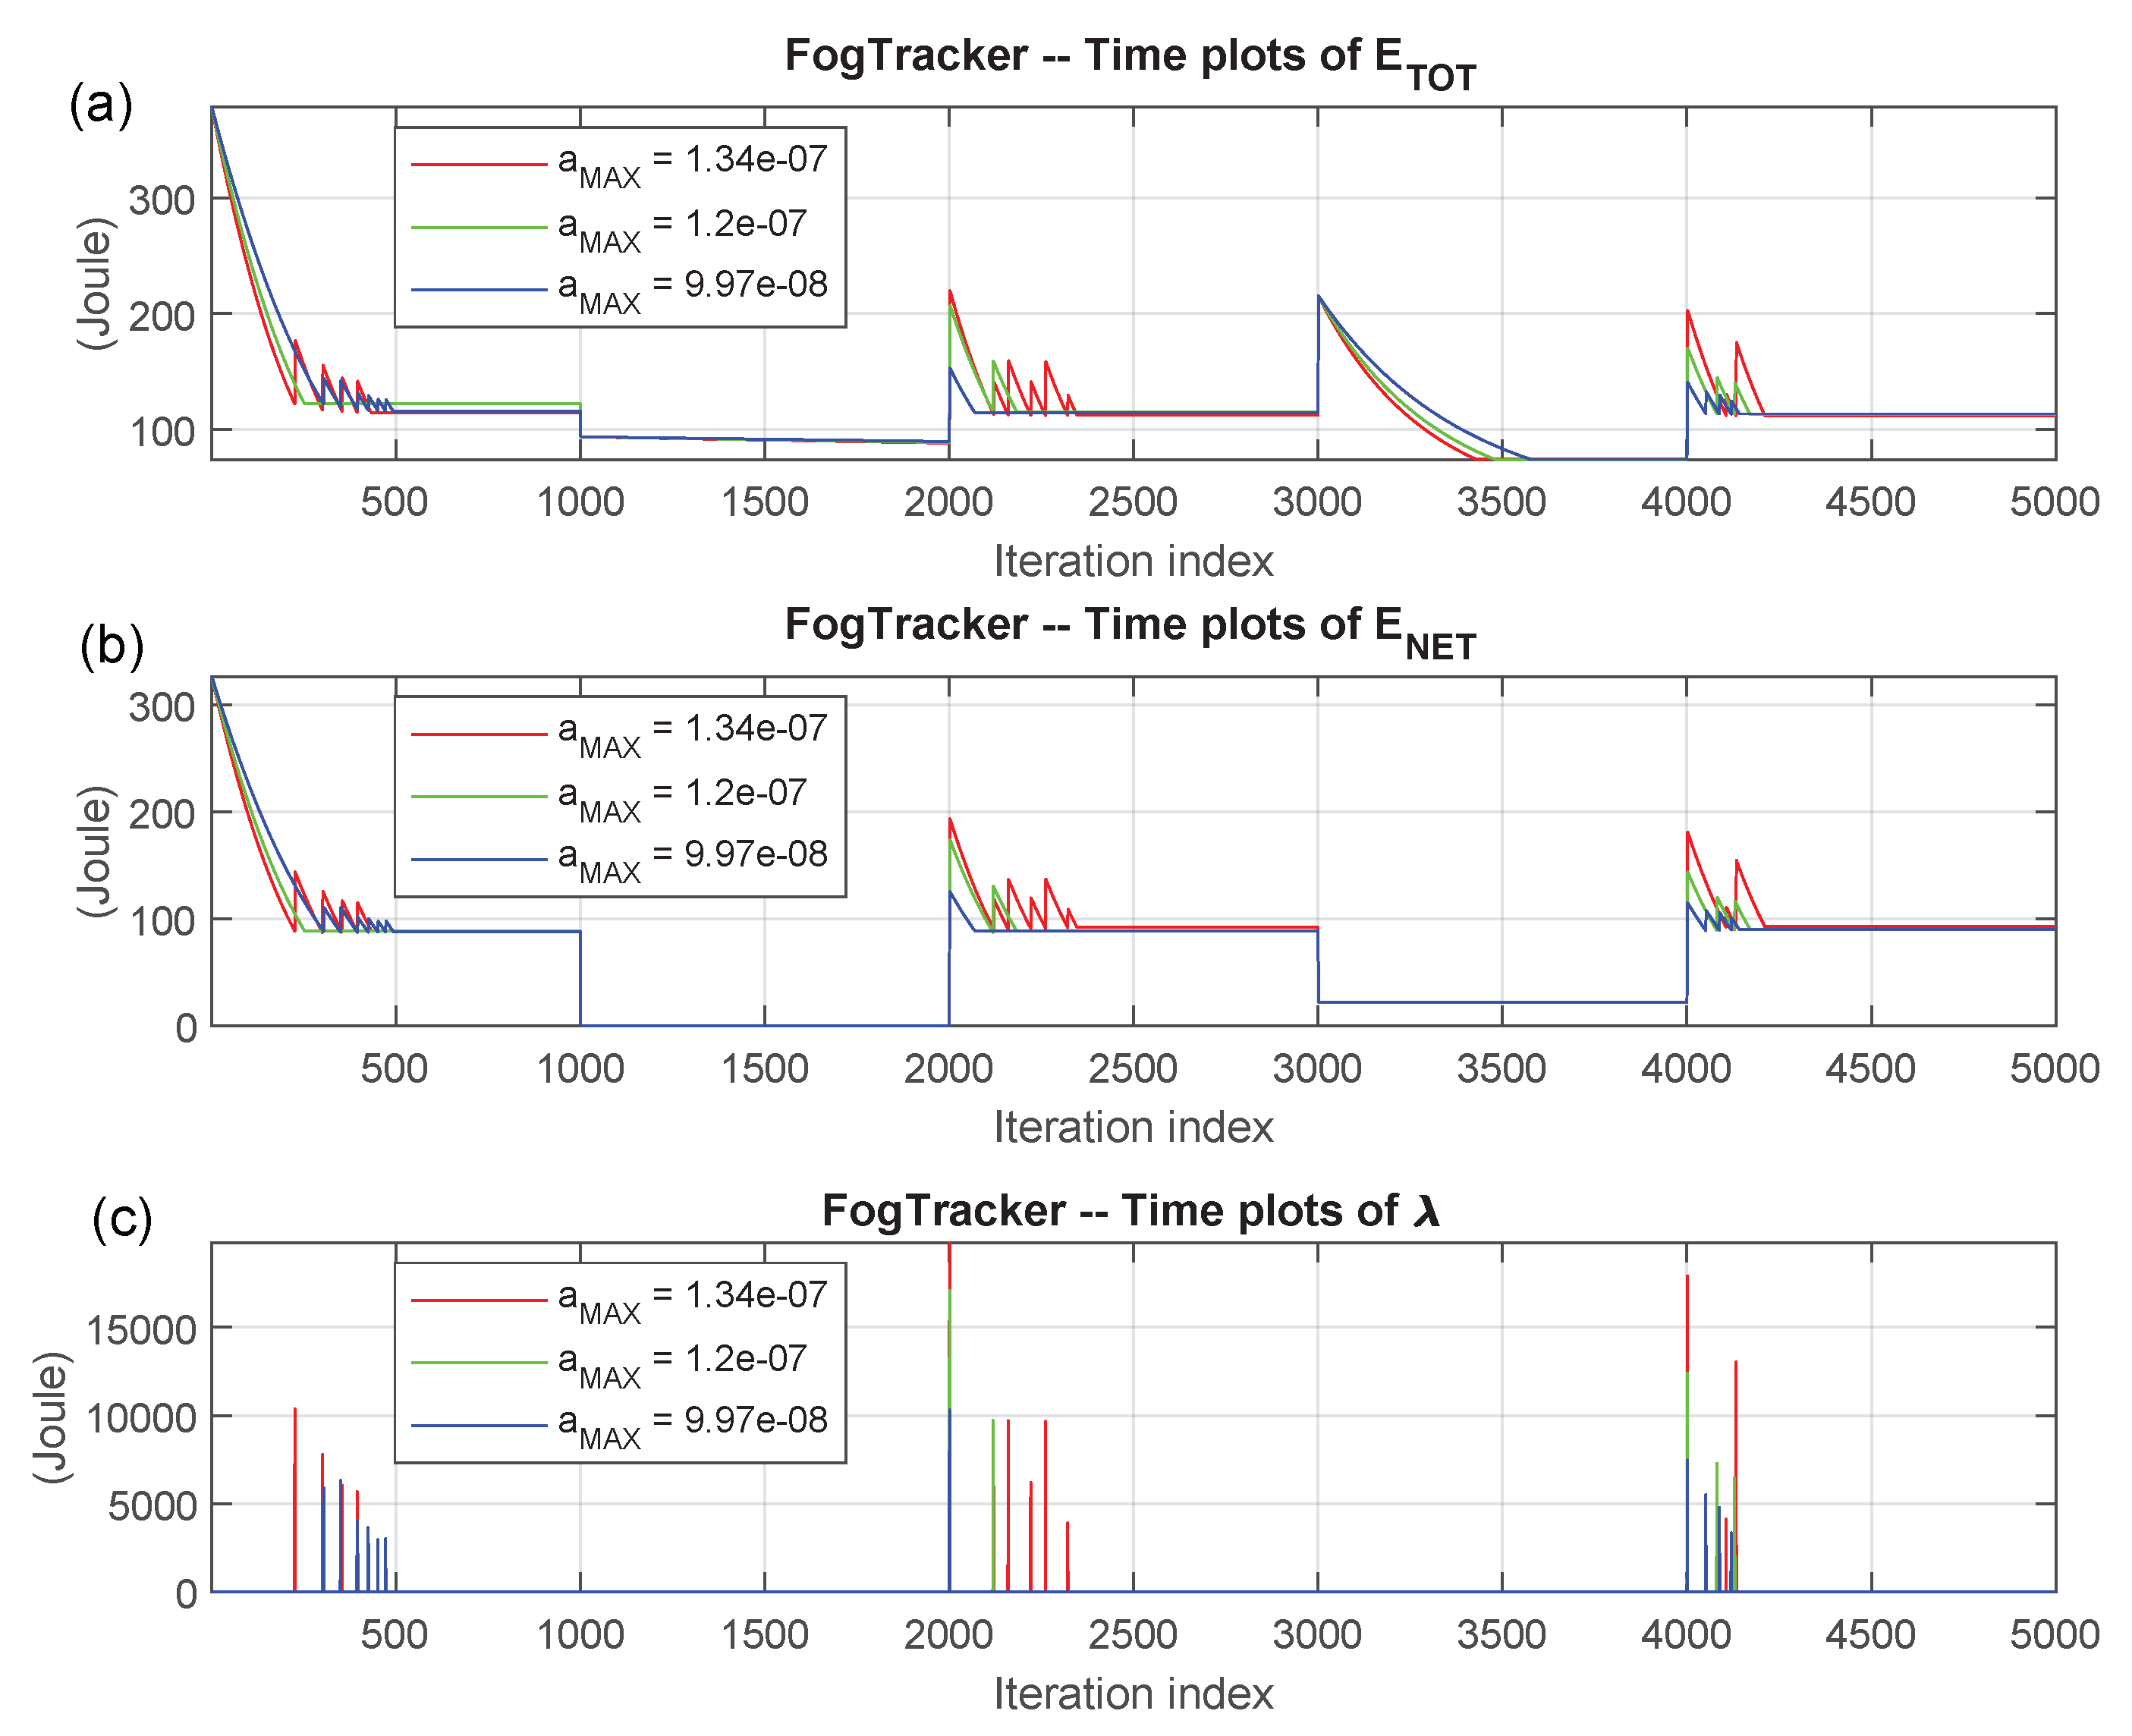
The numerical outputs of the FogTracker function are three matrices that store the time behaviors of: (i) the consumed total energy E T O T (Joule); (ii) the corresponding consumed network energy E N E T (Joule); and (iii) the l a m b d a multiplier (Joule), for values of the iteration index going from one to the given i t e r a t i o n _ n u m b e r . The goal of FogTracker is to test the convergence rate to the steady-state and the steady-state stability of the primal-dual iterations performed by the RAP_ p function when abrupt changes of the maximum allowed WiFi and Cellular up/down bandwidths and task allocation vectors simultaneously happen. For this purpose, at the time indexes:
  • round ( 1 / 5 ) × i t e r a t i o n _ n u m b e r + 1 ;
  • round ( 2 / 5 ) × i t e r a t i o n _ n u m b e r + 1 ;
  • round ( 3 / 5 ) × i t e r a t i o n _ n u m b e r + 1 ;
  • round ( 4 / 5 ) × i t e r a t i o n _ n u m b e r + 1 ,
the initial values of the global variables: R U M A X , R D M A X , B U M A X , B D M A X undergo abrupt changes. These changes are obtained by multiplying them by the (non-negative) input factors: j u m p W i F i 1 , j u m p C E L L 1 , j u m p W i F i 2 , and j u m p C E L L 2 . These jump coefficients are declared as global variables and set by the user. At the same time, the task allocation vector passes from x 1 to x 2 and, then, from x 2 to x 3 . Finally, it comes back to x 1 .
The resulting time behaviors of the total energies, network energies, and lambda multiplier values over the time window: [ 1 , i t e r a t i o n _ n u m b e r ] are plotted under the three user-specified values of a M A X , which are stored by the ( 1 × 3 ) global input vector a M A X F T . In so doing, the FogTracker function tests the convergence rate of the RAP_ p function when the task allocation vector undergoes abrupt changes. The actual feasibility of the task allocation vectors: x 1 , x 2 , and x 3 is explicitly checked in the body of the FogTracker function. If at least one of these feasibility checks fails, the FogTracker function generates a suitable error message and, then, halts.
In detail, the FogTracker function performs the following nine steps:
  • it begins to run the RAP_ p function over the time interval: [ 1 , round ( 1 / 5 ) × i t e r a t i o n _ n u m b e r ] , under the original settings of: R U M A X , R D M A X , B U M A X , B D M A X dictated by the main program VirtFogSim and the first input task allocation vector x 1 ;
  • at the end of the iteration number: round ( 1 / 5 ) × i t e r a t i o n _ n u m b e r , the WiFi maximum bandwidths: R U M A X and R D M A X are multiplied by the (non-negative) scaling factor: j u m p W i F i 1 , while the maximum cellular bandwidths: B U M A X and B D M A X are multiplied by the corresponding (possibly, coincident) scaling factor: j u m p C E L L 1 . Furthermore, the task allocation vector is changed into x 2 . In so doing, both the maximum available bandwidths and the task allocation vector undergo abrupt (typically, user mobility induced) variations;
  • the RAP_ p function runs over the time-interval:
    round ( 1 / 5 ) × i t e r a t i o n _ n u m b e r + 1 , round ( 2 / 5 ) × i t e r a t i o n _ n u m b e r under the setting of Step 2. Its initial vector is the last returned vector of the RAP_p at the previous iteration: round ( 1 / 5 ) × i t e r a t i o n _ n u m b e r ;
  • at the end of iteration number: round ( 2 / 5 ) × i t e r a t i o n _ n u m b e r , all four maximum bandwidths: R U M A X , R D M A X , B U M A X , and B D M A X are restored to their original values. Furthermore, even the task allocation vector is set back to its original value x 1 ;
  • the RAP_ p function runs over the time interval:
    round ( 2 / 5 ) × i t e r a t i o n _ n u m b e r + 1 , round ( 3 / 5 ) × i t e r a t i o n _ n u m b e r under the setting of Step 4. Its initial vector is the last returned vector of the RAP_ p at the previous iteration number: round ( 2 / 5 ) × i t e r a t i o n _ n u m b e r ;
  • after the iteration number: round ( 3 / 5 ) × i t e r a t i o n _ n u m b e r , the WiFi maximum up/down bandwidths: R U M A X , and R D M A X are multiplied by the non-negative scaling factor j u m p W i F i 2 , while the cellular maximum up/down bandwidths: B U M A X and B D M A X are multiplied by the scaling factor: j u m p C E L L 2 . At the same time, even the task allocation vector is changed to the third value x 3 . In so doing, both the maximum available bandwidths and the task allocation vector undergo abrupt (typically, user mobility-induced) variations;
  • the RAP_ p function runs over the time-interval:
    round ( 3 / 5 ) × i t e r a t i o n _ n u m b e r + 1 , round ( 4 / 5 ) × i t e r a t i o n _ n u m b e r under the setting of Step 6. Its initial vector is the last returned vector of the R A P _ p at the previous iteration number: round ( 3 / 5 ) × i t e r a t i o n _ n u m b e r ;
  • after the iteration number: round ( 4 / 5 ) × i t e r a t i o n _ n u m b e r , all four WiFi/CELLmaximum up/down bandwidths are restored to their original values. Furthermore, even the task allocation vector is set back to the first value x 1 ;
  • finally, the RAP_ p function runs over the time-interval:
    round ( 4 / 5 ) × i t e r a t i o n _ n u m b e r + 1 , i t e r a t i o n _ n u m b e r under the setting of Step 8. Its initial vector is the last returned vector of the RAP_ p at the previous iteration number: round ( 3 / 5 ) × i t e r a t i o n _ n u m b e r .
Graphic plots of the time behaviors of the returned E T O T , E N E T , and l a m b d a are displayed at the end of each FogTracker run (see Section 5 in the sequel). From the outset, it follows that the asymptotic complexity of the FogTracker function scales up as in: O 8 × i t e r a t i o n _ n u m b e r × 3 .
Overall, Table 4 reports a synoptic view of the asymptotic computational complexities of the described GeneticTA_par, OM_S, OF_S, OC_S, O_TAS_par, ES_S_par, and FogTracker functions under their parallel implementations.

5. VirtFogSim: Supported Formats of the Rendered Data

Under the current version of the simulator, both the VirtFogSim and VirtFogSimGUI interfaces (see Appendix A) support four main formats, in order to render the results output by the seven optimization algorithms of Table 4. The functions used to obtain these formats are listed in Table 5 and fully described in the VirtFogSim User Guide (see Section 8). These rendering formats are:
  • the Tabular format. It is enabled by the print_solution graphic function;
  • the Colored Bar Plot format. It is enabled by the plot_solution graphic function;
  • the Colored Time Plot format. It is enabled by the plot_FogTracker graphic function;
  • the Colored Labeled DAG Map format. It is enabled by the plot_ DAG graphic function.
Specifically, the print_solution function prints on the MATLAB prompt the result obtained by running the tested strategies under the selected DAG and given input parameters (see Table A2). Its input parameters are: (i) the vector R S collecting the seven allocated resources; (ii) the vector E collecting the total computing–plus-networking consumed energy; (iii) the bandwidth R B of the Fog↔Cloud two-way backhaul connection; and (iv) a string s t r a t e g y representing the name of the tested strategy. Then, the function prints the following results in a numerical form:
  • the Computing/Communication Ratio (CCR);
  • the required minimum DAG execution throughput ( T H 0 M I N );
  • the per-core computing frequency at the Mobile device ( f M );
  • the per-core computing frequency at the Fog clone ( f F );
  • the per-core computing frequency at the Cloud clone ( f C );
  • the transport bit rate of the WiFi-based TCP/IP Mobile-to-Fog connection ( R U );
  • the transport bit rate of the WiFi-based TCP/IP Fog-to-Mobile connection ( R D );
  • the transport bit rate of the 3G/4G Cellular TCP/IP Mobile-to-Cloud connection ( B U );
  • the transport bit rate of the 3G/4G Cellular TCP/IP Cloud-to-Mobile connection ( B D );
  • the transport rate of the TCP/IP two-way Fog↔Cloud backhaul connection ( R B );
  • the total computing-plus-networking consumed energy ( E T O T );
  • the consumed computing energy ( E C O M );
  • the consumed networking energy ( E N E T );
  • the percent networking-to-total ratio of the consumed energies: % E N E T / E T O T .
If the input vector R S is empty, only a reduced set of information is printed.
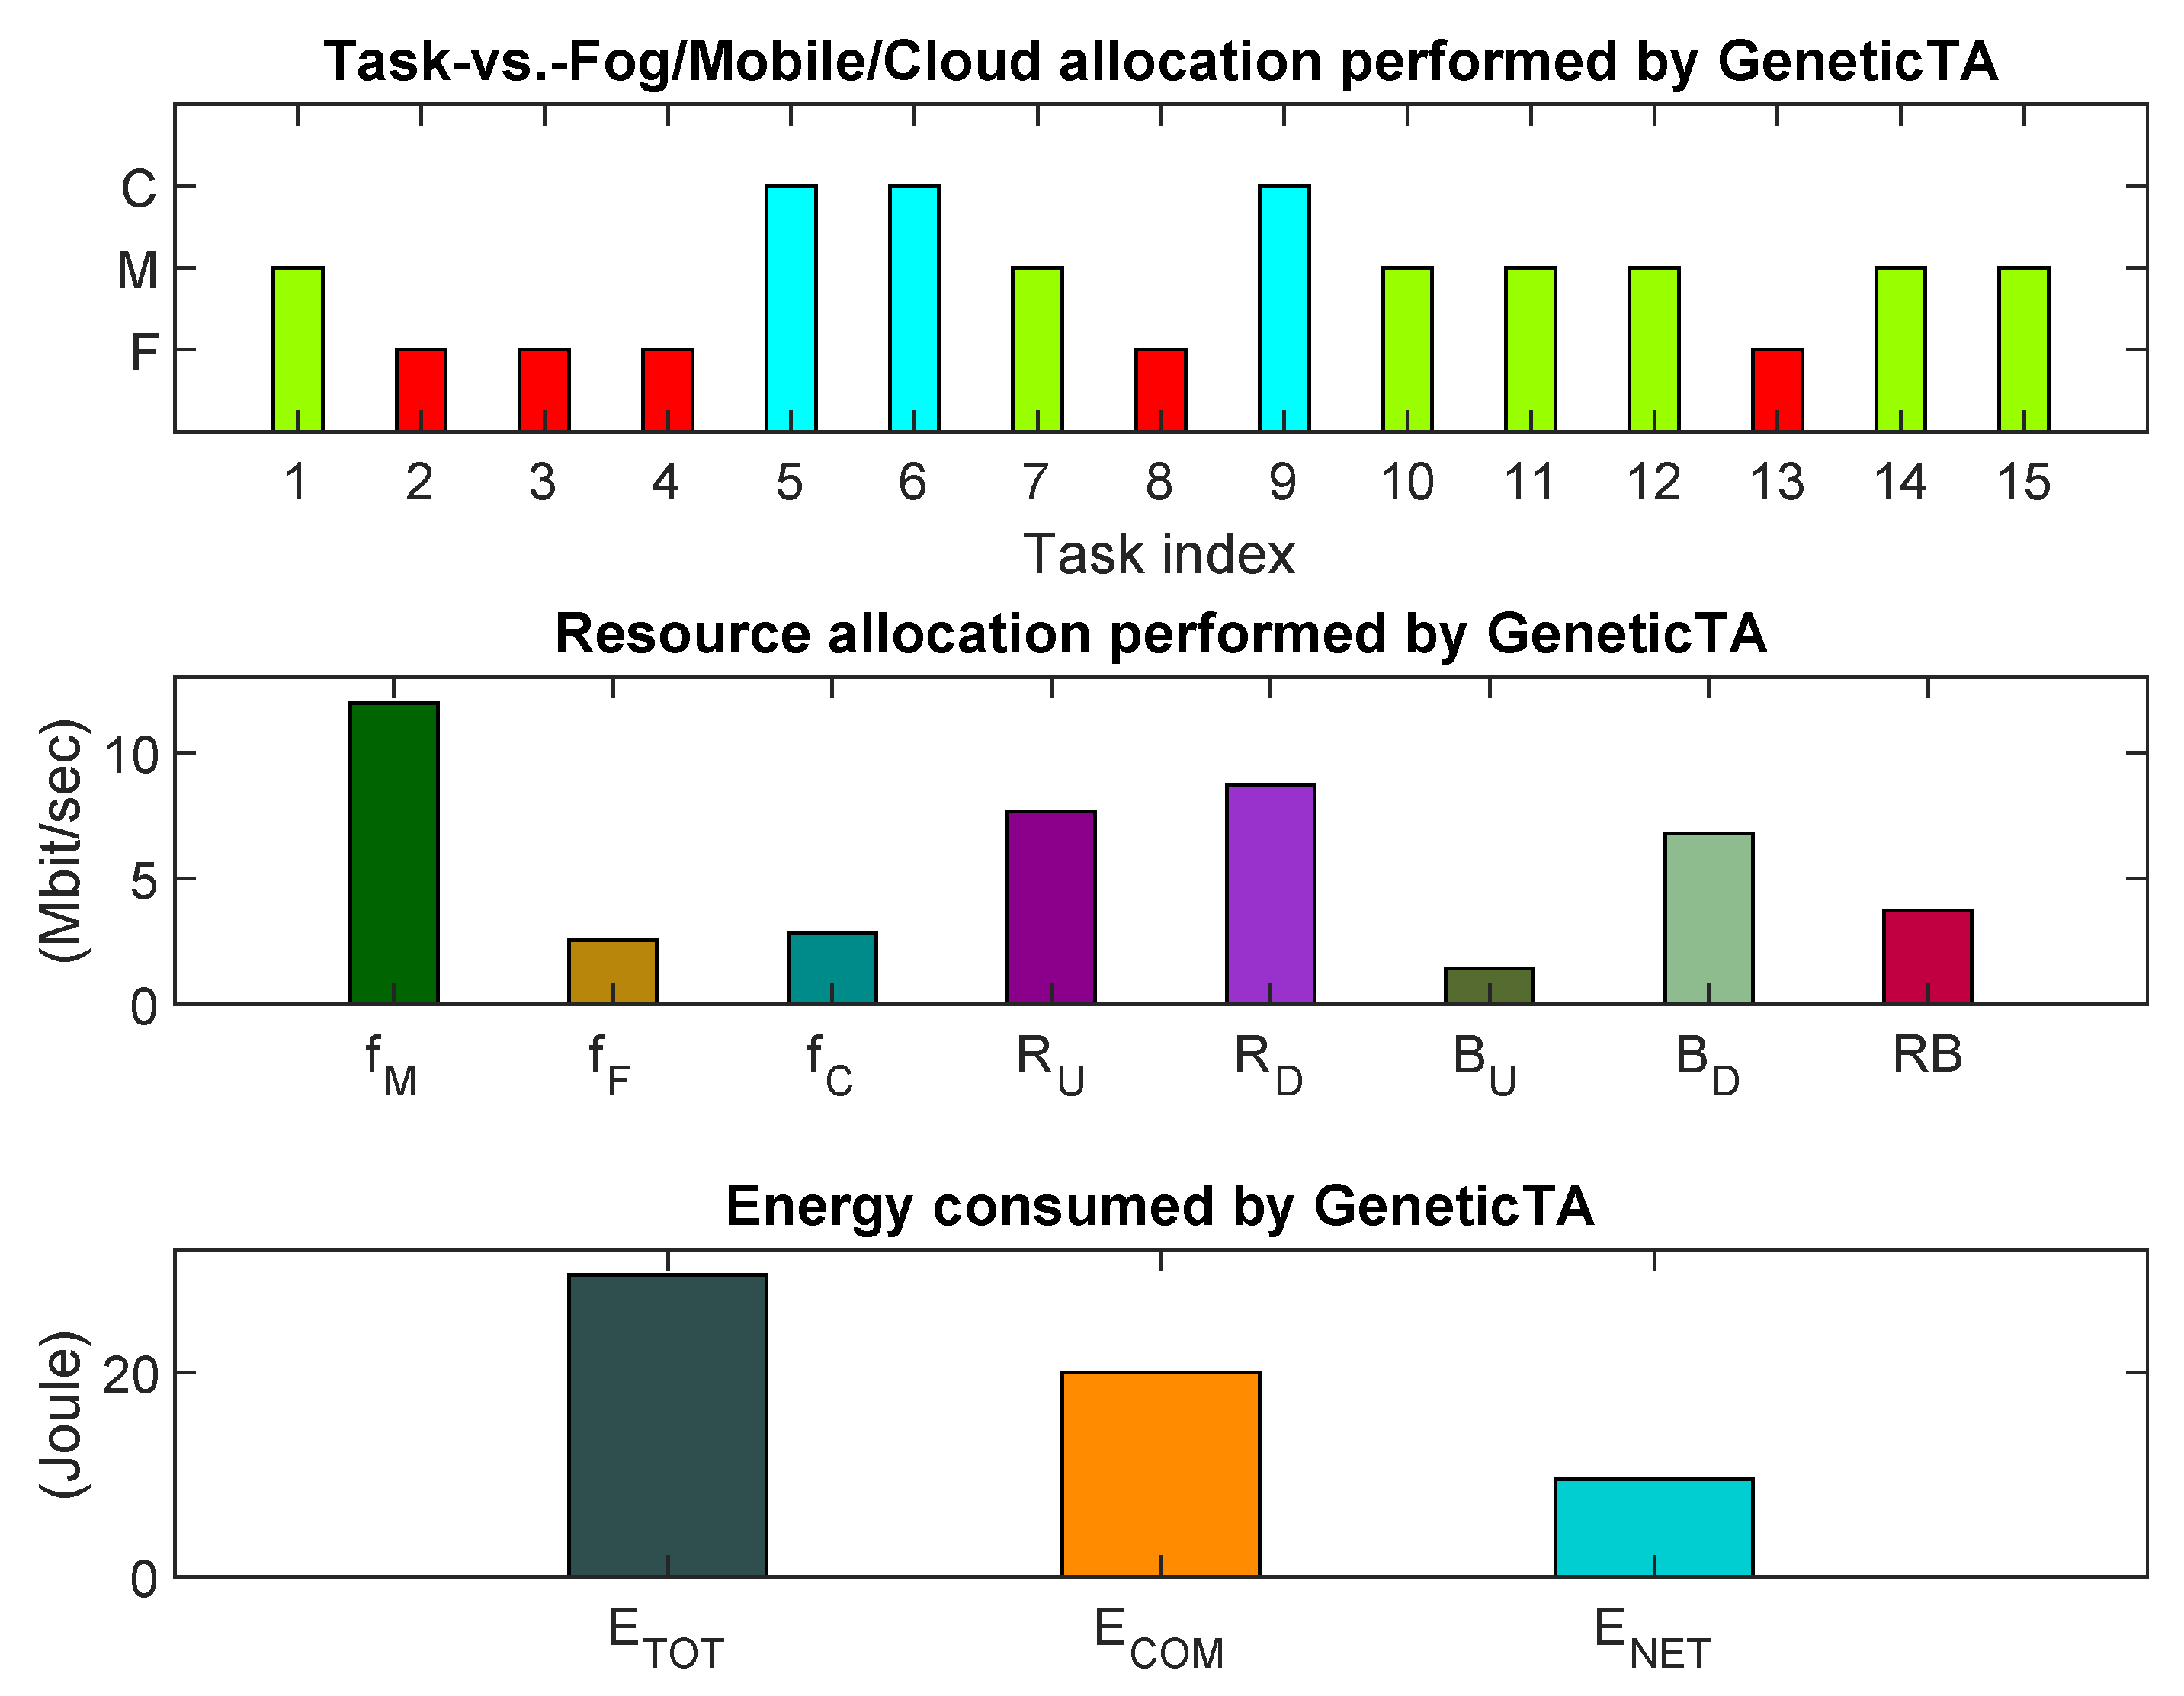
The plot_solution function displays the: (i) utilized computing/bandwidth resources; (ii) task allocation pattern; and (iii) consumed energies, returned by the carried out VirtFogSim run in terms of suitable three-colored bar plots. In addition to the input used by the previous function, the other parameters are: (i) the ( 0 , 1 , 2 ) -ary allocation vector x to be displayed; and (ii) the number of the fignumber to be displayed. The function renders a figure that is composed of three horizontal subplots. These subplots display:
  • the returned task allocation in the form of a three-color bar plot;
  • the allocated computing frequencies and network bandwidths in the form of a plot with eight bars;
  • the total, computing and networking consumed energies in the form of a plot with three bars.
If the passed task allocation vector x and/or resource allocation vector R S are empty, then only one or two subplots are rendered. An illustrative screen-shoot of the bar-plots rendered by the execution of the GeneticTA_par function is shown in Figure 3.
The plot_DAG function returns a graphic representation of the application DAG passed as the input. Its input parameters are: (i) the vector s containing the nodes’ weights of the DAG; (ii) the adjacency matrix A of the DAG; (iii) the matrix D a of the weights of the DAG edges; (iv) the vector x of task allocation to be visualized; (v) a string of characters with the name of the policy that will be shown; and (vi) an optional three-valued parameter t y p e , which allows selecting the desired DAG visualization format as follows:
  • all DAG nodes with the same color and unlabeled;
  • all DAG nodes with the same color and labeled by increasing identification numbers;
  • each DAG node is numbered and colored on the basis of the allocation actually stored by the input vector x .
The plot_DAG function needs the Bioinformatics Toolbox to be installed in the MATLAB environment. By default, the graph returned by plot_DAG retains the following features:
  • all the workload values labeling the DAG nodes and edges are expressed in kilo-bit;
  • red-colored tasks are understood to be allocated to the Fog node;
  • green-colored tasks are understood to be allocated to the Mobile node; and,
  • blue-colored tasks are understood to be allocated to the Cloud node.
An illustrative screen-shoot of the colored task map DAG rendered by the execution of the GeneticTA_par function is shown in Figure 4.
Finally, the plot_fogTracker function provides the graphic capabilities needed for a proper plot of the time-traces of the total energies, networking energies, and lambda multipliers generated by the FogTracker function under the three values of the step-size that are stored by the vector a M A X F T (see Table A2). Its input parameters are: (i) the matrix E m of the total consumed energies returned by FogTracker; (ii) the matrix E m N E T of the consumed networking energies returned by FogTracker; (iii) the matrix λ m of the values of the lambda multipliers returned by FogTracker; and (iv) an optional parameter i n t e r p o l a t i o n allowing the plot of an interpolated version of the figures if set to one. The function renders a figure composed of three horizontal sub-plots that trace:
  • the total consumed computing-plus-networking energies under the three values of the step-size stored by a M A X F T ;
  • the corresponding consumed networking energies;
  • the related values of the lambda multiplier.
Some illustrative screen-shoot of the dynamic plots rendered by the FogTracker function are shown in Figures 7–9 of Section 6.2.

Pre-Loaded Application DAGs

In the current version of the VirtFogSimGUI interface (see Figure A1 in Appendix A) is available an archive that stores fourteen test DAGs, together with the related sets of (suitably-tuned) input parameters. These DAGs are ready-for-use, e.g., they may be retrieved by the user and, then, run under both the (previously-described) interfaces of the simulator.
The archived DAGs were retrieved from the current literature [25,26,27,29,30,31,32,33] and feature a number of heterogeneous real-world applications of practical interest. Their topologies cover a large spectrum (e.g., tree, fork, parallel, mesh, and hybrid topologies, just to name a few), and their number of nodes ranges from V = 9 to V = 45 .

6. VirtFogSim in Action: Testing Its Numerical Capabilities

The aim of this section is to provide insights about the actual capability of the developed VirtFogSim package by: (i) numerically testing and comparing the energy-delay-tracking performance of its natively-supported optimization tools of Section 4.4 (see also Table 4) under three use cases of practical interest; and (ii) checking the performance of the underlying MATLAB code by numerically profiling its simulation times and volumes of inter-core exchanged data over a spectrum of multi-core execution environments.
All the carried out simulations have been done by exploiting the capabilities of a hardware execution platform equipped with: (i) an Intel 10-core i9-7900X processor; (ii) 32 GB of RAM DDR 4; (iii) an SSD with 512 GB plus an HDD with 2 TB; (iv) a GPU ZOTAC GeForce GTX 1070. The release R2018a of MATLAB provided the underlying software execution platform. It is equipped with the MATLAB Parallel Toolbox, in order to exploit the multi-core capability (possibly) offered by the host hardware platform.
We anticipate that, unless otherwise stated, all the simulations have been carried out under the parameter setting reported in the last column of the final Table A2 in the Appendix.

6.1. Use Cases and Related DAGs

Three real-world use cases have been selected, in order to test the performance of the proposed VirtFogSim package under different application environments featured by (very) heterogeneous workflows and DAG topologies. Figure 5 and Figure 6 report the graphs of the considered test DAGs.
DAG1 in Figure 5a describes the workflow of a (small-sized) parallel MAP/REDUCER computing application [34]. This DAG is composed of the parallel combination of two MAP/REDUCER nodes (e.g., MAP/REDUCER#1 on the left and MAP/REDUCER#2 on the right of Figure 5a, respectively). They share the same input and output nodes (e.g., Nodes 1 and 12 in Figure 5a, respectively), which are forced to be executed by the mobile device. Nodes 2 and 7 act as load balancers, while Nodes 3, 4, 5 and 8, 9 10 act as Mappers. Finally, Nodes 6 and 11 perform reduce operations. The resulting DAG topology of Figure 5a possesses the following features: (i) it is symmetric; (ii) all six input-output paths are equal-length; and (iii) MAP/REDUCER#1 (resp., MAP/REDUCER#2) is more computing-intensive (resp., more communication-intensive) than MAP/REDUCER#2 (resp., MAP/REDUCER#1).
DAG2 in Figure 5b details the workflow of a video navigation application [33], which involves the parallel execution of three sub-programs, namely a graphic sub-program (left section of Figure 5b), a subprogram for face detection (middle section of Figure 5b), and a video-processing subprogram (right section of Figure 5b). All these sub-programs share the same input and output nodes (e.g., Nodes 1 and 15 in Figure 5b), which implement data-rendering functionalities and, then, are forced to be executed at the Mobile device. DAG2 is medium-sized (e.g., it is composed of 15 tasks and 21 edges), and its topology possesses the following features: (i) it is asymmetric; (ii) it is composed of the parallel combination of three heterogeneous sub-DAGs, which exhibit fork, parallel, and tree-shaped sub-topologies, respectively; and (iii) the face detection and video processing subprograms are computing- and communication-intensive, respectively, while the graphic subprogram is of a mixed type.
Lastly, DAG3 in Figure 6 describes the workflow for the simulation of Newton’s equations describing pseudo-chaotic molecular dynamics [29]. It is a large-sized DAG (e.g., it is composed of 41 tasks and 70 edges), and its topology exhibits the following main features: (i) it is very irregular and mimics a random graph, which combines a number of heterogeneous sub-graphs with chain, parallel, fork, tree, and mesh-type sub-topologies; (ii) it is composed of a large number of pseudo-generated edges, which join randomly-selected task pairs. As a consequence, in Figure 6, there are a number of inter-crossing edges, as well as a number of variable-length paths that go from the input task to the output one. (iii) Task workloads and edge weights have been randomly generated.
Finally, we point out that the summations of task workloads and edge weights of all considered DAGs of Figure 5 and Figure 6 are the same and equate to 3.32 (Mbit) and 1.66 (Mbit), respectively. In so doing, we expect that the results of the performance comparisons carried out in the next sub-sections are fair.

6.2. Comparative Tracking Performance under Intermittent WiFi Connectivity

The goal of this section is to test the convergence speed to the steady-state and the steady-state stability of the primal-dual iterations implemented by the RAP_p function of Section 4.4 when abrupt changes of the available WiFi up/down bandwidths and task allocation patterns simultaneously happen. For this purpose, we run the FogTracker function of Section 4.4 at T D A G = 0.3 under the (previously-described) three test DAGs. The obtained dynamic behaviors of the total consumed energies E T O T , network energies E N E T , and lambda multipliers are reported in Figure 7a–c (resp., Figure 8a–c and Figure 9a–c) for various test values of the speed-up factor a M A X of Section 3.5 under DAG1 (resp., DAG2 and DAG3).
All the reported time behaviors refer to a common application scenario under which both task allocation patterns and up/down WiFi bandwidths undergo simultaneous abrupt changes at the iteration indexes t = 1 , 1000, 2000, 3000, and 4000 (see the corresponding step-like jumps of the plots of Figure 7, Figure 8 and Figure 9). These changes are typically triggered by device mobility, which may give rise to an intermittent availability of the WiFi connectivity. More in detail, we have that: (i) at t = 1 , the up/down cellular (resp., WiFi) bandwidths are turned ON (resp., turned OFF), and all tasks are allocated to the Cloud node; (ii) at t = 1000 , the up/down WiFi bandwidths are turned ON, and all tasks are allocated to the Mobile node; (iii) at t = 2000 , the WiFi bandwidths are still turned OFF, and all tasks are re-allocated to the Cloud node; (iv) at t = 3000 , the up/down WiFi bandwidths are turned ON once time, and all tasks are allocated to the Fog node; and, finally, (v) at t = 4000 , the up/down WiFi bandwidths are definitively turned OFF, and all tasks are re-migrated to the Cloud node. After each change of the setup environment, the RAP_p function runs, in order to re-allocate both the per-clone computing frequencies at the Mobile-Fog-Cloud nodes and the corresponding up/down Cellular-WiFi bandwidths properly.
An examination of the time-plots reported in Figure 7, Figure 8 and Figure 9 leads to three main insights. First, even in the presence of the (aforementioned) abrupt changes of the operating setups, the corresponding lambda multipliers remain almost surely vanishing (see Figure 7c, Figure 8c, and Figure 9c), and this supports the conclusion that all the performed resource allocations computed by the RAP_p function are, indeed, feasible (e.g., they meet the constraint in Equation (4) on the allowed maximum DAG execution time). Second, we have numerically ascertained that the abrupt step-like jumps experienced by the plots of E N E T in Figure 7b, Figure 8b, and Figure 9b at the changing instants are the combined effects of both the ON-OFF availability of the WiFi connectivity and the associated re-allocation of the Cellular up/down bandwidths. Third, a comparative examination of the red-green-blue colored plots of Figure 7a, Figure 8a, and Figure 9a confirms that bigger values of the speed-up factor a M A X of Section 3.5 speed-up the convergence to the corresponding steady-states, but also tend to introduce larger oscillation phenomena.
Overall, two final lessons are learned by the carried out tracking analysis. First, at least under the considered application scenarios, values of a M A X ranging over the (quite broad) interval: 9.5 × 10 8 2.25 × 10 7 exhibit good tradeoffs among the contrasting requirements of quick reaction to abrupt (possibly mobility-induced) changes of the operative scenarios and stable behavior in the steady-state. Second, values of the primal-dual iterations I M A X limited up to 500–700 suffice for attaining stable resource allocations, even in the presence of abrupt changes of the operation environment.

6.3. Comparative Task and Resource Allocation Performance

In this section, we compare the task placement, resource allocation, and energy performance of the (previously-described) GeneticTA_par strategy under the considered test DAGs. This is done for values of the allowed execution times T D A G of 0.3, 0.6, 0.9, 1.5, and 3.0 (s). The final goal is to acquire insights about the effects of the DAG topologies, their sizes, and corresponding distributions of the task workloads and edge weights on the allocation patterns returned by GeneticTA_par.
The numerical results obtained by running the VirtFogSim toolbox are reported in Table 6, Table 7 and Table 8 under DAG1, DAG2, and DAG3, respectively.
A view of these results leads to the following four main sets of remarks.
Consumed total energies and allocated resources: A comparative examination of the profiled values reported in the 13th column of Table 6, Table 7 and Table 8 points out that, in all simulated cases, the total consumed energy E T O T remains limited up to 32 Joule. Since all the test DAGs share the same sum values of the task workloads and edge weights, this supports the conclusion that, at the first order, these factors play a major role in dictating the energy efficiency of the performed task and resource allocations. However, a more detailed examination of these results also unveils the following two trends: (i) at fixed DAG, the consumed energies tend to decrease for increasing values of T D A G ; and (ii) at fixed T D A G , the energy consumption tends to decrease by passing from the (more symmetric and regular) DAG1 to the (more random and irregular) DAG3 (see the DAG graphs of Figure 5 and Figure 6). Roughly speaking, the first trend reflects the fact that larger values of T D A G make the underlying application environment more delay-tolerant. As a consequence, the RAP_p function lowers the steady-state computing frequencies and/or the network bandwidths (see the numerical values reported by the corresponding columns of Table 6, Table 7 and Table 8). This reduces, in turn, the dynamic (e.g., resource-depending) components of the total consumed energies. The second trend confirms the fact that, by design, the optimization capability of genetic-based strategies generally increases with the size and/or the pseudo-random irregular nature of the topology of the underlying DAGs.
Consumed network energies: The impact of the DAG topology and distribution of the edge weights on the resulting consumed network energy E N E T seems to be, indeed, more relevant. In fact, a comparative examination of the results reported in the last column of Table 6, Table 7 and Table 8 points out that: (i) under DAG1, the percent ratios of the network energies to the corresponding total ones quickly decrease for increasing values of T D A G and pass from 52% at T D A G = 0.3  s to: 36.5% at T D A G = 3.0  s; and (ii) under DAG2 and DAG3, the corresponding network-to-total energy ratios are not so sensitive to the values of T D A G . They remain clipped, indeed, around: 31–32%, and around: 33.5–33.7% under DAG2 and DAG3, respectively. This supports the conclusions that: (i) DAG1 features a communication-intensive application, especially at low values of T D A G ; while (ii) DAG2 and DAG3 describe more computing-intensive applications.
Task allocation patterns: Columns 2, 3, and 4 of Table 6, Table 7 and Table 8 report the Identification Numbers (IDs) of the tasks allocated by GeneticTA_par to the Mobile, Fog, and Cloud nodes under DAG1, DAG2, and DAG3, respectively. Although the reported allocation patterns may strongly depend on the specifically considered DAGs, nevertheless, three main quite general trends seem to stand out. First, at low values of T D A G , medium-sized and communication-intensive tasks are typically allocated at the Fog node, while large-sized and communication-light tasks are allotted at the Cloud node. The Mobile device only executes small-sized, but communication-intensive tasks. Second, more and more tasks are shifted from the Cloud node to the Fog node and/or to the Mobile device for decreasing values of T D A G .
Utilization of the Fog-Cloud backhaul connection: A peculiar feature of the three-tiered technological platform of Figure 1 is the presence of a (possibly multi-hop and/or wired) two-way backhaul connection, which interconnects the Fog and Cloud nodes. Hence, it may be of interest to attain insights about its utilization for the support of the (previously-mentioned) task allocation patterns performed by GeneticTA_par. Intuitively, we expect that the backhaul connection is used when there are large-sized tasks to be allocated at the Cloud and the volumes of data output by the execution of these tasks are large. Therefore, since the Fog-to-Mobile WiFi connection is more energy efficient than the corresponding Cloud-to-Mobile cellular one, it may be energy-saving to transport the processed data from the Cloud to the Fog over the backhaul connection and, then, use the Fog as a relay node, in order to forward these data to the Mobile device by exploiting the WiFi downlink of Figure 1. This is, indeed, the strategy dictated by GeneticTA_par, in order to execute DAG3. In fact, an examination of the corresponding Table 8 points out that the winner strategy returned by GeneticTA_par utilizes: (i) the cellular bandwidth B U for the upload of the data to be processed by the Cloud; (ii) the backhaul bandwidth B R for forwarding the processed data to the Fog node; and (iii) the WiFi bandwidth R D for the final download of the processed data to the Mobile device.
The final conclusion is that, in the considered operating scenario, the utilization of (single-hop) Cloud-to-Mobile and/or Mobile-to-Fog links is less energy efficient than the exploitation of the (multi-hop) Cloud-Fog-Mobile path.

6.4. The Performance Impact of Different Task and Resource Allocation Strategies

In this section, we compare the energy performances of the (previously-described) task and resource allocation strategies supported by the VirtFogSim toolbox under the considered test DAGs. The three-fold final goal is to acquire some insight about: (i) the energy reduction stemming from the dynamic optimization of the computing-networking resources versus the corresponding case of static resource usage; (ii) the performance gap between the genetic-based and the Exhaustive Search-based allocation strategies; and (iii) the energy-saving capability offered by the Mobile-Fog-Cloud three-tier computing platform of Figure 1 versus the corresponding Mobile only, Mobile-Cloud, and Mobile-Fog ones.
The profiled results are reported in Figure 10, Figure 11 and Figure 12 under DAG1, DAG2, and DAG3, respectively. Their examination gives arise to the following three main sets of remarks.
Dynamic-vs.-static resource allocation: A number of benchmark (even quite recent) contributions [26,30,31,33] afford the problem of the resource augmentation of mobile devices by developing various heuristic/meta-heuristic/optimal solutions for energy-efficient task offloading. However, they neglect considering, indeed, the companion problem of dynamic scaling of the computing and/or network resources. Hence, a key (still pending) question is: how much energy may be actually saved by jointly performing task and dynamic resource allocation? In this regard, we point out that both the GeneticTA_par and O_TAS_par strategies implemented by the VirtFogSim toolbox rely on the same genetic-based meta-heuristic for performing task placement. However, GeneticTA_par also performs dynamic resource allocation by invoking the auxiliary RAP_p function, while O_TAS_par does not scale up/down the involved computing frequencies and wireless bandwidths of Figure 1 and clips them at their corresponding maximum values (see Section 4.2). Hence, a direct comparison of the energies consumed by GeneticTA_par and O_TAS_par allows us to profile how much energy may be saved by performing dynamic resource allocation.
In this regard, an examination of the numerical results reported in the first and second bars of Figure 10, Figure 11 and Figure 12 leads to three main insights. First, the energy ratio: E O _ T A S _ p a r / E G e n e t i c T A _ p a r ranges over the intervals: 2.85–3.50, 3.46–4.10, and: 4.50–4.56 under DAG1, DAG2, and DAG3, respectively. Second, at fixed DAG, the energy savings stemming from performing dynamic resource allocation reaches their maxima at values of T D A G of the order of 0.6–0.9 s, while tending to somewhat decrease at smaller and higher execution delays. Third, the average energy-saving stemming from dynamic optimization is more relevant under DAG3.
Overall, the performed analysis unveils that the dynamic optimization of the allocated computing-networking resources plays, indeed, a pivotal role in reducing the energy consumption of the overall technological platform of Figure 1.
Genetic-vs.-Exhaustive Search performance comparison: The focus of this subsection is on the tradeoffs among energy performance and execution complexity that are attained by the (meta-heuristic) GeneticTA_par and the (optimal) exhaustive E_ESS_par strategies. In this regard, we point out that all the simulations of the GeneticTA_par function are carried out at population size P S = 120 and per-population number of generations G M A X = 100 . In so doing, the resulting computational complexity of the run GeneticTA_par code is of the order of (see Table 4) O 120 × 100 under all test DAGs. At the same time, since the implementation complexity of the E_ESS_par function scales up exponentially as O 3 V 2 with the size V of the considered DAG, the execution of E_ESS_par under DAG3 is out of discussion, while the resulting execution complexities are of the order of O 3 10 and O 3 13 under DAG1 and DAG2, respectively. As a consequence, the (profiled) execution times of E_ESS_par are about five- and 133-times larger than the corresponding ones of GeneticTA_par.
Regarding the analysis of the first bars of Figure 10 and Figure 11, the following three main insights may be drawn. First, under the (small-sized) DAG1, GeneticTA_par and E_ESS_par return the same optimal task and resource allocation patterns at T D A G = 0.3 , 1.5 , 3.0 s. Furthermore, the energy ratio: E G e n e t i c T A _ p a r / E E _ E S S _ p a r is limited up to 1.07 (e.g., 7 % ) in the remaining two cases. Second, under the (medium-sized) DAG2, GeneticTA_par and E_ESS_par share the same energy consumption at T D A G = 0.3 , while the corresponding energy ratio: E G e n e t i c T A _ p a r / E E _ E S S _ p a r is no larger than 1.26 in the other cases.
Overall, the carried out analysis supports the conclusion that the tested implementation of GeneticTA_par is capable of attaining, indeed, good performance-vs.-complexity tradeoffs.
Three tiered-vs.-single and two-tiered execution platforms: A potential drawback of multi-tiered distributed computing platforms is that the number of involved communication links tends to grow with the number of inter-connected tiers, and this may lead, in turn, to an increment of the network component of the overall consumed energy. Hence, the goal of this subsection is to give insight into the following (rather basic) question: What is the net tradeoff among the reduction of the computing energy arising from the utilization of multi-tiered computing nodes and the corresponding increment of the network energy needed for their inter-connection? In order to address this question, the VirtFogSim toolbox makes available the OM_S, OF_S, and OC_S strategies. By design, they utilize only the Mobile device, the two-tiered Fog-Mobile platform, and the two-tier Cloud-Mobile platform for the execution of the application DAGs. Furthermore, all these strategies perform dynamic scaling of the utilized computing frequencies and wireless network bandwidths (see Section 4.2).
Hence, since GeneticTA_par exploits, by design, all the Mobile, Fog, and Cloud nodes of Figure 1 for task placement, a comparative analysis of the energy ratios in the last three bars of Figure 10, Figure 11 and Figure 12 provides a direct response to the above question by providing the following three main insights.
First, the energy ratio: E O M _ S / E G e n e t i c T A _ p a r takes values over the intervals: 2.84–3.84, 3.3–3.9, and 4.8–5.1, under DAG1, DAG2, and DAG3, respectively. The corresponding intervals of the energy ratios: E O F _ S / E G e n e t i c T A _ p a r and E O C _ S / E G e n e t i c T A _ p a r are: 1.53–1.88, 2.0–2.73, 1.23–1.32, and 1.35–1.52, 1.99–2.59, 1.35–1.63, respectively. Hence, in the carried out simulations, the minimum (e.g., worst-case) energy-savings guaranteed by the three-tier Mobile-Fog-Cloud platform over the Mobile, Mobile-Fog, and Mobile-Cloud ones are: 184%, 23% and 35%, respectively.
Second, at fixed T D A G , the average energy savings offered by the Mobile-Fog-Cloud platform over the considered benchmark ones tend to be somewhat more substantial under DAG2. Roughly speaking, this is due to the fact that DAG2 is the parallel combination of three sub-DAGs, whose energy-saving executions “naturally” lead to the simultaneous utilization of all the available Mobile, Fog, and Cloud computing nodes (see Figure 5b).
Third, regarding the comparison of the relative energy performances of the OM_S, OF_S, and OC_S strategies, we may conclude that: (i) the OM_S strategy is the most energy-consuming under all the tested cases; and (ii) in general, the OC_S (resp., OF_S) strategy is more energy saving than the OF_S (resp., OC_S) one under the more regular (resp., more random) DAG1 and DAG2 (resp. DAG3).
As a concluding remark, we point out that the reported numerical results give practical evidence of the support offered by the proposed VirtFogSim toolbox in the analysis and optimization of the multiple performance aspects of the multi-tiered technological platform of Figure 1.

6.5. Scalability of the Simulation Time of the VirtFogSim Toolbox

The two-fold goal of this section is to test the scalability of the execution times of the VirtFogSim toolbox versus both the number of cores available for its execution and the computational complexity of the run task allocation strategies. For this purpose, DAG1 at T D A G = 0.3 has been considered, and then, both the execution times and the total input/output volumes (in MByte) of data transferred to/from the available pool of working cores have been numerically profiled through the tictoc and ticByte–tocByte commands available in the Parallel Toolbox of MATLAB. The attained results are reported by the bar-plots of Figure 13 and Figure 14. Each reported result has been obtained by averaging over 10 independent runs of the (complexity-tunable) GeneticTA_par task allocation strategy.
An examination of the execution times of Figure 13 points out that the speed-up factors attained at n c o r e = 2 , 4, 6, 8, and 10 over the benchmark case of n c o r e = 1 are around 1.91, 3.51, 4.98, 5.94, and 6.60, respectively. Hence, these speed-factors scale in a (quasi-) linear way for values of n c o r e limited up to 3–4, while the scaling becomes more and more sub-linear for larger values of n c o r e . The reason behind this scaling behavior of the execution times is provided by a comparative examination of the corresponding total input/output data traffic generated by the carried out parallel executions. In this regard, the traffic bars of Figure 13 unveil that both the generated volumes of data (which is the most) and the corresponding growing rate increase for increasing values of n c o r e . The resulting net effect is that the experienced execution times become more and more dominated by the corresponding inter-core communication times, so that the corresponding relative decrements in the execution times tend to decrease for large values of n c o r e .
This conclusion is further corroborated by the bar plots of Figure 14. They report the profiled execution times and generated inter-core traffic volumes obtained by running GeneticTA_par for increasing values of the population size P S at fixed n c o r e = 10 . In fact, since the computational complexity of GeneticTA_par scales in a linear way with P S (see Table 4), it could be expected that the same scaling behavior would be also exhibited by the corresponding profiled execution times. However, an examination of the execution-time bars of Figure 14 unveils that the slow-down factors attained at P S = 100 , 150, 200, 250, and 300 against the benchmark case of P S = 50 do not scale, indeed, linearly, and are around 1.76, 2.38, 3.16, 3.40, and 4.53, respectively. Even in this case, the reason is the nonlinear growing behaviors of the corresponding input/output volumes of inter-core data (see the bars of data traffic in Figure 14).
In this regard, we point out that similar trends are also exhibited by the (profiled) execution times of the other parallel functions: ES_S_par and O_TAS_par implemented by the VirtFogSim package.
To conclude this section, we underline that the RAM used by VirtFogSim is essentially that allocated by the MATLAB environment. Additional memory space is used to store all the variables involved by the chosen strategies. This additional memory space depends mainly on the DAG size V and the population size P S , but anyway, it is limited up to the interval 50–150 MB for the tested cases.

7. Conclusions and Future Developments

The actual development of delay-sensitive 5G-supported mobile applications demands for the dynamic profiling and energy optimization of emerging multi-tiered Fog-Cloud virtualized ecosystems. Since field-trials and deployment of test-beds are expensive and could not guarantee repeatable results, the development of customizable simulation toolboxes is welcome. VirtFogSim is compliant with this expectation by developing a new software environment that accounts for the main system parameters featuring the computing and network aspects of Mobile-Fog-Cloud technological platforms. The core engine of the VirtFogSim toolbox allows the optimization, simulation, and tracking of a number of heuristic/meta-heuristic/exhaustive search-based policies for the energy-saving dynamic allocation of tasks and computing-networking resources needed for the delay-constrained execution of mobile applications described by general DAGs. The GUI equipping the VirtFogSim package allows a user-friendly rendering of the simulated data under a number of easy-to-understand graphic formats.
The current version of the VirtFogSim package being the first open-access release, it is amenable to further extensions along three main directions.
According to the underlying 5G paradigm, additional customizable primitives for the profiling and performance simulation of massive MIMO wireless access technologies could provide a first valuable extension [35,36,37]. Furthermore, the current version of the simulator relies on purely reactive formal methods for the dynamic optimization of the needed computing-plus-networking resources. Including pro-active optimization tools that are capable of exploiting mobility-triggered resource forecasting could be second extension of potential interest [38]. Finally, software functionalities for the support and performance evaluation of (possibly, mobility and/or failure-triggered) energy and delay-efficient task migration strategies could represent a third extension of practical interest.

8. Availability of the VirtFogSim Package

The complete software package of the VirtFogSim simulator and the corresponding User Guide may be downloaded for free on the GitHub repository site at: https://github.com/mscarpiniti/VirtFogSim. In addition, it can be downloaded from the authors’ web pages, specifically at: http://enzobaccarelli.site.uniroma1.it, by accessing the section: Downloadable packages.

Author Contributions

The authors contributed equally to this work.

Funding

This work has been supported by the project: “GAUChO—A Green Adaptive Fog Computing and networking Architectures” funded by the MIUR Progetti di Ricerca di Rilevante Interesse Nazionale (PRIN) Bando 2015, Grant 2015YPXH4W_004, and by the projects: “Vehicular Fog energy-efficient QoS mining and dissemination of multimedia Big Data streams (V-Fog and V-Fog2)” and “SoFT: Fog of Social IoT”, funded by Sapienza University of Rome Bando 2016, 2017, and 2018.

Conflicts of Interest

The authors declare no conflict of interest.

Abbreviations

The following main abbreviations are used in this manuscript:
CCCloud Computing
CNTContainer
ESExhaustive Search
DAGDirect Acyclic Graph
FCFog Computing
GUIGraphical User Interface
LANLocal Area Network
NICNetwork Interface Card
OCOnly Cloud
OFOnly Fog
OMOnly Mobile
OTAOnly Task Allocation
VMVirtual Machine
WANWide Area Network

Appendix A. VirtFogSim: Supported Dual-Mode User Interfaces

The current version of the simulator supports two user interfaces, VirtFogSim and VirtFogSim Graphic User Interface (VirtFogSimGUI), respectively. As detailed in the following two sub-sections, both interfaces make available the same set of basic optimization routines of Table 4, and then, they provide the same set of numerical results. However,
  • the VirtFogSim interface is oriented to a scientific use of the simulator. Its utilization requires some basics about the MATLAB environment. Hence, it may be appealing for skilled research users, who desire to work in an interactive way and are mainly interested in checking and optimizing the performance of their own customized DAGs under (possibly multiple) customized simulation setups;
  • the VirtFogSimGUI interface provides a rich set of self-explanatory, ready-to-use native facilities that allow less (or even un-) skilled users to directly run the simulator under a number of pre-loaded (but, in any case, customizable) application scenarios. Hence, since its utilization does not require any specific skill regarding the MATLAB environment, it allows the user to interact with the simulator as a “black-box”. For this purpose: (i) the obtained numerical results are rendered in the form of graphics, colored maps, and plots, in order to make their interpretation and mining more intuitive; and (ii) an easy-to-consult on-line version of this User Guide is also enclosed.
Figure A1. A screen-shoot of the GUI interface.
Applsci 09 01160 g0a1

Appendix A.1. The VirtFogSim Interface

This interface is activated by entering the command: VirtFogSim in the command line of a running MATLAB session. The script acts as the main program of the VirtFogSim package. This script allows the user to select any subset of the natively-supported optimization algorithms by setting some binary flags to one (for running it) or to zero (for not running it) and to choose which DAG should be analyzed by writing the name of the related configuration script. If the user desires to change the configuration, the script defining the DAG can be opened in the editor window of MATLAB.
By programming in the MATLAB language, this allows the user to:
  • edit the desired DAG by setting the corresponding workload vector s , adjacency matrix A, and edge weight matrix D a ;
  • define the desired simulation setup by editing the input parameters listed in Table A2;
  • select any subset of the supported optimization functions of Table 4;
  • resort to the on-line help of MATLAB, in order to display information about any specific function supported by the VirtFogSim package; and,
  • write and call user-defined customized functions that are not natively supported by the current version of the simulator.
Depending on the selected functions (see Table 4), after running VirtFogSim, the attained numerical results are displayed in tabular form, and/or as colored time-plots, and/or as colored bar plots, and/or as colored DAG maps (see Section 5 for additional details about the graphic rendering capabilities and related options supported by the simulator).

Appendix A.2. The VirtFogSimGUI Interface

The GUI interface is open by entering the command: VirtFogSimGUI in the command line of a running MATLAB session. The screen-shoot of the displayed graphic window is reported in Figure A1.
This interface is supported by the MATLAB code: VirtFogSim_Run, which acts as the main script of the overall simulator.
An examination of Figure A1 points out that the GUI interface of the simulator supports seven pre-built functions (namely, Help, Algorithm, Archived DAG, Edit DAG, Save DAG, Run, and Close ), which may be activated by the user by clicking on the corresponding buttons. Table A1 lists these native GUI functions and points out their meaning and associated actions.
Table A1. A synoptic overview of the functionalities offered to the user by the GUI interface.
Available GUI Functions Associated Actions
Help Allows access to the User Guide of the simulator by opening a dedicated PDF file.
Algorithm Allows selecting any subset of the natively-supported optimization algorithms by clicking the corresponding labels.
Archived DAG Allows retrieving an already archived DAG with the corresponding simulation setup, in order to run it.
Edit DAG Allows editing a new DAG and/or a new simulation setup by compiling the list of input parameters of Table A2.
Save DAG Allows saving the last edit of DAG and assigning it an identification label.
Run Allows running the selected optimization algorithm under the retrieved/edit DAG and associated simulation setup.
Close Shuts down the current working session of the VirtFogSim simulator and closes all the figure windows.
From the user perspective, a typical VirtFogGUI-enabled working session should proceed according to the following ordered list of steps:
  • enter VirtFogGUI at the MATLAB prompt, in order to open the GUI interface;
  • click the Help button, in order to access the PDF version of the User Guide. This step is optional;
  • select any desired subset of the supported optimization procedures by clicking the corresponding labels in the Algorithm window. This step is mandatory;
  • retrieve an already stored DAG in . mat format and the associated list of input parameters by accessing the Archived DAG. Alternatively, build a new DAG and set the desired input parameters of Table A by clicking the Edit DAG button. This step is mandatory;
  • store in the Archived DAG database the last edit of DAG in . mat format by clicking the Save DAG button. An identification label for the Save DAG is required. This step is optional;
  • click the Run button, in order to start the execution of the selected algorithms under the (retrieved or edit) selected DAG. At the end of the execution, the attained results are returned in tabular form, and/or as colored time-plots, and/or as colored bar plots, and/or as colored DAG maps (see Section 5 for additional details about the graphic rendering capabilities and related options supported by the simulator);
  • after finishing the current working session of the simulator, click the Close button, in order to shut down the VirtFogSimGUI interface.

Appendix B. Full List of the Input Parameters of VirtFogSim

The following Table A2 reports the full list of the (settable) input parameters of the current Version 4.0 of the simulator, together with their meaning/role, measuring units, and default values used for the simulation of Section 6.
Table A2. Input parameters of the VirtFogSim simulator and their simulated settings of Section 6.
ParameterMeaning/RoleMeasuring UnitsSimulated Settings
VNumber of tasks of the application DAGDimensionless 9 V 45
s V-tuple row vector of the task workloads(bit)Computing- and communi- cation-intensive DAG
A V × V binary (i.e., 0 , 1 ) DAG adjacency matrixDimensionless
D a V × V weight matrix of the (directed) edges of the DAG(bit)Computing- and communi- cation-intensive DAG
n M Number of the (virtual) computing cores equipping the Mobile deviceDimensionless n M = 1
n F Number of the (virtual) computing cores equipping the device clone at the Fog nodeDimensionless n F = 4
n C Number of (virtual) computing cores equipping the device clone at the Cloud nodeDimensionless n C = 12
N F W i F i Average per-connection number of failures of the one-way Mobile→Fog and Fog→Mobile WiFi TCP/IP connectionsDimensionless N F W i F i = 1.1
N F C E L L Average per-connection number of failures of the cellular one-way Mobile→Cloud and Cloud→Mobile TCP/IP connectionsDimensionless N F C E L L = 0.1
N F W D Average per-connection number of failures of the two-way Cloud↔Fog TCP/IP backhaul connectionDimensionless N F W D = 0.01
f M M A X Per-core maximum computing frequency at the Mobile device(bit/s) f M M A X = 12 × 10 6
f F M A X Per-core maximum computing frequency at the Fog clone(bit/s) f F M A X = 12 × 10 6
f C M A X Per-core maximum computing frequency at the Cloud clone(bit/s) f F M A X = 12 × 10 6
R U M A X Maximum bit rate of the WiFi-based one-way Mobile→Fog TCP/IP connection(bit/s) R U M A X = 8.0 × 10 6
R D M A X Maximum bit rate of the WiFi-based one-way Fog→Mobile TCP/IP connection(bit/s) R D M A X = 9.0 × 10 6
B U M A X Maximum bit rate of the cellular one-way Mobile→Cloud TCP/IP connection(bit/s) B U M A X = 6.5 × 10 6
B D M A X Maximum bit rate of the cellular one-way Cloud→Mobile TCP/IP connection(bit/s) B D M A X = 7.0 × 10 6
T H 0 M I N Scalar non-negative real parameter. It is the minimum required application throughput(DAG/s) 0.333 T H 0 M I N 3.33
θ M Binary 0 , 1 -parameter. It depends on the utilized application service model at the Mobile deviceDimensionless θ M = 0 (resp., θ M = 1 ) if computing-plus-networking energy consumed by the Mobile device is (resp., is not) for free
θ F Binary 0 , 1 -parameter. It depends on the utilized application service model at the Fog nodeDimensionless θ F = 0 (resp., θ M = 1 ) if the computing-plus-networking energy consumed by the Fog clone is (resp., is not) for free
θ C Binary 0 , 1 -parameter. It depends on the utilized application service model at the Cloud nodeDimensionless θ C = 0 (resp., θ C = 1 ) if computing-plus-networking energy consumed by the Cloud clone is (resp., is not) for free
P C P U M ( I D L E ) Power consumed in the idle state by the physical CPU at the Mobile device(Watt) P C P U M ( I D L E ) = 1.2
P C P U F ( I D L E ) Power consumed by a single physical server in the idle state at the Fog node(Watt) P C P U F ( I D L E ) = 220
P C P U C ( I D L E ) Power consumed by a single physical server in the idle state at the Cloud node(Watt) P C P U C ( I D L E ) = 440
n c M Number of containers simultaneously running on the Mobile CPUDimensionless n c M = 1
n c F Number of containers simultaneously running on a single physical server at the Fog nodeDimensionless n c F = 16
n c C Number of containers simultaneously running on a single physical server at the Cloud nodeDimensionless n c C = 24
γ M Positive exponent of the dynamic power consumption of the CPU at the Mobile deviceDimensionless γ M = 3.2
γ F Positive exponent of the dynamic power consumption of a single physical server at the Fog nodeDimensionless γ F = 3.1
γ C Positive exponent of the dynamic power consumption of a single physical server at the Cloud nodeDimensionless γ C = 3.0
k M Positive parameter. It profiles the dynamic power consumption of the CPU at the Mobile device(Watt)/(bit/s) γ M k M = 7.5 × 10 21
k F Positive parameter. It profiles the dynamic power consumption of a single physical server at the Fog node(Watt)/(bit/s) γ F k F = 9.78 × 10 20
k C Positive scalar parameter. It profiles the dynamic power consumption of a single physical server at the Cloud node(Watt)/(bit/s) γ C k F = 1.14 × 10 19
r M Scalar fraction of the overall computing power shared by the computing cores at the Mobile deviceDimensionless r M = 0
r F Scalar fraction of the overall computing power shared by the computing cores of a single physical server at the Fog nodeDimensionless r F = 0.2
r C Scalar fraction of the overall computing power shared by the computing cores of a single physical server at the Cloud nodeDimensionless r C = 0.1
P E T H ( I D L E ) Power consumed in the idle state by each physical Ethernet NIC at the Fog and Cloud nodes(Watt) P E T H ( I D L E ) = 10 4
P W i F i M ( I D L E ) Power consumed in the idle state by each physical WiFi NIC at the Mobile device and Fog node(Watt) P W i F i M ( I D L E ) = 1.3
P C E L L M ( I D L E ) Power consumed in the idle state by each physical cellular NIC at the Mobile device and Cloud node(Watt) P C E L L M ( I D L E ) = 0.82
ζ W i F i ( T X ) Positive scalar exponent of the dynamic power consumption of the WiFi NIC in the transmit modeDimensionless ζ W i F i ( T X ) = 2.40
ζ W i F i ( R X ) Positive scalar exponent of the dynamic power consumption of the WiFi NIC in the receive modeDimensionless ζ W i F i ( R X ) = 2.20
ζ C E L L ( T X ) Positive scalar exponent of the dynamic power consumption of the cellular NIC in the transmit modeDimensionless ζ C E L L ( T X ) = 2.45
ζ C E L L ( R X ) Positive exponent of the dynamic power consumption of the cellular NIC in the receive modeDimensionless ζ C E L L ( R X ) = 2.34
η Positive exponent of the Round Trip Times (RTTs) of the TCP/IP WiFi and Cellular connectionsDimensionless η = 0.6
R T T W i F i Average RTT of the TCP/IP WiFi up/down connections(s) R T T W i F i = 1.0 × 10 2
R T T C E L L Average RTT of the TCP/IP cellular up/down connections(s) R T T C E L L = 1.0 × 10 1
R T T W D Average RTT of the (possibly, multi-hop) two-way backhaul(s) R T T W D = 1.0
M S S Maximum size of a TCP segment(bit)Typically M S S = 1.2 × 10 4
P r o b L O S S Loss probability of the Cloud↔Fog TCP/IP connectionDimensionless P r o b L O S S = 1.56 × 10 5
χ W i F i ( T X ) Power profile of the WiFi NIC in the transmit mode ( Watt ) ( bit / s ) ζ W i F i ( T X ) × ( s ) η χ W i F i ( T X ) = 5.0 × 10 14
χ W i F i ( R X ) Power profile of the WiFi NIC in the receive mode ( Watt ) ( bit / s ) ζ W i F i ( R X ) × ( s ) η χ W i F i ( R X ) = 1.4 × 10 14
χ C E L L ( T X ) Power profile of the cellular NIC in the transmit mode ( Watt ) ( bit / s ) ζ C E L L ( T X ) × ( s ) η χ C E L L ( T X ) = 2.31 × 10 13
χ C E L L ( R X ) Power profile of the cellular NIC in the receive mode ( Watt ) ( bit / s ) ζ C E L L ( R X ) × ( s ) η χ C E L L ( R X ) = 8.1 × 10 15
I M A X Maximum number of primal-dual iterations performed by the RAP_p functionDimensionless 500 I M A X 700
a M A X Speed-factor of the iterations performed by the RAP_p functionDimensionless 10 7 a M A X 8 × 10 7
n o H O P Number of hops of the two-way Cloud↔Fog backhaul connectionDimensionless n o H O P = 4
P H O P Per-hop average power consumed the two-way backhaul connection(Watt) P H O P = 5.7 × 10 1
P S Population size of the simulated genetic functions. It must be even and no less than 4Dimensionless 120 P S 400
C F Fraction of the population size that undergoes genetic crossoverDimensionless C F = 0.5
G M A X Positive scalar integer parameter. It is the number of generations run by the genetic functionsDimensionless 20 G M A X 100
M N Number of elements of each task allocation vector that undergo genetic mutationDimensionless M N = round V 2 / 2
a M A X F T 3-tuple vector of positive speed-factors of the gradient-based iterations performed by FogTrackerDimensionlessEach element of the vector a M A X F T is in the range: 7.0 × 10 8 , 9.0 × 10 7
j u m p W i F i 1 Non-negative parameter. It is the first multiply scaling applied by FogTracker to R U M A X and R D M A X Dimensionless j u m p W i F i 1 = 0.0
j u m p C E L L 1 Non-negative parameter. It is the first multiply scaling applied by FogTracker to B U M A X and B D M A X Dimensionless j u m p C E L L 1 = 1.0
j u m p W i F i 2 Non-negative parameter. It is the second multiply scaling applied by FogTracker to R U M A X and R D M A X Dimensionless j u m p W i F i 2 = 1.0
j u m p C E L L 2 Non-negative parameter. It specifies the second multiply scaling applied by FogTracker to B U M A X and B D M A X Dimensionless j u m p C E L L 2 = 0.0
i t e r a t i o n _ n u m b e r Number of iterations performed by FogTracker (must be in multiples of 5)Dimensionless i t e r a t i o n _ n u m b e r = 5 × 10 3

References

  1. Khan, A.U.R.; Othman, M.; Madani, S.A.; Khan, S.U. A survey of mobile cloud computing application models. IEEE Commun. Surv. Tutor. 2014, 16, 393–413. [Google Scholar] [CrossRef]
  2. Gupta, A.; Jha, R.K. A survey of 5G network: Architecture and emerging technologies. IEEE Access 2015, 3, 1206–1232. [Google Scholar] [CrossRef]
  3. Baccarelli, E.; Vinueza Naranjo, P.G.; Scarpiniti, M.; Shojafar, M.; Abawajy, J.H. Fog of Everything: Energy-efficient Networked Computing Architectures, Research Challenges, and a Case Study. IEEE Access 2017, 5, 9882–9910. [Google Scholar] [CrossRef]
  4. Checko, A.; Christiansen, H.L.; Yan, Y.; Scolari, L.; Kardaras, G.; Berger, M.S.; Dittmann, L. Cloud RAN for mobile networks: A technology overview. IEEE Commun. Surv. Tutor. 2015, 17, 405–426. [Google Scholar] [CrossRef]
  5. Baccarelli, E.; Biagi, M.; Bruno, R.; Conti, M.; Gregori, E. Broadband Wireless Access Networks: A Roadmap on Emerging Trends and Standards. In Broadband Services: Business Models and Technologies for Community Networks; Wiley Online Library: Hoboken, NJ, USA, 2005; Chapter 14; pp. 215–240. [Google Scholar] [CrossRef]
  6. Baccarelli, E.; Scarpiniti, M.; Momenzadeh, A. Fog-Supported Delay-Constrained Energy-Saving Live Migration of VMs Over MultiPath TCP/IP 5G Connections. IEEE Access 2018, 6, 42327–42354. [Google Scholar] [CrossRef]
  7. Pahl, C.; Brogi, A.; Soldani, J.; Jamshidi, P. Cloud container technologies: A state-of-the-art review. IEEE Trans. Cloud Comput. 2017. [Google Scholar] [CrossRef]
  8. Calheiros, R.N.; Ranjan, R.; Beloglazov, A.; De Rose, C.A.; Buyya, R. CloudSim: A toolkit for modeling and simulation of cloud computing environments and evaluation of resource provisioning algorithms. Softw. Pract. Exp. 2011, 41, 23–50. [Google Scholar] [CrossRef]
  9. Kliazovich, D.; Bouvry, P.; Audzevich, Y.; Khan, S.U. GreenCloud: A packet-level simulator of energy-aware cloud computing data centers. In Proceedings of the 2010 IEEE Global Telecommunications Conference (GLOBECOM 2010), Miami, FL, USA, 6–10 December 2010. [Google Scholar] [CrossRef]
  10. Núñez, A.; Vázquez-Poletti, J.L.; Camineiro, A.C.; Castañé, G.G.; Carretero, J.; Llorente, I.M. iCanCloud: A flexible and scalable cloud infrastructure simulator. J. Grid Comput. 2012, 10, 185–209. [Google Scholar] [CrossRef]
  11. Sotiriadis, S.; Bessis, N.; Asimakopoulos, E.; Mustafee, N. Towards simulating the Internet of Things. In Proceedings of the 28th International Conference on Advanced Information Networking and Application Workshops, Victoria, BC, Canada, 13–16 May 2014. [Google Scholar] [CrossRef]
  12. Zeng, X.; Garg, S.K.; Strazdnis, P.; Jayaraman, P.; Georgakopoulos, D.; Ranjan, R. IOTSim: A simulator for analysing IoT applications. J. Syst. Archit. 2017, 72, 93–107. [Google Scholar] [CrossRef]
  13. Gupta, H.; Dastjerdi, A.V.; Ghosh, S.K.; Buyya, R. iFogSim: A toolkit for modeling and simulation of resource management techniques in the Internet of Things, Edge and Fog computing environments. Softw. Pract. Exp. 2017, 47, 1275–1296. [Google Scholar] [CrossRef] [Green Version]
  14. Sotiriadis, S.; Bessis, N.; Antonopoulos, N.; Anjum, A. SimIC: Designing a new inter-cloud simulation platform for integrating large-scale resource management. In Proceedings of the 27th IEEEE International Conference on Advanced Information Networking and Applications (ANIA 2013), Barcelona, Spain, 25–28 March 2013. [Google Scholar] [CrossRef]
  15. Sonmez, C.; Ozgovde, A.; Ersoy, C. EdgeCloudSim: An environment for performance evaluation of Edge Computing systems. Trans. Emerg. Telecommun. Technol. 2018, 29, e3493. [Google Scholar] [CrossRef]
  16. Padhye, J.; Firoiu, V.; Towsley, D.; Kurose, J. Modeling TCP throughput: A simple model and its empirical validation. In Proceedings of the ACM SIGCOMM ’98 Conference on Applications, Technologies, Architectures, and Protocols for Computer Communication, Vancouver, BC, Canada, 31 August–4 September 1998; ACM: New York, NY, USA, 1998; pp. 303–314. [Google Scholar] [CrossRef]
  17. Vallina-Rodriguez, N.; Crowcroft, J. Energy management techniques in modern mobile handsets. IEEE Commun. Surv. Tutor. 2013, 15, 179–198. [Google Scholar] [CrossRef]
  18. Altamimi, M.; Abdrabou, A.; Naik, K.; Nayak, A. Energy cost models of smartphones for task offloading to the cloud. IEEE Trans. Emerg. Top. Comput. 2015, 3, 384–398. [Google Scholar] [CrossRef]
  19. Kwak, J.; Choi, O.; Chong, S.; Mohapatra, P. Processor-network speed scaling for energy: Delay tradeoff in smartphone applications. IEEE/ACM Trans. Netw. 2016, 24, 1647–1660. [Google Scholar] [CrossRef]
  20. Zhang, L.; Tiwana, B.; Qian, Z.; Wang, Z.; Dick, R.P.; Mao, Z.M.; Yang, L. Accurate online power estimation and automatic battery behavior based power model generation for smartphones. In Proceedings of the 2010 IEEE/ACM/IFIP International Conference on Hardware/Software Codesign and System Synthesis (CODES+ISSS), Scottsdale, AZ, USA, 24–29 October 2010; pp. 105–114. [Google Scholar]
  21. Huang, J.; Qian, F.; Gerber, A.; Mao, Z.M.; Sen, S.; Spatscheck, O. A close examination of performance and power characteristics of 4G LTE networks. In Proceedings of the 10-th International Conference on Mobile Systems, Applications, and Services, Lake District, UK, 25–29 June 2010; ACM: New York, NY, USA, 2012; pp. 225–238. [Google Scholar] [CrossRef]
  22. Xiao, Y.; Cui, Y.; Savolainen, P.; Siekkinen, M.; Wang, A.; Yang, L.; Ylä-Jääski, A.; Tarkoma, S. Modeling energy consumption of data transmission over Wi-Fi. IEEE Trans. Mob. Comput. 2014, 13, 1760–1773. [Google Scholar] [CrossRef]
  23. Lim, Y.s.; Chen, Y.C.; Nahum, E.M.; Towsley, D.; Gibbens, R.J. Improving energy efficiency of MPTCP for mobile devices. arXiv, 2014; arXiv:1406.4463. [Google Scholar]
  24. Mukherjee, A.; De, D.; Roy, D.G. A power and latency aware cloudlet selection strategy for multi-cloudlet environment. IEEE Transa. Cloud Comput. 2016, 7, 141–154. [Google Scholar] [CrossRef]
  25. Yang, S.; Kwon, D.; Yi, H.; Cho, Y.; Kwon, Y.; Paek, Y. Techniques to minimize state transfer costs for dynamic execution offloading in mobile cloud computing. IEEE Trans. Mob. Comput. 2014, 13, 2648–2660. [Google Scholar] [CrossRef]
  26. Yang, L.; Cao, J.; Yuan, Y.; Li, T.; Han, A.; Chan, A. A framework for partitioning and execution of data stream applications in mobile cloud computing. ACM SIGMETRICS Perform. Eval. Rev. 2013, 40, 23–32. [Google Scholar] [CrossRef]
  27. De Maio, V.; Brandic, I. First hop mobile offloading of dag computations. In Proceedings of the 18th IEEE/ACM International Symposium on Cluster, Cloud and Grid Computing (CCGRID 2018), Washington, DC, USA, 1–4 May2018; pp. 83–92. [Google Scholar] [CrossRef]
  28. Peng, Q.; Walid, A.; Hwang, J.; Low, S.H. Multipath TCP: Analysis, design, and implementation. IEEE/ACM Trans. Netw. 2016, 24, 596–609. [Google Scholar] [CrossRef]
  29. Topcuoglu, H.; Hariri, S.; Wu, M.Y. Performance-effective and low-complexity task scheduling for heterogeneous computing. IEEE Trans. Parallel Distrib. Syst. 2002, 13, 260–274. [Google Scholar] [CrossRef] [Green Version]
  30. Cuervo, E.; Balasubramanian, A.; Cho, D.K.; Wolman, A.; Saroiu, S.; Chandra, R.; Bahl, P. MAUI: Making smartphones last longer with code offload. In Proceedings of the 8th International Conference on Mobile Systems, Applications, and Services, San Francisco, CA, USA, 5–18 June 2010; ACM: New York, NY, USA, 2010; pp. 49–62. [Google Scholar] [CrossRef]
  31. Ra, M.R.; Sheth, A.; Mummert, L.; Pillai, P.; Wetherall, D.; Govindan, R. Odessa: Enabling interactive perception applications on mobile devices. In Proceedings of the 9-th International Conference on Mobile Systems, Applications, and Services, Bethesda, MD, USA, 28 June–1 July 2011; ACM: New York, NY, USA, 2011; pp. 43–56. [Google Scholar] [CrossRef]
  32. Juve, G.; Chervenak, A.; Deelman, E.; Bharathi, S.; Mehta, G.; Vahi, K. Characterizing and profiling scientific workflows. Future Gener. Comput. Syst. 2013, 29, 682–692. [Google Scholar] [CrossRef]
  33. Mahmoodi, S.E.; Uma, R.; Subbalakshmi, K. Optimal joint scheduling and cloud offloading for mobile applications. IEEE Trans. Cloud Comput. 2016. [Google Scholar] [CrossRef]
  34. Sarkar, A.; Gosh, A.; Nath, A. MapReduce: A comprehensive study on applications, scope and challenges. Int. J. Adv. Res. Comput. Sci. Manag. Stud. 2015, 3, 256–272. [Google Scholar]
  35. Baccarelli, E.; Biagi, M. Performance and optimized design of space-time codes for MIMO wireless systems with imperfect channel estimates. IEEE Trans. Signal Process. 2004, 52, 2911–2923. [Google Scholar] [CrossRef]
  36. Baccarelli, E.; Biagi, M.; Pelizzoni, C. On the information throughput and optimized power allocation for MIMO wireless systems with imperfect channel estimation. IEEE Trans. Signal Process. 2005, 53, 2335–2347. [Google Scholar] [CrossRef]
  37. Baccarelli, E.; Biagi, M. Power-allocation policy and optimized design of multiple-antenna systems with imperfect channel estimation. IEEE Trans. Veh. Technol. 2004, 53, 136–145. [Google Scholar] [CrossRef]
  38. Baccarelli, E.; Cusani, R. Recursive Kalman-type optimal estimation and detection of hidden Markov chains. Signal Process. 1996, 51, 55–64. [Google Scholar] [CrossRef]
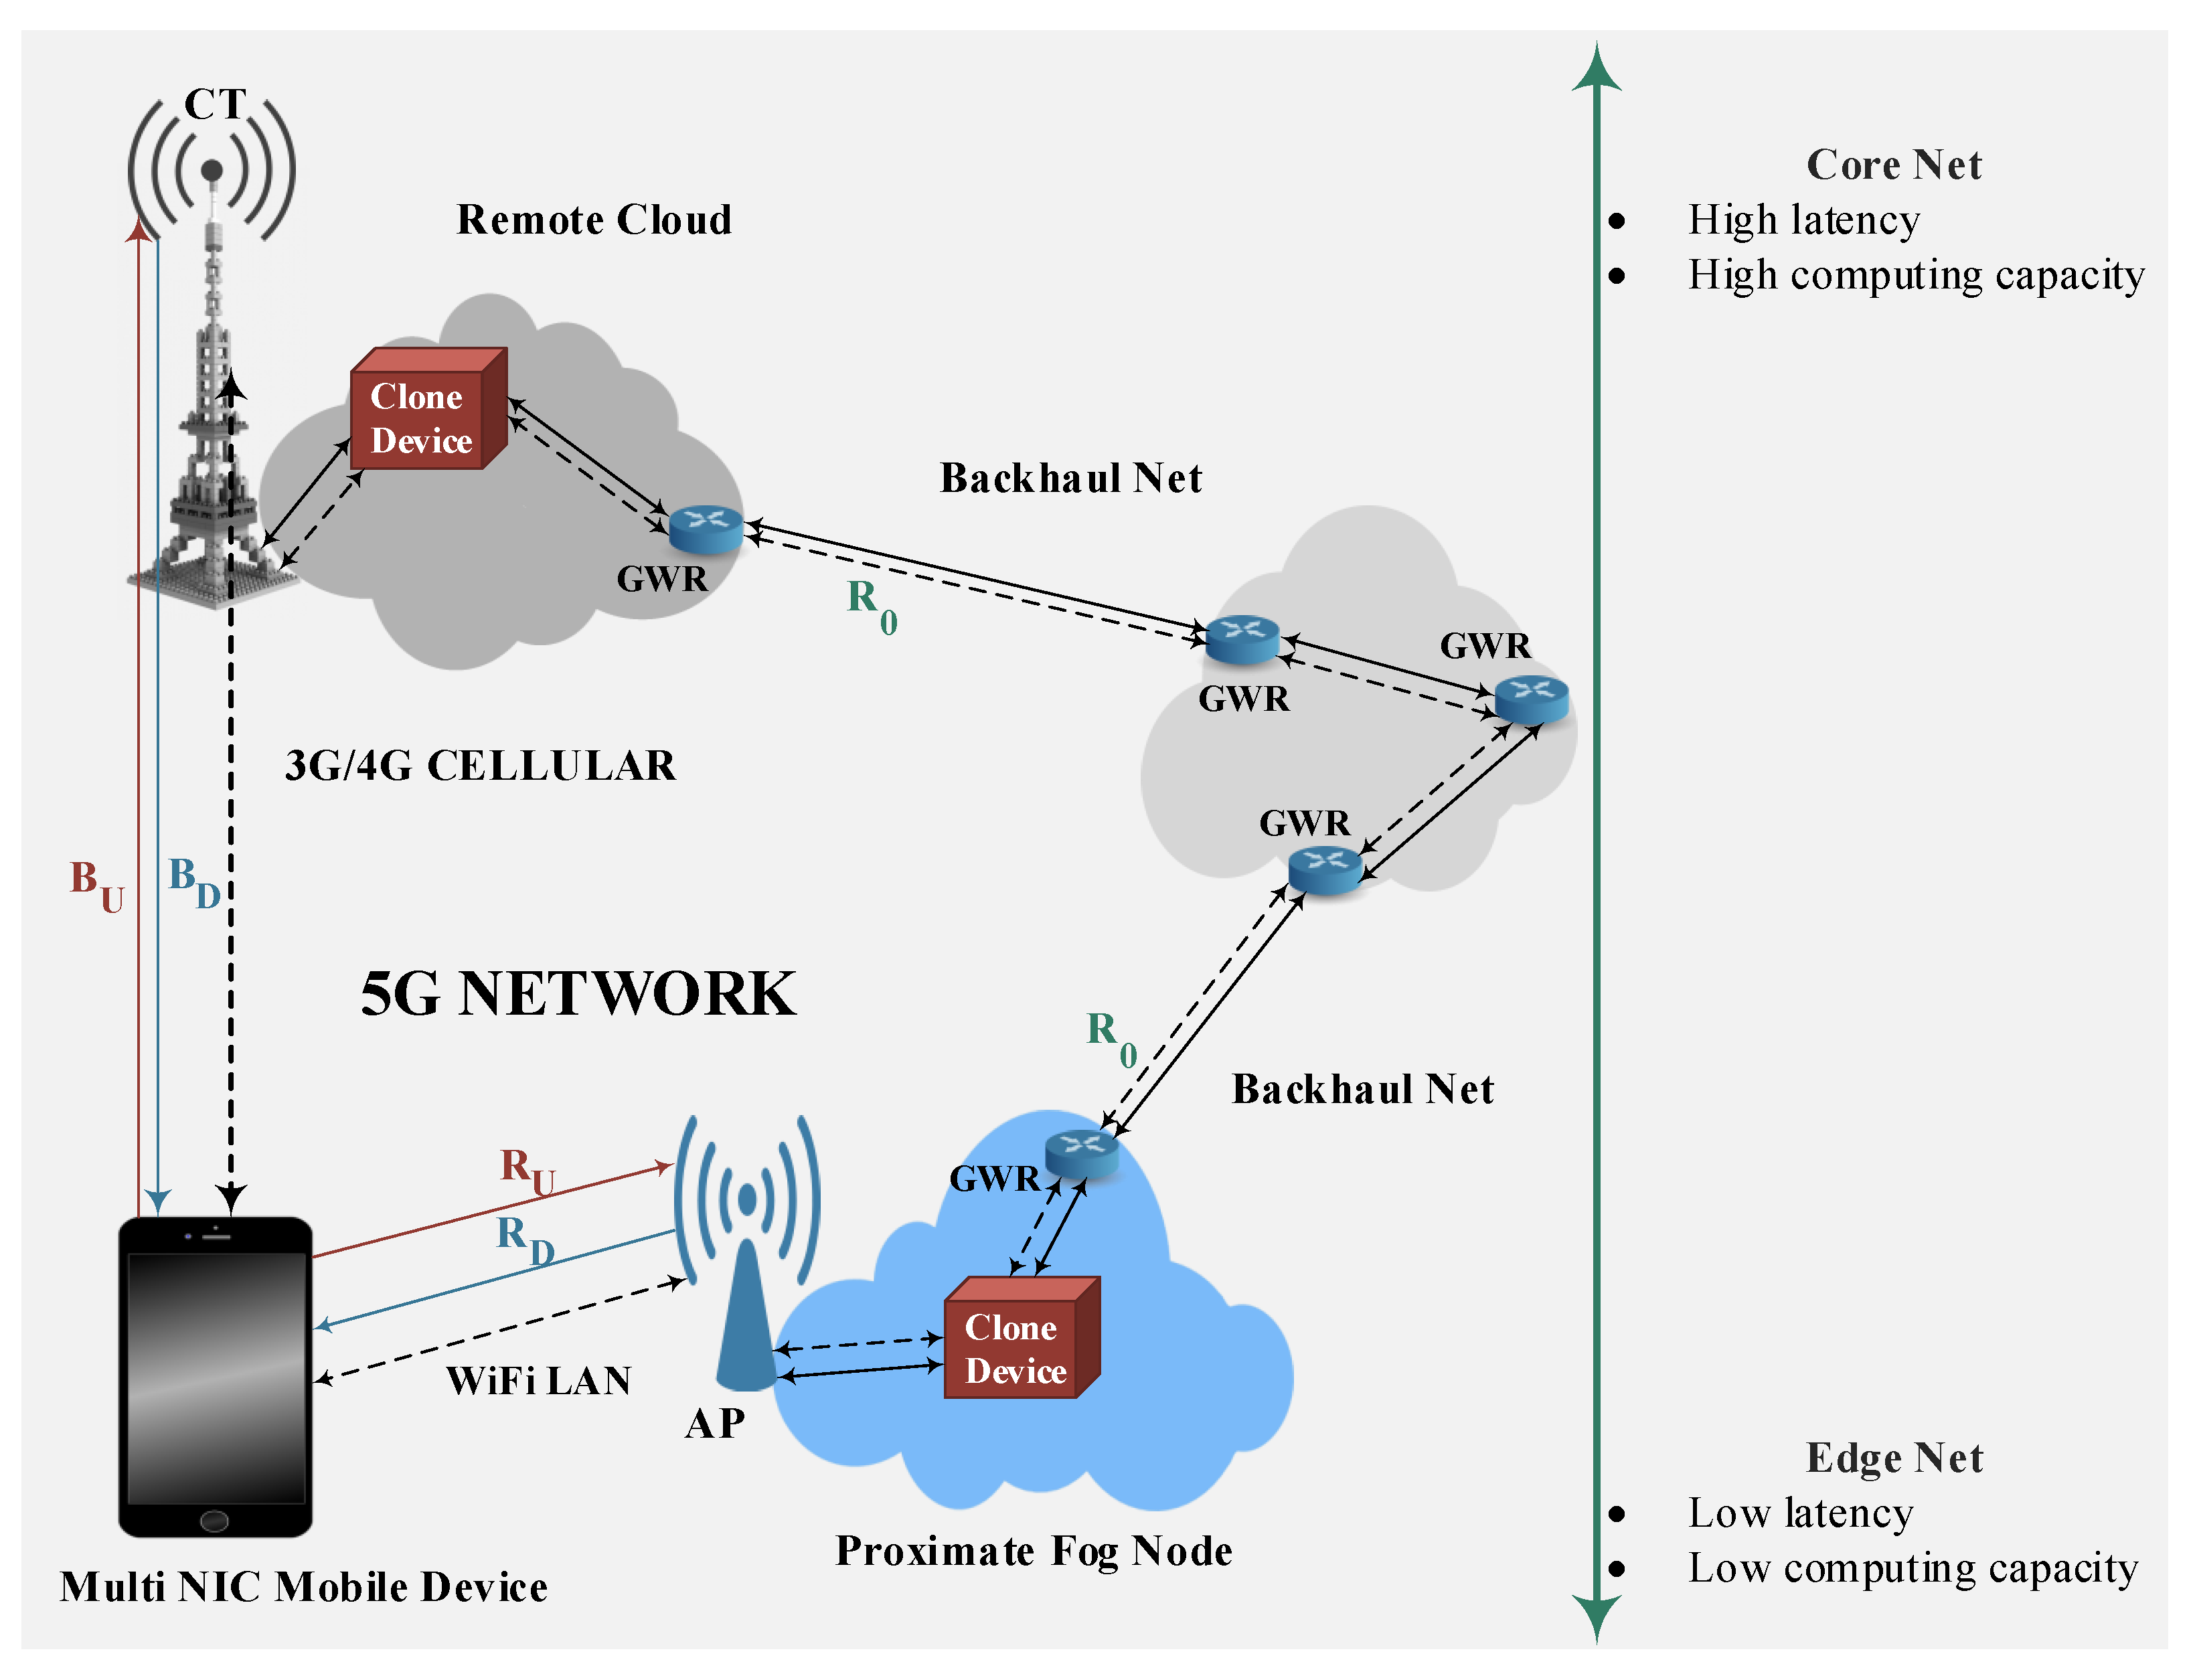
Figure 1. The considered 5G-supported Mobile-Fog-Cloud virtualized infrastructure. WAN: Wide Area Network; LAN: Local Area Network; CT: Cellular Tower; AP: Access Point; GWR: GateWay Router. Single (resp., double)-arrowed paths indicate one-way (resp., two-way) TCP/IP connections.
Applsci 09 01160 g001
Figure 2. A toy example illustrating the energy-saving capability of multi-tiered Mobile-Fog-Cloud computing platforms that employ both WiFi and Cellular links, in order to connect the computing nodes.
Applsci 09 01160 g002
Figure 3. An illustrative screen-shoot of the bar-plots rendered by the execution of the GeneticTA_par function. (top) reported task allocation; (middle) reported resource allocation; (bottom) consumed total and network energies. Analogous bar-plot graphs are reported at the end of the executions of the other task allocation strategies supported by VirtFogSim.
Applsci 09 01160 g003
Figure 4. An illustrative screen-shoot of the colored task map DAG rendered by the execution of the GeneticTA_par function. Analogous bar-plot graphs are reported at the end of the executions of the other task allocation strategies supported by VirtFogSim.
Applsci 09 01160 g004
Figure 5. Graphs of the tested DAGS. (a) DAG1 and (b) DAG2. All the numeric labels are in Kbit. The total workload (e.g., summation of the node labels) and inter-node traffic (e.g., summation of the edge weights) of the test DAGs are the same. They equate to 3.32 (Mbit) and 1.66 (Mbit), respectively.
Applsci 09 01160 g005aApplsci 09 01160 g005b
Figure 6. Graphs of the tested DAG3. All the numeric labels are in Kbit. The total workload (e.g., summation of the node labels) and inter-node traffic (e.g., summation of the edge weights) of the test DAGs are the same. They equate to 3.32 (Mbit) and 1.66 (Mbit), respectively.
Applsci 09 01160 g006
Figure 7. Tracking performance under DAG1 for three values of the speed-factor a M A X . (a) time behaviors of the total energy E T O T ; (b) time behaviors of the corresponding network energy E N E T ; and (c) time behaviors of the λ multiplier.
Applsci 09 01160 g007
Figure 8. Tracking performance under DAG2 for three values of the speed-factor a M A X . (a) time behaviors of the total energy E T O T ; (b) time behaviors of the corresponding network energy E N E T ; and (c) time behaviors of the λ multiplier.
Applsci 09 01160 g008
Figure 9. Tracking performance under DAG3 for three values of the speed-factor a M A X . (a) time behaviors of the total energy E T O T ; (b) time behaviors of the corresponding network energy E N E T ; and (c) time behaviors of the λ multiplier.
Applsci 09 01160 g009
Figure 10. Energy ratios returned by VirtFogSim under DAG1 for T D A G = 0.3 s, 0.6 s, 0.9 s, 1.2 s, and 1.5 s. All the reported ratio values are normalized with respect to the corresponding total energies consumed by ES_S_par.
Applsci 09 01160 g010
Figure 11. Energy ratios returned by VirtFogSim under DAG2 for T D A G = 0.3 s, 0.6 s, 0.9 s, 1.2 s, and 1.5 s. All the reported ratio values are normalized with respect to the corresponding total energies consumed by ES_S_par.
Applsci 09 01160 g011
Figure 12. Energy ratios returned by VirtFogSim under DAG3 for T D A G = 0.3 s, 0.6 s, 0.9 s, 1.2 s, and 1.5 s. All the reported ratio values are normalized with respect to the corresponding total energies consumed by GeneticTA_par.
Applsci 09 01160 g012
Figure 13. Bar-plots profiling the simulation times and corresponding input/output data traffics generated by parallel executions of GeneticTA_par for increasing values of the number n c o r e of the employed cores under DAG1 at P S = 300 . The case: n c o r e = 1 corresponds to the sequential execution of GeneticTA_par.
Applsci 09 01160 g013
Figure 14. Bar-plots profiling the simulation times and corresponding input/output data traffics generated by parallel executions of GeneticTA_par for increasing values of the population size P S . The case of DAG1 at n c o r e = 10 .
Applsci 09 01160 g014
Table 1. The expected Fog-Cloud-5G synergic interplay for the support of future computing-intensive and delay-critical Mobile applications.
FOGCLOUD5G
Distributed deployment and low-access latencyFog nodes are expected to undergo a pervasive deployment. This reduces the access distance and, then, the resulting propagation delayCentralized deployment and high-access latencyCloud data centers typically serve large spatial areas and, then, incur high propagation delaysReal-time support for heterogeneous network technologiesA number of ultra-short-/short-/long- range UWB/WiFi/ 3G-4G Cellular network technologies are simultaneously supported and dynamically turned ON-OFF
Low-density resource virtualizationClones of the served mobile devices may be allocated onto medium-/small-sized Fog servers in real time. In order to reduce the resulting bootstrapping delays, light low-density virtualization technologies are employedHigh-density resource virtualizationClones of the served devices are quasi-statically deployed by resorting to high-density virtualization of the computing resources of large serversDynamic provisioning, multiplexing, and isolation of the wireless bandwidthWireless bandwidth is dynamically provided on-demand to the requiring Mobile devices. Dynamic multiplexing is used, in order to provide inter-device isolation and per-device bandwidth guarantee.
Support for light delay-sensitive Mobile applicationsFog nodes may exploit low-latency WiFi links, in order to enable seamless light data/code offloading from Mobile devicesSupport for computing-intensive delay-tolerant applicationsBy exploiting the their huge computing resources, Cloud data centers may support computing-intensive delay-tolerant applications offloaded by remote devicesBandwidth poolingThe simultaneous utilization of multiple transmission technologies allows increasing the total available wireless bandwidth
Energy efficientResource-limited Mobile devices may save energy by exploiting nearby Fog nodes as computing clonesEnergy hungryBoth network and server infrastructures hosted by Cloud data centers are resource-rich, but energy hungryUltra-low access latencySub-millisecond access delays are achieved by the synergic exploitation of multiple network technologies
Table 2. Main functions implemented by VirtFogSim.
FunctionDescription
y ˜ , E ˜ T O T , E ˜ N E T = RAP _ p x , z , s , D a , S R A P It implements the Resource Allocation Problem described in Equation (4).
E a u x , E a u x N E T , λ a u x = FogTracker x 1 , x 2 , x 3 It tests the convergence rate to the steady-state and the steady-state stability of the primal-dual iterations performed by the RAP_p function when abrupt changes happen.
x b e s t , R S b e s t , E b e s t , E b e s t N E T , R B b e s t = GeneticTA _ par It runs the parallel Genetic Task Allocation strategy.
R S O M , E O M , E O M N E T = OM _ S It runs the Only Mobile strategy.
R S O F , E O F , E O F N E T = OF _ S It runs the Only Fog strategy.
R S O C , E O C , E O C N E T = OC _ S It runs the Only Cloud strategy.
x O T A S , E O T A S , E O T A S N E T = O _ TAS _ par It runs the Only Task Allocation strategy.
x E S S , R S E S S , E E S S , E E S S N E T , R B E S S = ES _ S It runs the Exhaustive Search strategy.
Table 3. Auxiliary functions implemented by VirtFogSim.
FunctionDescription
C h i l d v 1 , C h i l d v 2 = Crossover P a r e n t v 1 , P a r e n t v 2 It implements the Crossover operation.
o u t v = Mutation x v It implements the Mutation operation.
E a u x , E N E T = evaluatestaticenergy _ p x v , s , A , D a , S R A P It evaluates the static energy evaluation in O_TAS.
T A = find _ allocations N , K It returns all the K N patterns of N numbers that can assume the first K integer values: 0 , 1 , 2 , , K 1 .
Table 4. A synoptic overview of the computational complexities of the main functions supported by the VirtFogSim package.
FunctionAsymptotic Computational Complexity
GeneticTA_par O P S × G M A X × 8 × I M A X / n c o r e
OM_S O 8 × I M A X
OF_S O 8 × I M A X
OC_S O 8 × I M A X
O_TAS_par O P S × G M A X / n c o r e
ES_S O 3 V 2 × 8 × G M A X / n c o r e
FogTracker O 8 × i t e r a t i o n _ n u m b e r × 3
Table 5. Rendering functions for the supported formats implemented in VirtFogSim.
FunctionDescription
print_solution R S , E , R B , s t r a t e g y It implements the tabular format.
plot_solution x , R S , E , R B , f i g n u m b e r , s t r a t e g y It implements the colored bar plot format.
plot_DAG s , A , D a , x , s t r a t e g y , t y p e It implements the colored labeled DAG map.
plot_FogTracker E m , E m N E T , λ m , f i g n u m b e r , i n t e r p o l a t i o n It implements the colored time plot format.
Table 6. Task, resource allocation, and energy consumption returned by GeneticTA_par under DAG1. Resources are measured in Mbit/s and energies in Joule.
T DAG Mobile TasksFog TasksCloud Tasks f M f F f C R U R D B U B D BR E TOT E NET
0.3 1 , 12 3 , 7 9 , 11 2 , 4 6 , 10 11.813.002.507.428.253.961.160.031.8116.72
0.6 1 , 12 3 , 7 9 , 11 2 , 4 6 , 10 11.752.382.476.977.612.310.950.028.7613.70
0.9 1 , 3 , 12 2 , 4 11 11.600.002.000.000.000.750.760.027.5911.38
1.5 1 , 3 , 12 2 , 4 11 11.501.820.006.757.150.000.000.026.119.48
3.0 1 , 2 , 3 , 12 4 11 11.351.790.006.727.100.000.000.025.759.45
Table 7. Task, resource allocation, and energy consumption returned by GeneticTA_par under DAG2. Resources are measured in Mbit/s and energies in Joule.
T DAG Mobile TasksFog TasksCloud Tasks f M f F f C R U R D B U B D BR E TOT E NET
0.3 1 , 7 , 10 12 , 14 , 15 2 , 3 , 8 , 13 4 6 , 9 11.902.472.487.508.510.956.640.027.098.45
0.6 1 , 7 , 10 12 , 14 , 15 2 , 3 , 8 , 13 4 6 , 9 11.802.352.377.358.390.936.520.026.788.35
0.9 1 , 7 , 10 12 , 14 , 15 2 6 , 8 , 9 , 13 11.681.830.006.858.210.000.000.023.637.33
1.5 1 , 7 , 10 12 , 14 , 15 2 6 , 8 , 9 , 13 11.581.730.006.658.110.000.000.022.817.30
3.0 1 3 , 7 , 8 , 10 12 , 14 , 15 4 6 , 9 10.981.640.006.558.010.000.000.022.507.22
Table 8. Task, resource allocation, and energy consumption returned by GeneticTA_par under DAG3. Resources are measured in Mbit/s and energies in Joule.
T DAG Mobile TasksFog TasksCloud Tasks f M f F f C R U R D B U B D BR E TOT E NET
0.3 1 , 41 39 , 40 2 38 11.924.372.740.006.270.950.003.7018.376.16
0.6 1 , 41 39 , 40 2 38 11.904.352.480.006.260.940.003.7017.856.02
0.9 1 , 41 38 40 2 37 11.774.252.470.006.250.950.003.7017.606.01
1.5 1 , 41 35 40 2 34 11.675.012.450.006.230.920.003.7017.175.81
3.0 1 , 41 34 40 2 33 11.504.052.370.006.090.900.003.7017.175.78