Article

Bandwidth and BER Improvement Employing a Pre-Equalization Circuit with White LED Arrays in a MISO VLC System

1
Arab Academy for Science, Technology and Maritime Transport, Alexandria 1029, Egypt
2
The Optical Society, Washington, DC 20036, USA
*
Author to whom correspondence should be addressed.
Appl. Sci. 2019, 9(5), 986; https://doi.org/10.3390/app9050986
Submission received: 1 February 2019 / Revised: 27 February 2019 / Accepted: 3 March 2019 / Published: 8 March 2019
(This article belongs to the Special Issue Light Communication: Latest Advances and Prospects)

Abstract

:
This paper aims to extend the limited bandwidth of phosphorescent white LEDs for a multiple-input single-output (MISO) visible light communication (VLC) system. A proposed LED arrangement model is presented, resulting in improved results as compared to those previously discussed in the literature. In this paper, the impact of the receiver field of view (FOV) angle, the LED transmission angle, and the number of LED arrays used on the transmission are studied at different speeds. The system performance is measured by the signal to noise ratio (SNR) and the corresponding bit error rate (BER) at different data rates. The obtained results show that the proposed model is able to improve the illumination uniformity across the room with a higher SNR using the same number of LEDs in the investigated indoor environment. The paper also introduces a pre-equalization circuit in the transmitter end in order to extend the limited bandwidth of the used white LEDs. This bandwidth extension using the proposed circuit results in an increased data rate with the aid of a blue filter. A number of experiments are executed to optimize the key parameters for maximum bandwidth enhancement. The proposed circuit offers 28% bandwidth enhancement over the most recent study in this area while eradicating the BER at 200 Mb/s when compared to un-equalized LED circuits.

1. Introduction

The limitation of the radio frequency (RF) spectrum can now be overcome by optical wireless communication (OWC) [1]. Specifically, in indoor environments, OWC provides wide unlicensed bandwidths that enable wireless home networking systems to offload their data traffic as an alternative to existing RF systems. In addition, OWC is immune to interference from electromagnetic sources and are secure by design, as light cannot penetrate walls. The availability of light emitting diodes (LEDs) with high luminance resulted in inexpensive and efficient illumination devices [2]. These devices will soon replace the existing fluorescent lamps and light bulbs, paving the way for a new technology known as Light Fidelity (Li-Fi) that utilizes visible light communications (VLC). In VLC, LEDs have a dual functionality of both illumination and data transmission by modulating light intensity at a rate that cannot be detected by human eyes. Due to its perception, VLC is considered secure, power efficient, and does not raise health concerns, making it a very promising technology for high-speed communications. However, commercially available LEDs have a limited modulation capability; hence, the transmission bandwidth of practical VLC systems is restricted.
In home and office environments, a typical indoor light fixture should provide illumination levels of about 200–1000 lux, depending on the performed tasks requirements [3]. For general illumination, white colored LEDs are more desirable than single colored (i.e., red, green, yellow, blue, etc.). White light is either emitted by mixing red, green, and blue colored LEDs (i.e., RGB white LEDs) or combining phosphor with a blue LED (i.e., phosphor white LEDs). Phosphor white LEDs are more commonly used because they are easier to implement at lower costs. However, the phosphor coating limits its switching speed to only few MHz. The phosphor-based LED typically consists of a blue LED chip covered by a yellow phosphor layer. However, when this phosphor-based LED is used for the VLC, the modulation bandwidth is limited by the long relaxation time of the phosphor, limiting the transmission capacity of the VLC. White LEDs are usually blue InGaN LEDs with a coating of a suitable material. Cerium(III)-doped YAG (YAG:Ce3+, or Y3Al5O12:Ce3+) is often used with a decay constant in the range of tens of nanoseconds [4]. Techniques such as blue-filtering [5] as well as pre-equalization [6,7] and post-equalization [8] are different techniques reported in the literature to extend both bandwidths and data rates. In Reference [5], even though blue-filtering achieved a significant bit-error-rate (BER) enhancement, the communication distance was limited to just 30 cm. Post-equalization techniques, as in Reference [8], are performed at the receiver’s end, which results in noise magnification and limits the communication distance in the cm range. The most recent bandwidth extension by pre/post-equalization circuits was reported by Huang et al. [9], yet the bandwidth was only extended to 304 MHz. Other researchers apply different modulation formats such as orthogonal frequency division multiplexing (OFDM) [10,11]. However, complex modulation techniques increase the system’s architecture complexity. On the other hand, in order to mitigate the limitations of LED-based multiple-input multiple-output (MIMO) VLC systems, previously conducted credible studies were scrutinized to understand their strengths and weaknesses [12,13,14,15].
The contributions of this paper can be divided into two parts. Initially, a new LED array pattern is proposed in an indoor VLC system in order to achieve a more uniform light (i.e., illumination) distribution. The impact of both the receiver and the transmitter angles on the transmission performance of the proposed model is studied and the output is compared with other related distribution patterns in the literature maintaining the same number of LEDs used. Additionally, the SNR and BER performances of the proposed systems are measured to compare the system performances for all investigated distribution LED patterns. The paper also studies the impact of increasing the number of arrays to further investigate the factors affecting system performance. Then, due to the bandwidth limitation of the blue phosphorus white LED used, this paper proposes a new designed pre-equalization circuit in order to overcome such limitations. The proposed analog pre-emphasis circuit is used to further extend the LED bandwidth with the aid of blue filtering to reach 416 MHz, which is the widest bandwidth reported in the literature to the best of the authors’ knowledge. In the following section, the simulated MISO VLC system model using MATLAB is first presented, and then, the impacts of the studied parameters of the different distribution patterns on the system performance are compared. In Section 3, the equalization circuit is described, and the corresponding results are displayed and discussed in Section 4. Section 5 is devoted to the main findings of the paper.

2. MISO VLC System Model

The VLC system parameters that are used in References [12,13,14,15] are initially adopted (see Table 1) in this paper to compare the system performances of the different LED arrangements. The transmitters consist of 2-D rectangular white LED [16] arrays of low intensities. These array patterns are distributed as shown in Figure 1 along the ceiling.
Phosphorescent white LEDs used in this paper are assumed to generate a Lambertian radiation pattern. At the receiving plane, the radiation intensity is given by Reference [3].
I ( ) = I ( 0 ) c o s m l ( )
where is the irradiance angle with respect to the axis perpendicular to the transmitter surface. I(0) is the center luminous intensity, and   m l is the Lambertian emission order which is defined by:
m l = l n ( 2 ) l n ( cos 1 / 2 )
where 1 / 2 is the LED semi-angle at half illuminance.
On the other hand, the received power is given by Reference [3]:
P r = ( H L O S ( 0 ) + H n L O S ( 0 ) ) P t = ( H L O S ( 0 ) + r e f l H r e f l ( 0 ) ) P t
where the transmitted power is Pt, HLOS(0) is the LOS link DC gain, HnLOS(0) is the non-LOS link DC gain, and Hrefl(0) represents the reflected path DC gain.
The DC gain for a LOS link receiver with a Lambertian source can be approximated as [3]:
H L O S ( 0 ) = { A r ( m l + 1 ) 2 π d 2 c o s m l ( ) T s ( φ ) g ( φ ) cos ( φ ) 0 φ φ c o n 0 elsewhere
where φ is the incident angle to the axis perpendicular to the receiver surface. The incident angle is given that 0 φ φ c o n , where φcon is the field-of-view (FOV) receiver angle. The receiver area is Ar, while Ts(φ) and g ( φ ) are the filter transmission coefficient and the concentrator gain, respectively. The distance between the LED source and the photodetector surface is d.
The reflected path DC gain is given by [14]:
H r e f l ( 0 ) = { ( m l + 1 ) 2 π d 1 2 d 2 2 ρ d A w a l l c o s m l ( ) cos ( α ) cos ( β ) T s ( φ ) g ( φ ) cos ( φ ) 0 φ φ c 0 elsewhere
where the distance between the LED source and a reflection point is d1, the distance between a reflection point and the receiver surface is d2, and ρ is the reflectance coefficient. The reflective area of a small region is dAwall, α is the incident angle to a reflection point, and β is the irradiance angle to the receiver.
The power radiated among the room from the three different array patterns is plotted in Figure 2 by applying Equations (3)–(5). The total number of LEDs in all models is fixed.
The performance of the models is summarized in Table 2, which shows the average, minimum, maximum, and standard deviation (STD) of the received power for each model. It is observed that the 9 arrays model has the highest average Pr. However, it also has the highest deviation between the minimum and maximum Pr. This deviation causes signal fluctuations among the room, leading to a largely varying SNR and link unreliability. On the other hand, the performance of the 4 arrays and 16 arrays models is close under the given parameters.
Since the performance of any communication system is limited by its SNR, the received power of the link has to be increased. According to Equations (3)–(5), the received power, Pr, depends on many factors, including the receiver’s FOV and the transmitter’s (LED) half power angle, 1 / 2 . It can be observed that Pr is inversely proportional with the receiver’s FOV and the transmitter’s 1 / 2 . So, in order to increase Pr, the values of these two parameters should be decreased.
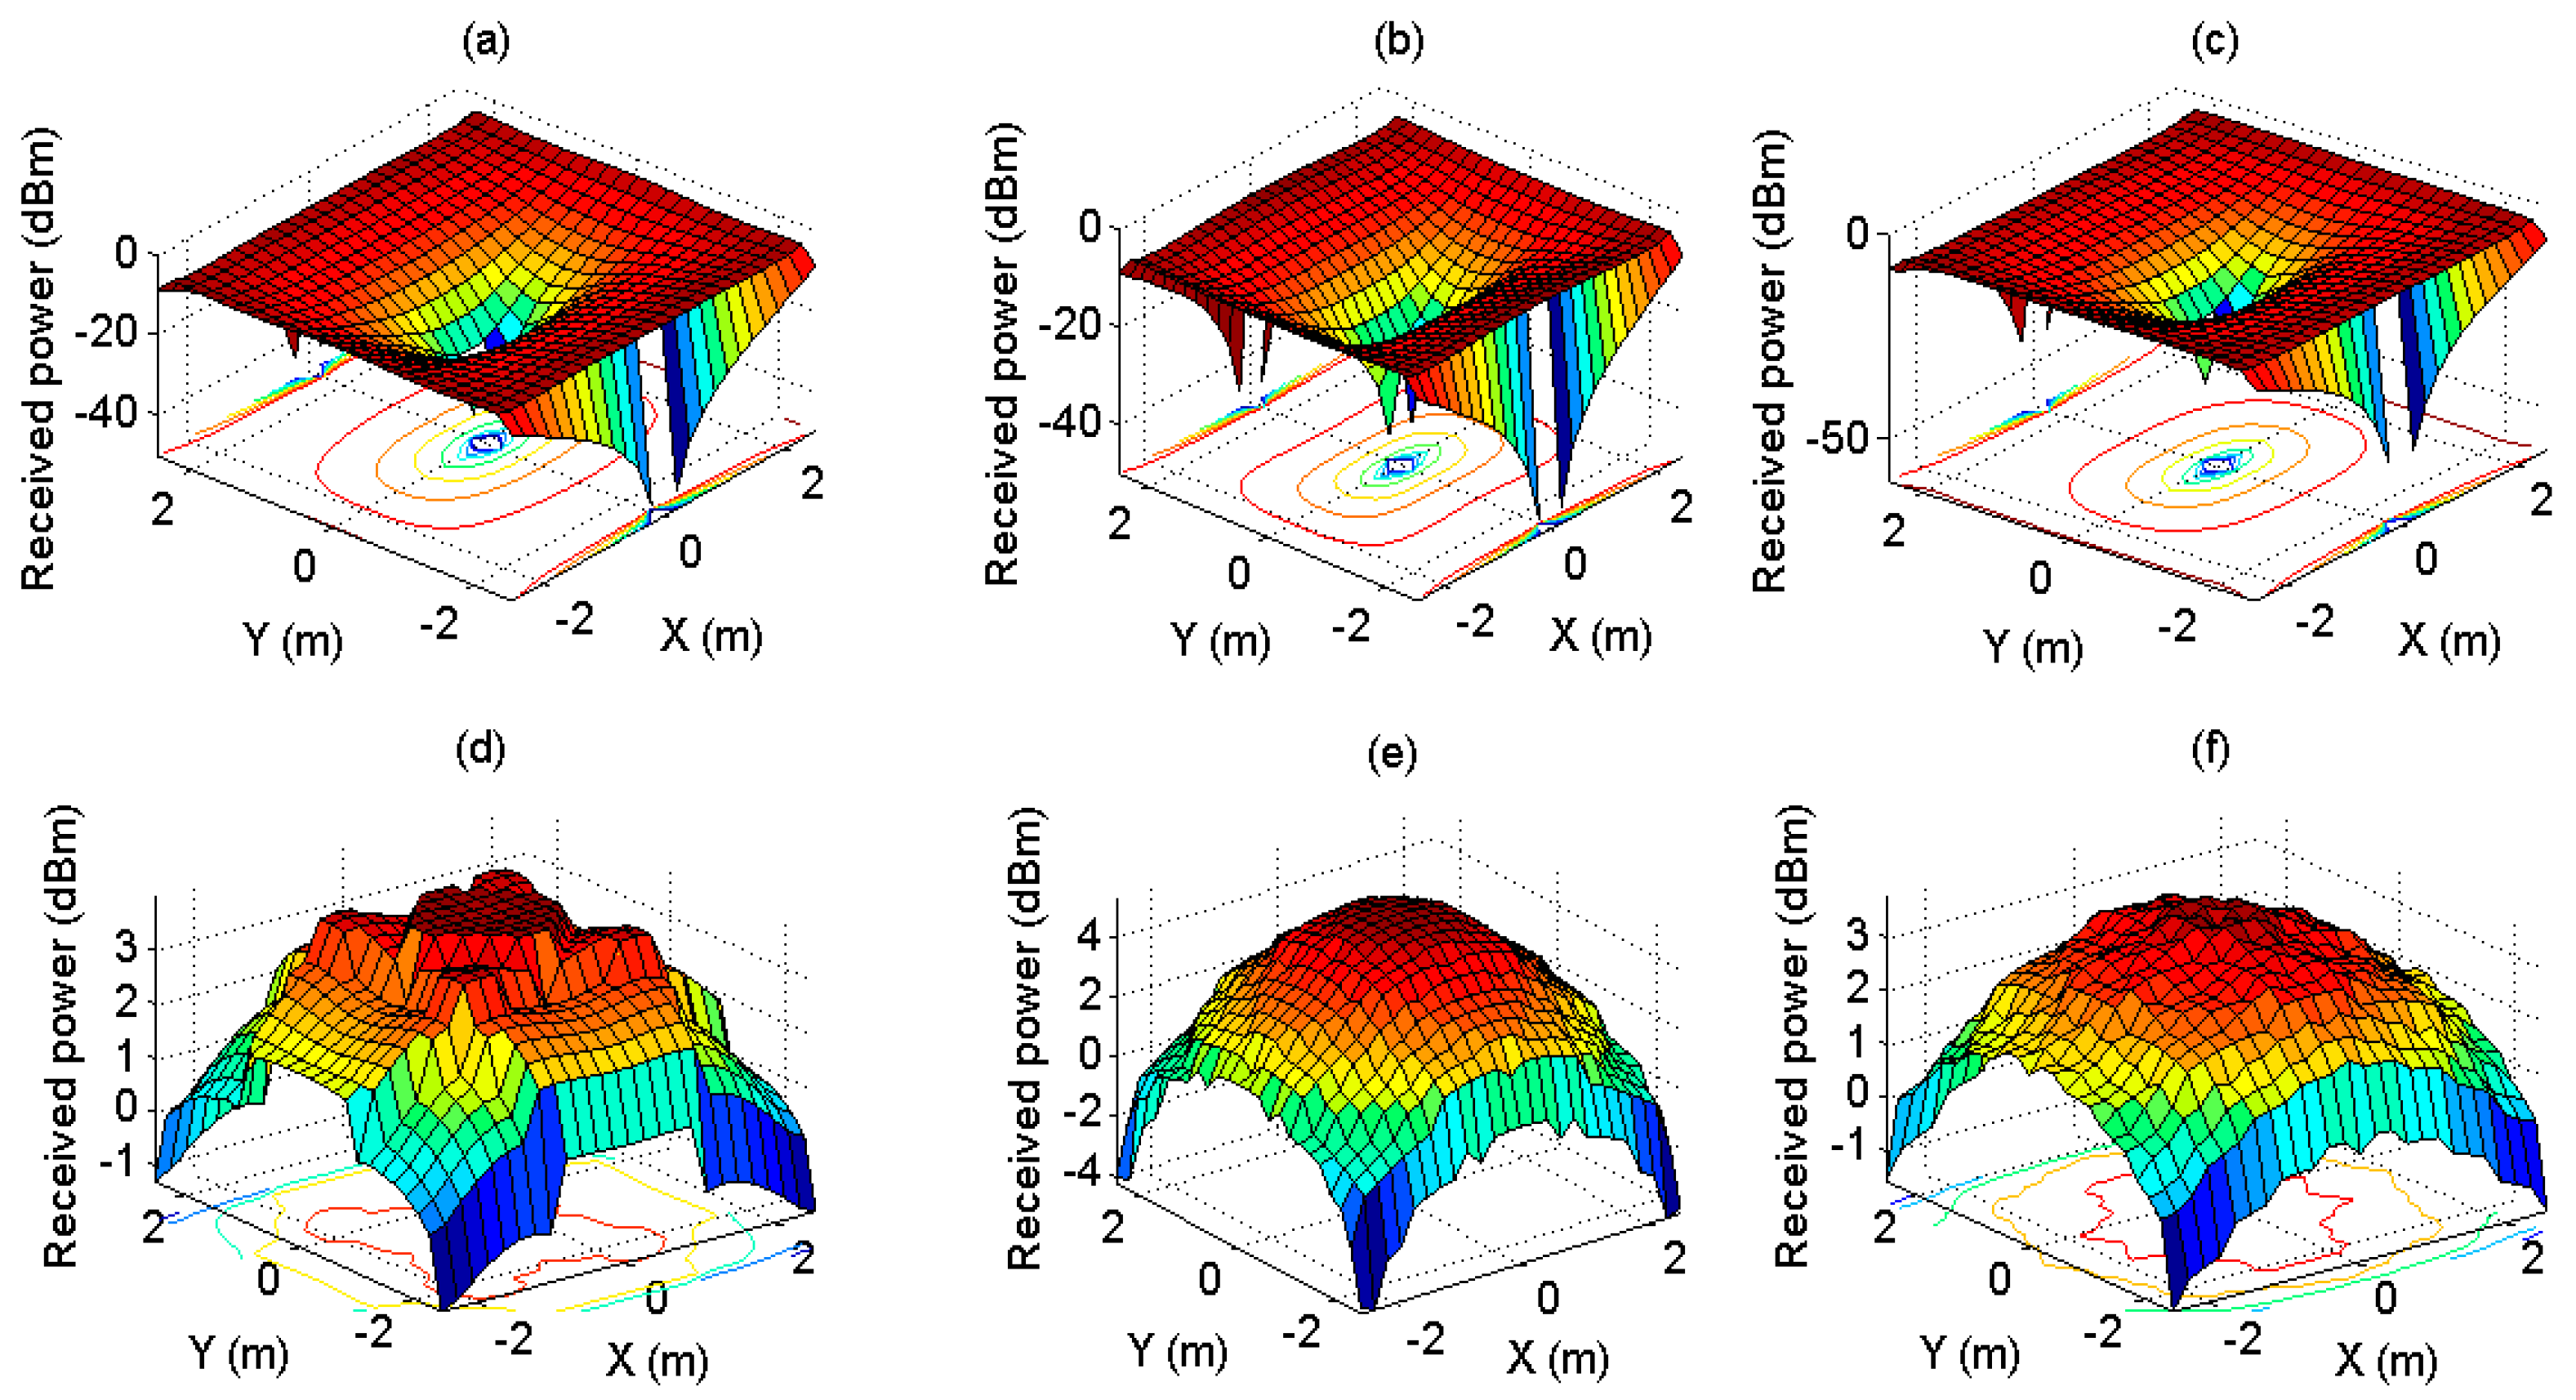
To analyze the effect of reducing the receiver FOV, the simulations in the previous section are repeated. Instead of using FOV = 70°, a receiver FOV of 60° then 50° are used. Table 3 shows the maximum received power in dBm for the first reflection paths and the total received power for the three cases under the three different values of the receivers FOV. The values of the maximum first reflected path received power do not vary greatly for each case; however, the power distribution pattern changes significantly, as shown in Figure 3.
In Figure 3, the FOV is fixed to 50°, and the first reflection path and the total received power are plotted for each case. It is clear that the area in the middle of the room starts receiving almost zero power from the first reflection path, and as the FOV gets smaller, the area gets larger. Moreover, the received power pattern becomes less uniform as the FOV gets smaller, causing the case of using 9 arrays and 16 arrays to have an advantage over the case of using 4 arrays. By increasing the number of transmitters in the room, the power becomes more evenly distributed. Hence, even if a receiver of narrow FOV is used, the power pattern will still maintain its uniformity. However, most practically used PIN photodiodes (receivers) such as those in References [17,18,19] have FOV angles of about 65, thus this study is not extended for FOV angles less than 50°.
The transmitter half power angle (i.e., semi-angle at half luminance), 1 / 2 , is the angle from the axis perpendicular to the LED by which the luminous intensity is only 50%. This angle is the viewing angle (i.e., the half-intensity beam angle). Its value is about 10–12° with no diffusion, such as in Reference [20], which is controlled by the reflector cup (that surrounds the LED chip) properties. However, this angle reaches up to 70° at maximum diffusion, as described in many scenarios [13,14,15].
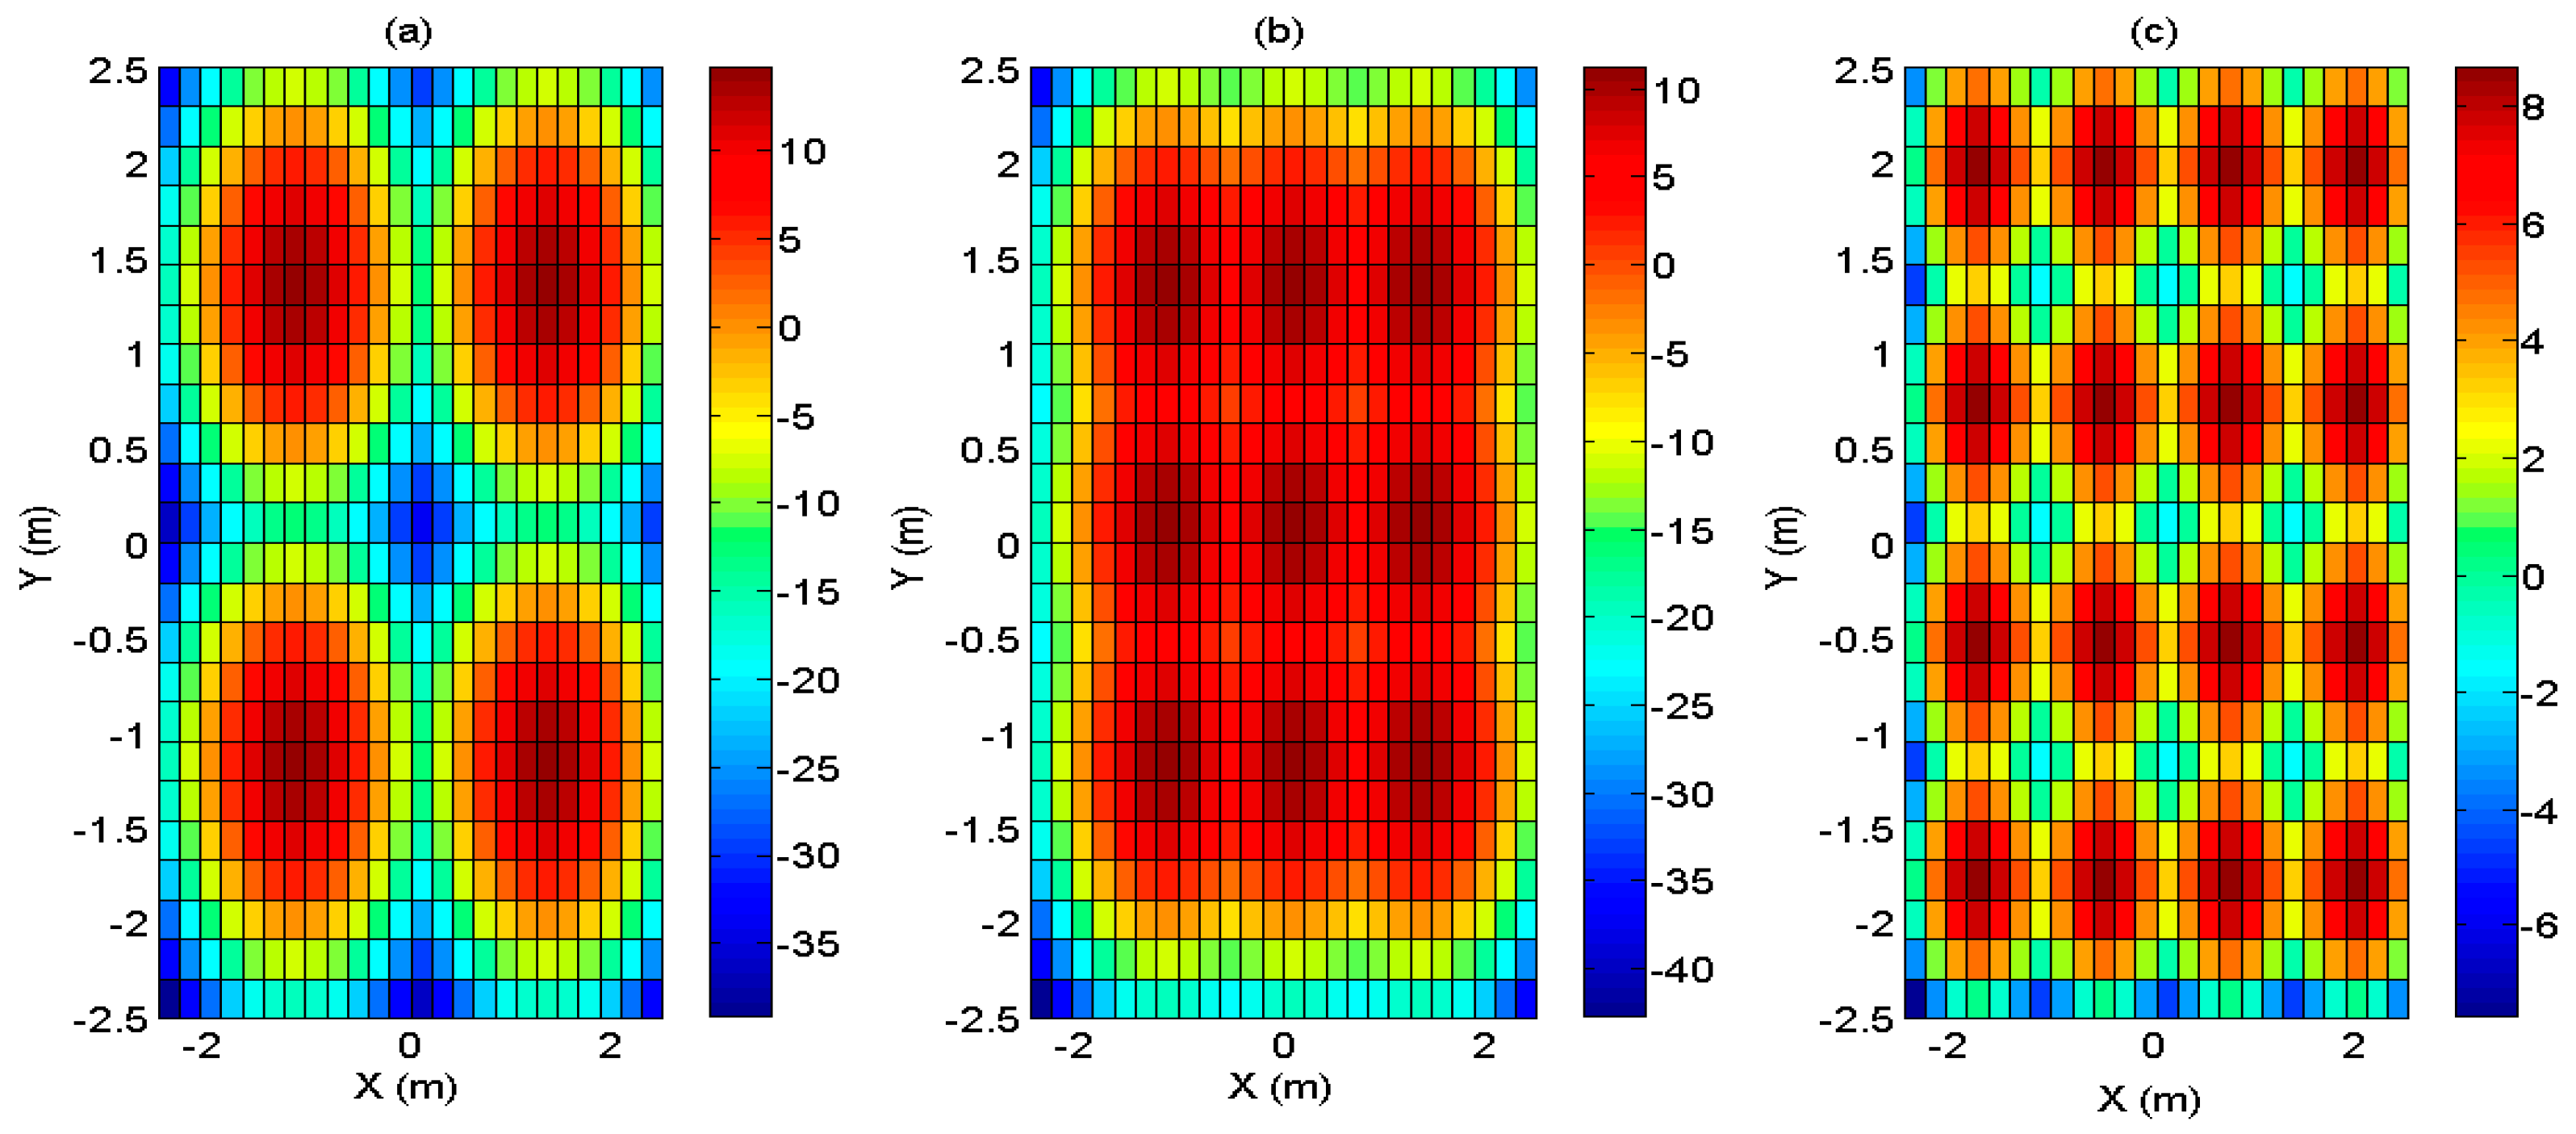
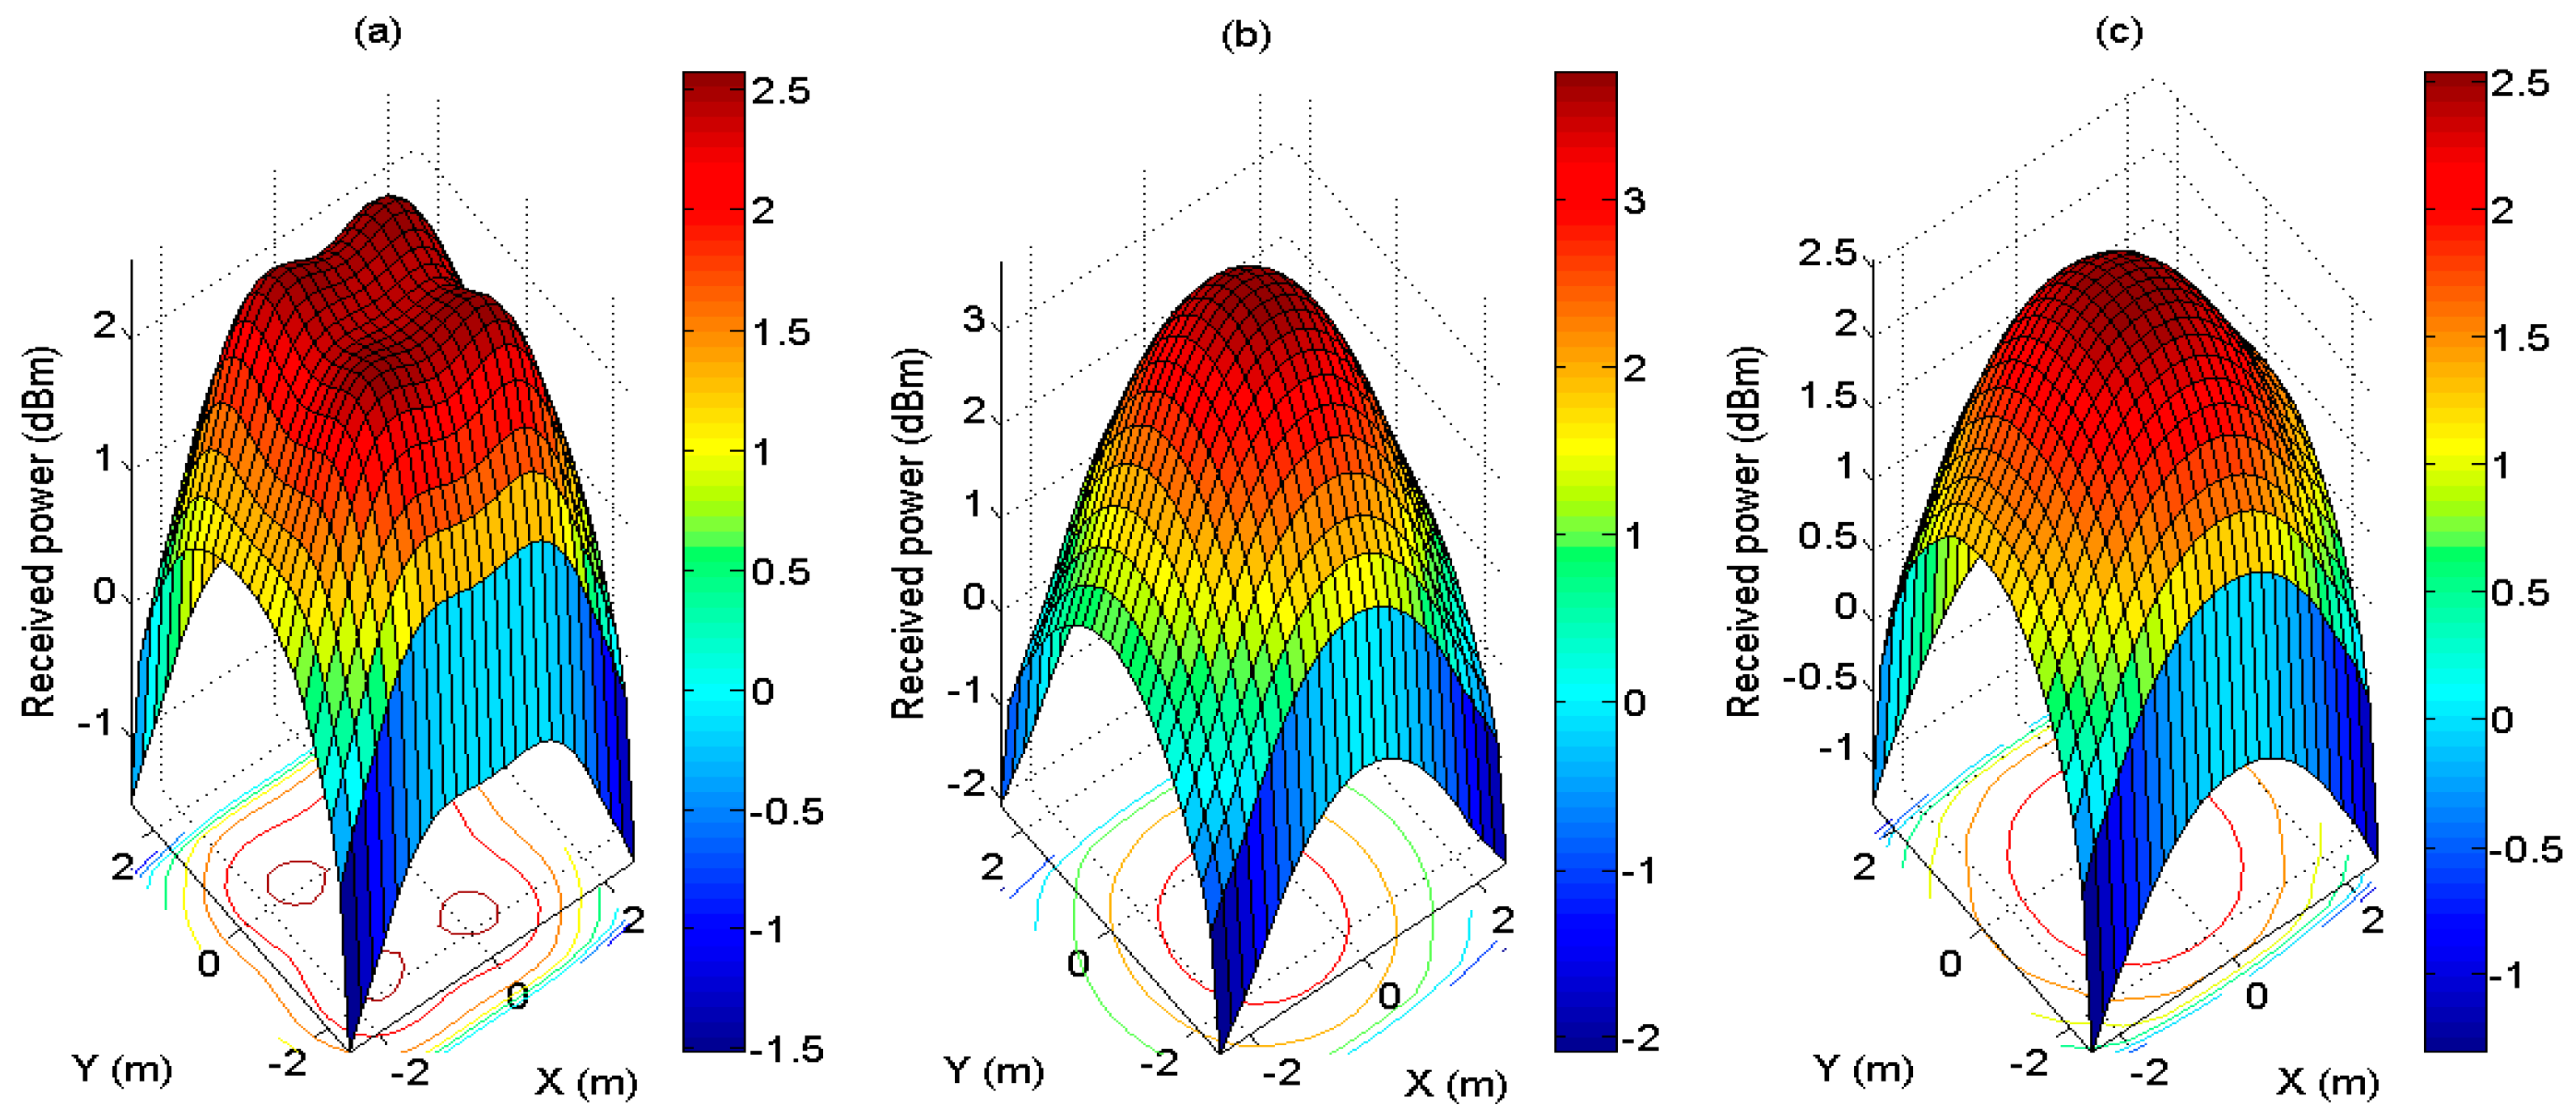
To analyze the effect of reducing the transmitter half power angle 1 / 2 , the simulations using the system parameters given in Table 1 are repeated, firstly by considering the case of a non-diffused LED with 1 / 2 = 10° instead of 1 / 2 = 70°. The tremendous difference is clear in Figure 4, where the received power pattern has changed greatly when compared to Figure 3. The patterns have less uniformity and the location and number of transmitters are now visible in the surface plot. The received powers are recalculated in Table 4 for 1 / 2 = 10°.
The received power, Pr, increases significantly when compared to the case of 1 / 2 = 70°, and so does Pr STD. The case of 16 arrays outperforms the other two configurations under the fixed system parameters defined, having the highest average Pr and the least Pr STD. Still, the system needs to be tested for practicality, as these LEDs are placed with the main purpose of illumination, the level of illuminance for the case of 1 / 2 = 10° has to be within the typical office illuminance requirements (i.e., 200 to 1000 lux) [3].
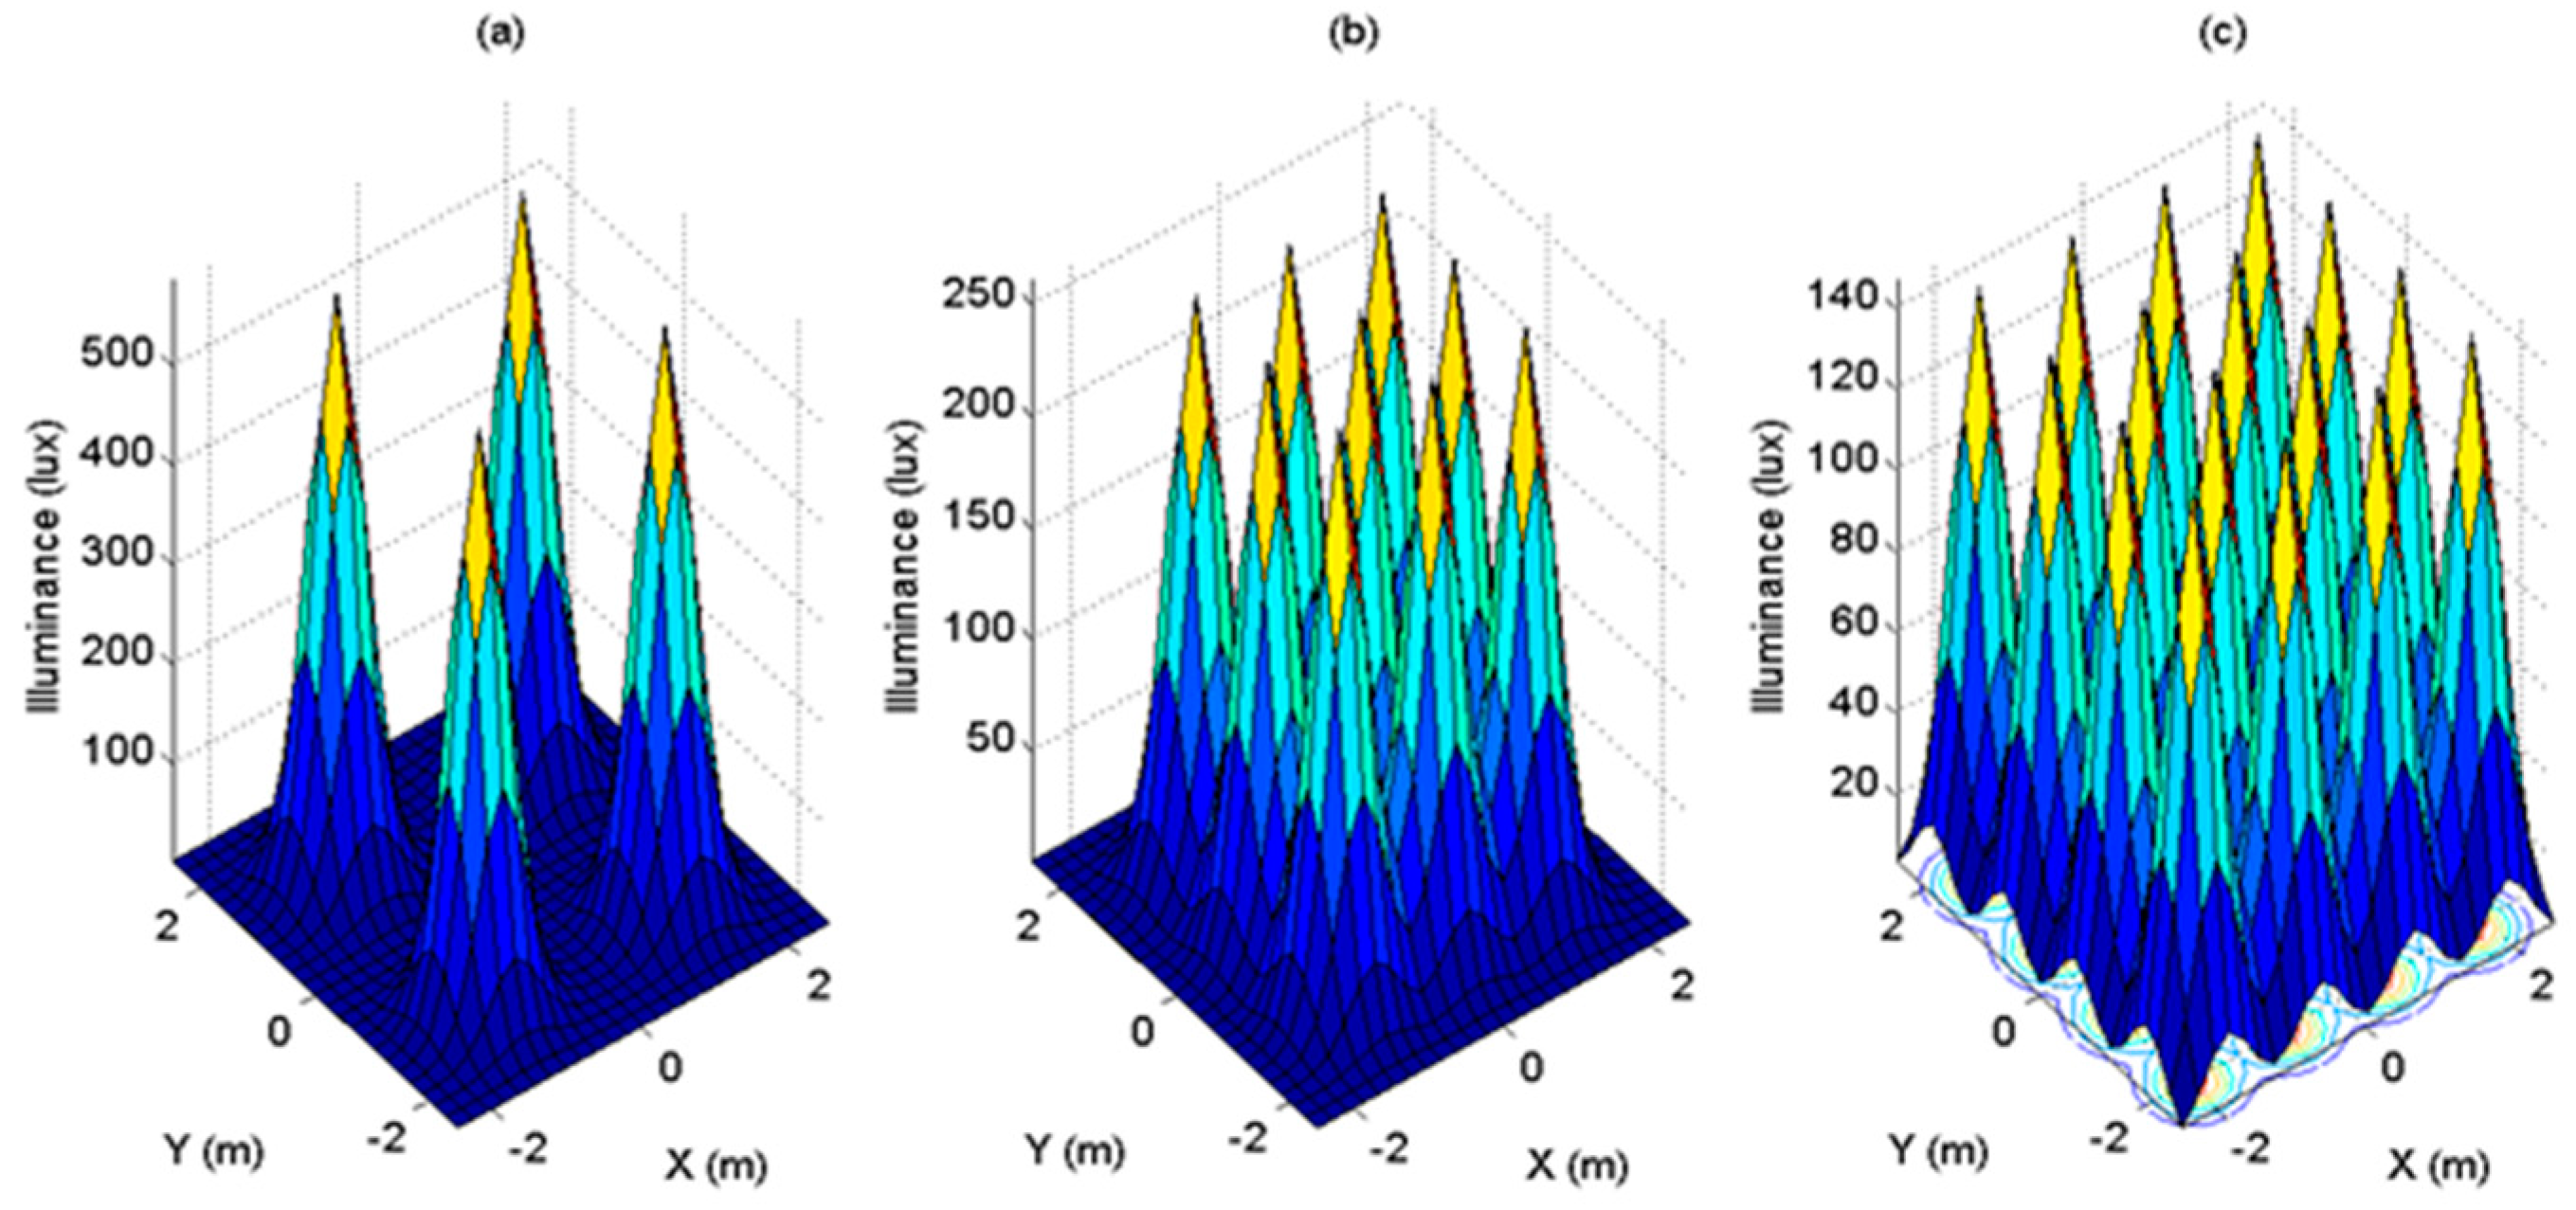
Using Equation (2), the illuminance of the three transmitter configurations at 1 / 2 = 10° is plotted in Figure 5. The plots show poor performance in all three cases. Table 5 shows the maximum and average illuminance (lux) for each case. The average illuminance in all cases is not within the required range for illumination, which is due to the fact that, from Equation (1), the radiation intensity and illuminance depend heavily on the value of ml, which is a function of 1 / 2 .
However, the presence of commercial LEDs with small 1 / 2 encouraged further investigation on utilizing the advantage of using LEDs with small half power angles. This increase in received power can be very useful in applications that require a high SNR. The proposed model performance is further evaluated by obtaining its BER, employing on-off keying with 1 / 2 = 30°. The BER and SNR are, respectively, given by [3]:
BER = Q ( SNR )
where the Q-function is defined as
Q ( x ) = 1 Φ ( x )
given Φ ( x ) as the cumulative distribution function of the normal Gaussian distribution and
S N R = ( R P r ) 2 σ T 2
where the photodiode responsivity is represented by R.
As presented in References [21,22,23], the total noise variance σ2T is
σ T 2 = 2 q R P r I 2 B + 8 π k T G η A I 2 B 2 + 16 π 2 k T Γ g m η 2 A 2 I 3 B 3
where q is the charge of electron and k is Boltzmann constant.
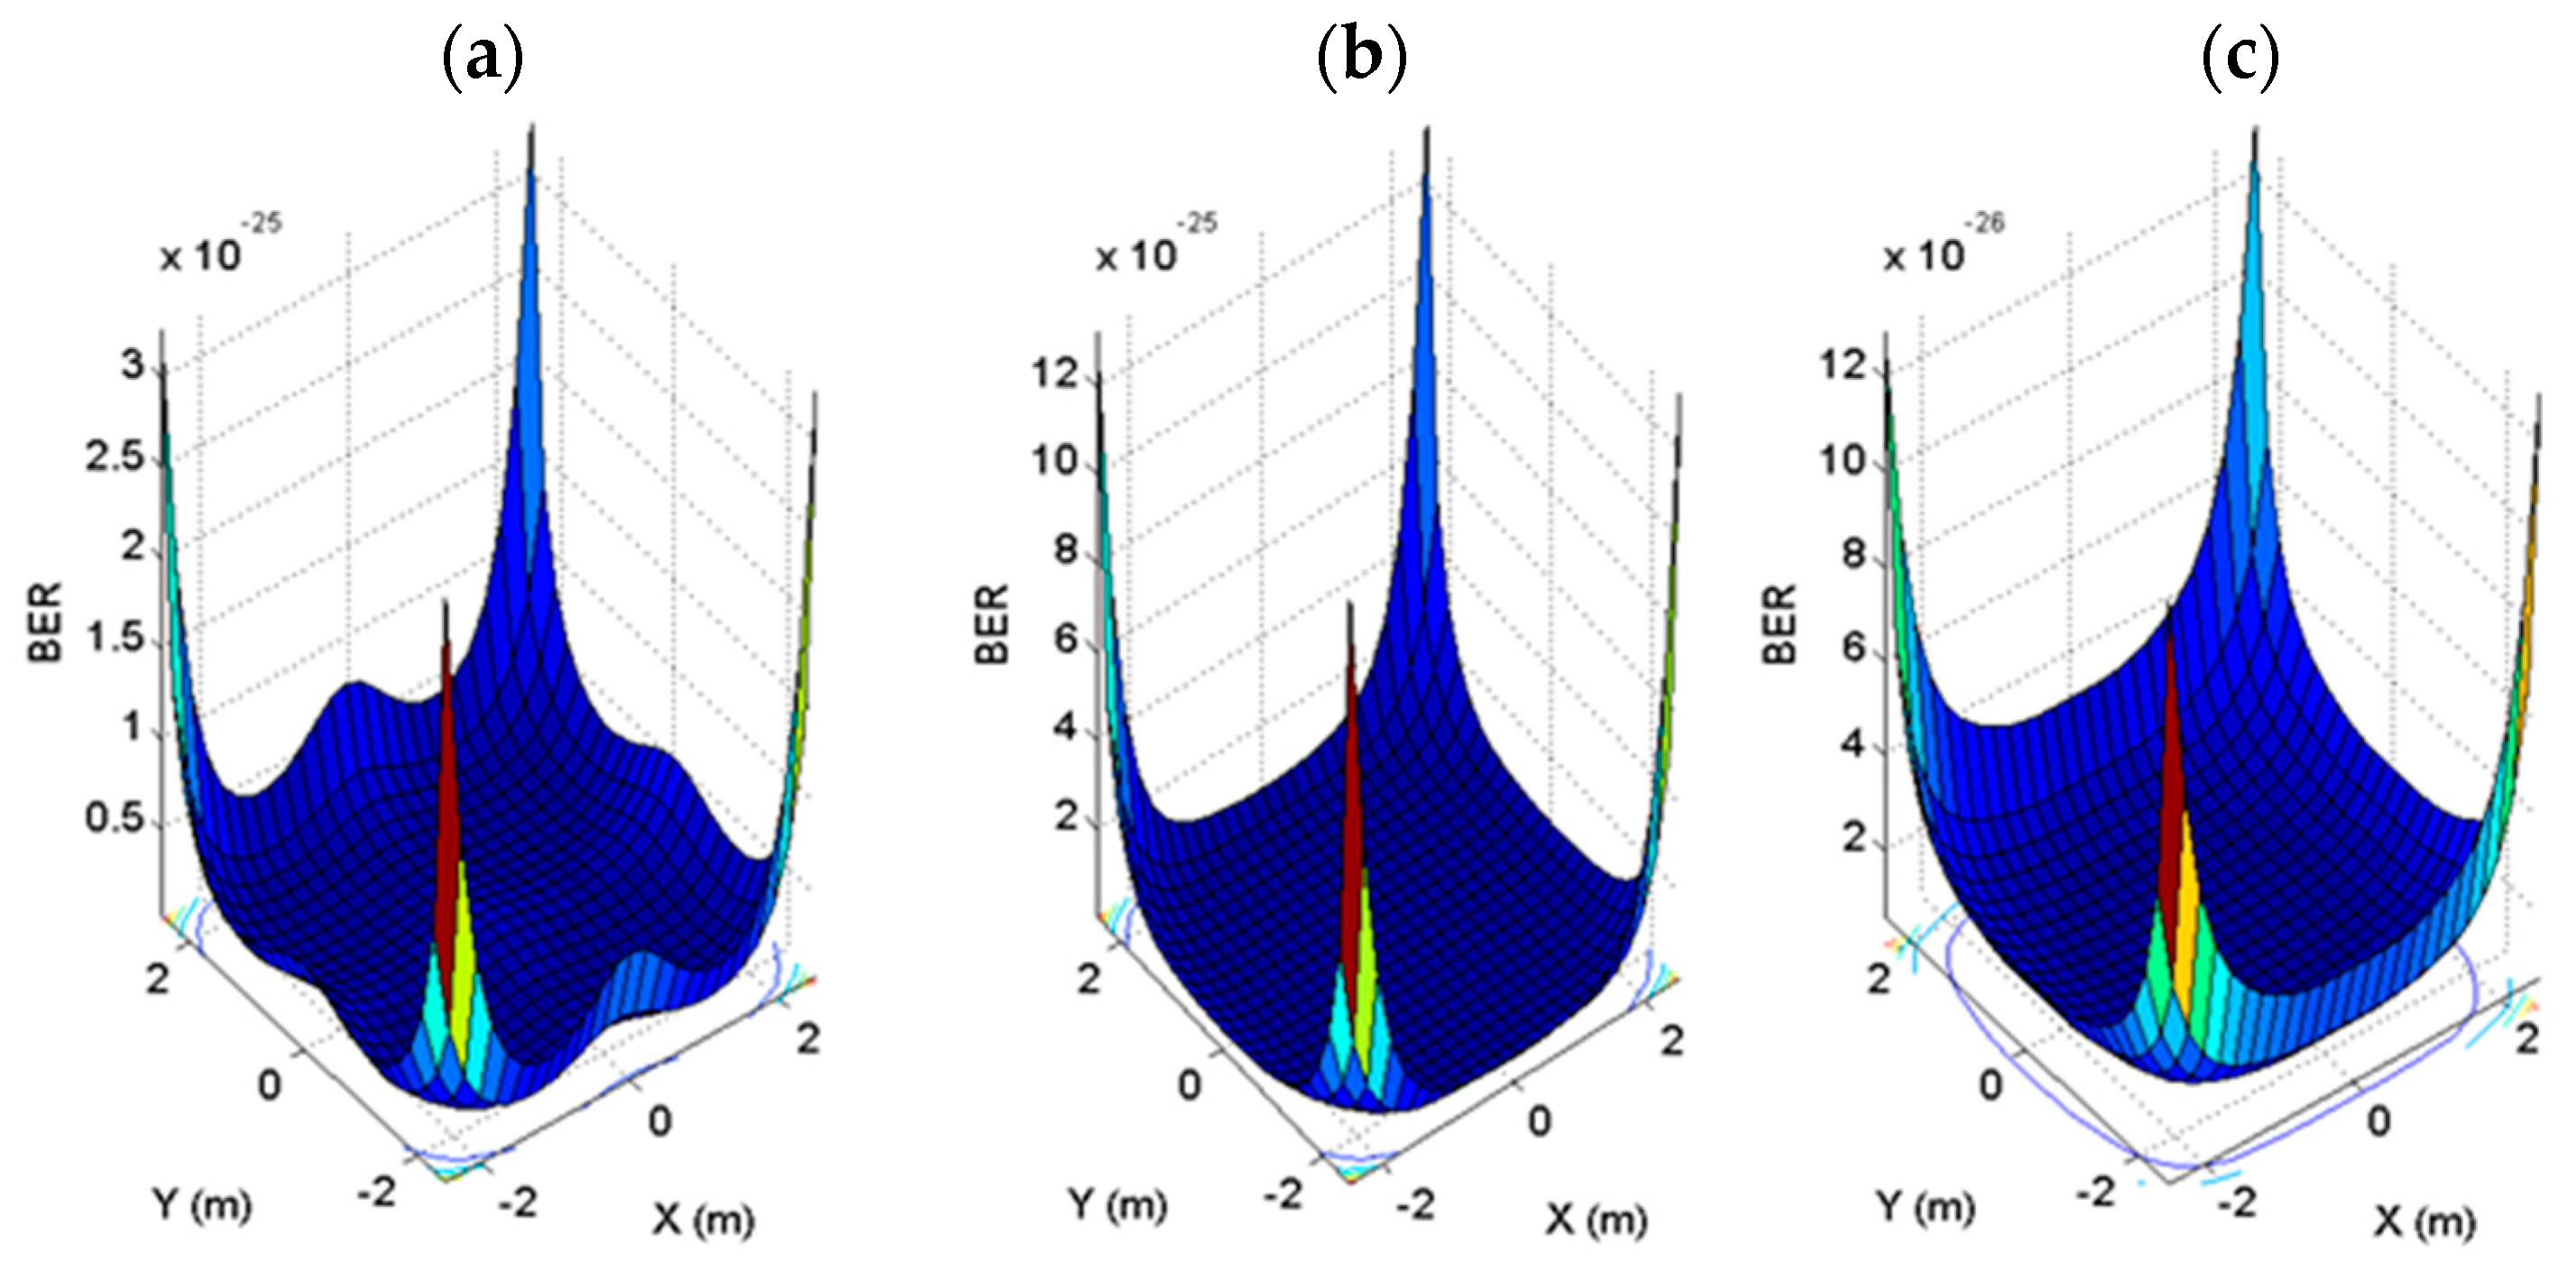
The BER parameters are shown below in Table 6, and the BER for each transmitter configuration at 1 / 2 = 30° is presented in Figure 6. It is observed that the BER in almost the entire room, excluding the corners, has a constant value.
According to the previous analysis, it is clear that the 16 arrays case has outperformed the two other cases, which encouraged the extension of this work to include 25 and 36 arrays. The analysis is repeated keeping a fixed number of LEDs for all array patterns and the same room parameters used in Table 1, except for the transmitter half power angle 1 / 2 . The illuminance and received power investigations are repeated but this time employing an LED with 1 / 2 equal to 30°, like the one used in Reference [14]. The obtained values are summarized in Table 7, where the 16 arrays case has the lowest illuminance level and the least illuminance STD. All the transmitter configurations under the condition 1 / 2 = 30° have an average illuminance within the illumination requirements of a typical room, but with the 16 arrays configuration having the advantage of better pattern uniformity. The calculations to obtain Pr are repeated for 1 / 2 = 30°, the values are given in Table 8.
Moreover, Table 9 includes the minimum BER values when the bit rate is varied to check the consistency of the conclusions attained. The variations between the five configurations at the same 1 / 2 are minimal, causing the 16 arrays to be the most efficient one even if configurations have slightly less BERs. Looking at Table 9, the five transmitter configurations showed an improvement in the BER performance at 1 / 2 = 30°, for all data rates, over the case of 1 / 2 = 70°.
As depicted in Table 7, Table 8 and Table 9, the 25 arrays case has a higher Pr STD of 2.0, a slightly higher Pr average, and less BER when compared to the 16 arrays case. The STD of the SNR in this case is equal to 4.0, as opposed to 2.3 in the case of the 16 arrays. On the other hand, the case of 36 arrays has a Pr STD of 1.8, still higher than the case of the 16 arrays, resulting in a SNR STD of 3.7. It also has a slightly higher average Pr when compared to the 16 arrays case, and less BER. However, these cases might not be practically preferred, as they will increase the complexity of the LEDs installation in the room.
To summarize the outputs of this section, the 16 arrays configuration has persistently shown a better pattern uniformity in comparison with the other rectangular transmitter arrangements at 1 / 2 = 30°, having;
  • The least Pr STD of 1.2
  • The least SNR STD of 2.3
  • The highest minimum illuminance of 116 lux
  • The highest minimum Pr of −1.0 dBm
However, this comes at the expense of a slightly higher BER when compared to the other configurations. Hence, the 16 array configuration at 1 / 2 = 30° is chosen, and the preceding section is dedicated to the equalization of the LED fixtures.

3. LED Equalization

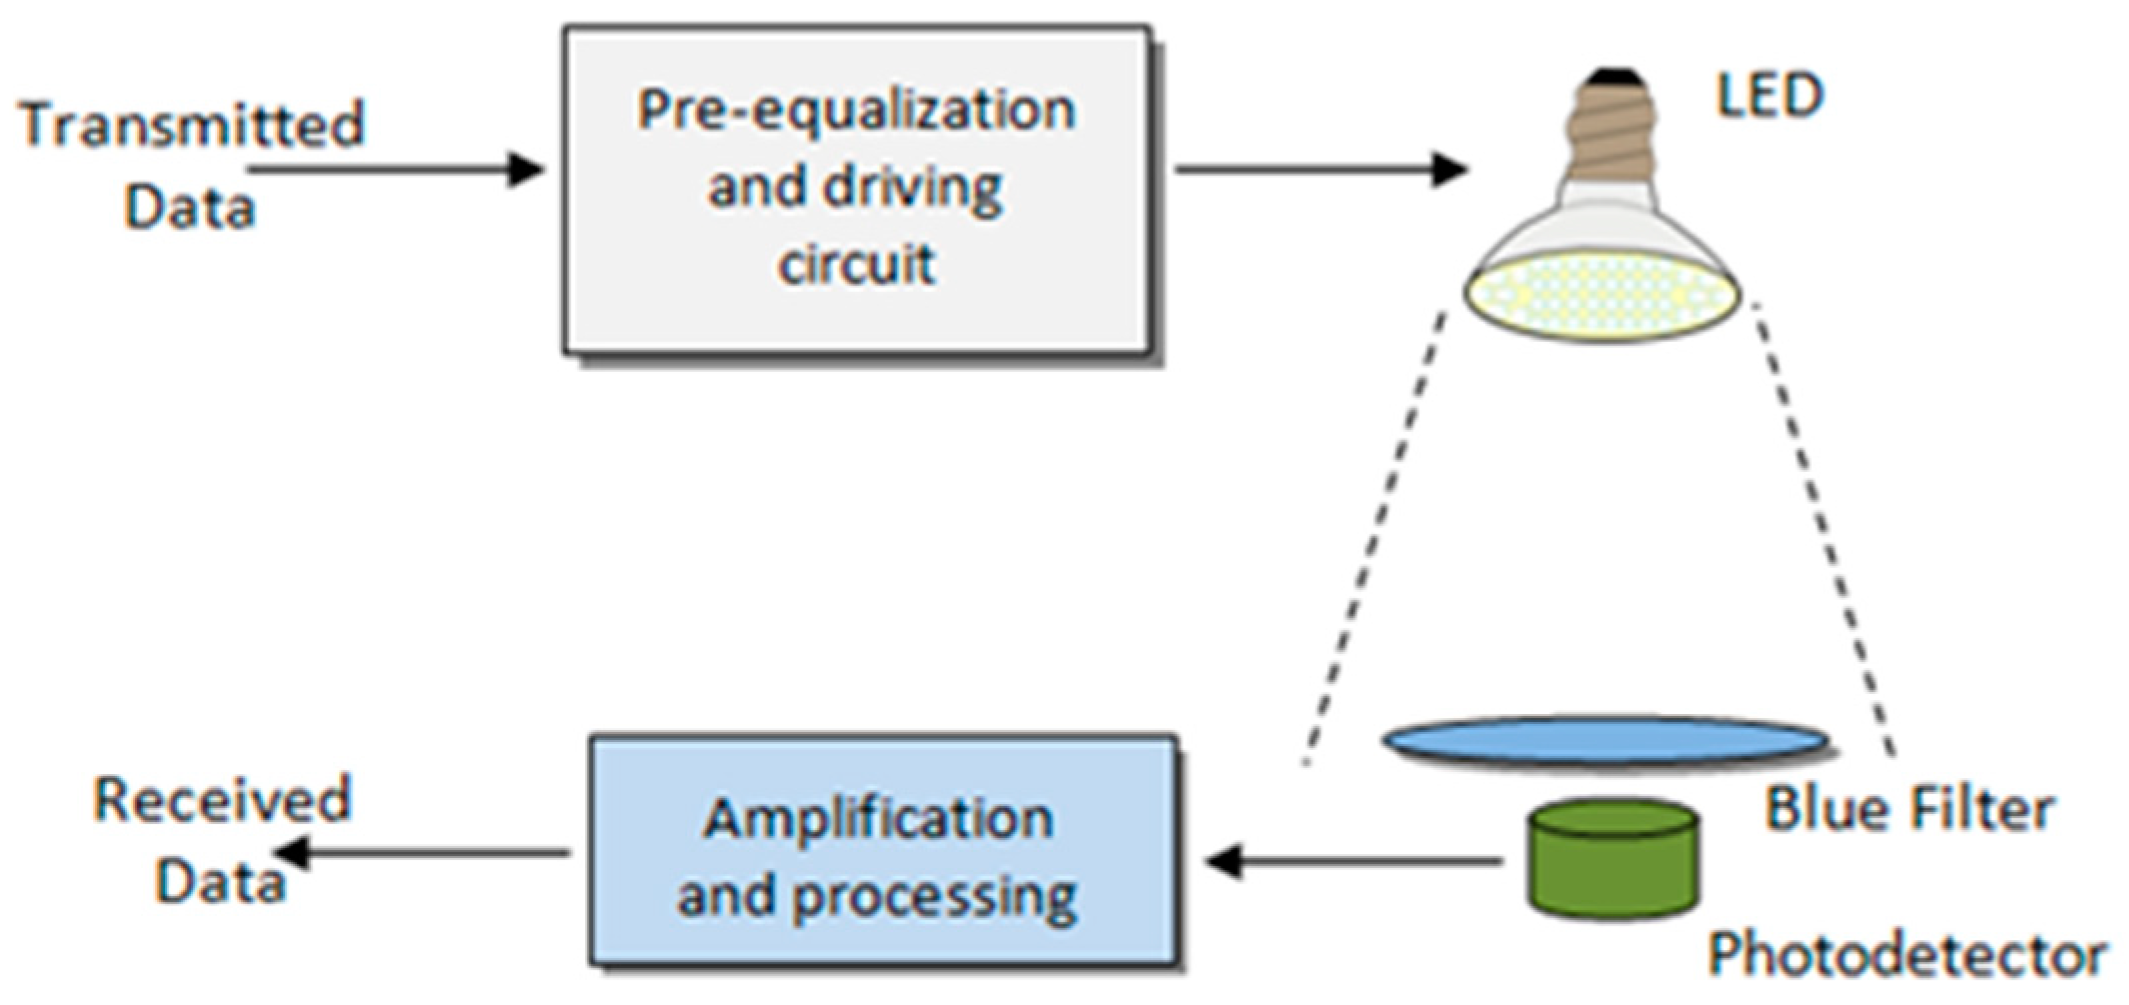
As previously mentioned, the speed of transmission is limited to the LEDs low modulation bandwidth. Practically, the bandwidth is limited far beyond the theoretical 2 GHz [25] due to the lifetime of minority carriers in LEDs. In a previous work [24], we proposed a pre-equalization circuit (and blue filtering) that can extend the phosphorescent white LED bandwidth from 3 MHz to 325 MHz. The pre-equalization circuit is added to the LEDs driving circuit. A simplified VLC system block diagram, Figure 7, shows the placement of the circuit and blue filter. After carefully studying and analyzing the limitations of the circuit presented in Reference [24], it is observed that further bandwidth enhancement can be achieved.
In this section, we first introduce the affiliated pre-equalization circuit, followed by our proposed design and its evaluation.

3.1. The Pre-Equalization Circuit

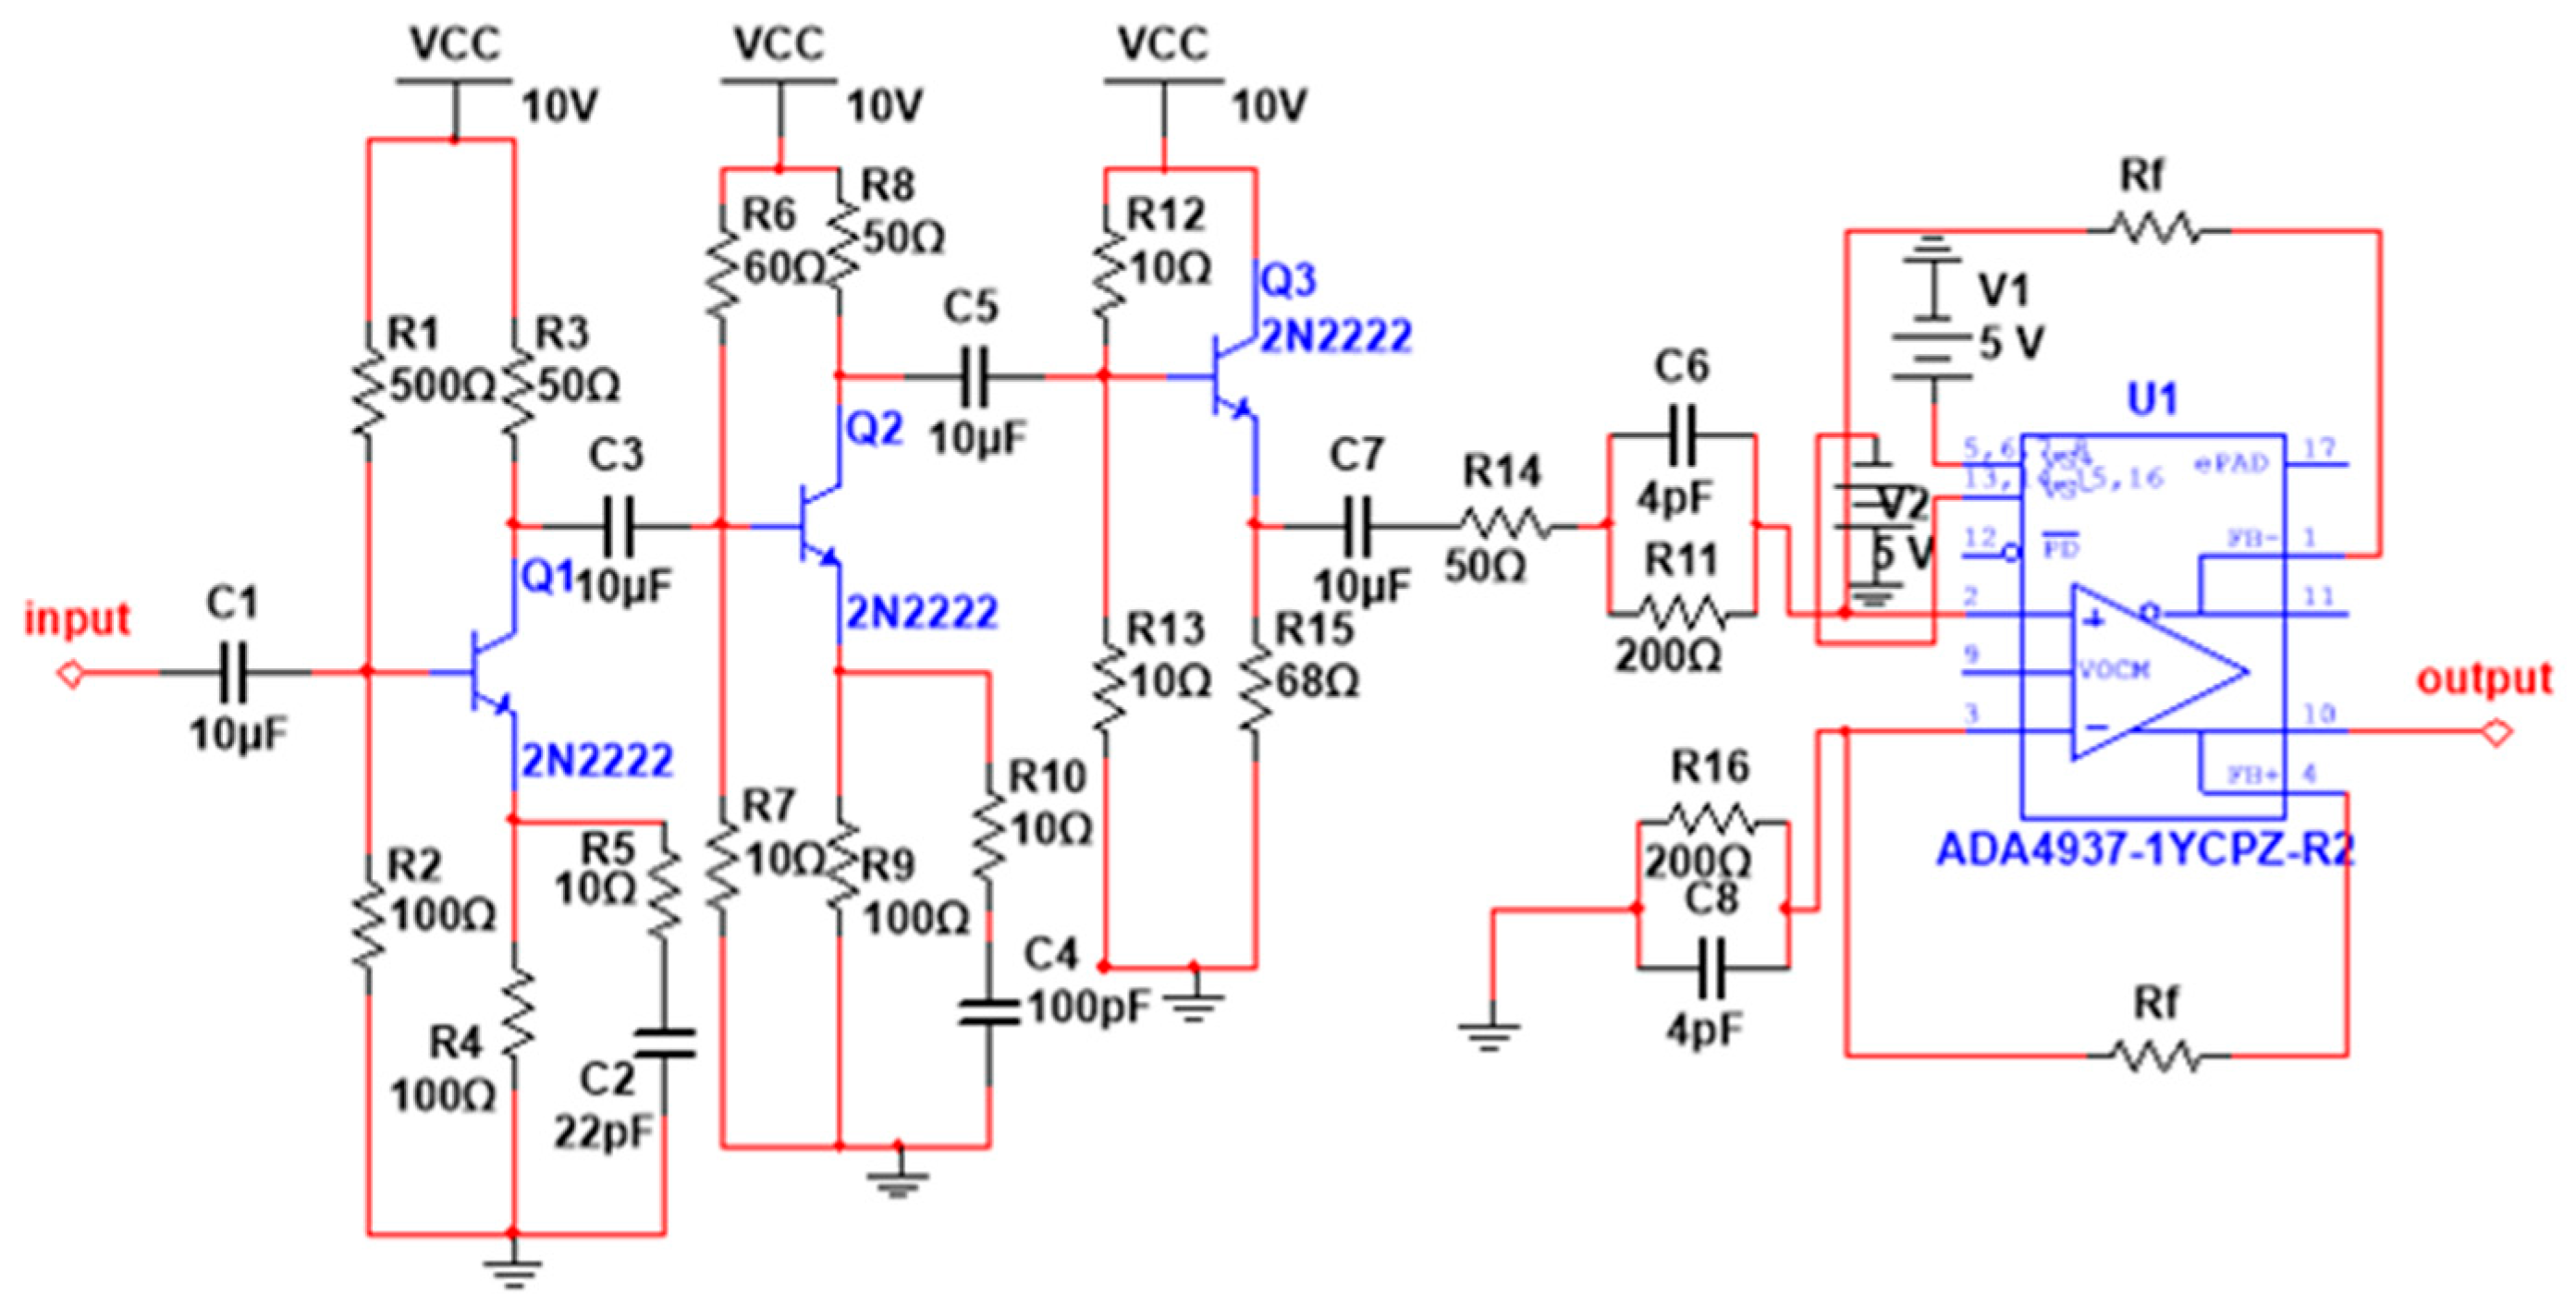
Equalization can be defined as the process of increasing or decreasing the energy of specific bands, hence the frequency components of a signal can be balanced. The purpose of the equalization process, in this paper, is to enlarge the span within which the magnitude of the frequency response of the system remains flat. By adding the pre-emphasis circuit to the system, the total response will be broadly wider than that of LED alone. In the present work, after extensive trials, unprecedented bandwidth enhancement can be achieved by modifying the value of the feedback resistance, Rf, of the second segment in the circuit, shown in Figure 8.

3.2. System Performance Evaluation

The system components have a great impact on the VLC system data rate, such as that of the LED, amplifier, and channel. For the sake of the simplicity of the analysis, it is assumed that the data is transmitted using on-off keying (OOK) with NRZ pulses. The channel is assumed as a flat fading channel having a constant gain for all frequencies of interest. In this case, and according to References [25,26],
H c h a n n e l ( f ) = H ( 0 )
where the channel frequency response is Hchannel(f) and the channel DC gain is H(0).
The response of the filter is also assumed to have a bandwidth greater than that of the equalized LED, like the amplifier ZHL-6A [27] with a bandwidth of 500 MHz. Hence, the only limiting factor is the narrow modulation bandwidth of the LED. The LED response can be modeled as a first-order RC filter [28] similar to that of a low pass when driven by a short current pulse. It can be described as
h L E D ( t ) = e w c   t
where the 3-dB cutoff frequency is wc and is given by
w c = p T r + T f
where Tr is the rise time and Tf is the fall time of the LED response, while p is the experimental turning parameter.

4. Simulation Results

Table 10 shows the maximum attained bandwidth versus the magnitude of the signal gain at the 3 dB frequency point. It is clear that the smaller the feedback resistance is, the wider the maximum bandwidth is achieved. The gain decreases down till 200 Ω, and then the performance of the system starts to deteriorate.
To understand why the performance of the system starts to deteriorate, the time response of the second stage of our circuit is studied. It is observed that below 200 Ω, the operational amplifier starts acting as an attenuator and not as an amplifier. The time response of the second stage of our circuit alone yields the gains depicted in Table 11. So, even when the 180° phase reversal occurs in the frequency response of the entire circuit which occurs at 430 MHz, in the case when Rf = 150 Ω, the 3 dB bandwidth is noticeably less due to the gain magnitude.
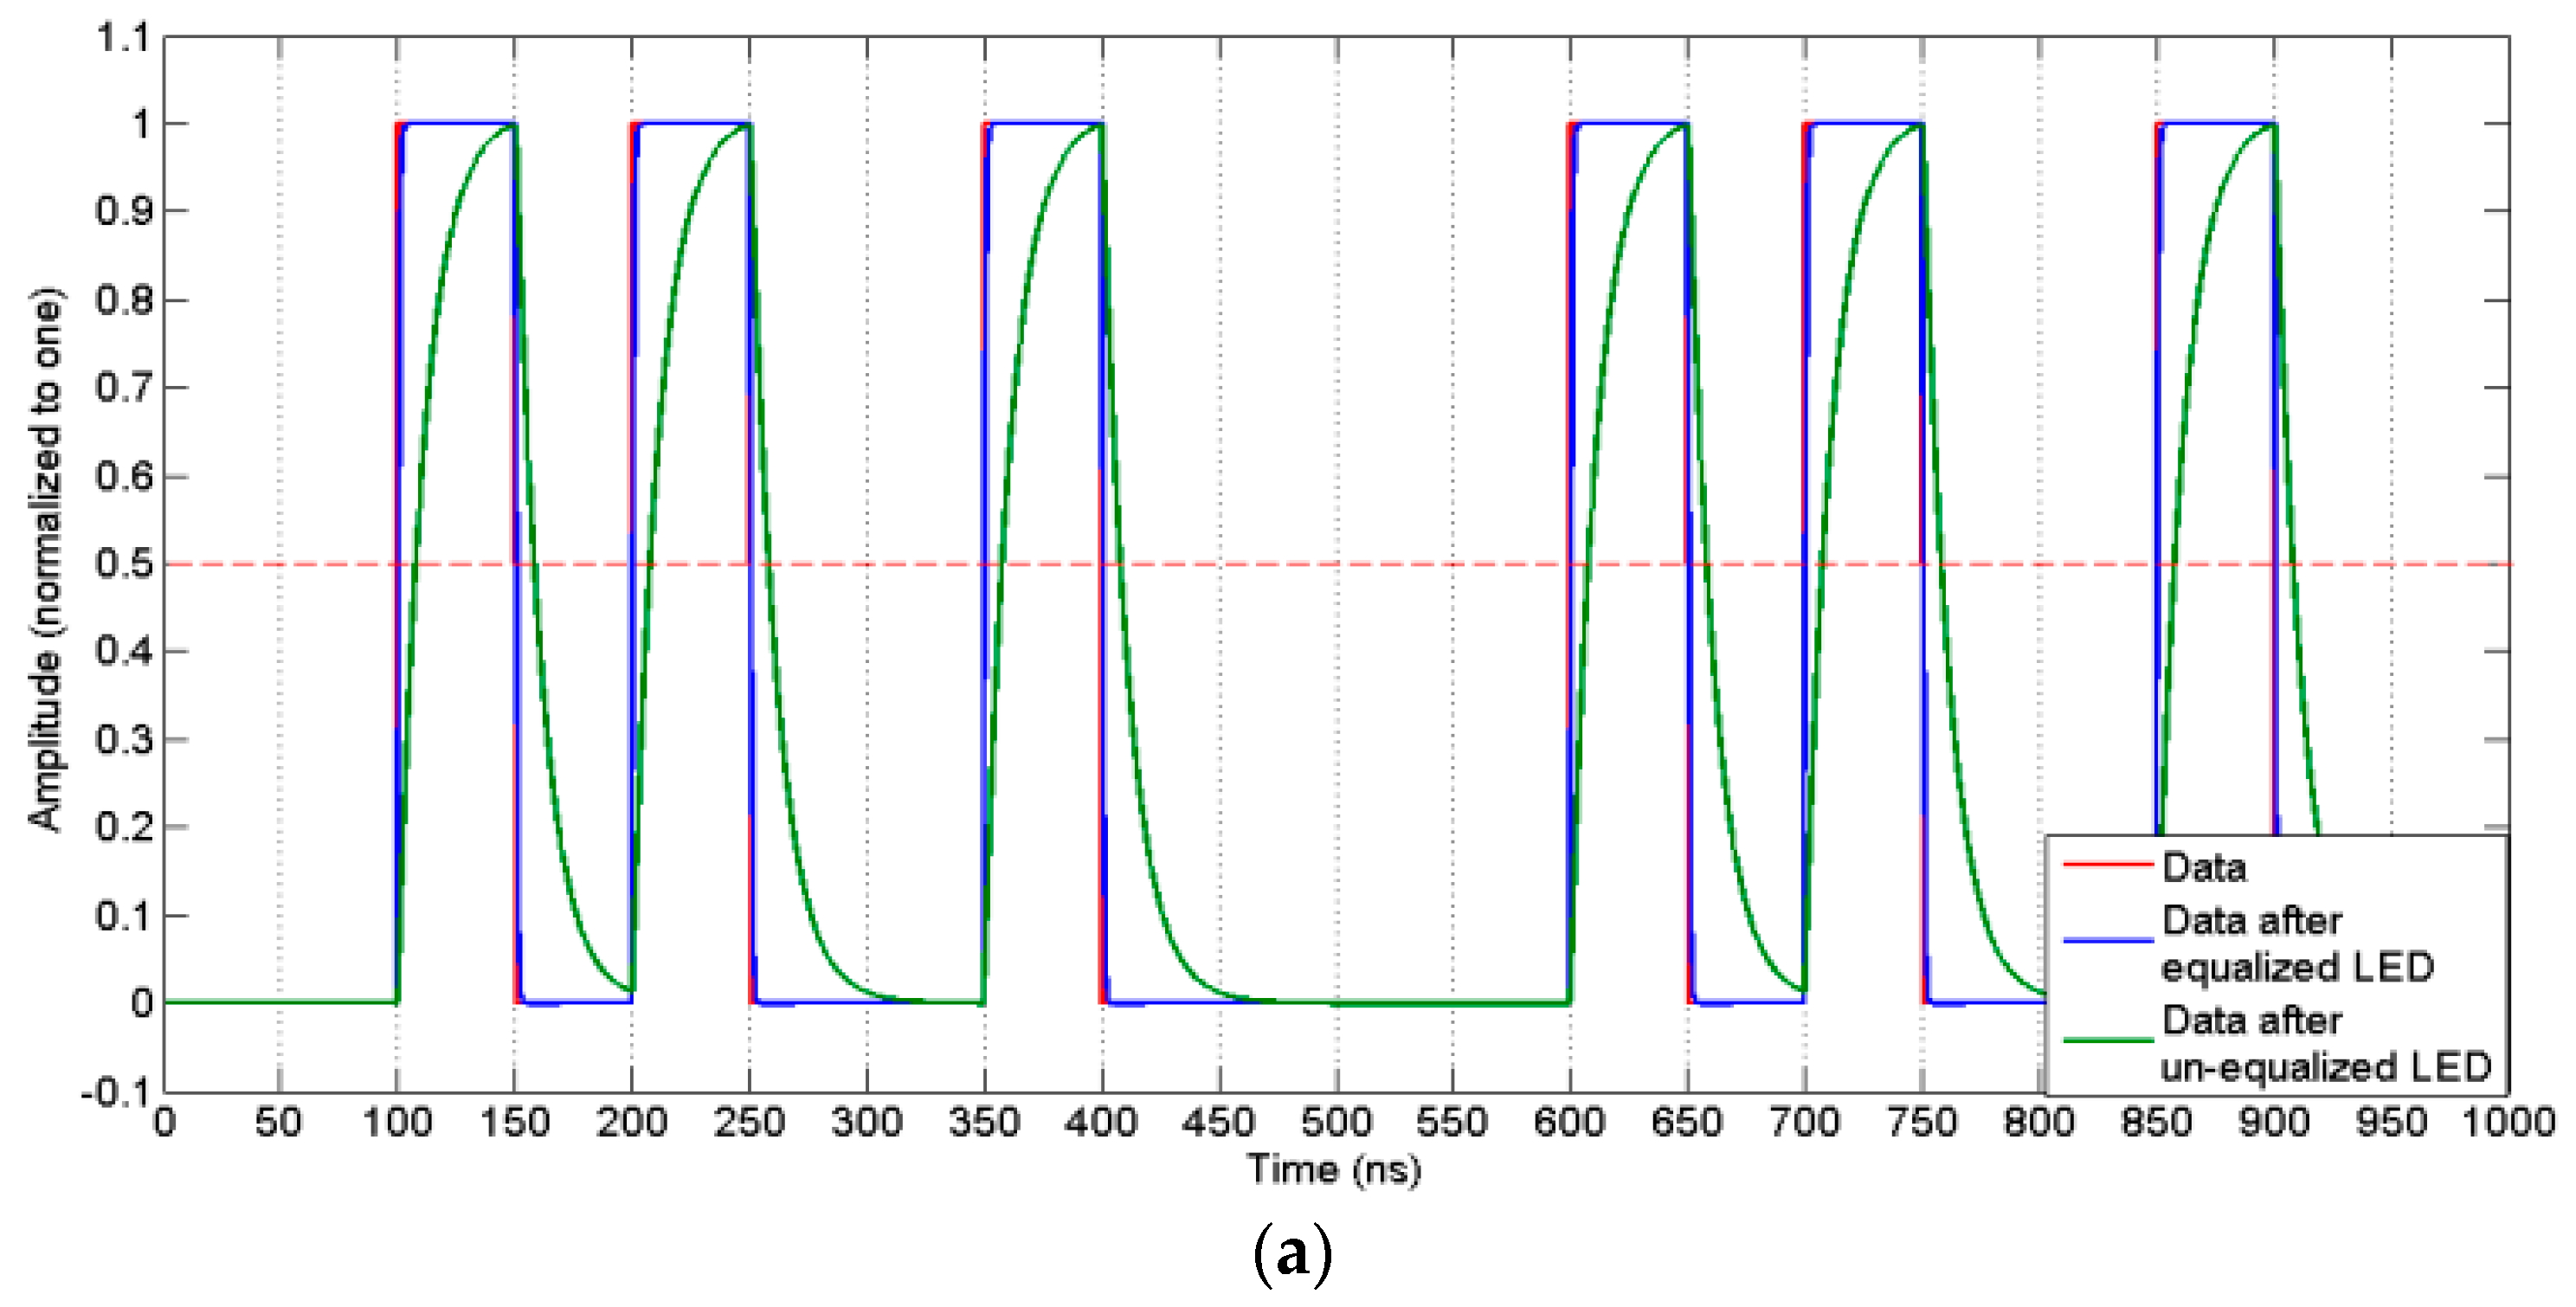
The Tr and Tf are 20 ns and 130 ns, respectively, and the total response time is about 150 ns, while the fall time, on the other hand, is longer because of the phosphor’s slow response. Data rates of 20 Mb/s, 200 Mb/s, and 2 Gb/s, are convolved with the responses of the both the unequalized and equalized LEDs, as depicted in Figure 9a–c, respectively. At 20 Mb/s, the data can still be recovered without the need for equalization, as can be seen from Figure 9a. The data after equalization is almost identical to the transmitted data. The limitations of the LED modulation bandwidth become apparent at higher speeds. At 200 Mb/s, the need for equalization is apparent. However, the response after equalization shows that the data can still be recovered with a low BER. On the other hand, at 2 Gb/s, the data almost seems unrecognizable without equalization, and even with equalization, the BER would still be very high. The bit error calculations caused by the LED limited bandwidth shown in Figure 9 (taking 50 samples/bit duration) shows that at 20 Mbit/s both the unequalized and equalized LEDs have zero error. On the other hand, only the equalized LED has zero error at 200 Mbit/s, while at 2 Gbit/s, the error occurs in both cases but is significantly less with the equalized LED.
The BER is calculated with different numbers of random bits up to 200,000 in order to verify the consistency of the obtained results and the efficiency of the proposed circuit. At 20 Mbit/s, the BER was negligible using both the un-equalized and equalized systems. At a higher data rate of 200 Mbit/s, the equalized system was able to eliminate the un-equalized LED BER of 0.36. On the other hand, at 2 Gbit/s, the proposed equalized system reduced the 0.49 BER to 0.27 (i.e., 44.2% improvement). However, at high speeds (i.e., 2 Gbit/s), the BER for both cases is still very high and cannot be employed in a practical communication system. Future work will include addressing solutions for high data rate transmission.

5. Conclusions

This paper firstly proposed the LED arrangement that enhances the illumination and received power uniformity of previously proposed configurations in the literature. The proposed configuration improved system reliability while reserving the total number of utilized LEDs, yielding only a received power STD of 1.15 across the room. The proposed configuration outperformed the other models by having the most uniform radiation pattern and consisted of 16 transmitters mounted on the ceiling. Other factors, such as the transmitters’ half-power angle and the receiver’s FOV, were examined in order to design a system that has a higher SNR and a lower BER compared to other models. The analysis included received power simulations, illuminance, SNR, and BER calculations at different data rates. Secondly, the 3-dB modulation bandwidth of a phosphorescent white LED was extended in this paper by the designed pre-equalization circuit from about 3 up to 416 MHz with the aid of a blue filter. This circuit provides a 28% bandwidth enhancement over the result of the most recent study in this area. Assuming a channel without distortion, a zero BER at a data rate of 200 Mb/s was obtained, which is a significant improvement when compared to the BER of the un-equalized LED (i.e., 0.36).

Author Contributions

Conceptualization, A.A.E.A. and H.A.F.; Methodology, M.H.K.; Software, M.H.K.; Validation, M.H.K., A.A.E.A., and H.A.F.; Formal Analysis, M.H.K.; Investigation, M.H.K.; Resources, A.A.E.A.; Data Curation, M.H.K.; Writing—Original Draft Preparation, M.H.K.; Writing—Review & Editing, A.A.E.A., H.A.F., and M.H.A.; Visualization, M.H.K., and A.A.E.A.; Supervision, A.A.E.A., M.H.A. and H.A.F.; Project Administration, M.H.A., A.A.E.A., and H.A.F.

Funding

This research received no external funding.

Conflicts of Interest

The authors declare no conflict of interest.

References

  1. Pathak, P.H.; Feng, X.; Hu, P.; Mohapatra, P. Visible light communication, networking and sensing: A survey, potential and challenges. IEEE Commun. Surv. Tutor. 2015, 17, 2047–2077. [Google Scholar] [CrossRef]
  2. Khan, L.U. Visible light communication: Applications, architecture, standardization and research challenges. Digit. Commun. Netw. 2017, 3, 78–88. [Google Scholar] [CrossRef] [Green Version]
  3. Ghassemlooy, Z.; Popoola, W.; Rajbhandari, S. Optical Wireless Communications; System and Channel Modelling with MATLAB; CRC Press: Boca Raton, FL, USA, 2013. [Google Scholar]
  4. Smet, P.F.; Parmentier, A.B.; Poelman, D. Selecting conversion phosphors for white light-emitting diodes. J. Electrochem. Soc. 2011, 158, R37–R54. [Google Scholar] [CrossRef]
  5. Wang, S.-W.; Chen, F.; Liang, L.; He, S.; Wang, Y.; Chen, X.; Lu, W. A high-performance blue filter for a white-led-based visible light communication system. IEEE Wirel. Commun. 2015, 22, 61–67. [Google Scholar]
  6. Li, H.; Chen, X.; Guo, J.; Tang, D.; Huang, B.; Chen, H. 200 Mb/s visible optical wireless transmission based on NRZ-OOK modulation of phosphorescent white LED and a pre-emphasis circuit. Chin. Opt. Lett. 2014, 12, 100604–100607. [Google Scholar]
  7. Li, H.; Chen, X.; Guo, J.; Chen, H. A 550 Mbit/s real-time visible light communication system based on phosphorescent white LED for practical high-speed low-complexity application. Opt. Express 2014, 22, 27203–27213. [Google Scholar] [CrossRef] [PubMed]
  8. Li, H.; Chen, X.; Huang, B.; Tang, D.; Chen, H. High Bandwidth Visible Light Communications Based on a Post-Equalization Circuit. IEEE Photonics Technol. Lett. 2014, 26, 119–122. [Google Scholar] [CrossRef]
  9. Huang, H.; Wang, C.; Wu, H.; Huang, C.; Yang, Z.; Wang, H. Optimiztion of the two-stage common-emitter transisor amplifier for equalization circuit in visible light communication system. In Opt. Quant. Electron. 2018, 50. [Google Scholar] [CrossRef]
  10. Deng, R.; He, J.; Zhou, Z.; Shi, J.; Hou, M.; Chen, L. Experimental demonstration of software-configurable asynchronous real-time OFDM signal transmission in a hybrid fiber-vllc system. IEEE Photonics J. 2017, 9. [Google Scholar] [CrossRef]
  11. Li, H.; Zhang, Y.; Chen, X.; Wu, C.; Guo, J.; Gao, Z.; Pei, W.; Chen, H. 682 Mbit/s phosphorescent white LED visible light communication system utilizing analog equalized 16 QAM-OFDM modulation without blue filter. Opt. Commun. 2015, 354, 107–111. [Google Scholar] [CrossRef]
  12. Grubor, J.; Randel, S.; Langer, K.D.; Walewski, J.W. Broadband information broadcasting using LED-based interior lighting. J. Lightwave Technol. 2008, 26, 3883–3892. [Google Scholar] [CrossRef]
  13. Feng, J.; Ding, L.; Wang, Y. Channel simulation of non-imaging optical MIMO communication. Opt. Photonics J. 2013, 3, 212–216. [Google Scholar] [CrossRef]
  14. Nguyen, H.Q.; Choi, J.H.; Kang, M.; Ghassemlooy, Z.; Kim, D.H.; Lim, S.K.; Kang, T.G.; Lee, C.G. A MATLAB-based simulation program for indoor visible light communication system. In Proceedings of the Communication Systems Networks and Digital Signal Processing (CSNDSP2010), Newcastle, UK, 21–23 July 2010; pp. 537–541. [Google Scholar]
  15. Zeng, L.; O’Brien, D.C.; Le Minh, H.; Faulkner, G.E.; Lee, K.; Jung, D.; Oh, Y.; Won, E.T. High data rate multiple input multiple output (MIMO) optical wireless communications using white LED lighting. IEEE J. Sel. Areas Commun. 2009, 27, 1654–1662. [Google Scholar] [CrossRef]
  16. Kahn, J.M.; Barry, J.R. Ambient Light Rejection Using a Novel Average Voltage Tracking in Visible Light Communication System. Appl. Sci. 2017, 7, 670. [Google Scholar] [Green Version]
  17. Texas Instruments. Monolithic Photodiode and Single-Supply Transimpedence Amplifier. In BPW34 Datasheet [Revised Aug. 2011]; Texas Instruments: Dallas, TX, USA, 2007. [Google Scholar]
  18. Vishay. Silicon PIN Photodiodes. In BPW34 Datasheet [Revised Aug. 2011]; Vishay: Malvern, PA, USA, 2007. [Google Scholar]
  19. Everlight. Silicon PIN Photodiodes. In PD1S-22B/TR8 datasheet [Revised Feb. 2014]; Everlight: New Taipei City, Taiwan, 2010. [Google Scholar]
  20. Everlight. 5 mm Round White LED(T-1 3/4). In 334-15/T1C1-4WYA Datasheet; Everlight: New Taipei City, Taiwan, 2007. [Google Scholar]
  21. Djahani, P.; Kahn, J.M. Analysis of infrared wireless links emplying multibeam transmitters and imaging diversity receivers. IEEE Trans. Commun. 2000, 48, 2077–2088. [Google Scholar] [CrossRef]
  22. Komine, T.; Nakagawa, M. Fundamental analysis for visible-light communication system using LED lights. IEEE Trans. Consum. Electron. 2004, 50, 100–107. [Google Scholar] [CrossRef]
  23. Komine, T.; Lee, J.H.; Haruyama, S.; Nakagawa, M. Adaptive equalization system for visible light communication utilizing multiple white LED lighting equipment. IEEE Trans. Wirel. Commun. 2009, 8, 2892–2900. [Google Scholar] [CrossRef]
  24. Khadr, M.H.; Fayed, H.A.; Abd El Aziz, A.; Aly, M. Bandwidth extension of an enhanced SNR with a higher light uniformity of a phosphorescent white LED based visible light communication system. In Proceedings of the Communication Systems Networks and Digital Signals Processing (CSNDSP’16), Prague, Czech Republic, 20–22 July 2016; pp. 461–466. [Google Scholar]
  25. Pei, Y.; Zhu, S.; Yang, H.; Zhao, L.; Yi, X.; Wang, J.; Li, J. LED modulation characteristics in a visible light communication system. Opt. Photonics J. 2013, 3, 139–142. [Google Scholar] [CrossRef]
  26. Yang, H.; Bergmans, J.W.M.; Schenk, T.C.W.; Linnartz, J.-P.M.G.; Rietman, R. Uniform illumination rendering using an array of LEDs: A signal processing perspective. IEEE Trans. Signal Process. 2009, 57, 1044–1057. [Google Scholar] [CrossRef]
  27. Mini-Circuits. Coaxial Amplifier 50 Ω. In ZHL-6A Datasheet; Mini-Circuits: Brooklyn, NY, USA, 2011. [Google Scholar]
  28. Zeng, L.; O’Brien, D.; Le-Minh, H.; Lee, K.; Jung, D.; Oh, Y. Improvement of data rate by using equalization in an indoor visible light communications system. In Proceedings of the IEEE International Conference on Circuits and Systems for Communications (ICCSC), Shanghai, China, 26–28 June 2008; pp. 678–682. [Google Scholar]
Figure 1. LEDs arrangements for (a) the 4 arrays model, (b) the 9 arrays model, and (c) the 16 arrays model.
Applsci 09 00986 g001
Figure 2. Received power for (a) the 4 arrays model, (b) the 9 arrays model, and (c) the 16 arrays model.
Applsci 09 00986 g002
Figure 3. The first reflection path received power (dBm) at field-of-view (FOV) = 50° for (a) the 4 arrays model, (b) the 9 arrays model, and (c) 16 arrays model. Total received power (dBm) for (d) the 4 arrays model, (e) the 9 arrays model, and (f) the 16 arrays model.
Applsci 09 00986 g003
Figure 4. Received power (dBm) at 1 / 2 = 10° (a) the case of 4 arrays, (b) the case of 9 arrays, and (c) the case of 16 arrays.
Applsci 09 00986 g004
Figure 5. Illuminance (lux) at 1 / 2 = 10° (a) the case of 4 arrays, (b) the case of 9 arrays, and (c) the case of 16 arrays.
Applsci 09 00986 g005
Figure 6. BER 1 / 2 = 30° (a) the 4 arrays model, (b) the 9 arrays model, and (c) the 16 arrays model.
Applsci 09 00986 g006
Figure 7. The simplified visible light communication (VLC) system block diagram.
Applsci 09 00986 g007
Figure 8. The pre-equalization circuit.
Applsci 09 00986 g008
Figure 9. Data at rates of (a) 20 Mb/s, (b) 200 Mb/s, and (c) 2 Gb/s.
Applsci 09 00986 g009aApplsci 09 00986 g009b
Table 1. Visible light communication (VLC) System Parameters.
ParameterValue
RoomDimensions5 × 5 × 3 m3
Reflection Coefficient from Walls0.8
SourceNumber of LEDs14,400
LED Transmitted power20 mW
Half power angle70°
ReceiverReceiver plane above ground0.85 m
Active surface area1 cm2
Half -angle FOV70°
Refractive index of lens1.5
Table 2. Power received for different LED arrangements.
Pr (dBm)4 Arrays Model9 Arrays Model16 Arrays Model
Average1.621.721.48
Minimum−1.51−2.09−1.30
Maximum2.573.752.53
STD0.911.330.82
Table 3. Maximum power received after changing the FOV.
Receiver FOVReceived Power (dBm)4 Arrays9 Arrays16 Arrays
70°First Reflection−4.64−5.42−4.28
Total Power2.573.752.53
60°First Reflection−4.95−5.19−4.54
Total Power3.134.353.06
50°First Reflection−4.78−5.21−4.49
Total Power3.975.343.74
Table 4. Power received at 1 / 2 = 10°.
Pr (dBm)4 Arrays9 Arrays16 Arrays
Average−7.3−3.53.2
Minimum−39.2−42.7−7.5
Maximum14.711.28.7
STD12.712.23.3
Table 5. Illuminance at 1 / 2 = 10°.
Illuminance (lux)4 Arrays9 Arrays16 Arrays
Average555453
Maximum584261147
Table 6. BER parameters [24].
ParameterValue
Photodiode Responsivity, R0.54
Photodetector Surface Area, A1 cm2
Bandwidth Factor, I20.562
Bandwidth Factor, I30.0868
Data Rate, B30 Mb/s
Temperature, T298 K
Capacitance per unit Area, η 112 pF/cm2
FET Transconductance, gm30 mS
FET Channel Noise Factor, Γ 1.5
Table 7. Illuminance at 1 / 2   = 30°.
Illuminance (lux)4 Arrays9 Arrays16 Arrays25 Arrays36 Arrays
Average407373326355350
Minimum109491167177
Maximum654730440604575
STD13519784355350
Table 8. Power received at 1 / 2 = 30°.
Received Power (dBm)4 Arrays9 Arrays16 Arrays25 Arrays36 Arrays
Average Pr3.33.13.23.23.2
Minimum Pr−2.5−4.6−1.0−3.0−2.7
Maximum Pr6.06.64.55.85.6
Pr STD1.72.61.22.01.8
Table 9. Minimum bit error rate (BER) and its corresponding signal to noise ratio (SNR) for the five configurations.
Bit Rate 1 / 2 4 Arrays Model9 Arrays Model16 Arrays Model25 Arrays Model36 Arrays Model
BERSNRBERSNRBERSNRBERSNRBERSNR
30 Mb/s30°5.0 × 10−1769.02.7 × 10−1770.22.3 × 10−1665.96.1 × 10−1768.67.5 × 10−1768.2
70°1.6 × 10−1562.14.9 × 10−1664.51.7 × 10−1562.07.9 × 10−1663.59.0 × 10−1663.3
300 Mb/s30°1.3 × 10−1249.06.7 × 10−1350.36.0 × 10−1246.01.5 × 10−1248.61.9 × 10−1248.2
70°4.2 × 10−1142.11.3 × 10−1144.54.4 × 10−1142.12.0 × 10−1143.62.3 × 10−1143.3
3 Gb/s30°3.6 × 10−829.01.9 × 10−830.21.8 × 10−725.94.5 × 10−828.65.5 × 10−828.2
70°1.3 × 10−622.13.8 × 10−724.41.4 × 10−622.06.2 × 10−723.57.1 × 10−723.3
Table 10. Effect of varying the feedback resistance Rf.
Rf (Ω)Maximum Attained Bandwidth (MHz)Gain at 3 dB Frequency (dB)
500345−42.3
450355−43.1
400366−44.3
350377−45.4
300390−46.7
250403−48.2
200416−50.1
150345−52.5
Table 11. The gain of the second stage of the proposed circuit at different Rf values.
Rf (Ω)Gain (dB)
5008.20
4507.31
4006.28
3505.15
3003.86
2502.28
2000.34
150−2.05