Article

The Optimization of Cold Rubidium Atom Two-Photon Transition Excitation with an Erbium-Fiber Optical Frequency Comb

School of electronics engineering and computer science, Peking University, No.5 Yiheyuan Road, Haidian District, Beijing 100871, China
*
Author to whom correspondence should be addressed.
Appl. Sci. 2019, 9(5), 921; https://doi.org/10.3390/app9050921
Submission received: 11 January 2019 / Revised: 28 February 2019 / Accepted: 1 March 2019 / Published: 5 March 2019
(This article belongs to the Section Optics and Lasers)

Abstract

:
We demonstrated the observation of cold rubidium atom two-photon transition excitation by a fiber optical frequency comb. In addition to this, we optimized the repetition rate of optical frequency comb to enhance two-photon intensity by controlling cavity length and pump source of optical comb. This technique can fine tune repetition rate to corresponding stepwise two-photon transition resonance frequency and improve the transition intensity by three times. This method is useful in Doppler laser cooling and detection of macromolecules.

1. Introduction

With the development of frequency-stabilization techniques [1,2,3] and laser cooling and trapping techniques [4], two-photon spectroscopy has developed fast in recent years. For its high accuracy and stability, two-photon spectroscopy has many practical applications in many fields, such as fiber communication [5,6], precision measurement [7,8,9,10,11,12,13,14,15], detection of macromolecules [16], and Doppler laser cooling [17,18]. Among this, the Rubidium (Rb) 5S1/2-5D5/2 two-photon transition (TPT) has unique advantages, such as narrow linewidth and low sensitivity to environment [19]. The relevant energy levels of Rb ladder type two-photon transition is shown in Figure 1. In addition, the 778 nm transition can be easily excited by frequency doubling the communication band lasers at the C band (an infrared communication band from 1530 to 1565 nm). For these reasons, it is suitable for optical communication frequency standard. The stability of the Rb two-photon frequency standard has reached 10−13 [20]. Because of many natural advantages of optical frequency comb (compact scheme, wide spectrum bandwidth and high peak intensity), the direct frequency comb spectroscopy (DFCS) on the TPTs is the research focus of two-photon spectroscopy [5,6,7,8,9,10,11,12,13,14,15]. Compared to a narrow-linewidth continuous wave (CW) laser, the linewidth of each optical comb teeth is easier to be realized and adjusted to sub-hertz [21]. Moreover, for its higher instantaneous power and higher conversion efficiency in the deep ultraviolet (122 nm or 200 nm) [18], optical frequency comb has the potential to demonstrate the TPT excitations of the C, H, N, and O atoms in organic chemistry that are not available for CW laser [18]. The two-photon spectroscopy using optical frequency combs was first proposed for observation of the 1s-2s transition of hydrogen atoms [7]. In addition, a coherent control method, which uses optical frequency comb to directly excite TPT, was proposed in recent years [8]. This method, which is called Direct Frequency Comb Spectroscopy (DFCS), is widely used for TPT spectroscopy of molecules and ions [5,6,9,10,11,12,13,14,15]. In the previous work, we explore a simplified scheme to obtain the DFCS of Rb two-photon transition [5,6]. In contrast to the conventional scheme, this scheme utilizes an Erbium-fiber-based frequency comb to excite the two-photon transition. The natural advantages of Erbium (Er) optical frequency make the whole scheme more simplified and robust.
In order to implement accuracy and stability of the system, we eliminate the Doppler-broadening, which is the main line broadening. The laser cooling technologies, such as magneto optical trap [4] and molasses, can eliminate most of the Doppler-broadening background. However, the number of atoms in the magneto-optical trap is much lower than the number of atoms in a normal gas cell.. Cold Rb TPT transition intensity is weak for establishing frequency standard or Doppler laser cooling. Therefore, following the previous research [5,6], we try to optimize repetition frequency of optical frequency comb to achieve higher transition intensity with the same average probe laser power. As the result of measurement, transition intensity is improved threefold.

2. Principle

Specific theoretical analysis is as follows. Each mode of optical frequency comb can be expressed as
F n = f 0 + n f r e p
where f0 is the carrier-envelop offset frequency, frep is the pulse repetition rate, and n is an integer on the order of 106. The sum frequency of two comb modes is given by
F s u m ( m + n ) = 2 f 0 + ( m + n ) f r e p
Whenever the sum frequency of two modes coincides transition frequency, the optical comb excites the two-photon transition. A hundred thousand pair modes can satisfy the resonant condition at the same time. When two comb modes are near resonance with the 5S-5P and 5P-5D transitions, the intermediate 5P state enhances stepwise two-photon transitions (S-TPT). We utilize this phenomenon to enhance the two-photon transition signal intensity.
Due to the negligible Doppler broadening in cold atom experiments, the S-TPT excitation conditions are more critical. S-TPT can be achieved only when the 5S-5P and 5P-5D transition frequency difference is exactly an integral multiple of the repetition frequency. If frep deviates (f776nmf780nm)/n, no S-TPT can be excited, because no other comb excites another single-photon transition when one comb frequency is aligned with a single-photon transition. To validate this feature, we consider all 14 S-TPT transition pathways for 5S1/2-5P3/2-5D5/2 of 87Rb. 14 S-TPT pathways and the TPT intensity of each TPT pathway are shown in Table 1.
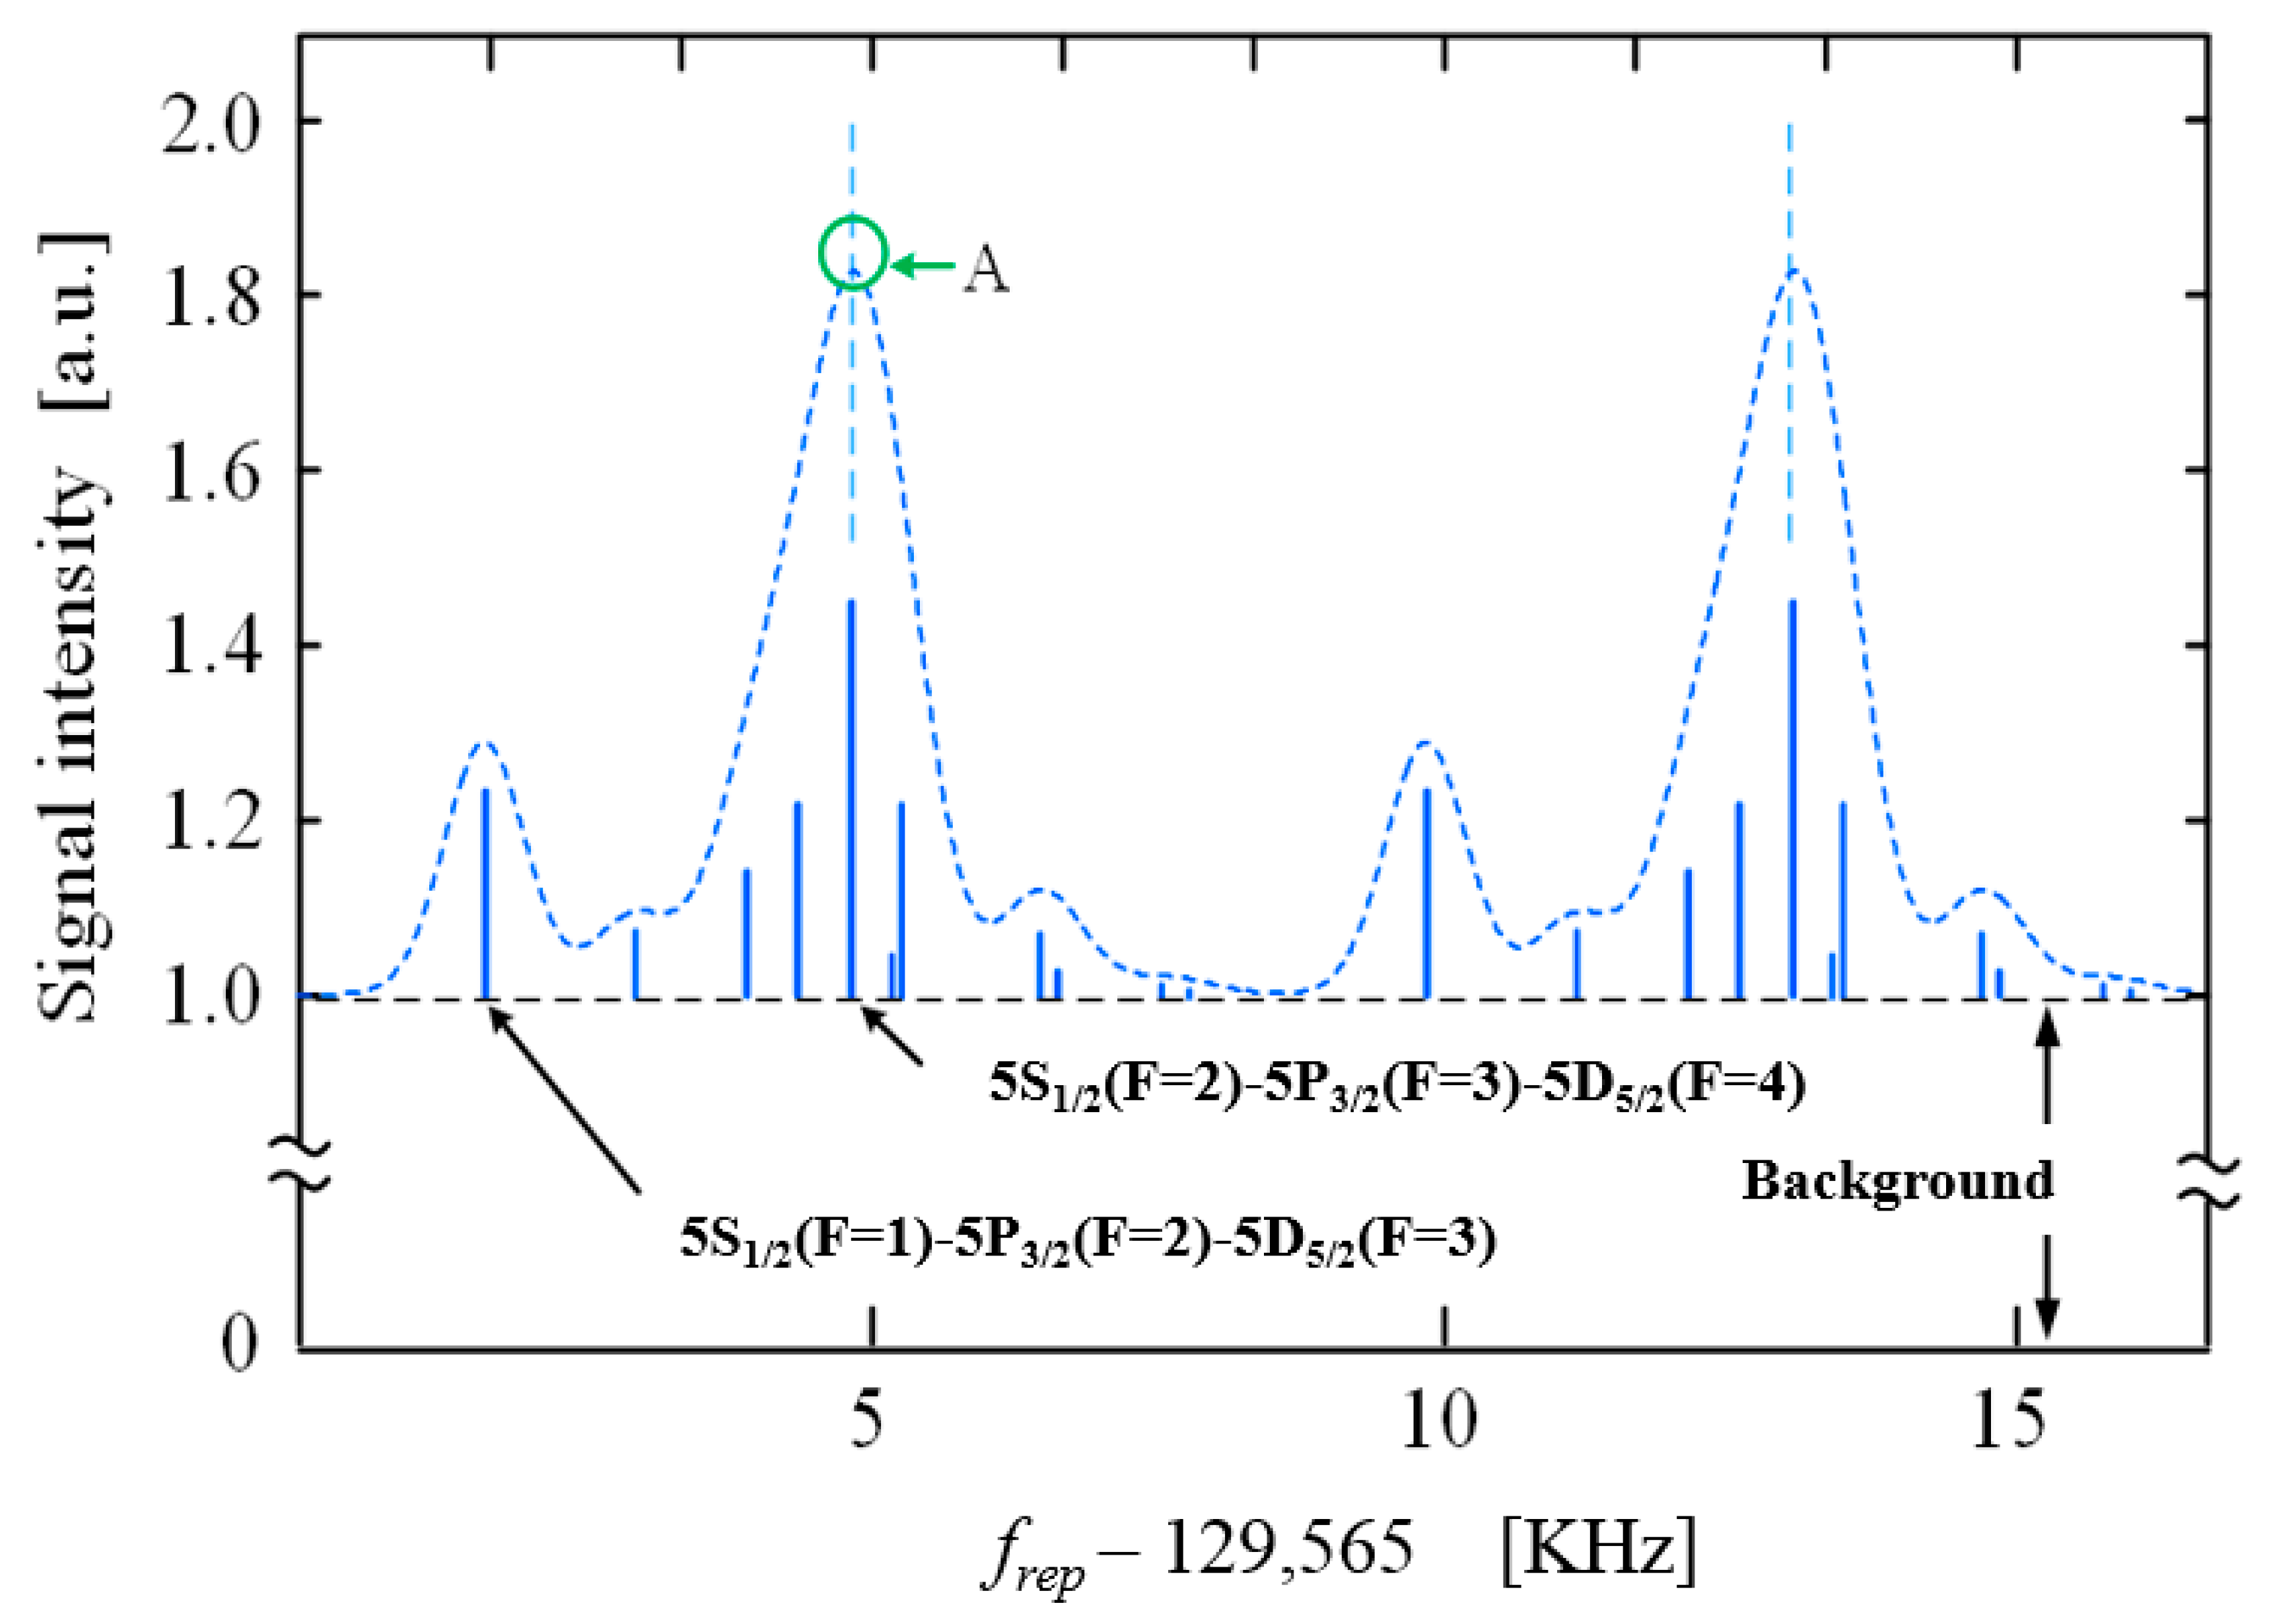
Each transition path has a different single-photon transition frequency, as well as a different two-step transition frequency difference, which has a different repetition frequency resonance value. The results in Figure 2 show the simulation curves of the total TPT intensities produced by these 14 S-TPT pathways with repetition rates. It can be seen that the S-TPT intensity exhibits a periodicity of about 8 kHz with frep, which corresponds to the range of variation of the repetition frequency from one resonance value to the next resonance value (Δf/n→Δf/(n + 1)). Take the transition path 5S1/2(F = 2)-5P3/2(F = 3)-5D5/2(F = 4) as an example. The two-step transition frequencies are f780nm = 384,228,115,203.2 kHz, f776nm = 386,341,017,529.38 kHz. The resonance frequency of the repetition frequency corresponding to the point A in the figure is (f776nmf780nm)/16,307 = 129,570 kHz. The next repetition resonance frequency value is (f776nmf780nm)/16,306 = 129,578 kHz. The difference between the two values is about 8 kHz. The calculation results of other points are also about 8 kHz, with only slight differences. So, as a whole, the TPT intensities exhibit periodicity of 8 kHz with frep.
Based on the above calculation and analysis, in order to further enhance the signal intensity of two-photon transition signal in cold atoms, we need to finely control frep. The standard technique to change repetition rate of an Er fiber optical frequency comb is to change the laser cavity length by a piezoelectric transducer (PZT) or a translation stage. The relationship between frep and cavity length can be given as
f r e p = c k · ( L + l ( t ) )
where L is the original length, l(t) is length of the PZT or the translation stage at time t, c is the light velocity, and k is the average refractive index of the cavity. The resolution of the laser’s phase shift is given as in Reference [22]:
min [ Δ θ o ( t ) ] = l r e s · t r e s L + l ( t ) + l r e s
where Δ θ o ( t ) is the laser’s phase shift, lres (most larger than 0.5 nm) is the length-tuning resolution of the PZT or the translation stage, and tres (usually in sub-microsecond scale) is the response time. However, limited by length-tuning resolution and long response time, it is hard for the laser’s phase shift to be smaller than 40 fs [22]. The cavity-length-controlling technique can demonstrate a wide range adjustment of frep, but is not suitable for fine adjustment.
The other way to change the repetition rate of the fiber optical frequency comb is using pump power modulation. This is different with Ti as with the sapphire frequency comb, gain fiber is added into the fiber optical comb cavity. Changes in pump power affect the interaction between atoms in gain fiber that result in changes of frep [23,24]. Based on the experiment and analysis in Reference [22], we know changing the pump source affects frep in a linear way. This method of adjustment is not limited by PZT length-tuning resolution and response time, and the laser’s phase resolution can increase by two orders of magnitude. By controlling the pump source, fine frep adjustment can be achieved.
In summary, combined with cavity length controlling and pump source controlling, we can find the frep corresponding S-TPT resonance to increase the two-photon transition intensity.

3. Experiment & Results

The experiment setup for our system is shown in Figure 3. An Erbium-fiber-based frequency comb with the 1556 nm center wavelength is used as the source to excite atoms. The Er frequency comb emits 100 fs pulses with 100 mW average power and a repletion rate of 129 MHz. The cavity length can be adjusted via a PZT and a translation stage in the cavity. A home-built two-stage erbium-doped fiber amplification module is used to amplify the output of 1556 nm mode-locked laser to 200 mw. In order to improve pulse peak power, the comb is compensated the pulse broadening in optical fiber with a pair of prisms made of silica. The properties of the optical pulse are adjusted to focus the power of the optical frequency comb spectrum to the vicinity of 1556 nm. Then we focus the beam into a periodically poled lithium niobate crystal (PPLN) by a lens to double the frequency of the comb. A 20 mW frequency comb with center wavelength of 778 nm is obtained in the end.
Secondly, the 778 nm frequency comb is directed into magneto optical trap (MOT) cell to probe the cold 87Rb atom cloud which is cooled and trapped in MOT. To eliminate the influence of magnetic fields in MOT, we design a timing control cycle. We switched off the magnetic fields in MOT when the 778 nm frequency comb is directed into MOT cell to excite the Rb atom for 2 ms. Then the magnetic fields are switched on and the atom cloud is captured and cooled in MOT for 8 ms, and the 778 nm frequency comb is switched off by Acousto-optical Modulators (AOM) at the same time. Repeating this 10 ms cycle, we demonstrate the excitation of the two-photon transition.
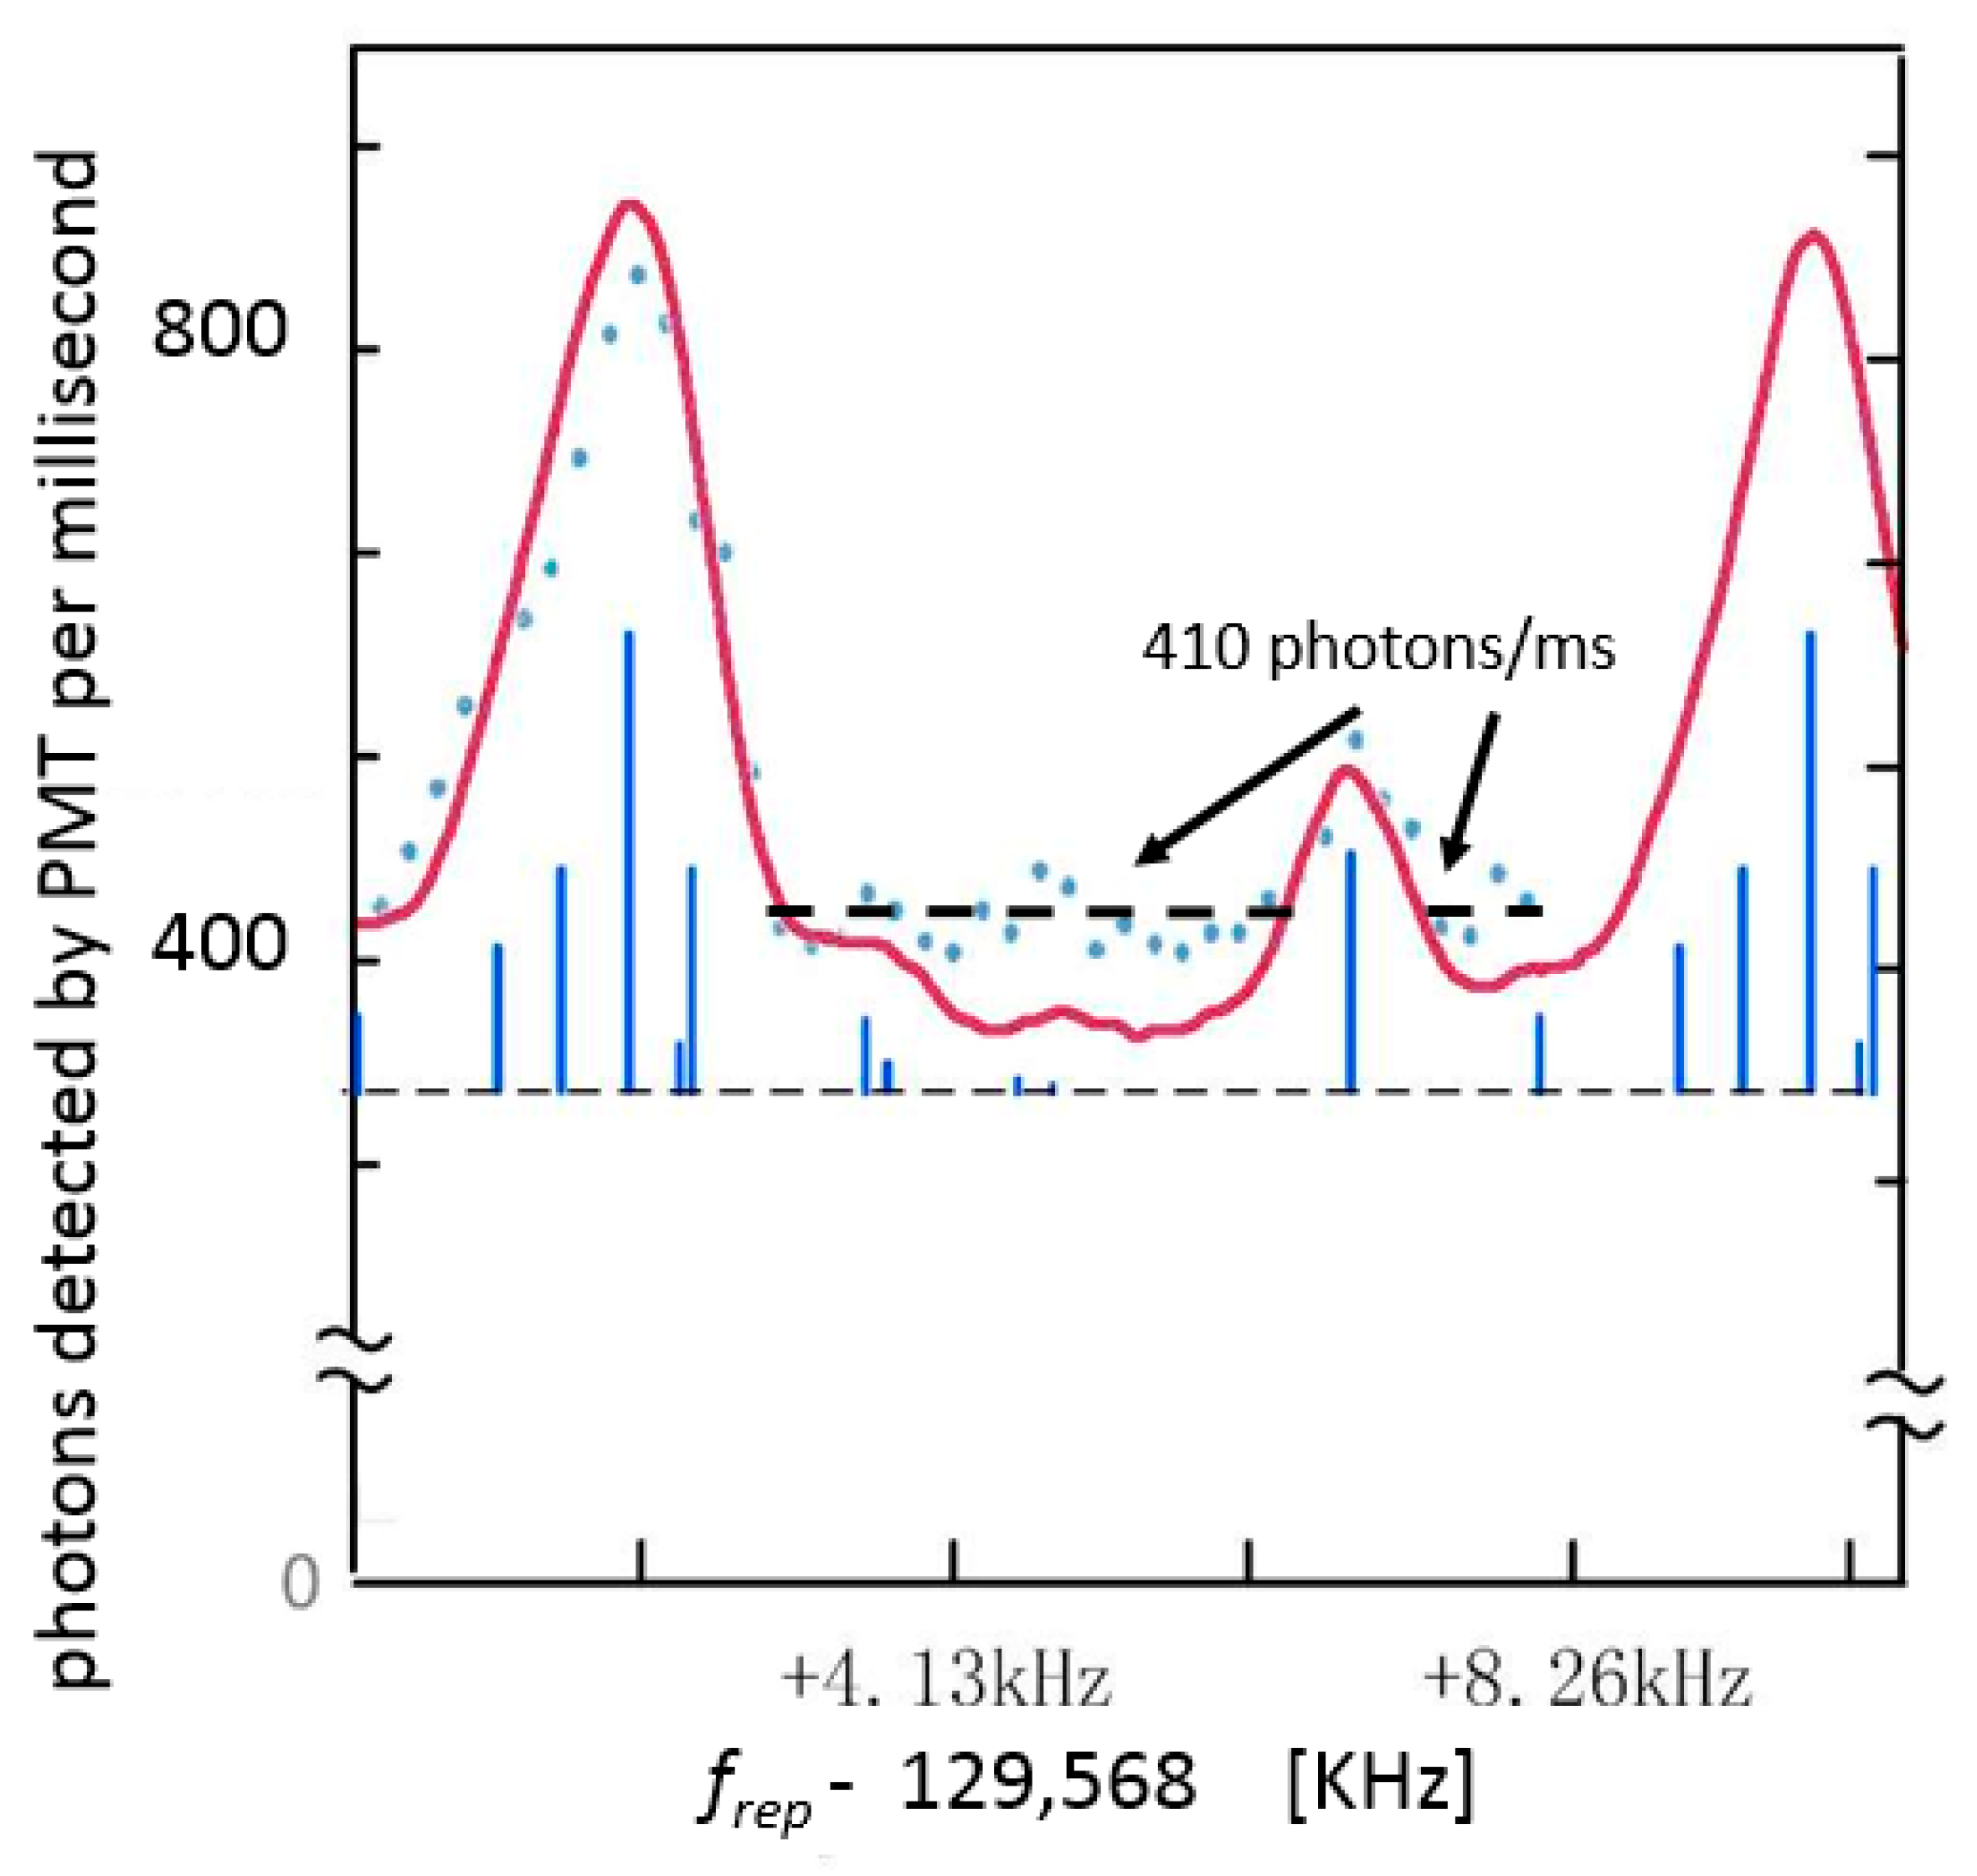
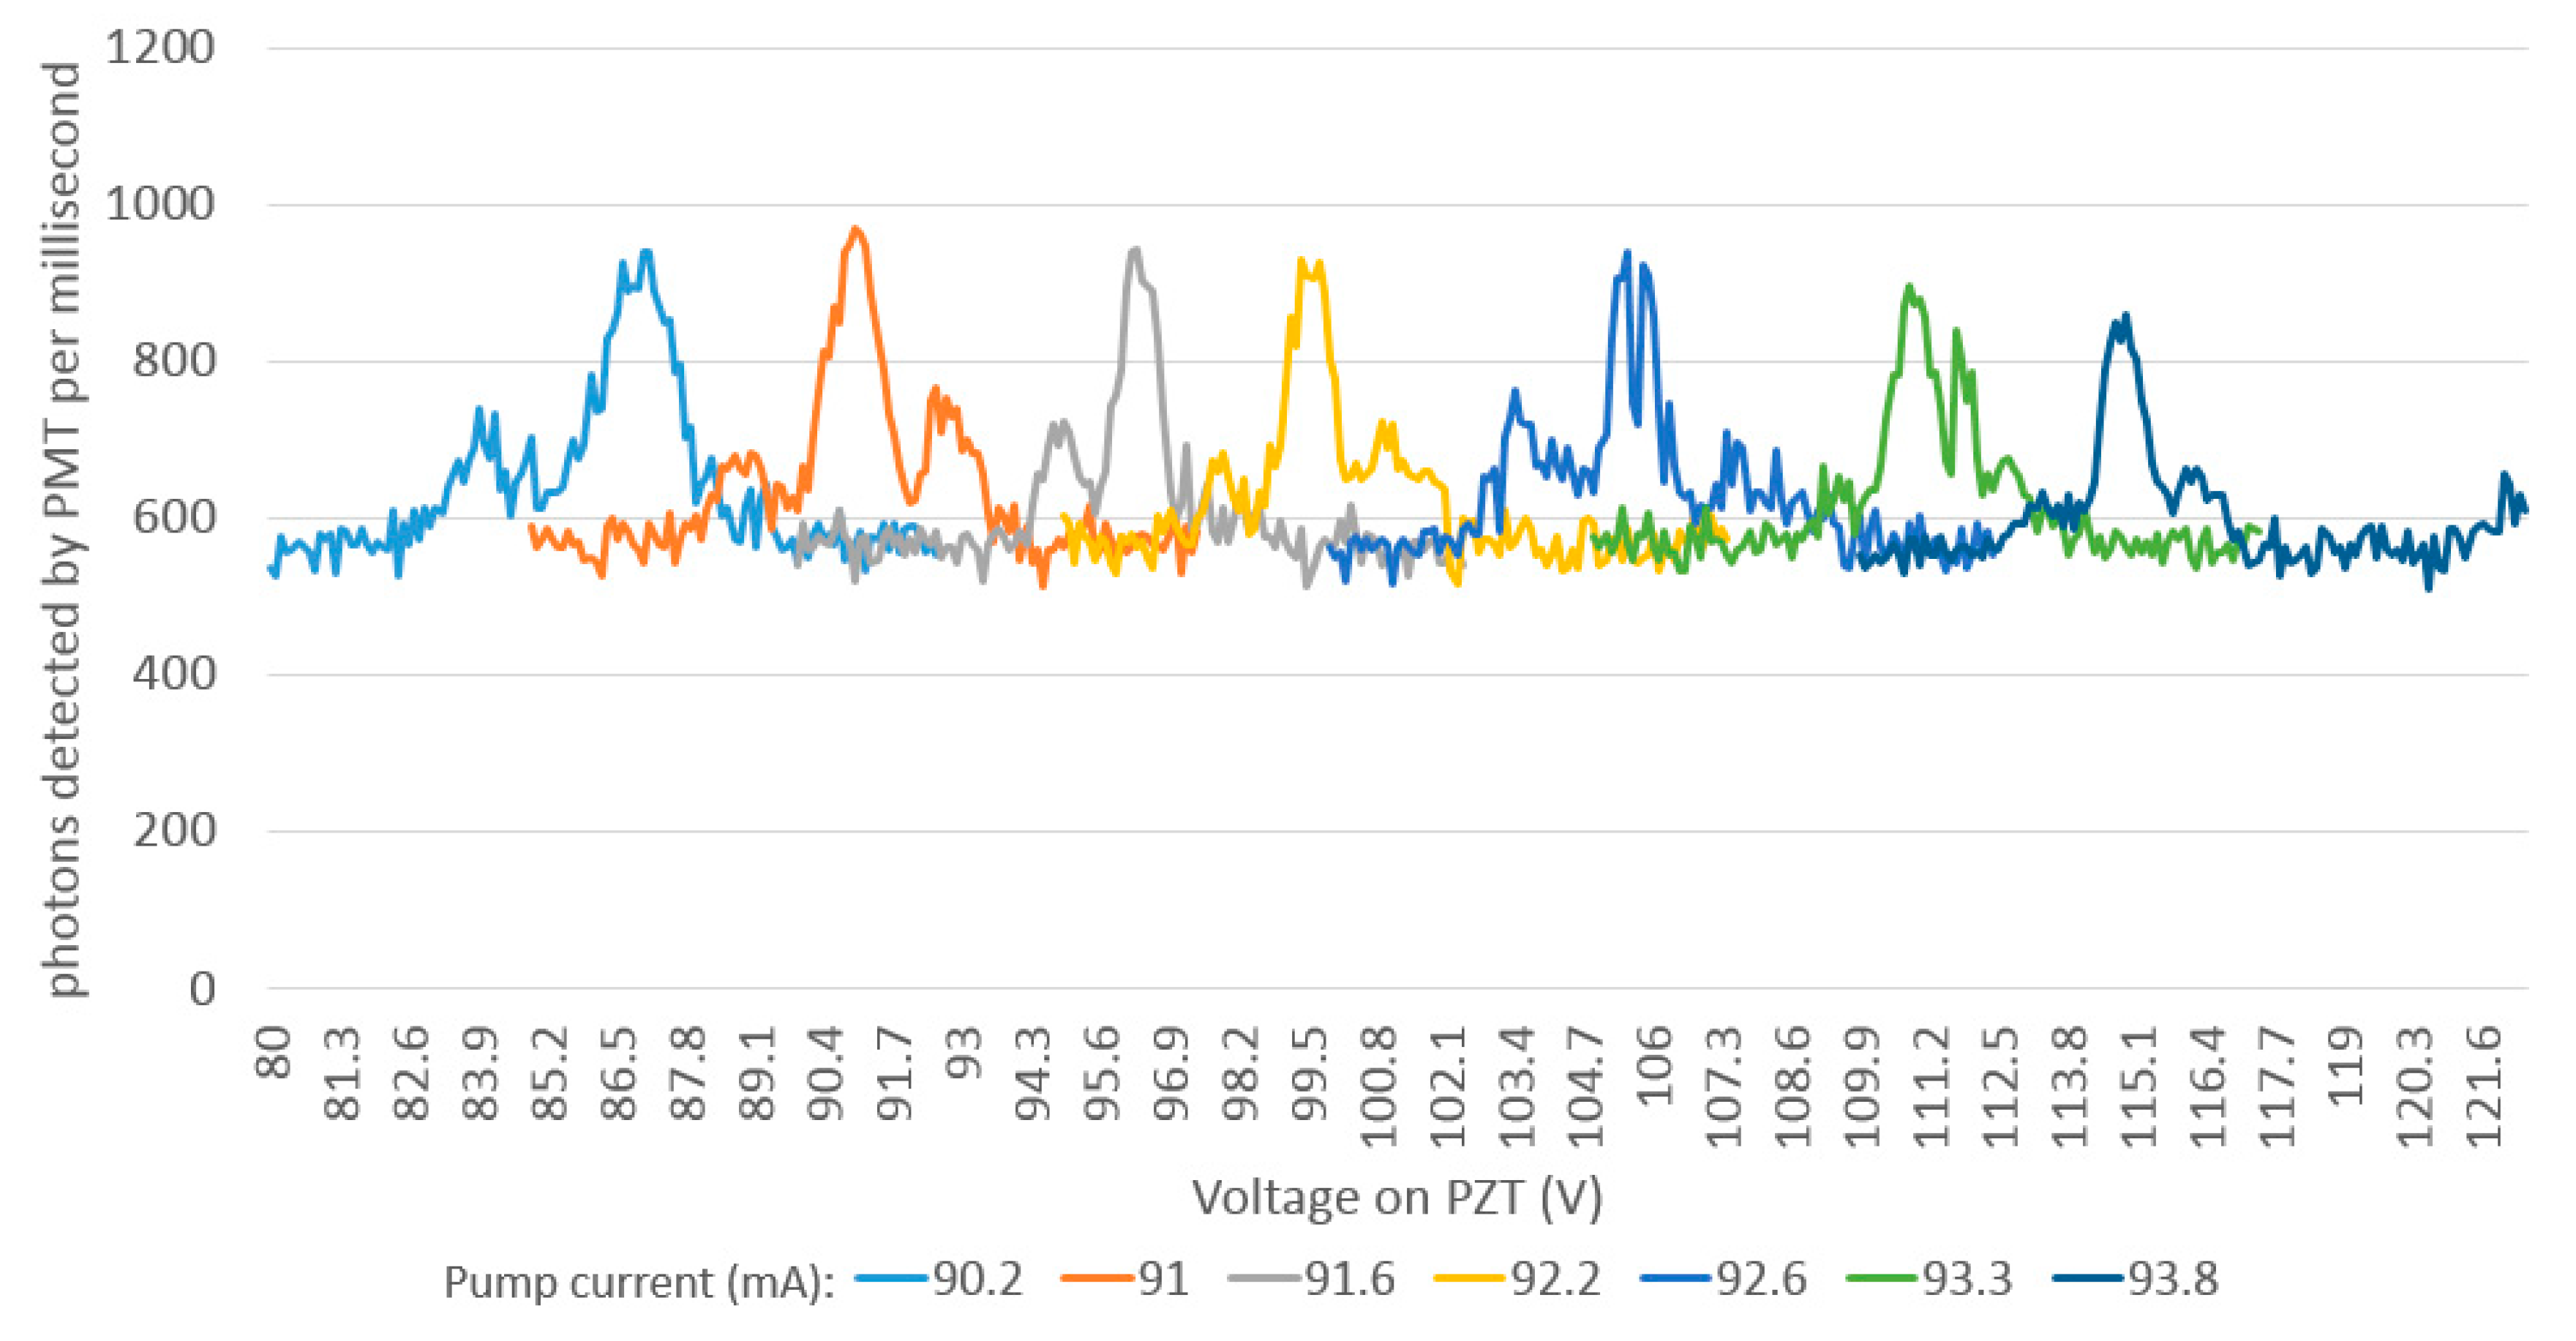
To verify the relationship between frep and TPT intensity, we scan frep and detect 420 nm fluorescence signal from cascade decay via the 6P-5S state with a photomultiplier (PMT), used in photon counting mode. First, in order to verify the simulation results in Figure 2, we fix the pump current at 92.2 mA in experiments and adjust the repetition frequency to observe the fluorescence signal at the same time. When we scan frep 50 Hz, the comb teeth at 780 nm will scan 129 MHz. So, we can get the direct frequency comb spectroscopy which illustrates all 5S→5D transition lines by scanning frep 50 Hz with controlling voltage on PZT. The intensity of each line depends on the center scanning frequency of frep. The peak intensity of the DFCS is recorded. Then, we change the center frep scanning frequency by adjusting the translation stage in cavity and repeat the above steps. The obtained result is shown in Figure 4. Blue dots show the peak intensity of the DFCS with different center frep scanning frequency. Red lines show simulation results. It can be seen that the experiment data and the simulation results are almost perfectly matched, which fully illustrates the influence of the repetition frequency on the two-photon intensity and verifies our theoretical analysis. Then, we verify the small change of repetition frequency caused by the pump power change. In ensuring the laser cavity length and average power fixed, we change the pump power and measure TPT intensity, and the results are shown in Figure 5. We can observe the small shift of the TPT peaks in the spectrum because the frequency of the two photon transitions is fixed. It can be seen that different pump powers affect the repetition frequency of the frequency comb.
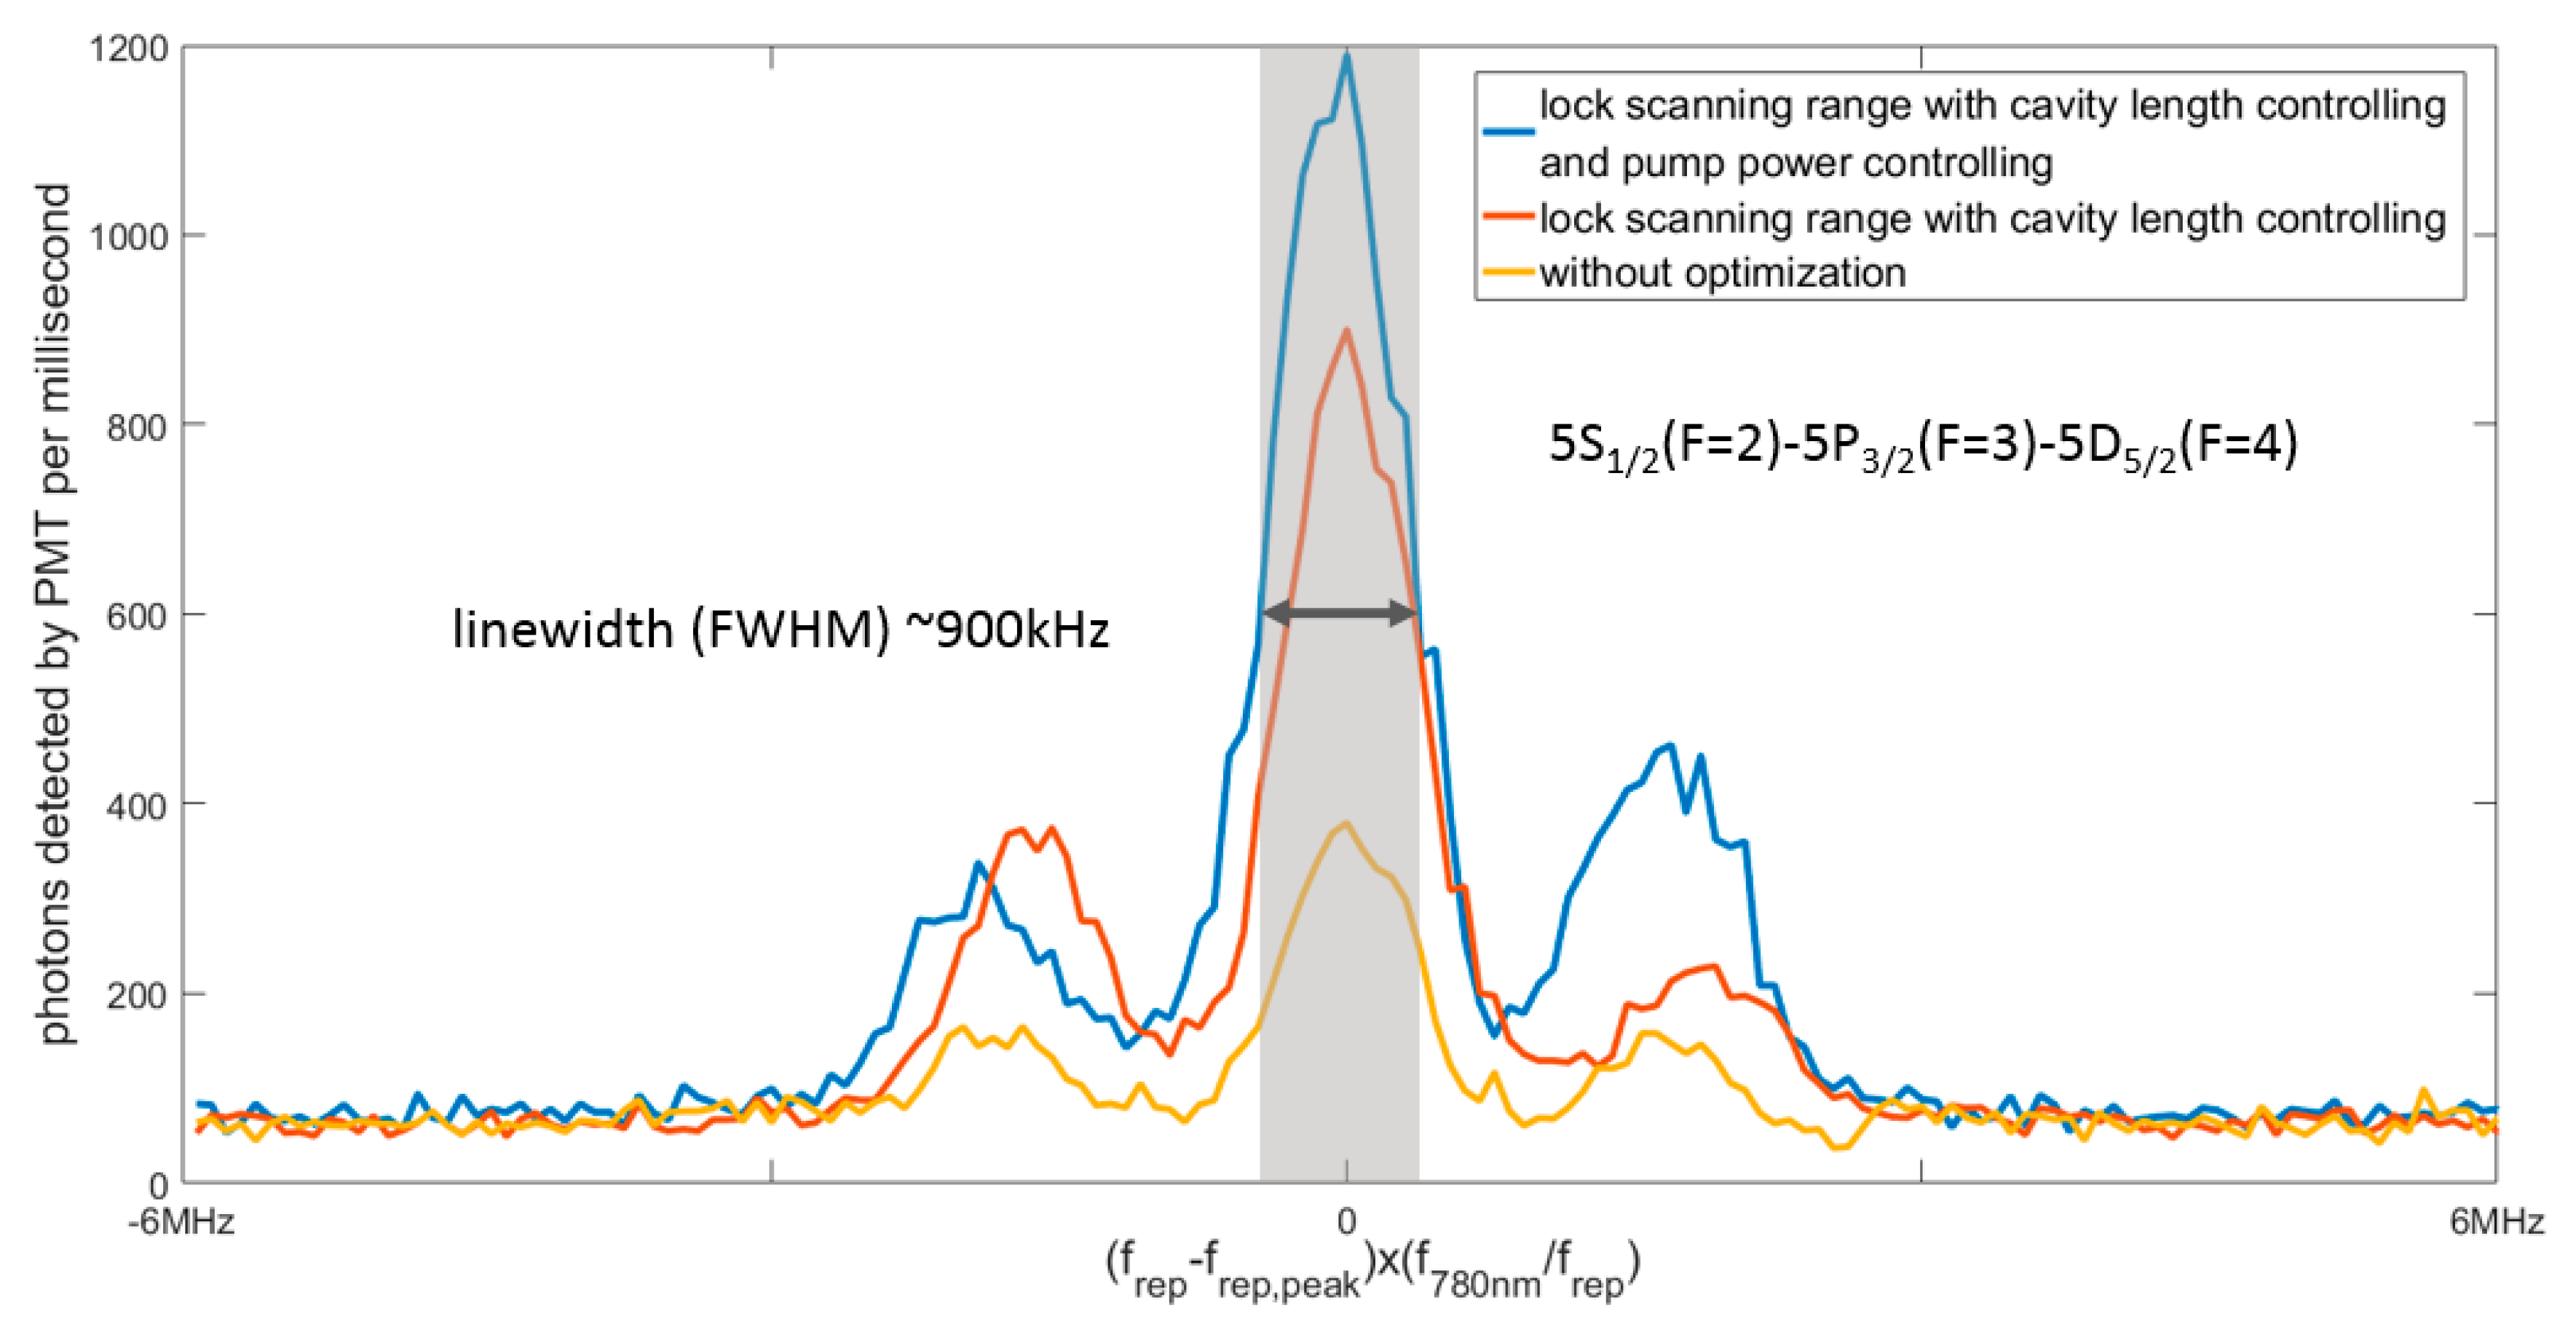
Finally, we improve the two-photon transition by adjusting the repetition frequency to corresponding S-TPT resonance frequency. The PMT signal is delivered into a lock-in amplifier to generate an error signal. The error signal is fed back to tune the PZT and pump source to lock center scanning frequency of frep to corresponding 5S1/2(F = 2)-5P3/2(F = 3)-5D5/2(F = 4) S-TPT resonance frequency. Next, we fine scan frep to get Rb TPT signals. Direct frequency comb spectroscopy of cold Rb TPTs is shown in Figure 6. The peak fluorescence intensity detected through PMT at the optimization spectrum in Figure 6 is about 1189 photons per millisecond when we tune frep with PZT and pump power. If we only optimize DFCS with controlling PZT, the peak intensity is 903 per millisecond. As a comparison, the peak intensity of most DFCS (about 75% DFCS) without frep optimization is around 400 photons per millisecond. The final TPT intensity can increase by up to three times before optimization. The experimental results are consistent with the simulation in Figure 4 which shows that the peak intensity (transition intensity after optimization) is 850 photons per millisecond and the bottom intensity (transition intensity without optimization) is 320 photons per millisecond. Due to weak Doppler Effect in MOT, the linewidth of the cooled Rb TPT resonance is improved. We achieve better linewidth in cooled atoms (about 900 kHz) compared with linewidth in thermal atoms in our previous work [6] (about 2 MHz). The residual linewidth is mainly due to the 600-kHz natural linewidth and the 300-kHz transit time broadening. The reduced linewidth is approximately equal to the Doppler broadening of the thermal atoms (about 1.2 MHz). This shows that we can ignore Doppler broadening in cold atoms.

4. Conclusions

In conclusion, we have demonstrated cold Rb atom two-photon transition excitation with an Er-fiber optical frequency comb. In addition, we optimized the repetition rate of optical frequency comb to enhance TPT intensity by controlling cavity length and pump source. The optimization method not only excites rubidium atoms to establish frequency standard, but also has applications for utilizing fiber optical comb to excite other atom TPTs. For example, there have been studies of Doppler cooling using fiber optical combs [25]. However, most of these studies are limited by the fiber optical combs power and have failed to expand in depth. The optimization method can greatly reduce the power required for Doppler cooling to solve power problem. It has many potential applications in Doppler laser cooling and detection of macromolecules [16].

Author Contributions

Data curation, J.L.; Investigation, H.L. and J.L.; Methodology, J.Z.; Writing, H.L. and J.Z.

Funding

This work was funded by the National Natural Science Foundation of China (NO. 61535001 & NO. 91836301) and the Program of International S&T Cooperation (No. 2016YFE0100200).

Conflicts of Interest

No conflict of interest.

References

  1. Young, B.C.; Cruz, F.C.; Itano, W.M.; Bergquist, J.C. Visible lasers with subhertz linewidths. Phys. Rev. Lett 1999, 82, 3799–3802. [Google Scholar] [CrossRef]
  2. Argence, B.; Chanteau, B.; Lopez, O.; Nicolodi, D.; Abgrall, M.; Chardonnet, C.; Daussy, C.; Darquié, B.; Le Coq, Y.; Amy-Klein, A. Quantum cascade laser frequency stabilization at the sub-hz level. Nat. Photonics 2015, 9, 1079–1083. [Google Scholar] [CrossRef]
  3. Jiang, Y.Y.; Ludlow, A.D.; Lemke, N.D.; Fox, R.W.; Sherman, J.A.; Ma, L.S.; Oates, C.W. Making optical atomic clocks more stable with 10−16-level laser stabilization. Nat. Photonics 2011, 5, 158–161. [Google Scholar] [CrossRef]
  4. Takamoto, M.; Katori, H. An optical lattice clock. Nature 2005, 435, 321–324. [Google Scholar] [CrossRef] [PubMed]
  5. Zhang, S.Y.; Wu, J.T.; Zhang, Y.L.; Leng, J.X.; Yang, W.P.; Zhang, Z.G.; Zhao, J.Y. Direct frequency comb optical frequency standard based on two-photon transitions of thermal atoms. Sci. Rep. 2015, 5, 15114. [Google Scholar] [CrossRef] [PubMed] [Green Version]
  6. Wu, J.; Hou, D.; Qin, Z.; Dai, X.; Zhang, Z.; Zhao, J. Erbium fiber laser-based direct frequency comb spectroscopy of Rb two-photon transitions. Opt. Lett. 2013, 38, 5028–5031. [Google Scholar] [CrossRef] [PubMed]
  7. Baklanov, Y.V.; Chebotayev, V.P. Narrow resonances of two-photon absorption of super-narrow pulses in a gas. Appl. Phys. 1977, 12, 97–99. [Google Scholar] [CrossRef]
  8. Marian, A.; Stowe, M.C.; Lawall, J.R.; Felinto, D.; Ye, J. United time-frequency spectroscopy for dynamics and global structure. Science 2004, 306, 2063–2068. [Google Scholar] [CrossRef] [PubMed]
  9. Adler, F.; Thorpe, M.J.; Cossel, K.C.; Ye, J. Cavity-enhanced direct frequency comb spectroscopy: Technology and applications. Appl. Phys. B 2008, 91, 397–414. [Google Scholar] [CrossRef] [PubMed]
  10. Cingöz, A.; Yost, D.C.; Allison, T.K.; Ruehl, A.; Fermann, M.E.; Hartl, I.; Ye, J. Direct frequency comb spectroscopy in the extreme ultraviolet. Nature 2012, 482, 68–71. [Google Scholar] [CrossRef] [PubMed] [Green Version]
  11. Barmes, I.; Witte, S.; Eikema, K.S.E. Spatial and spectral coherent control with frequency combs. Nat. Photonics 2013, 7, 38–42. [Google Scholar] [CrossRef]
  12. Barmes, I.; Witte, S.; Eikema, K.S.E. High-precision spectroscopy with counter-propagating femtosecond pulses. Phys. Rev. Lett. 2013, 111, 023007. [Google Scholar] [CrossRef] [PubMed]
  13. Yost, D.C.; Matveev, A.; Peters, E.; Beyer, A.; Hänsch, T.W.; Udem, T. Quantum interference in two-photon frequency-comb spectroscopy. Phys. Rev. A 2014, 90, 012512. [Google Scholar] [CrossRef]
  14. Stalnaker, J.E.; Ayer, H.M.G.; Baron, J.H.; Nuñez, A.; Rowan, M.E. Measurement of the 4S1/2→ 6S1/2 transition frequency in atomic potassium via direct frequency-comb spectroscopy. Phys. Rev. A 2017, 96, 012504. [Google Scholar] [CrossRef]
  15. Kim, K.; Ahn, J. Direct frequency-comb spectroscopy of 6s2s1/2-8s2s1/2 transitions of atomic cesium. J. Phys. B Atom. Mol. Phys. 2018, 51, 035001. [Google Scholar] [CrossRef]
  16. Zeng, L.; Chen, S.; Xia, T.; Hu, W.; Li, C.; Liu, Z. Two-photon fluorescent probe for detection of exogenous and endogenous hydrogen persulfide and polysulfide in living organisms. Anal. Chem. 2015, 87, 3004–3010. [Google Scholar] [CrossRef] [PubMed]
  17. Wu, S.; Plisson, T.; Brown, R.C.; Phillips, W.D.; Porto, J.V. Multiphoton magnetooptical trap. Physi. Rev. Lett. 2009, 103, 173003. [Google Scholar] [CrossRef] [PubMed]
  18. Jayich, A.M.; Long, X.; Campbell, W.C. Direct frequency comb laser cooling and trapping. Phys. Rev. X 2016, 6, 041004. [Google Scholar] [CrossRef]
  19. Ye, J.; Swartz, S.; Jungner, P.; Hall, J.L. Hyperfine structure and absolute frequency of the 87 Rb 5P 3/2 state. Opt. Lett. 1996, 21, 1280–1282. [Google Scholar] [CrossRef] [PubMed]
  20. Touahri, D.; Acef, O.; Clairon, A.; Zondy, J.J.; Felder, R.; Hilico, L.; Nez, F. Frequency measurement of the 5S1/2(F=3)−5D5/2(F=5) two-photon transition in rubidium. Opt. Commun. 1997, 133, 471–478. [Google Scholar] [CrossRef]
  21. Kim, Y.; Kim, Y.J.; Kim, S.; Kim, S.W. Er-doped fiber comb with enhanced fceo S/N ratio using Tm: Ho-doped fiber. Opt. Express 2009, 17, 18606–18611. [Google Scholar] [CrossRef] [PubMed]
  22. Ning, B.; Hou, D.; Du, P.; Zhao, J. Long-term repetition frequency stabilization of passively mode-locked fiber lasers using high-frequency harmonic synchronization. IEEE J. Quantum Electron. 2013, 49, 503–510. [Google Scholar] [CrossRef]
  23. Yariv, A. Quantum Electronics, 3rd ed.; Wiley: New York, NY, USA, 1988. [Google Scholar]
  24. Svelto, O.; Hanna, D.C. Principles of Lasers, 5th ed.; Springer: New York, NY, USA, 2010. [Google Scholar]
  25. Ilinova, E.; Ahmad, M.; Derevianko, A. Doppler cooling with coherent trains of laser pulses and a tunable velocity comb. Phys. Rev. A 2011, 84, 19781–19789. [Google Scholar] [CrossRef]
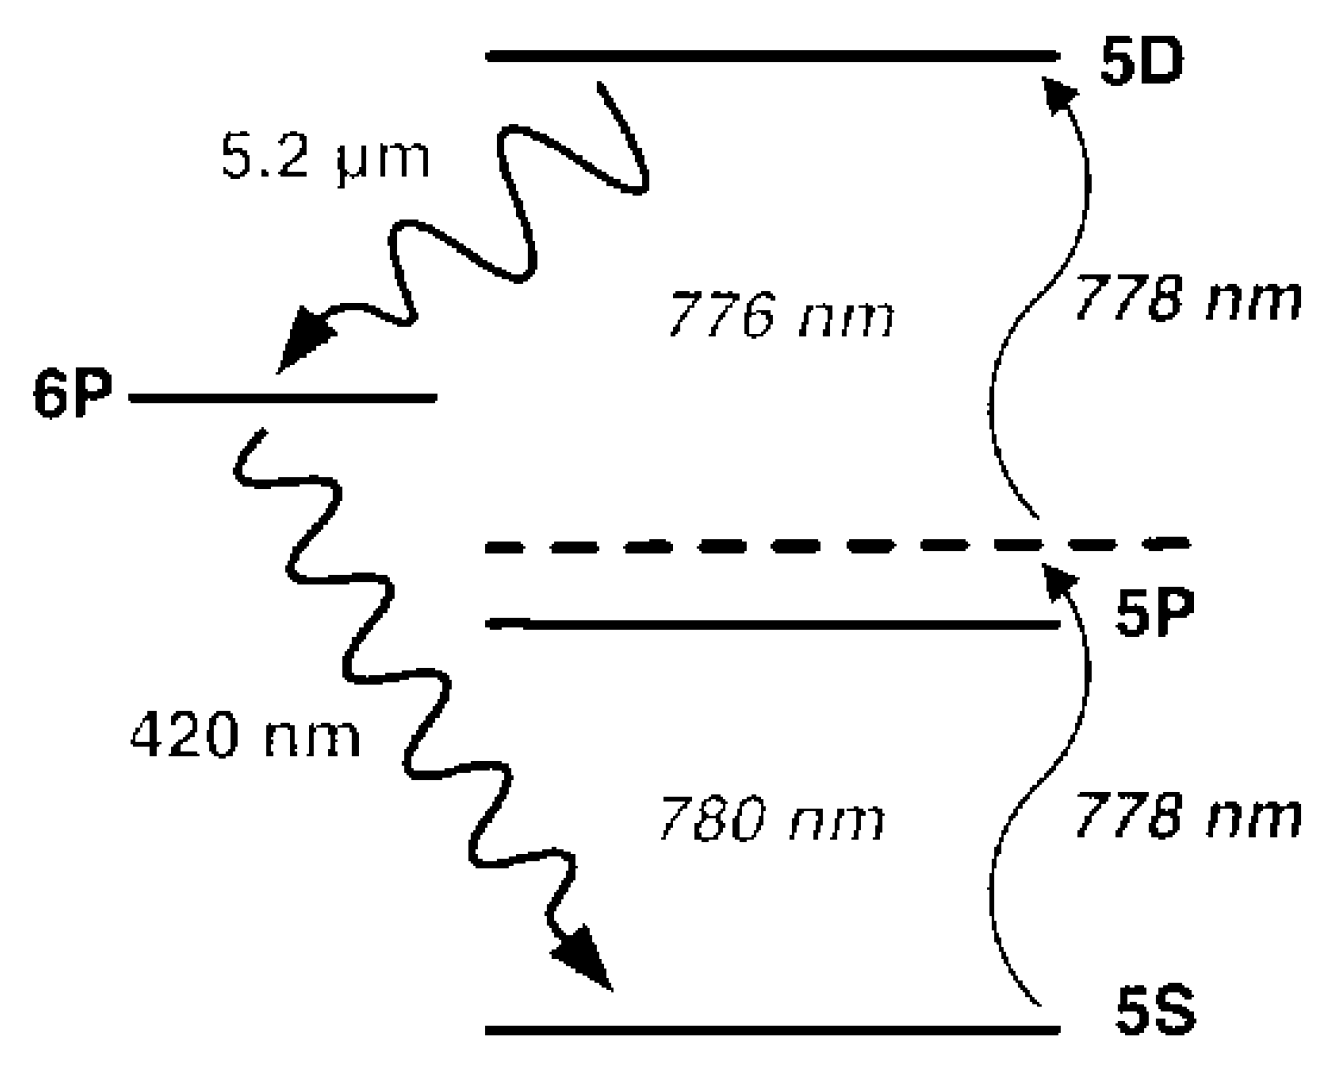
Figure 1. The ladder-type three-level of Rb two-photon transition (TPT).
Applsci 09 00921 g001
Figure 2. Simulation results about relationship between repetition rate of comb and transition intensity. Dotted lines indicate simulation results. Vertical line indicates 14 stepwise two-photon transitions (S-TPT) pathways. The resonance frequency of the repetition frequency corresponding to the point A is (f776nmf780nm)/16,307 = 129,570 kHz.
Applsci 09 00921 g002
Figure 3. Simplified block diagram for stabilization system. MLL: Mode-locked laser; EDF: Er-doped fiber; ISO: isolator; HNLF: High non-linear fiber; PPLN: Periodically Poled Lithium Niobate; PMT: photon-multiplier; MOT: magneto optical trap; QWP: quarter-wave plate; HWP: half-wave plate.
Applsci 09 00921 g003
Figure 4. Relationship between repetition rate of comb and two-photon transition intensity. Red lines show simulation results. Blue dots show experiment results. The dashed line shows the average peak intensity of direct frequency comb spectroscopy (DFCS) without optimization.
Applsci 09 00921 g004
Figure 5. The small frep change caused by the pump power change.
Applsci 09 00921 g005
Figure 6. Spectrum of cold Rb TPTs directly excited by the Erbium-fiber optical frequency comb. frep,peak is the corresponding repetition frequency to intensity peak of each DFCS.
Applsci 09 00921 g006
Table 1. 14 two-photon transition (TPT) pathways and transition intensity of these pathways.
Rb87 TPT PathwaysIntensity
5S1/2(F = 1)→5P3/2(F = 0)→5D5/2(F = 1)0.1666
5S1/2(F = 1)→5P3/2(F = 1)→5D5/2(F = 1)0.125
5S1/2(F = 1)→5P3/2(F = 1)→5D5/2(F = 2)0.2916
5S1/2(F = 1)→5P3/2(F = 2)→5D5/2(F = 1)0.00817
5S1/2(F = 1)→5P3/2(F = 2)→5D5/2(F = 2)0.0972
5S1/2(F = 1)→5P3/2(F = 2)→5D5/2(F = 3)0.3111
5S1/2(F = 2)→5P3/2(F = 1)→5D5/2(F = 1)0.015
5S1/2(F = 2)→5P3/2(F = 1)→5D5/2(F = 2)0.035
5S1/2(F = 2)→5P3/2(F = 2)→5D5/2(F = 1)0.0049
5S1/2(F = 2)→5P3/2(F = 2)→5D5/2(F = 2)0.0583
5S1/2(F = 2)→5P3/2(F = 2)→5D5/2(F = 3)0.1866
5S1/2(F = 2)→5P3/2(F = 3)→5D5/2(F = 2)0.0066
5S1/2(F = 2)→5P3/2(F = 3)→5D5/2(F = 3)0.0933
5S1/2(F = 2)→5P3/2(F = 3)→5D5/2(F = 4)0.5999