Optimal Design of Hybrid PV-Battery System in Residential Buildings: End-User Economics, and PV Penetration


 ,
, 
Abstract
1. Introduction
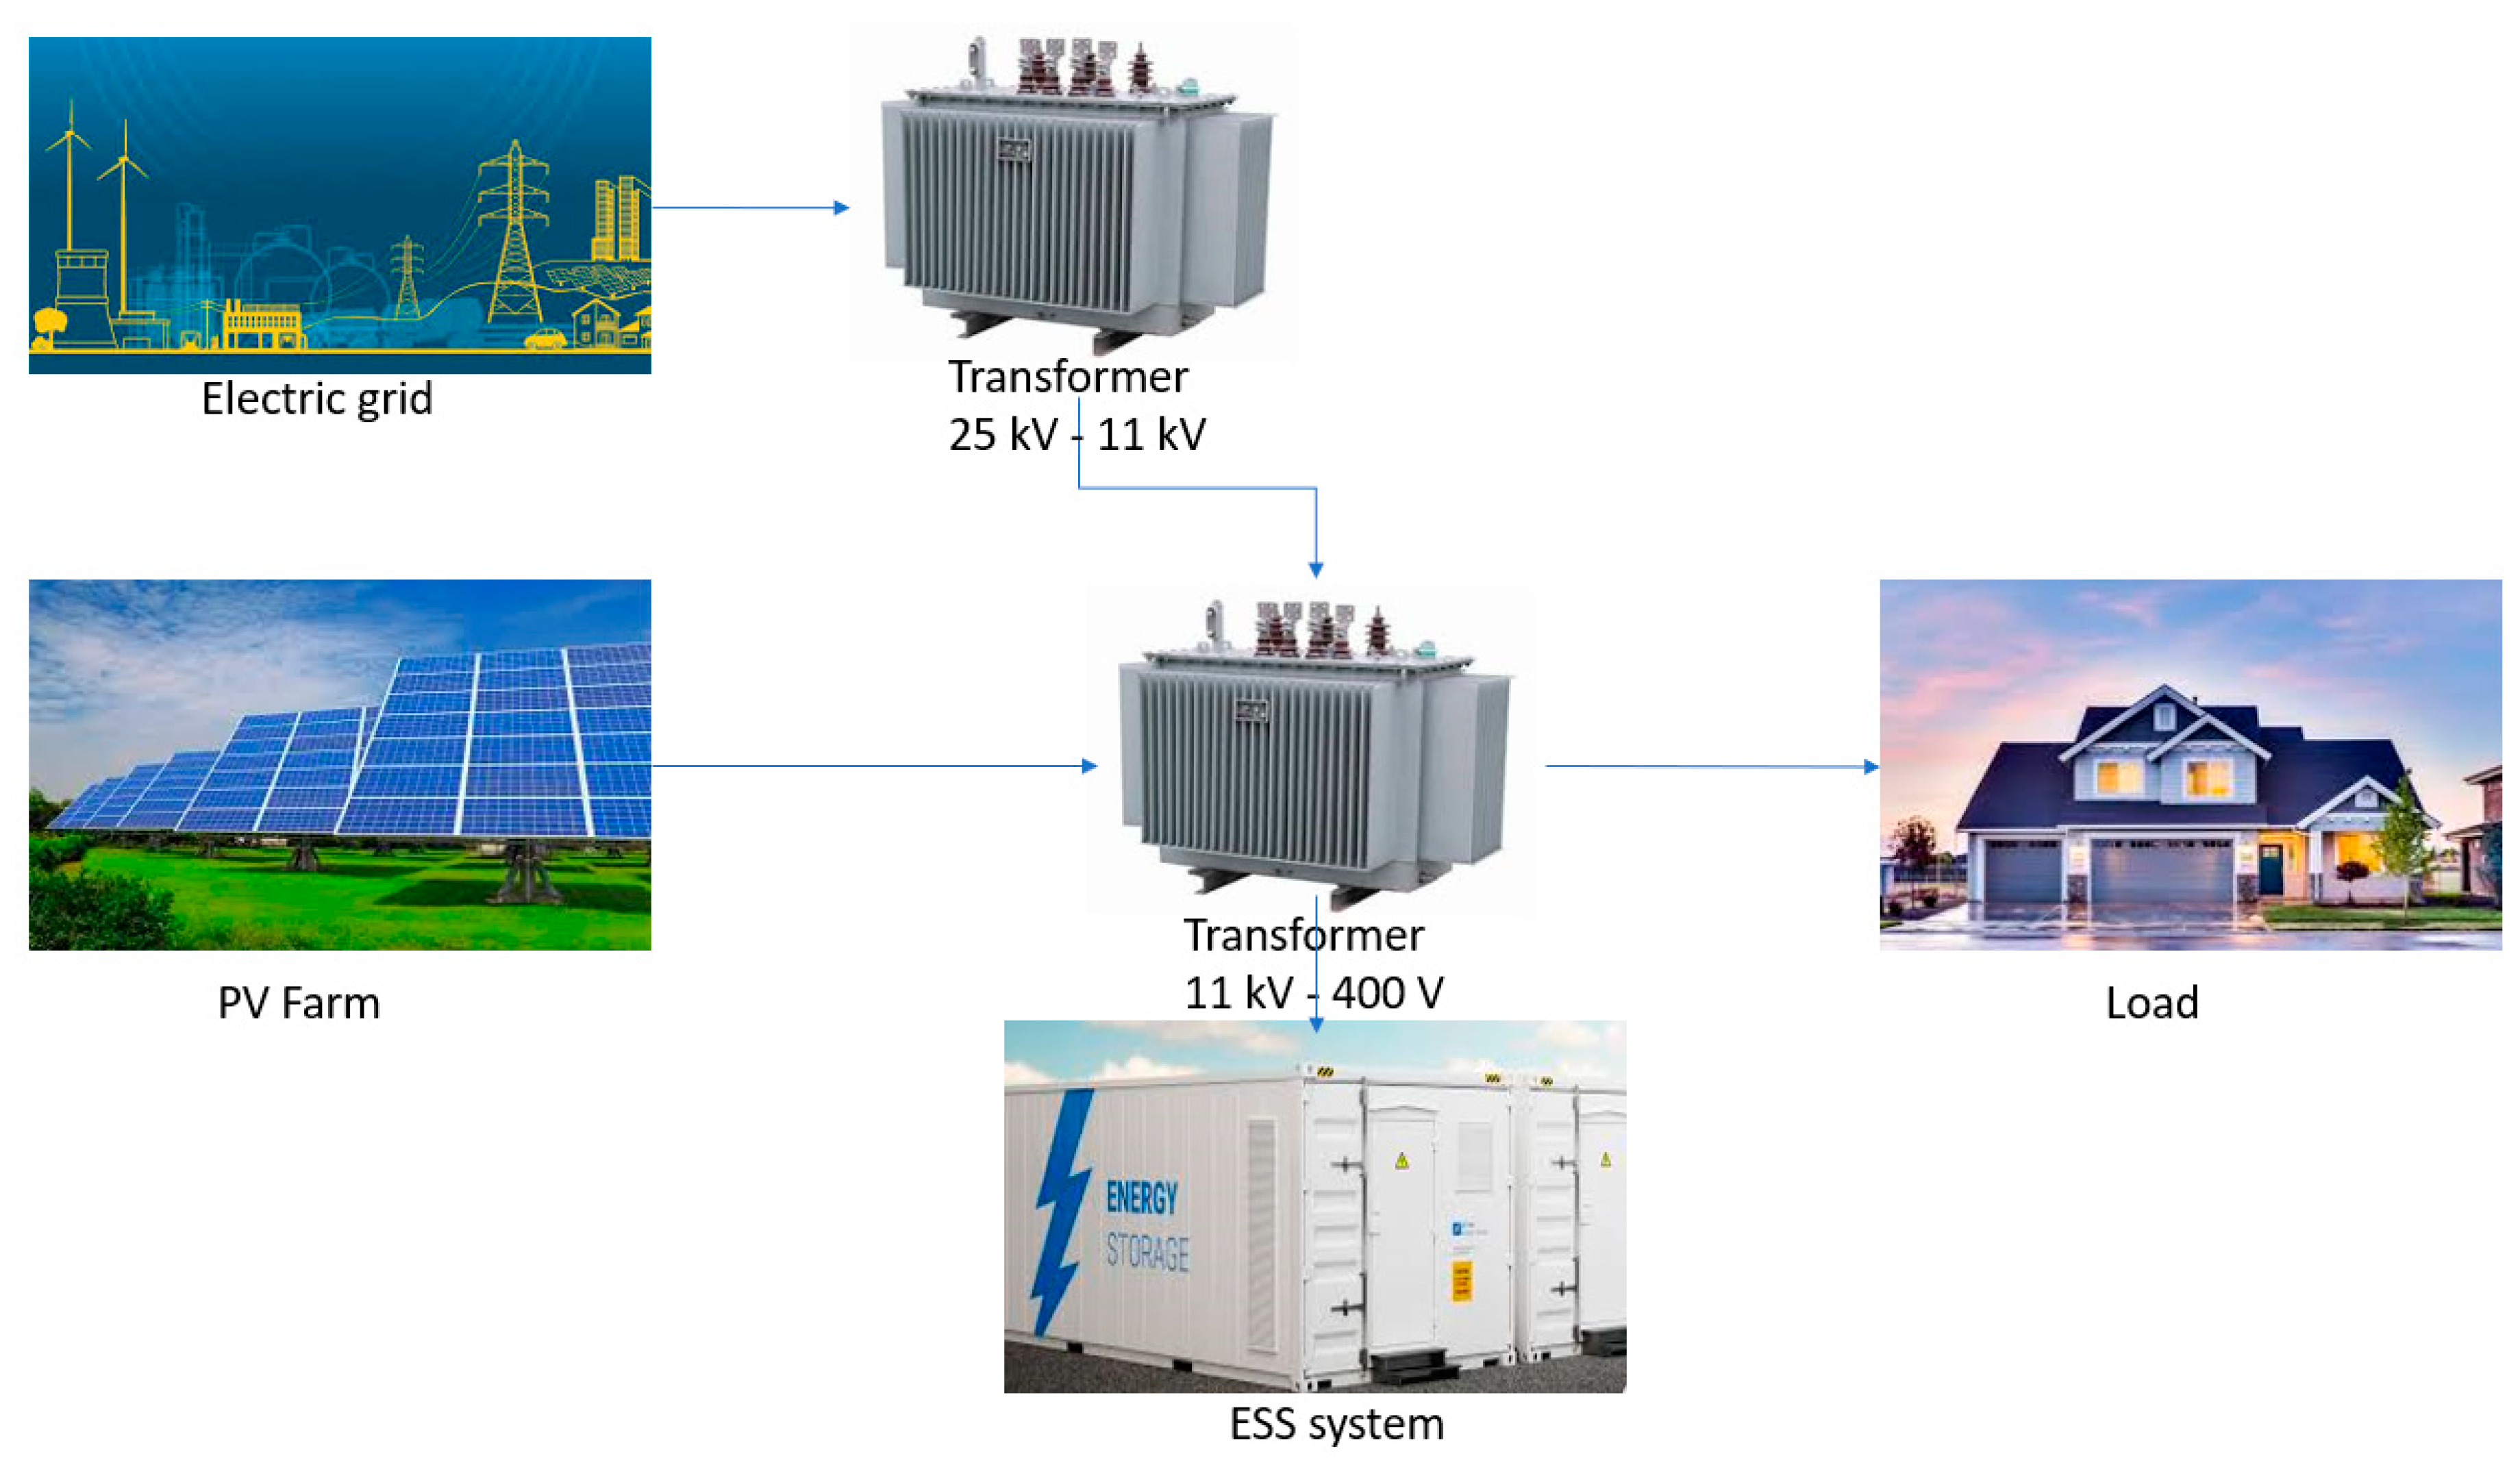
2. Grid Structure
3. Optimal Sizing of Distributed Generators (DGs): Formulation, Constraints and Algorithm
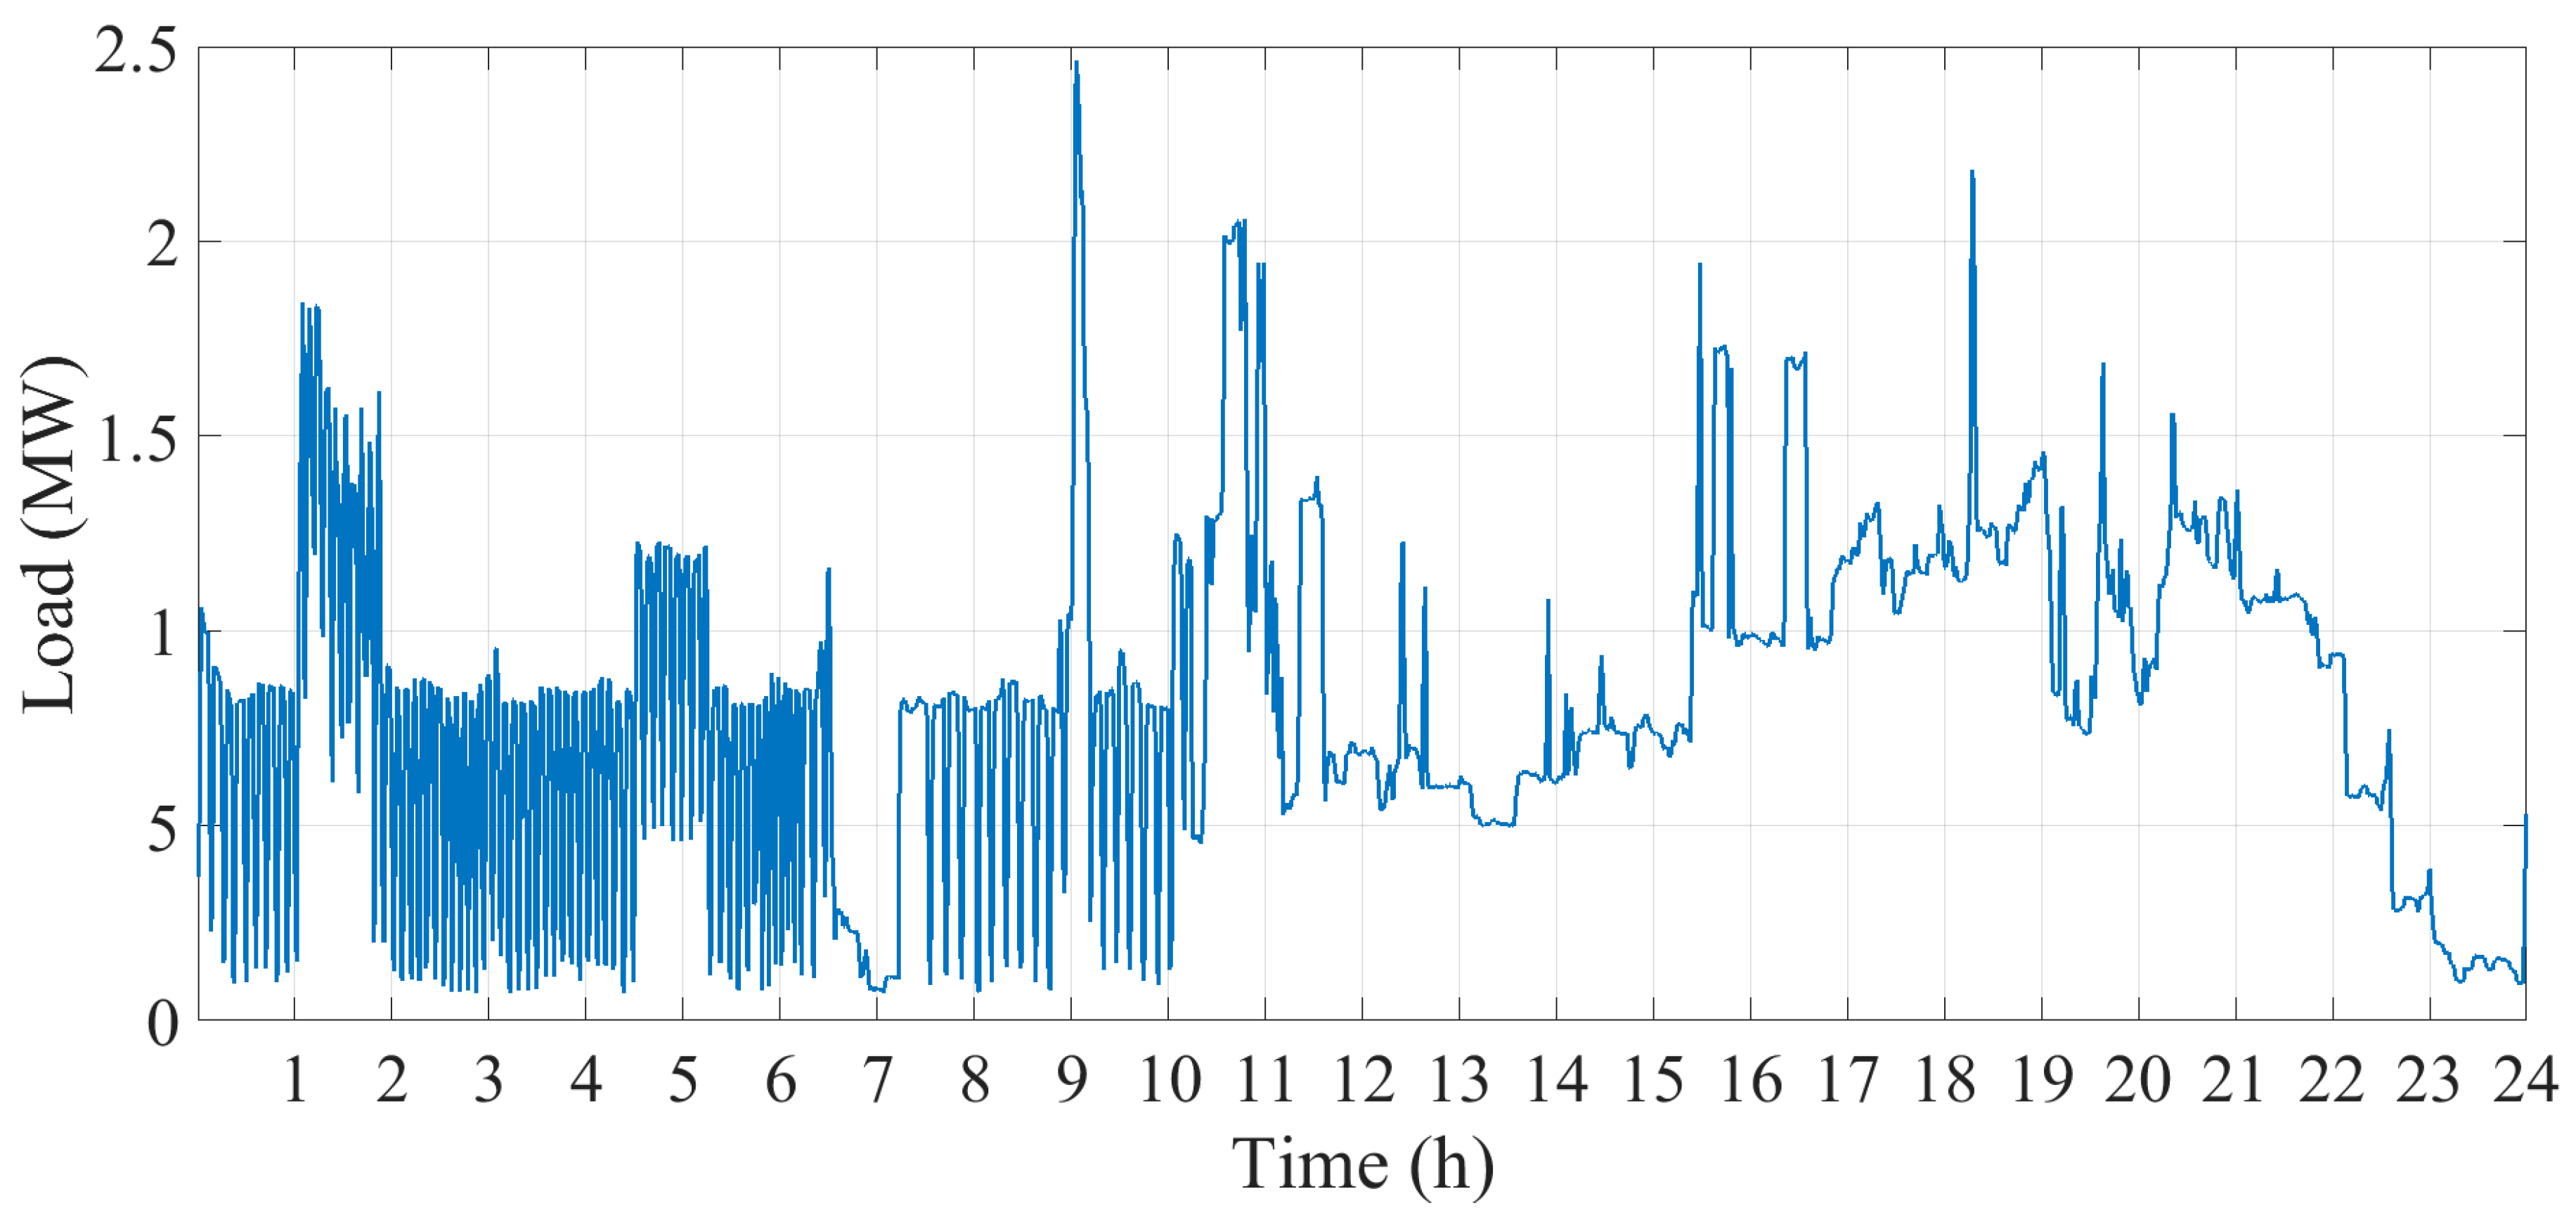
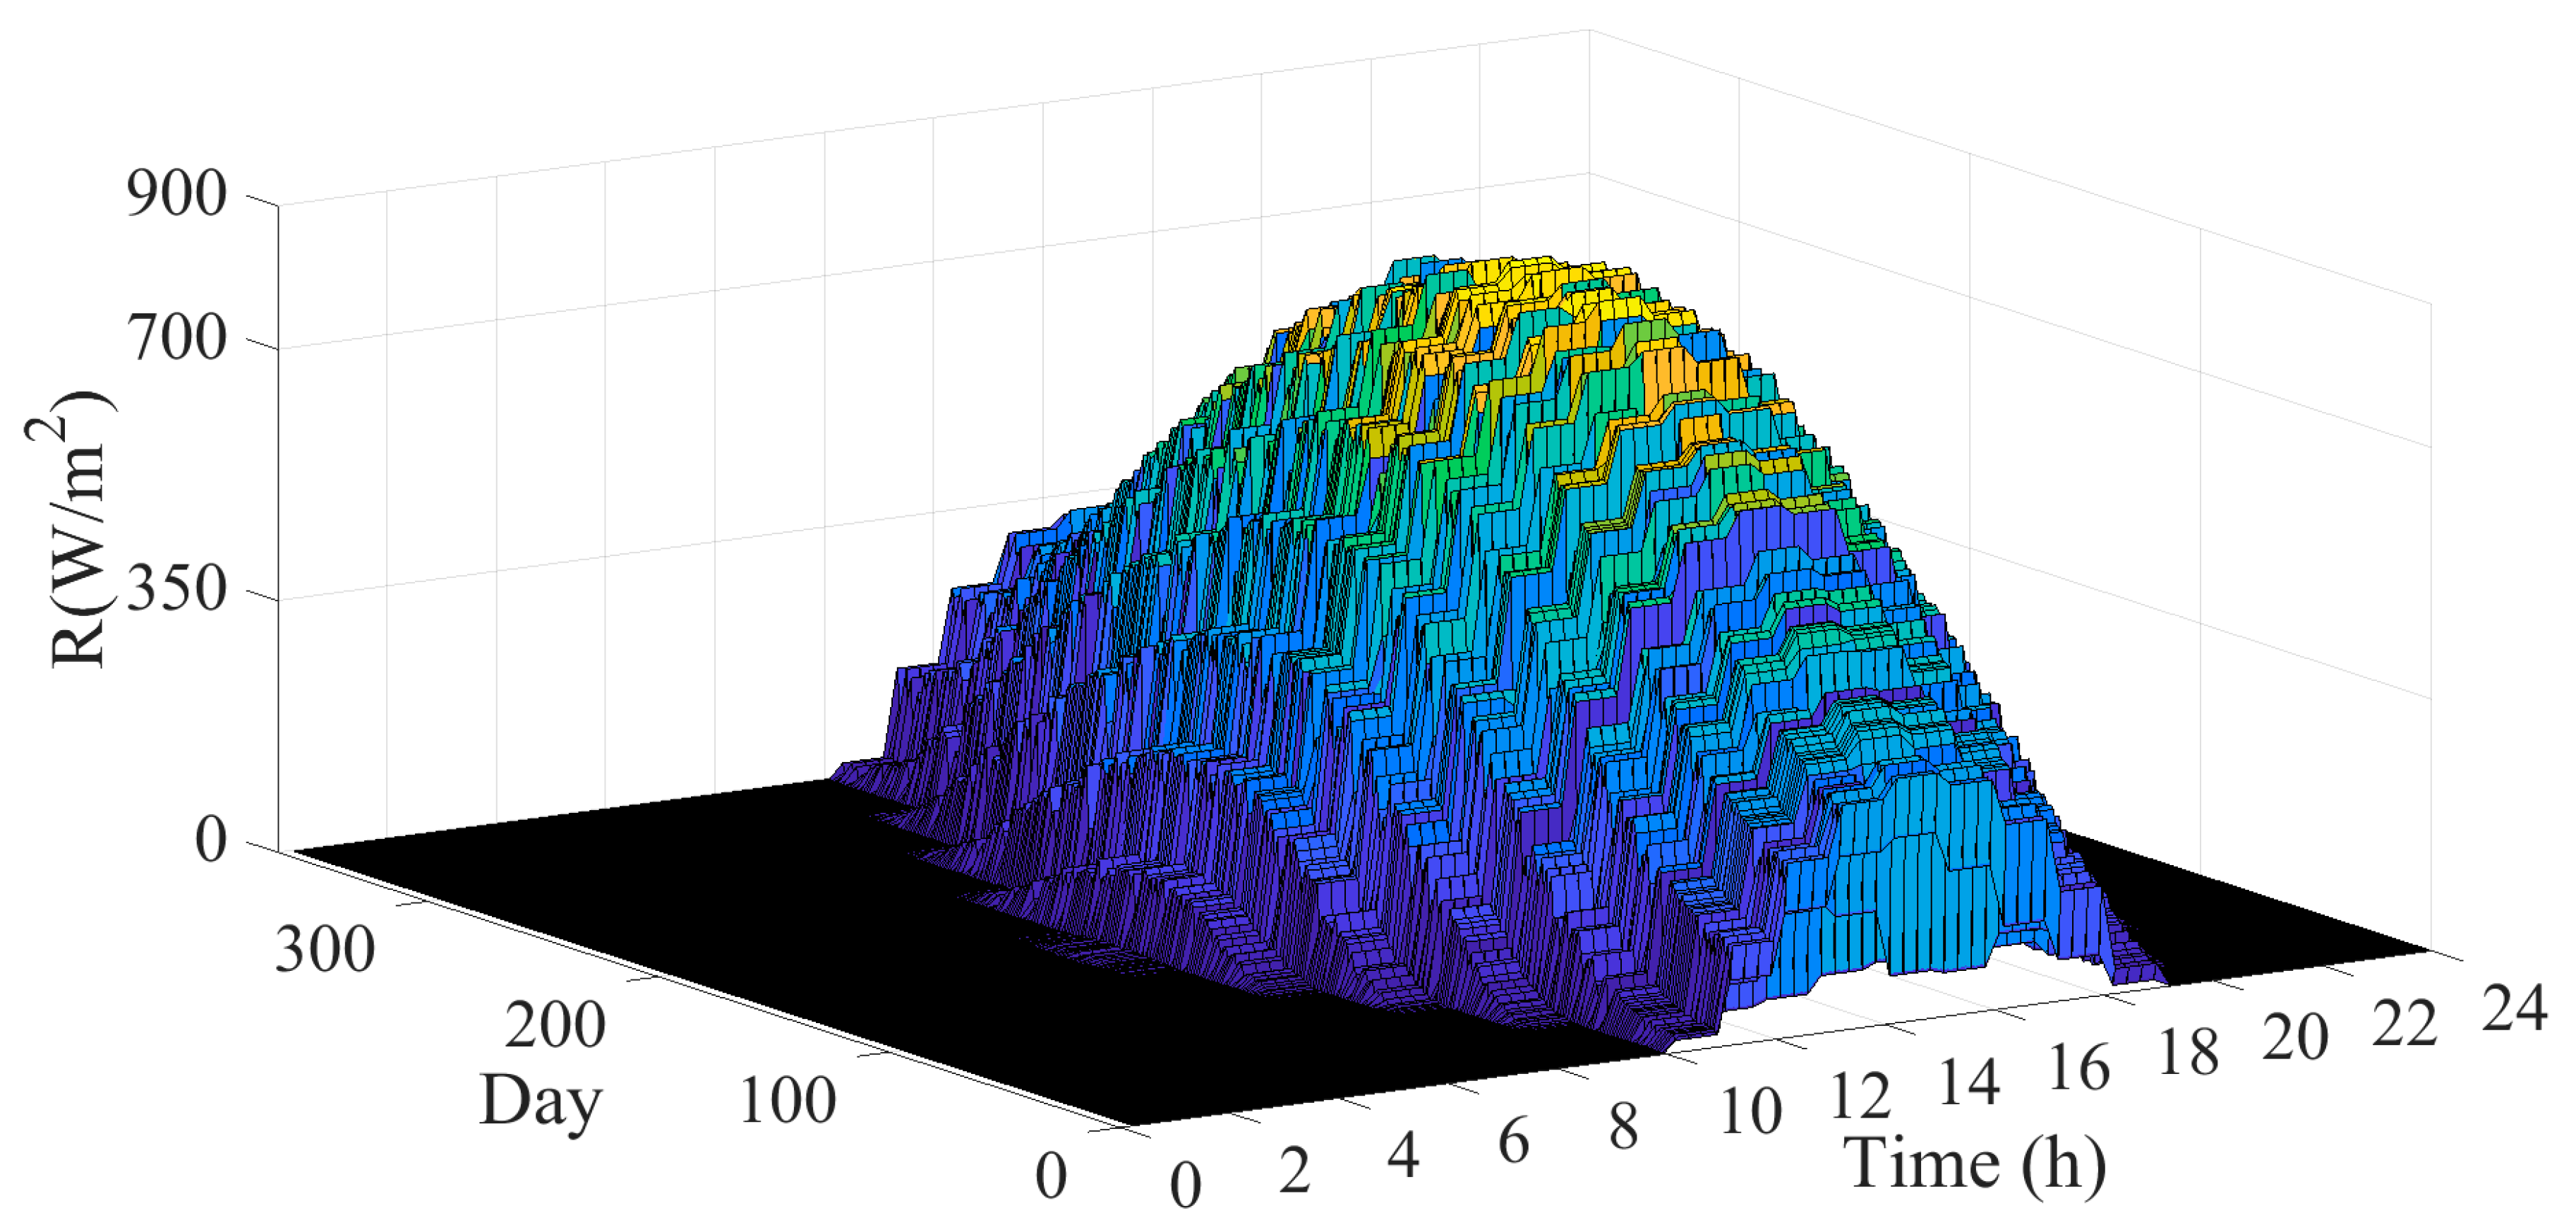
3.1. Time Sequence Characteristic of Load and DG
3.2. TCO Minimization
3.3. VD Minimization
3.4. Constraints
3.5. Overview of Optimal Sizing Problem Formulation
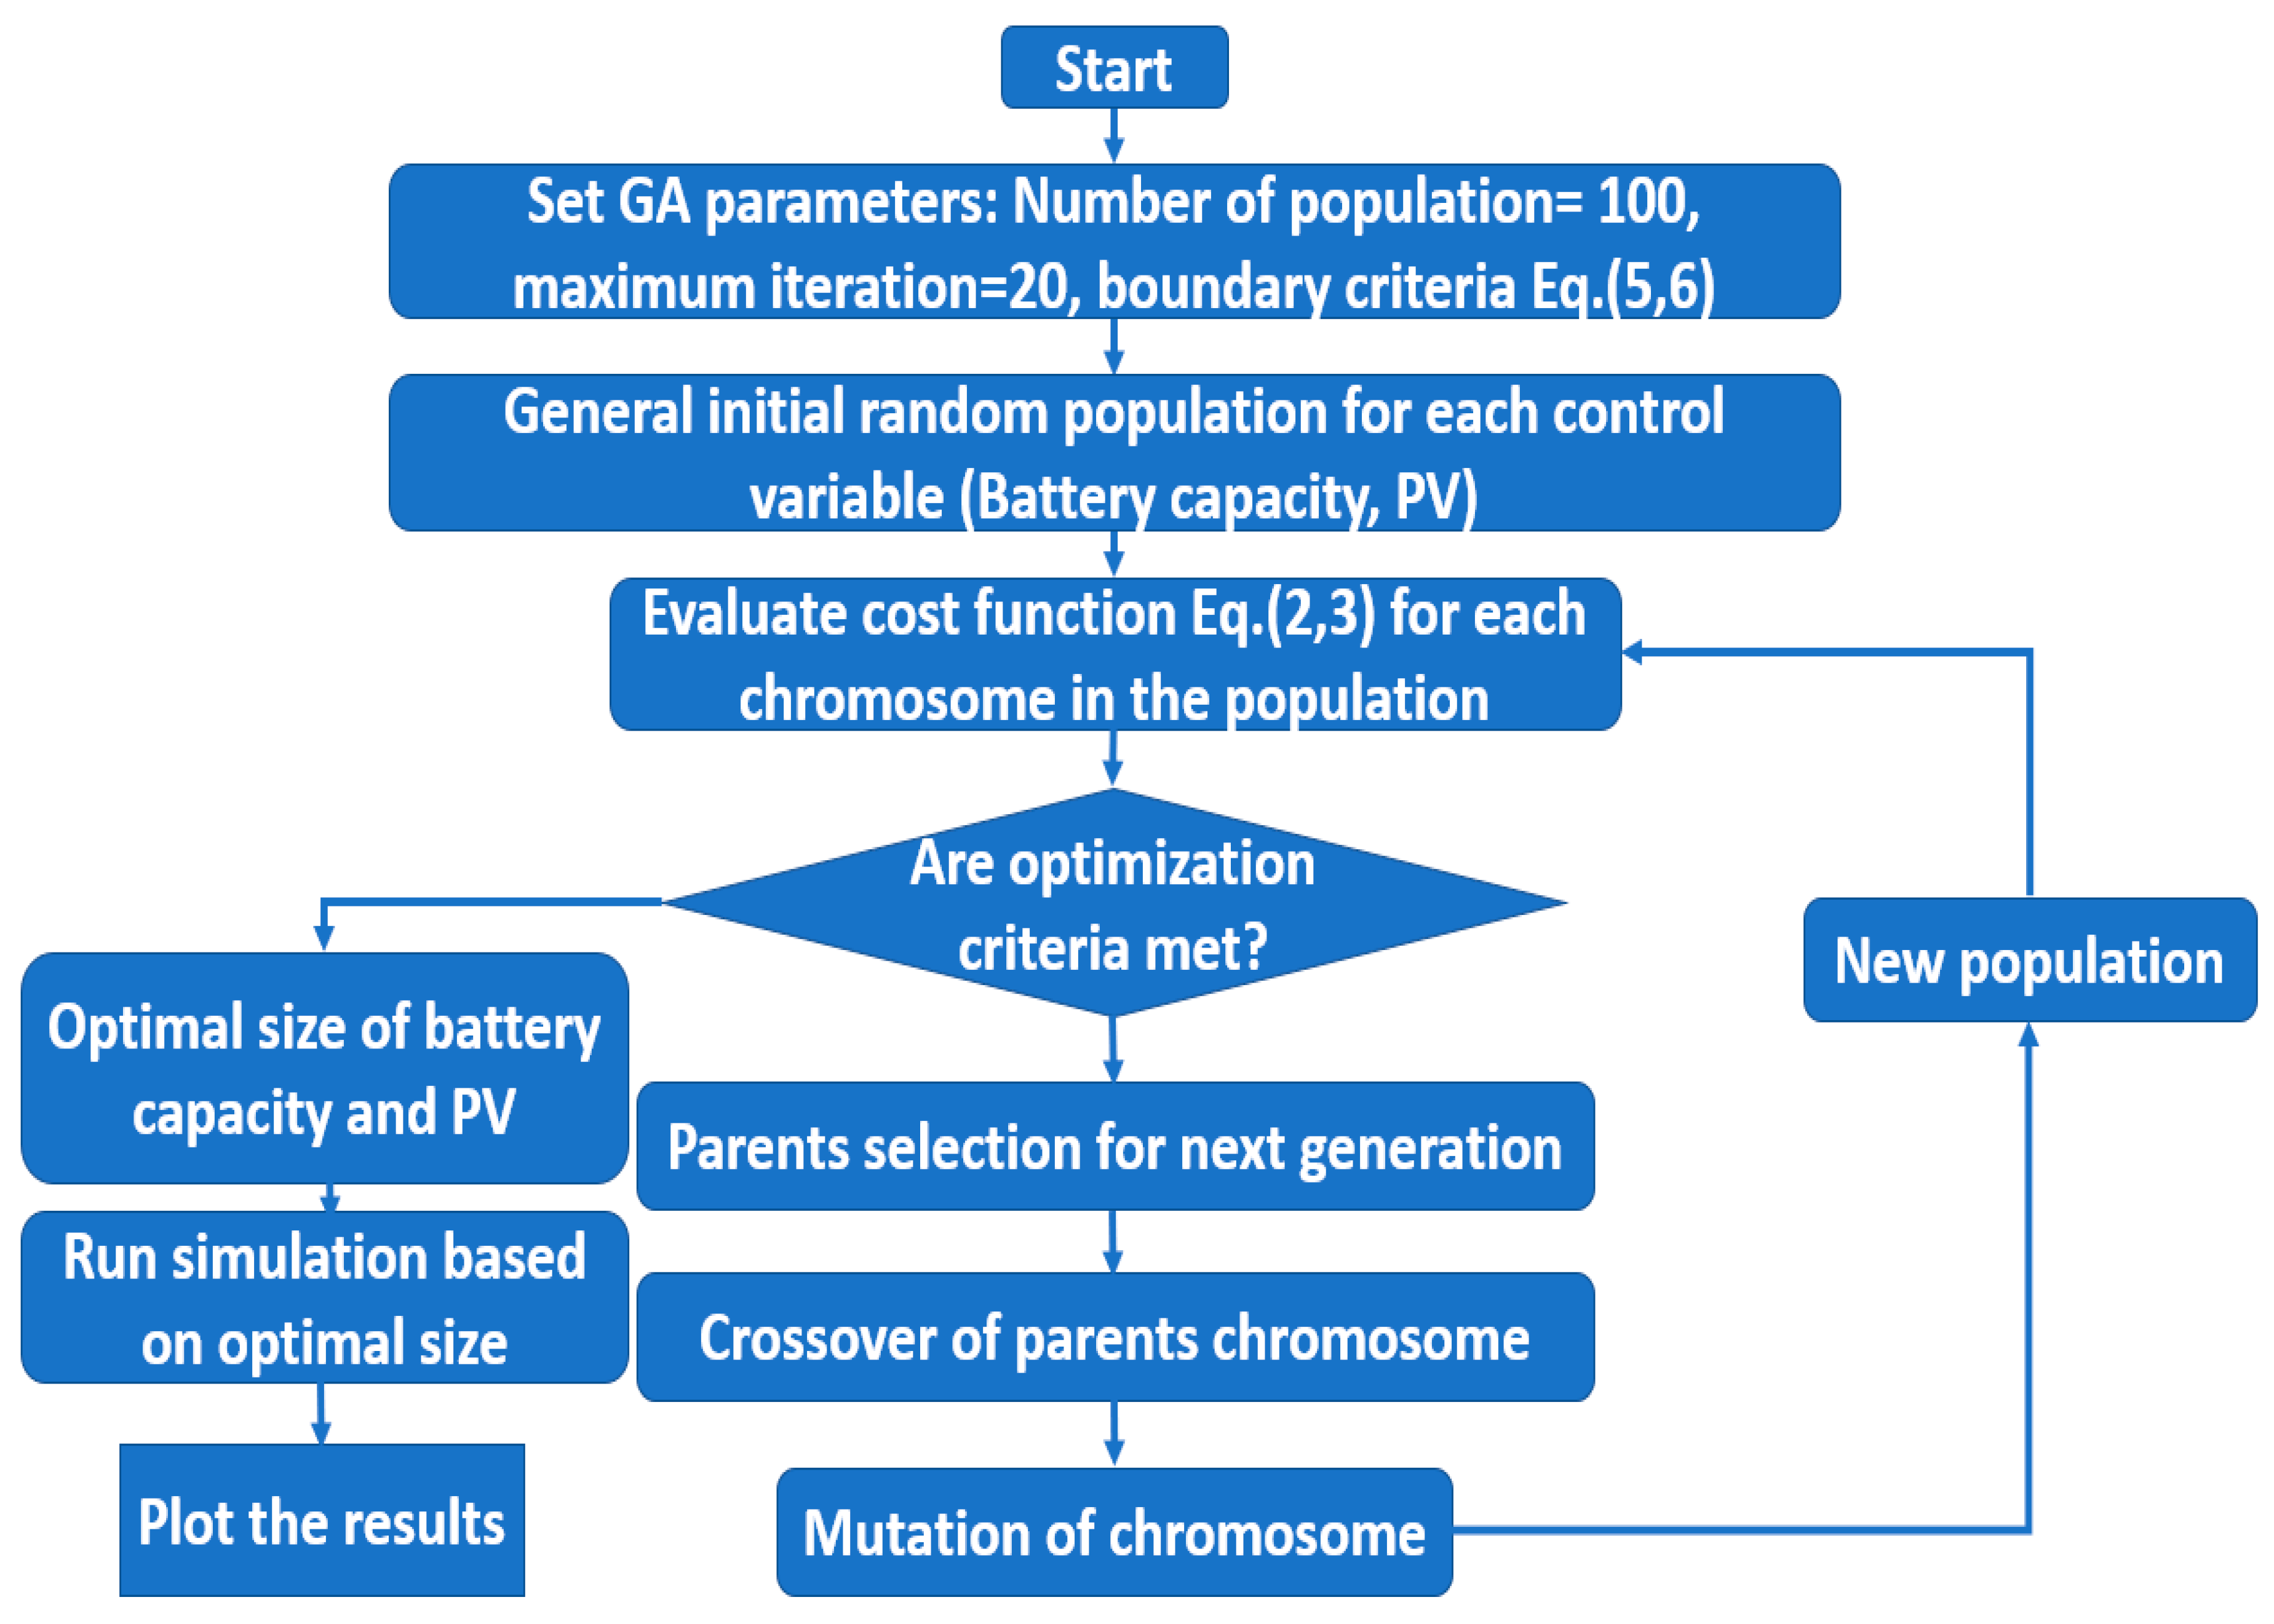
3.6. Genetic Algorithm
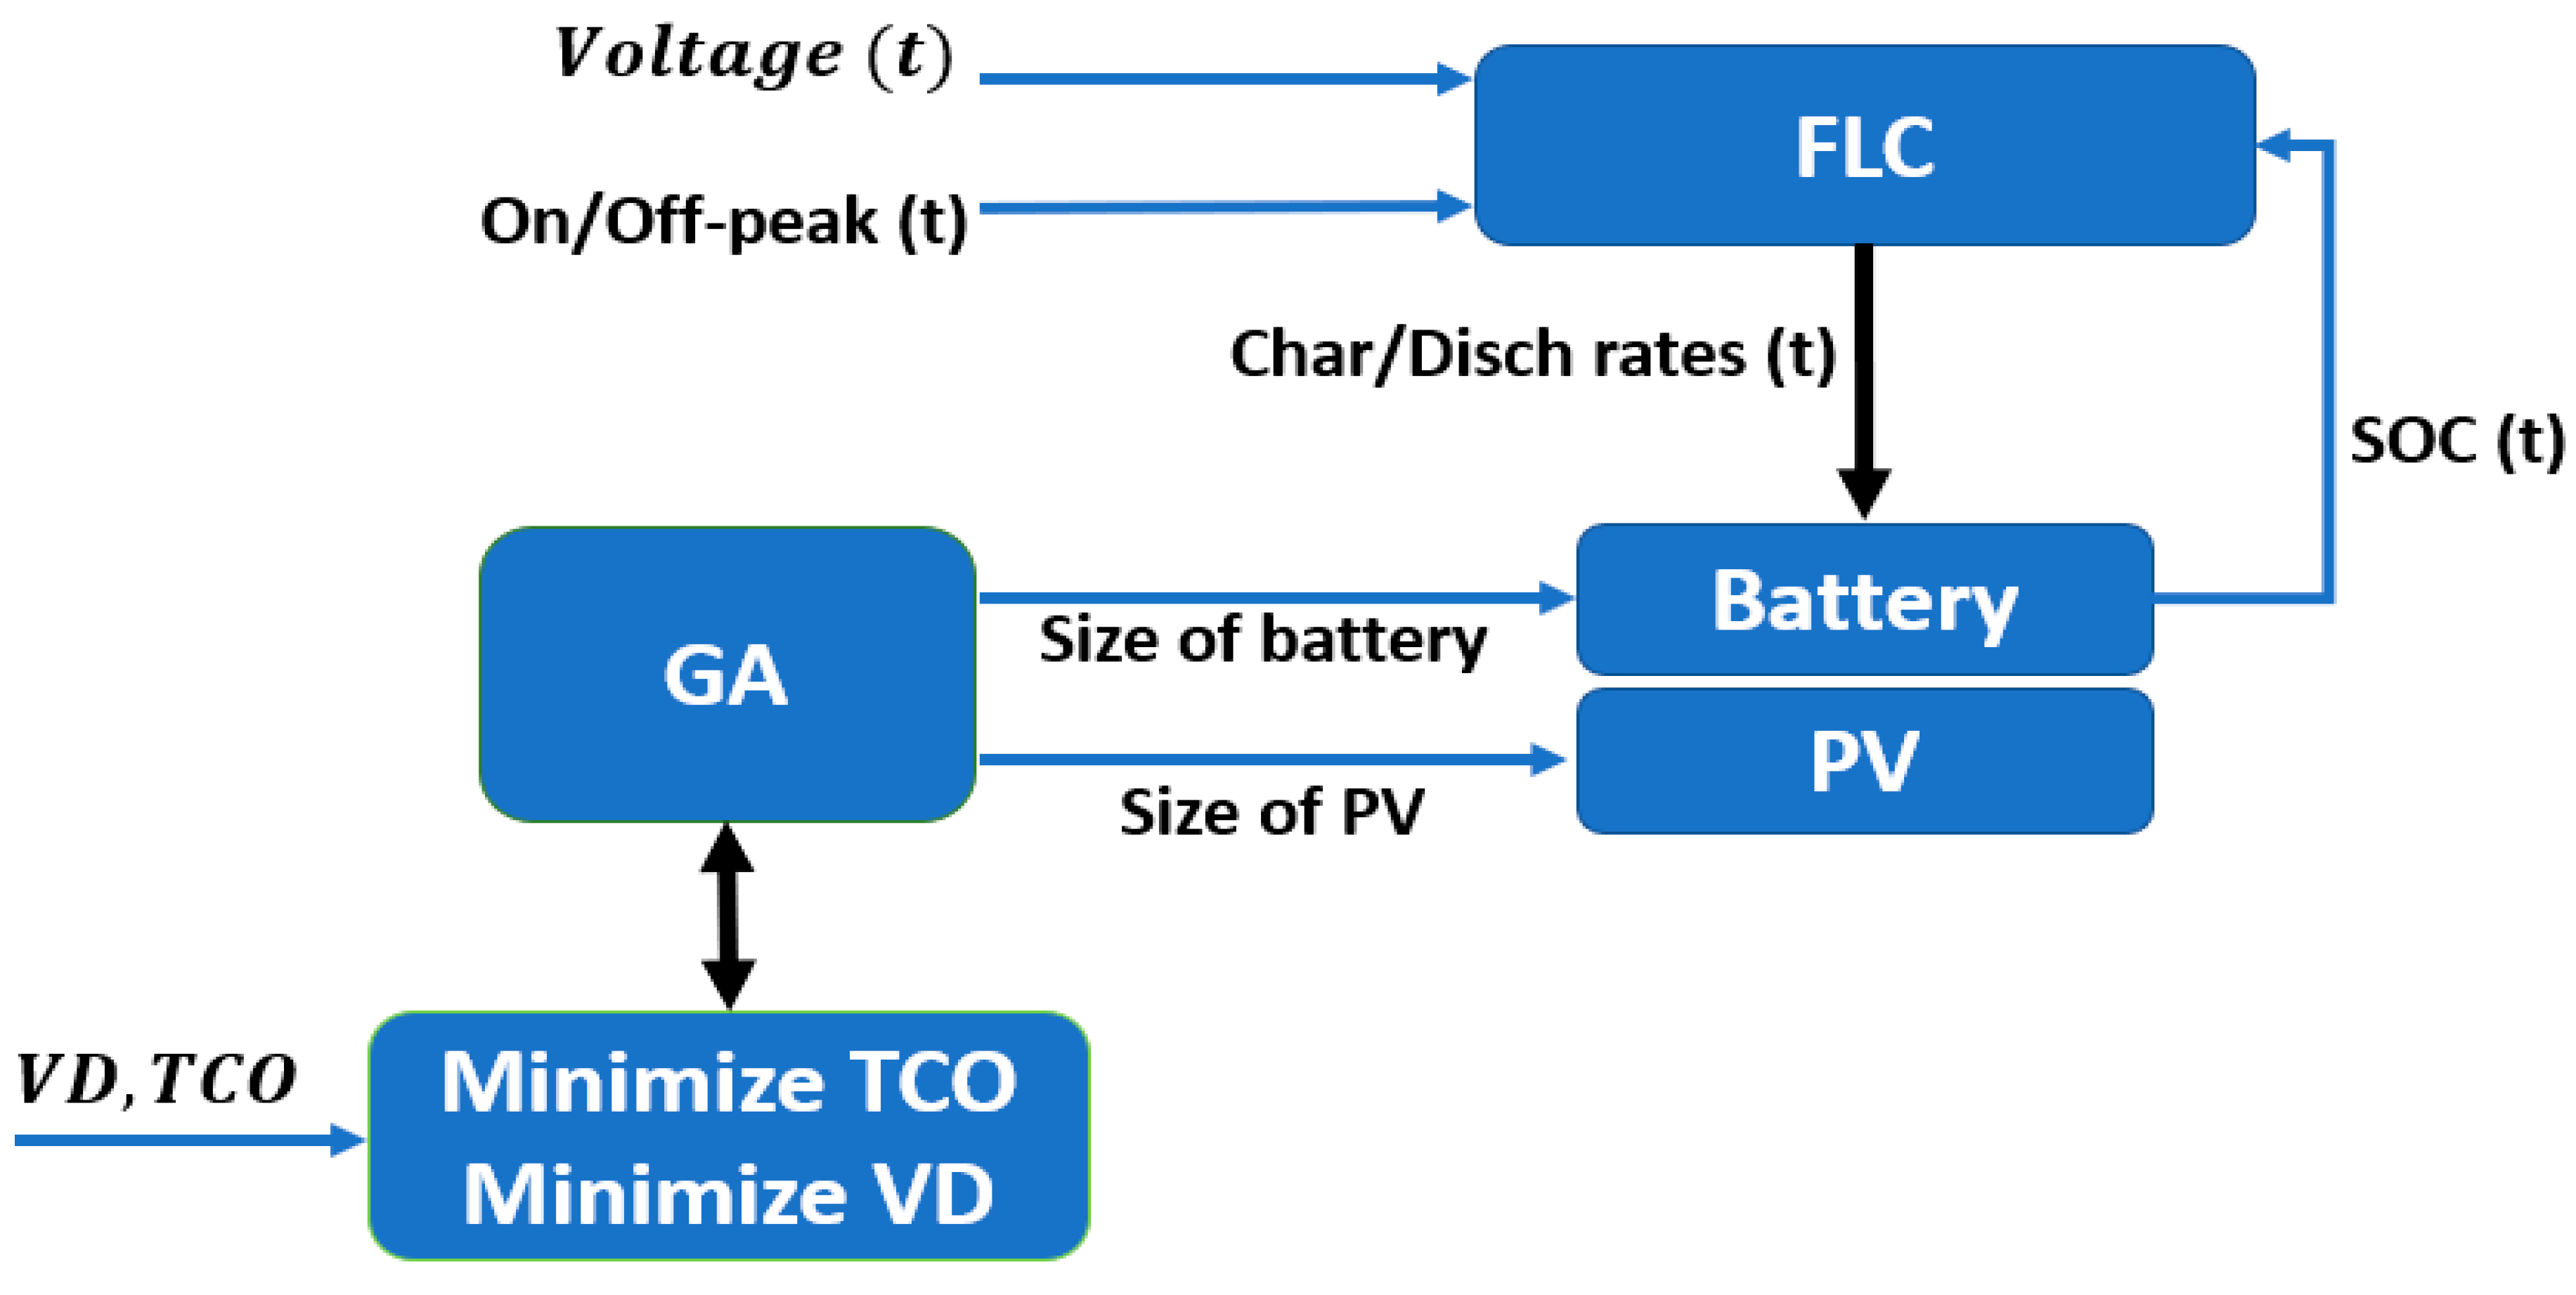
4. FL-Based Controller: Formulation, Constraints and Algorithm
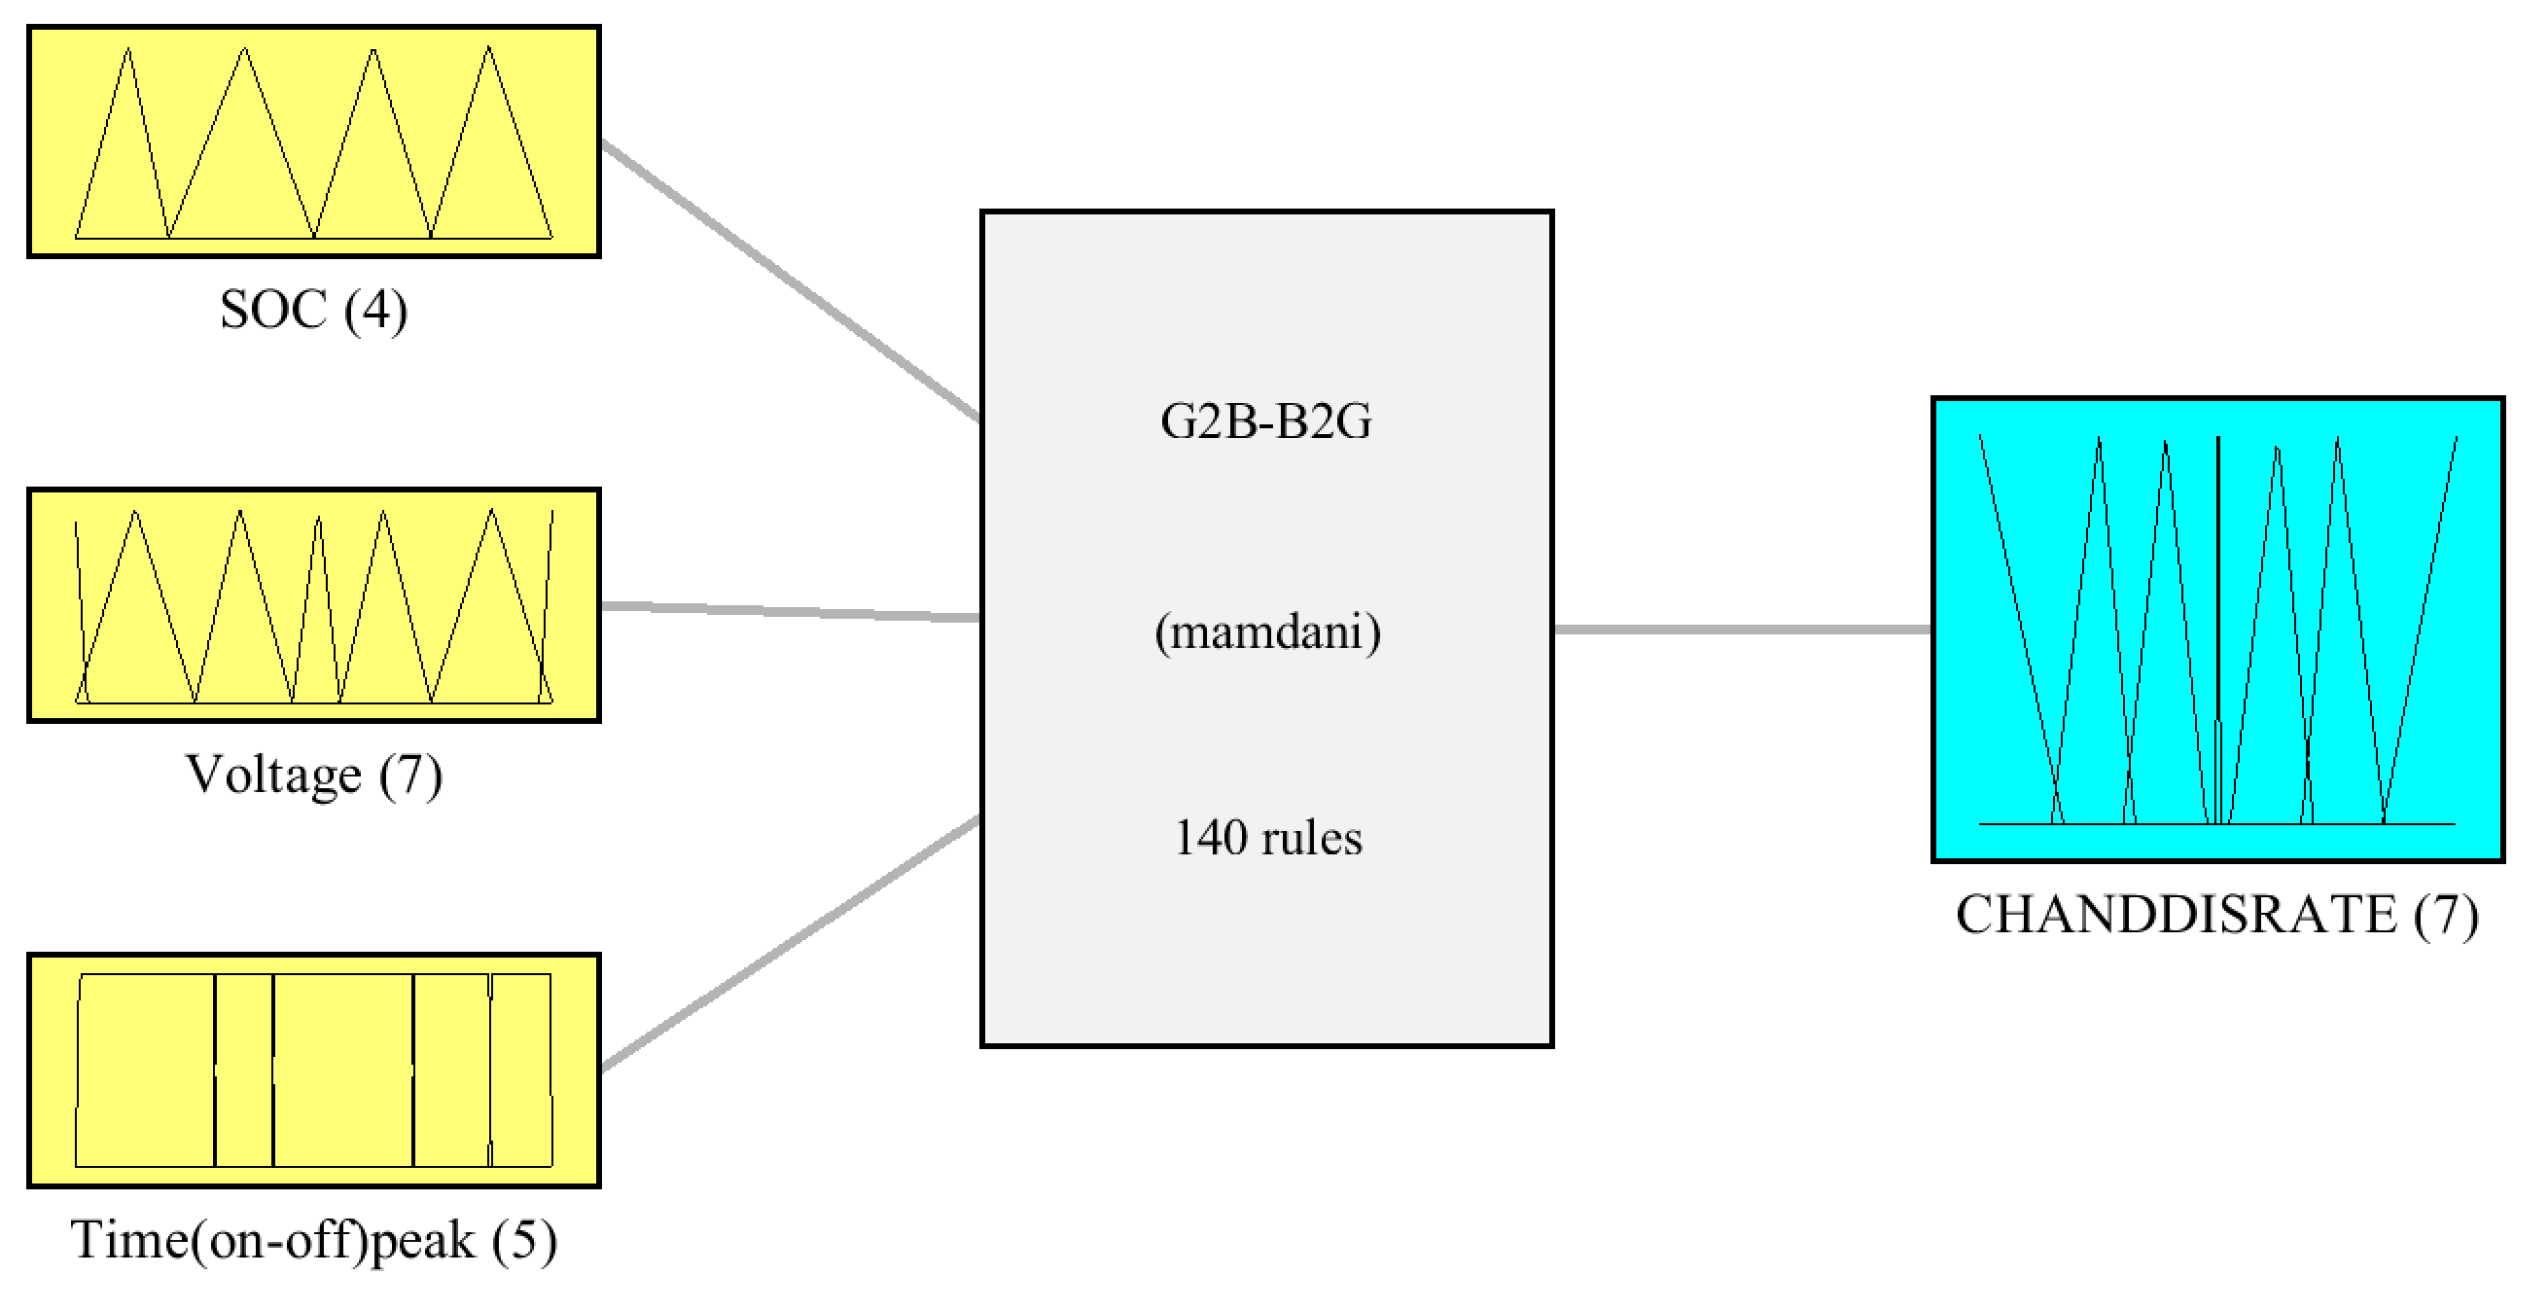
4.1. Fuzzy Logical Controller
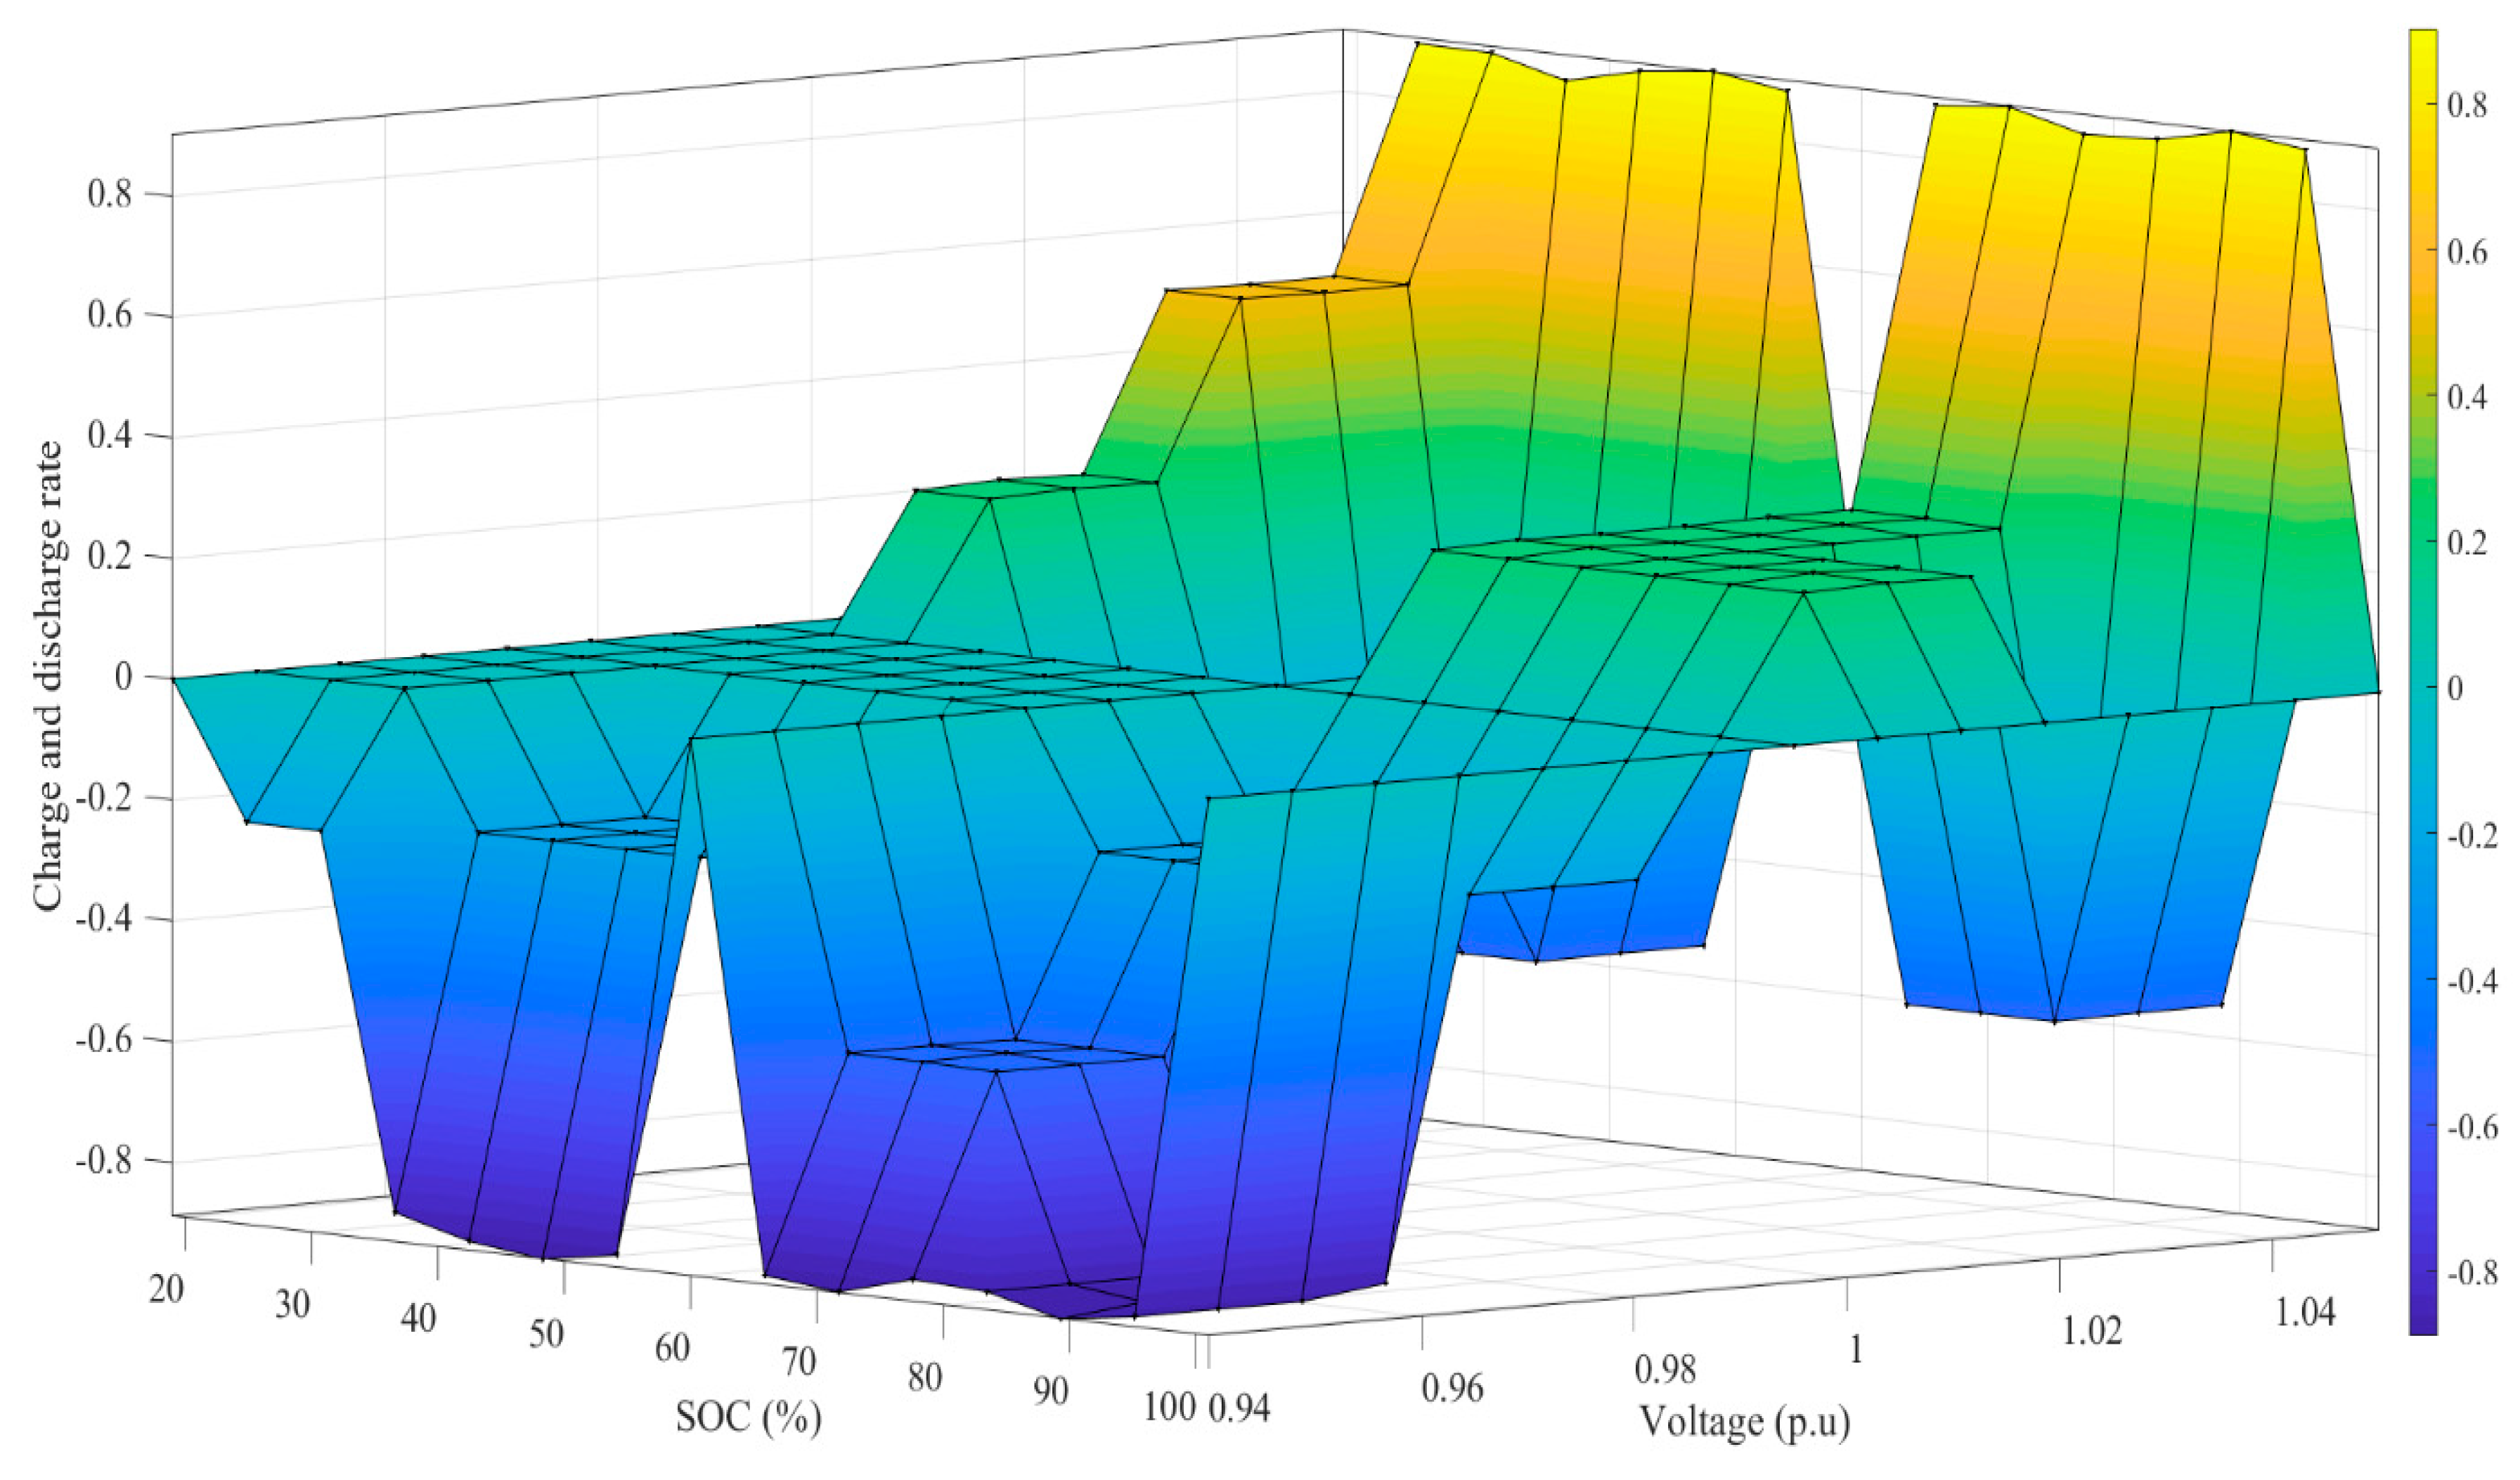
4.2. Constraints and Formulation of Charging and Discharging Control
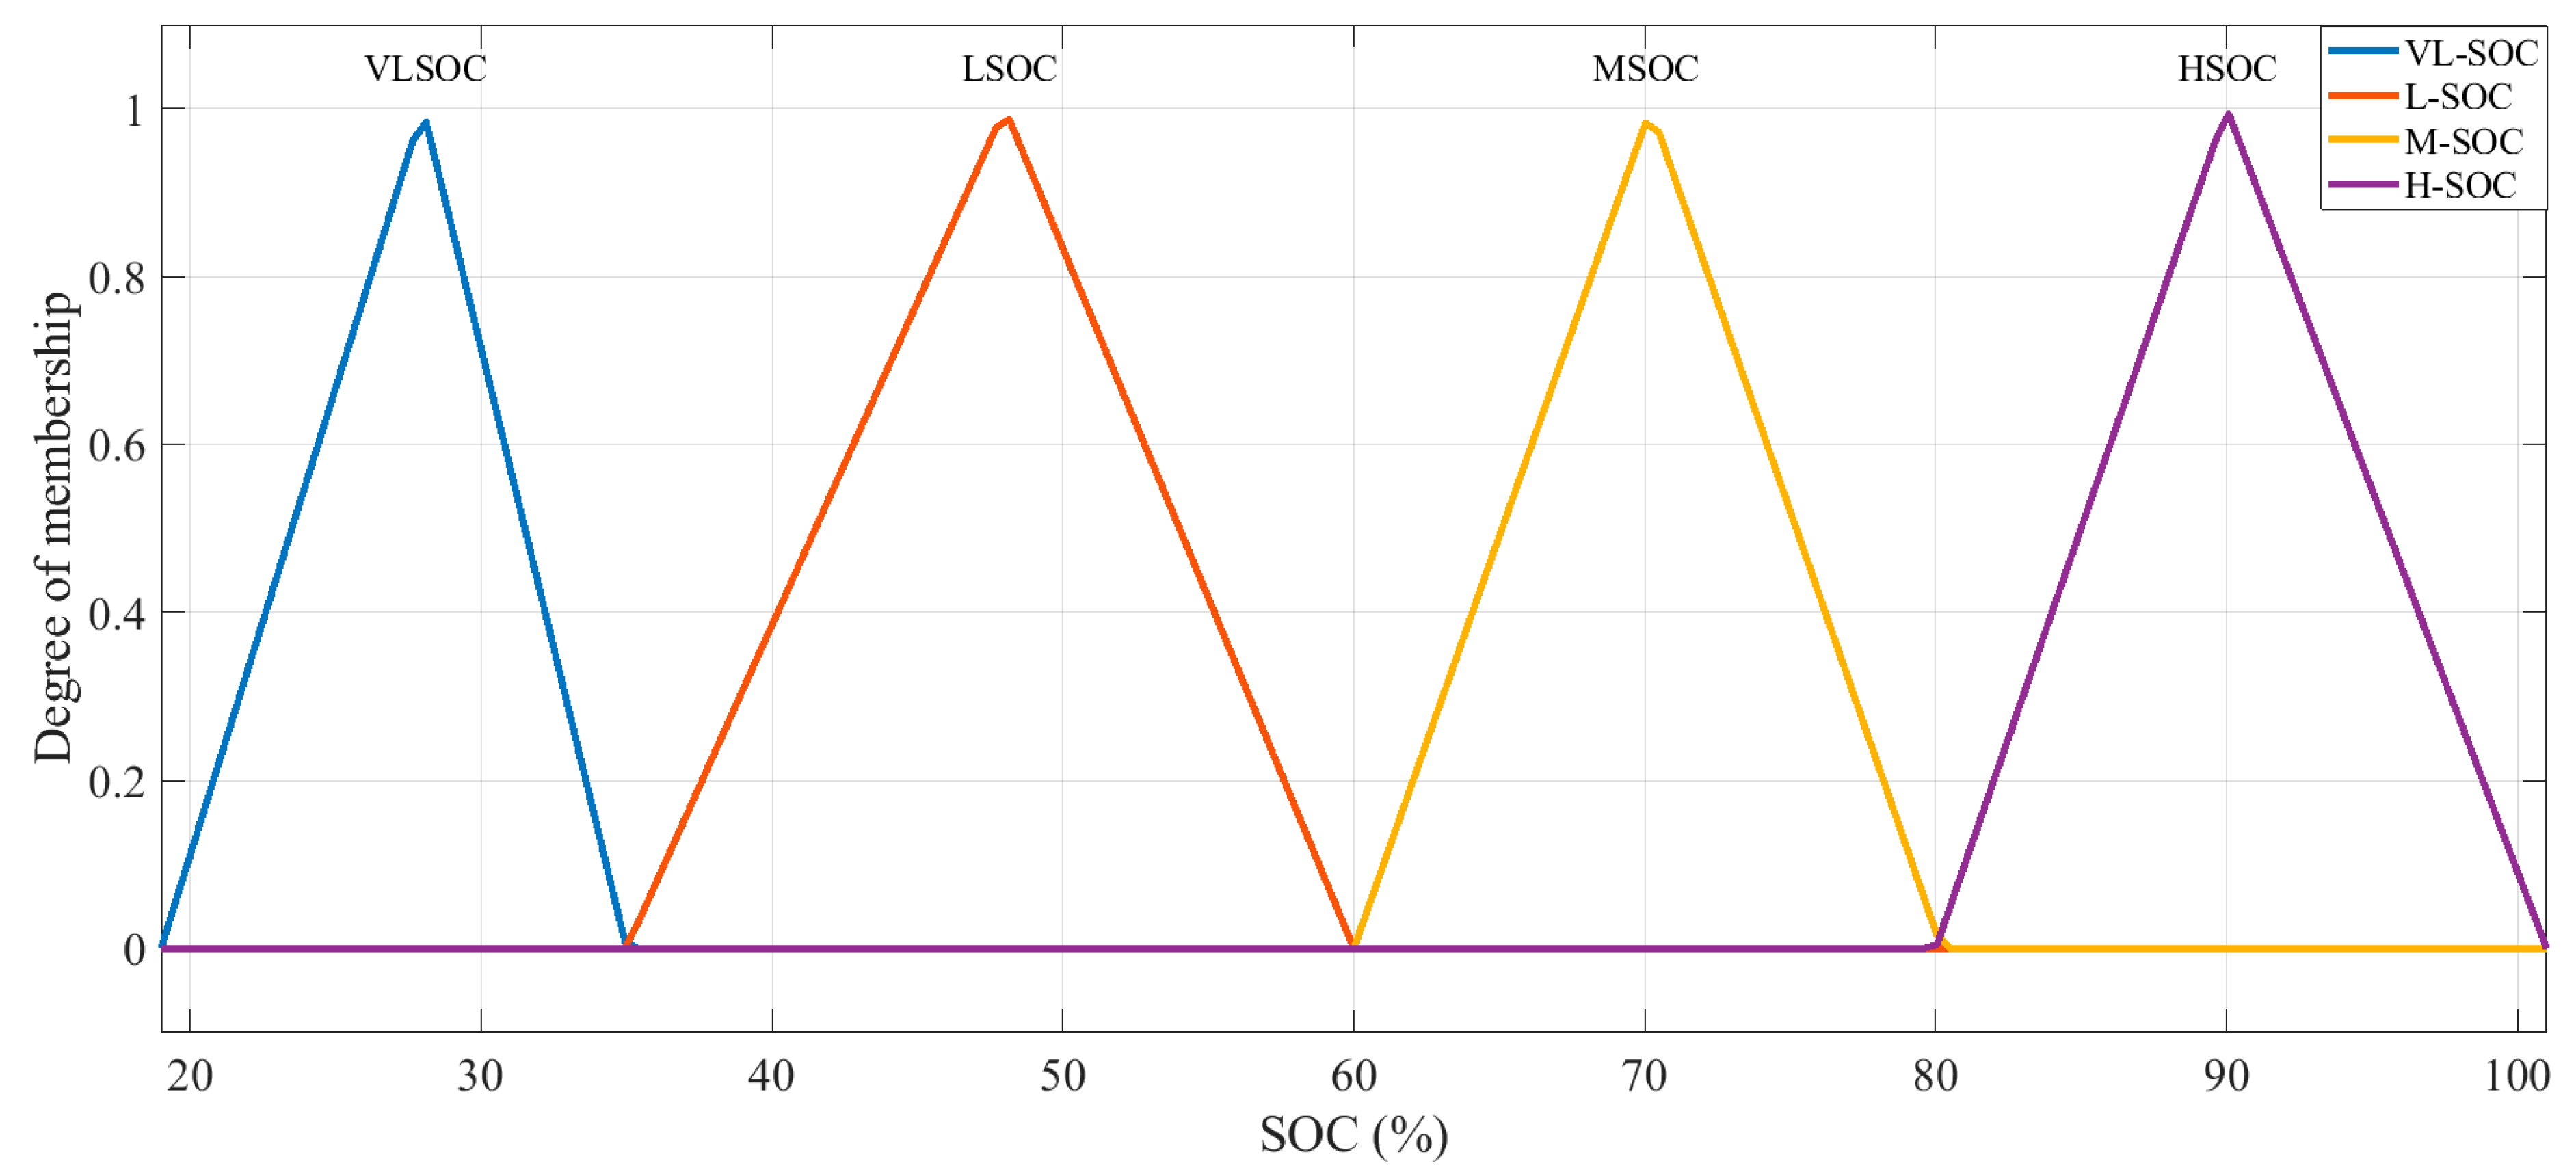
4.2.1. SoC Membership Function
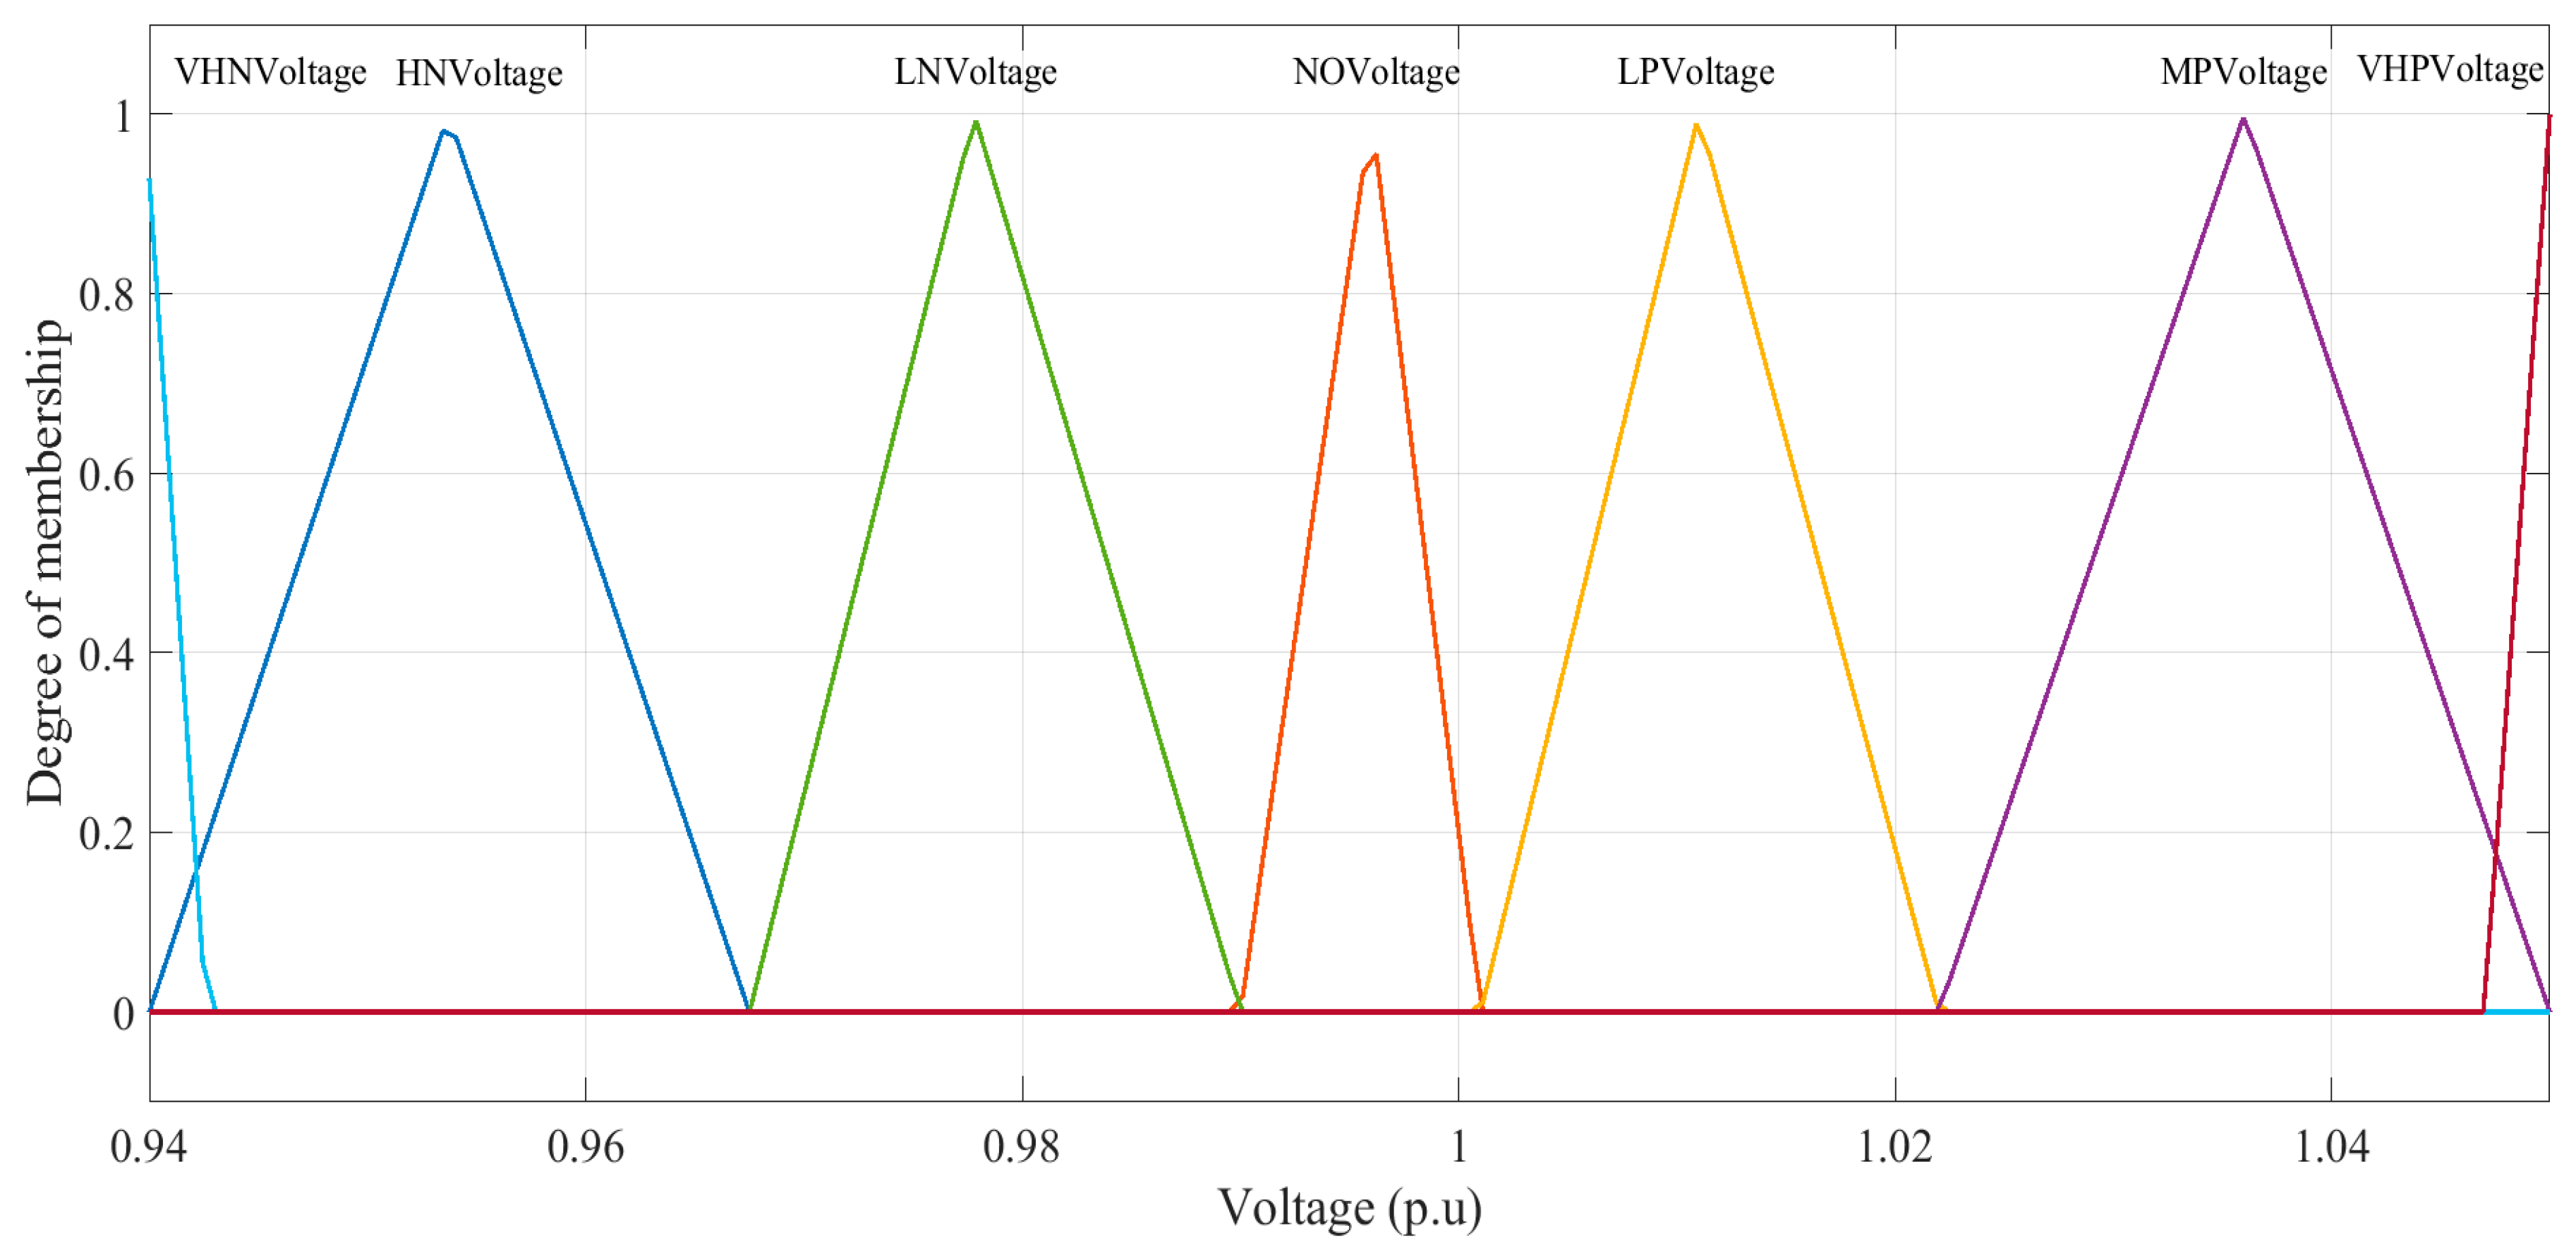
4.2.2. Voltage Membership Function
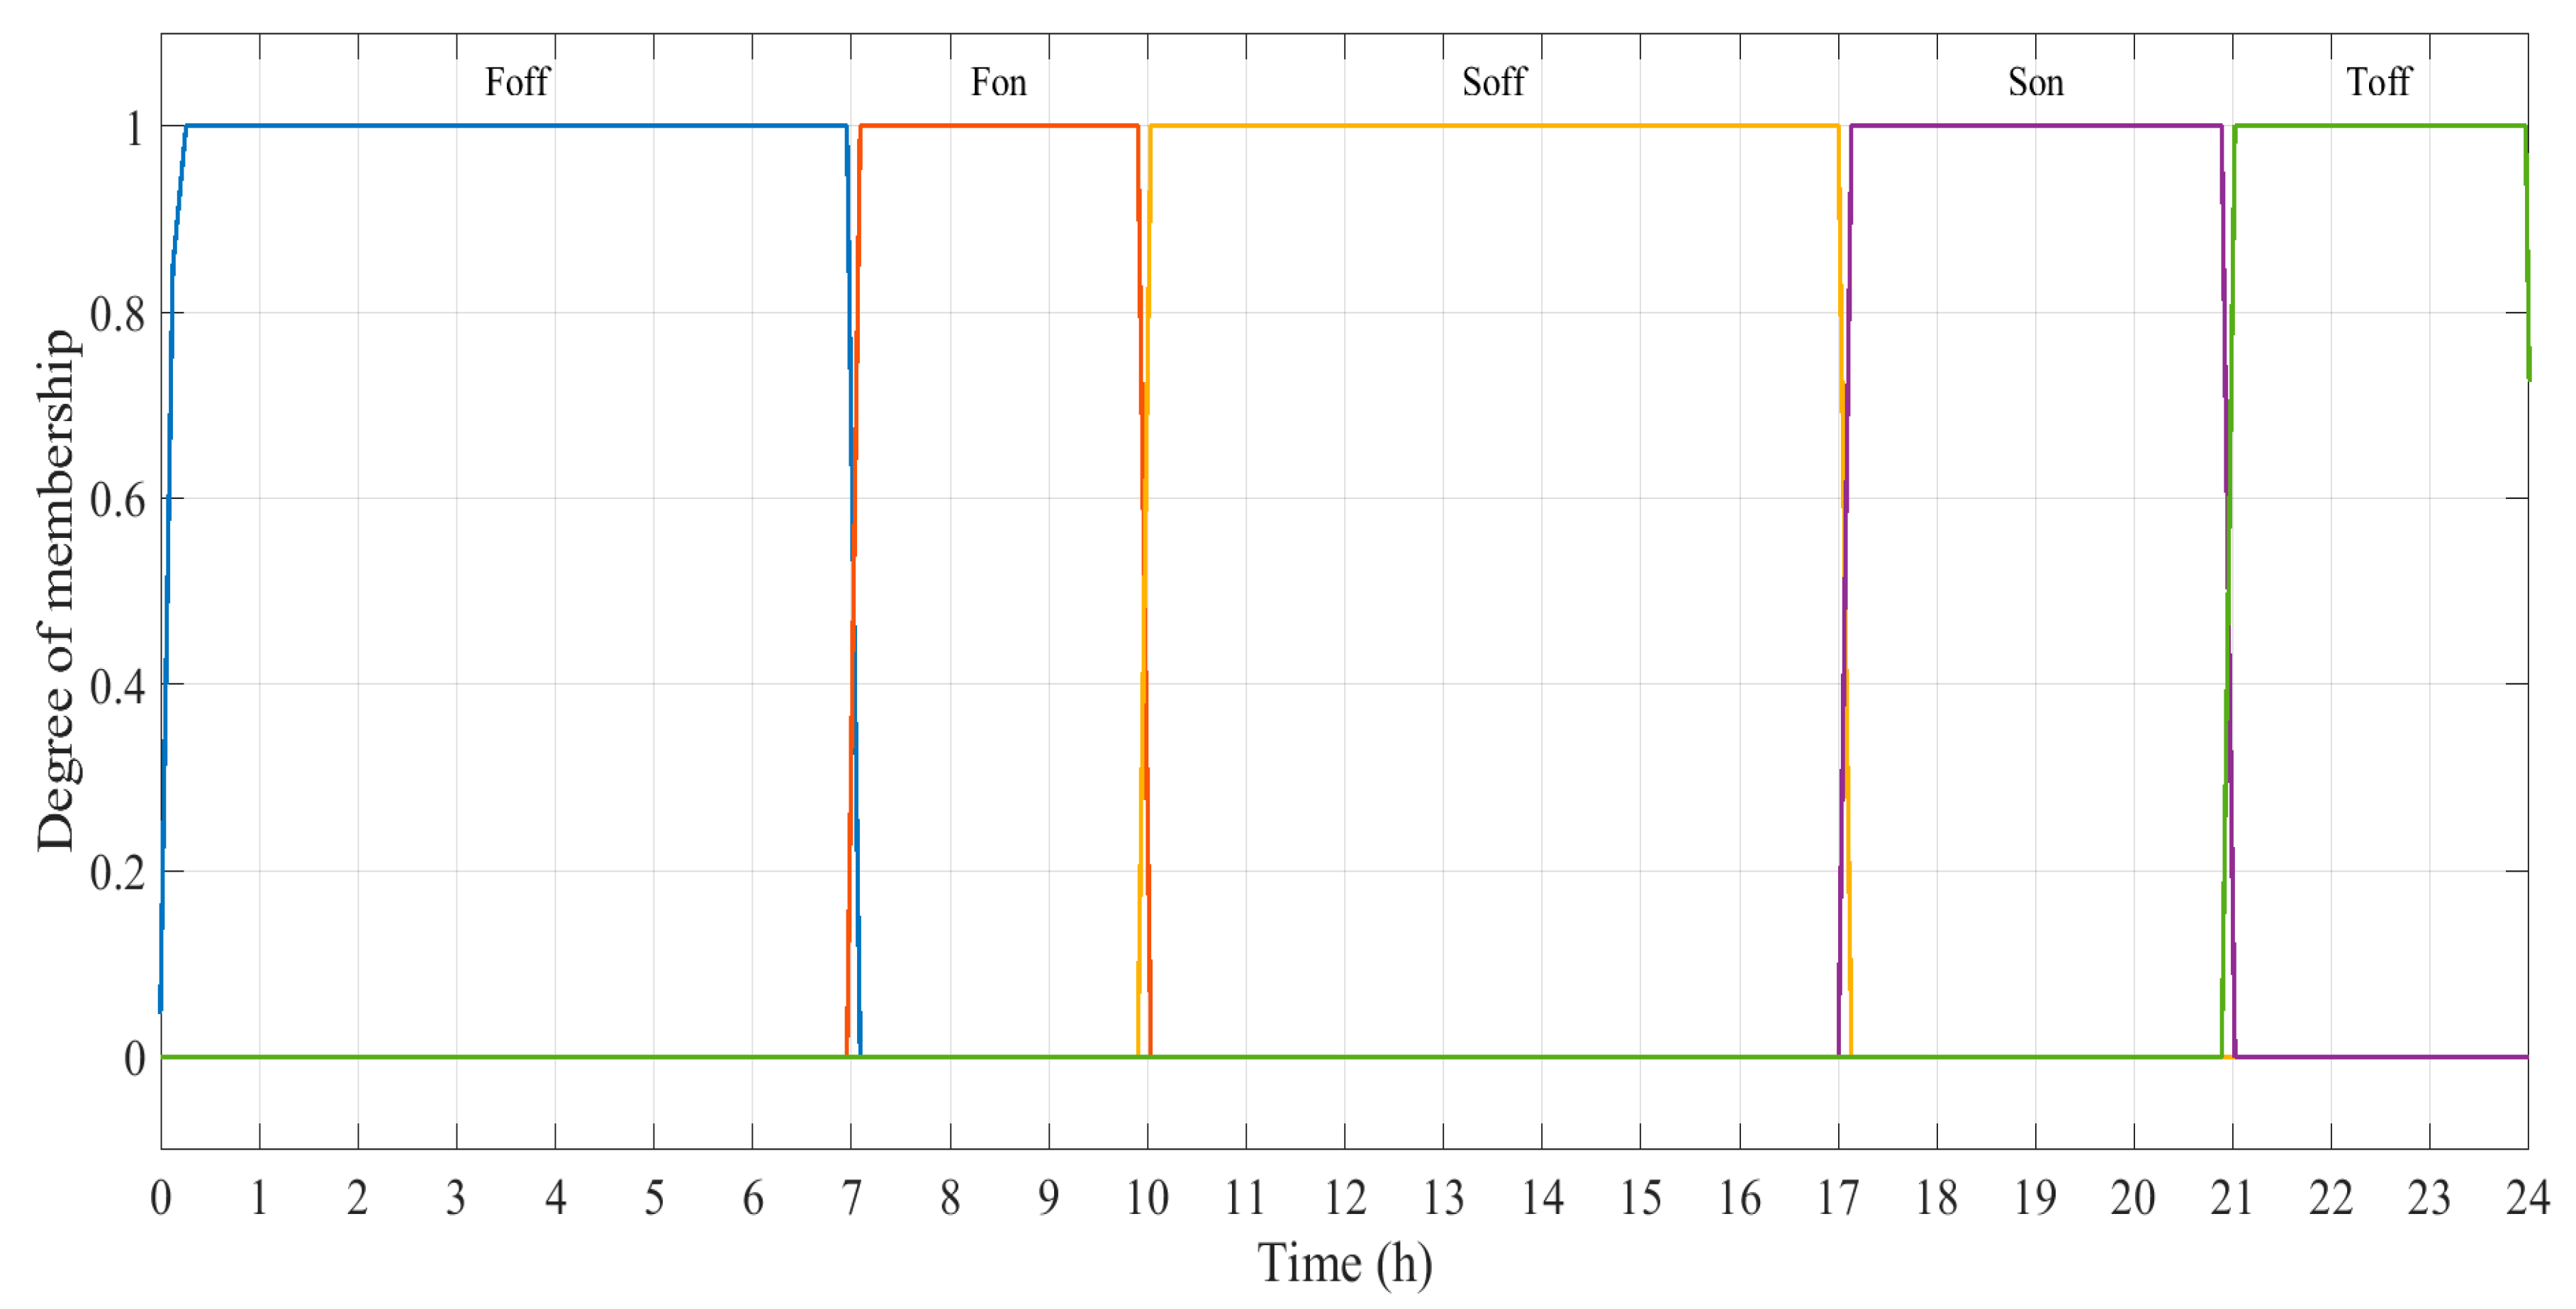
4.2.3. On/Off Peak Hours Membership Function
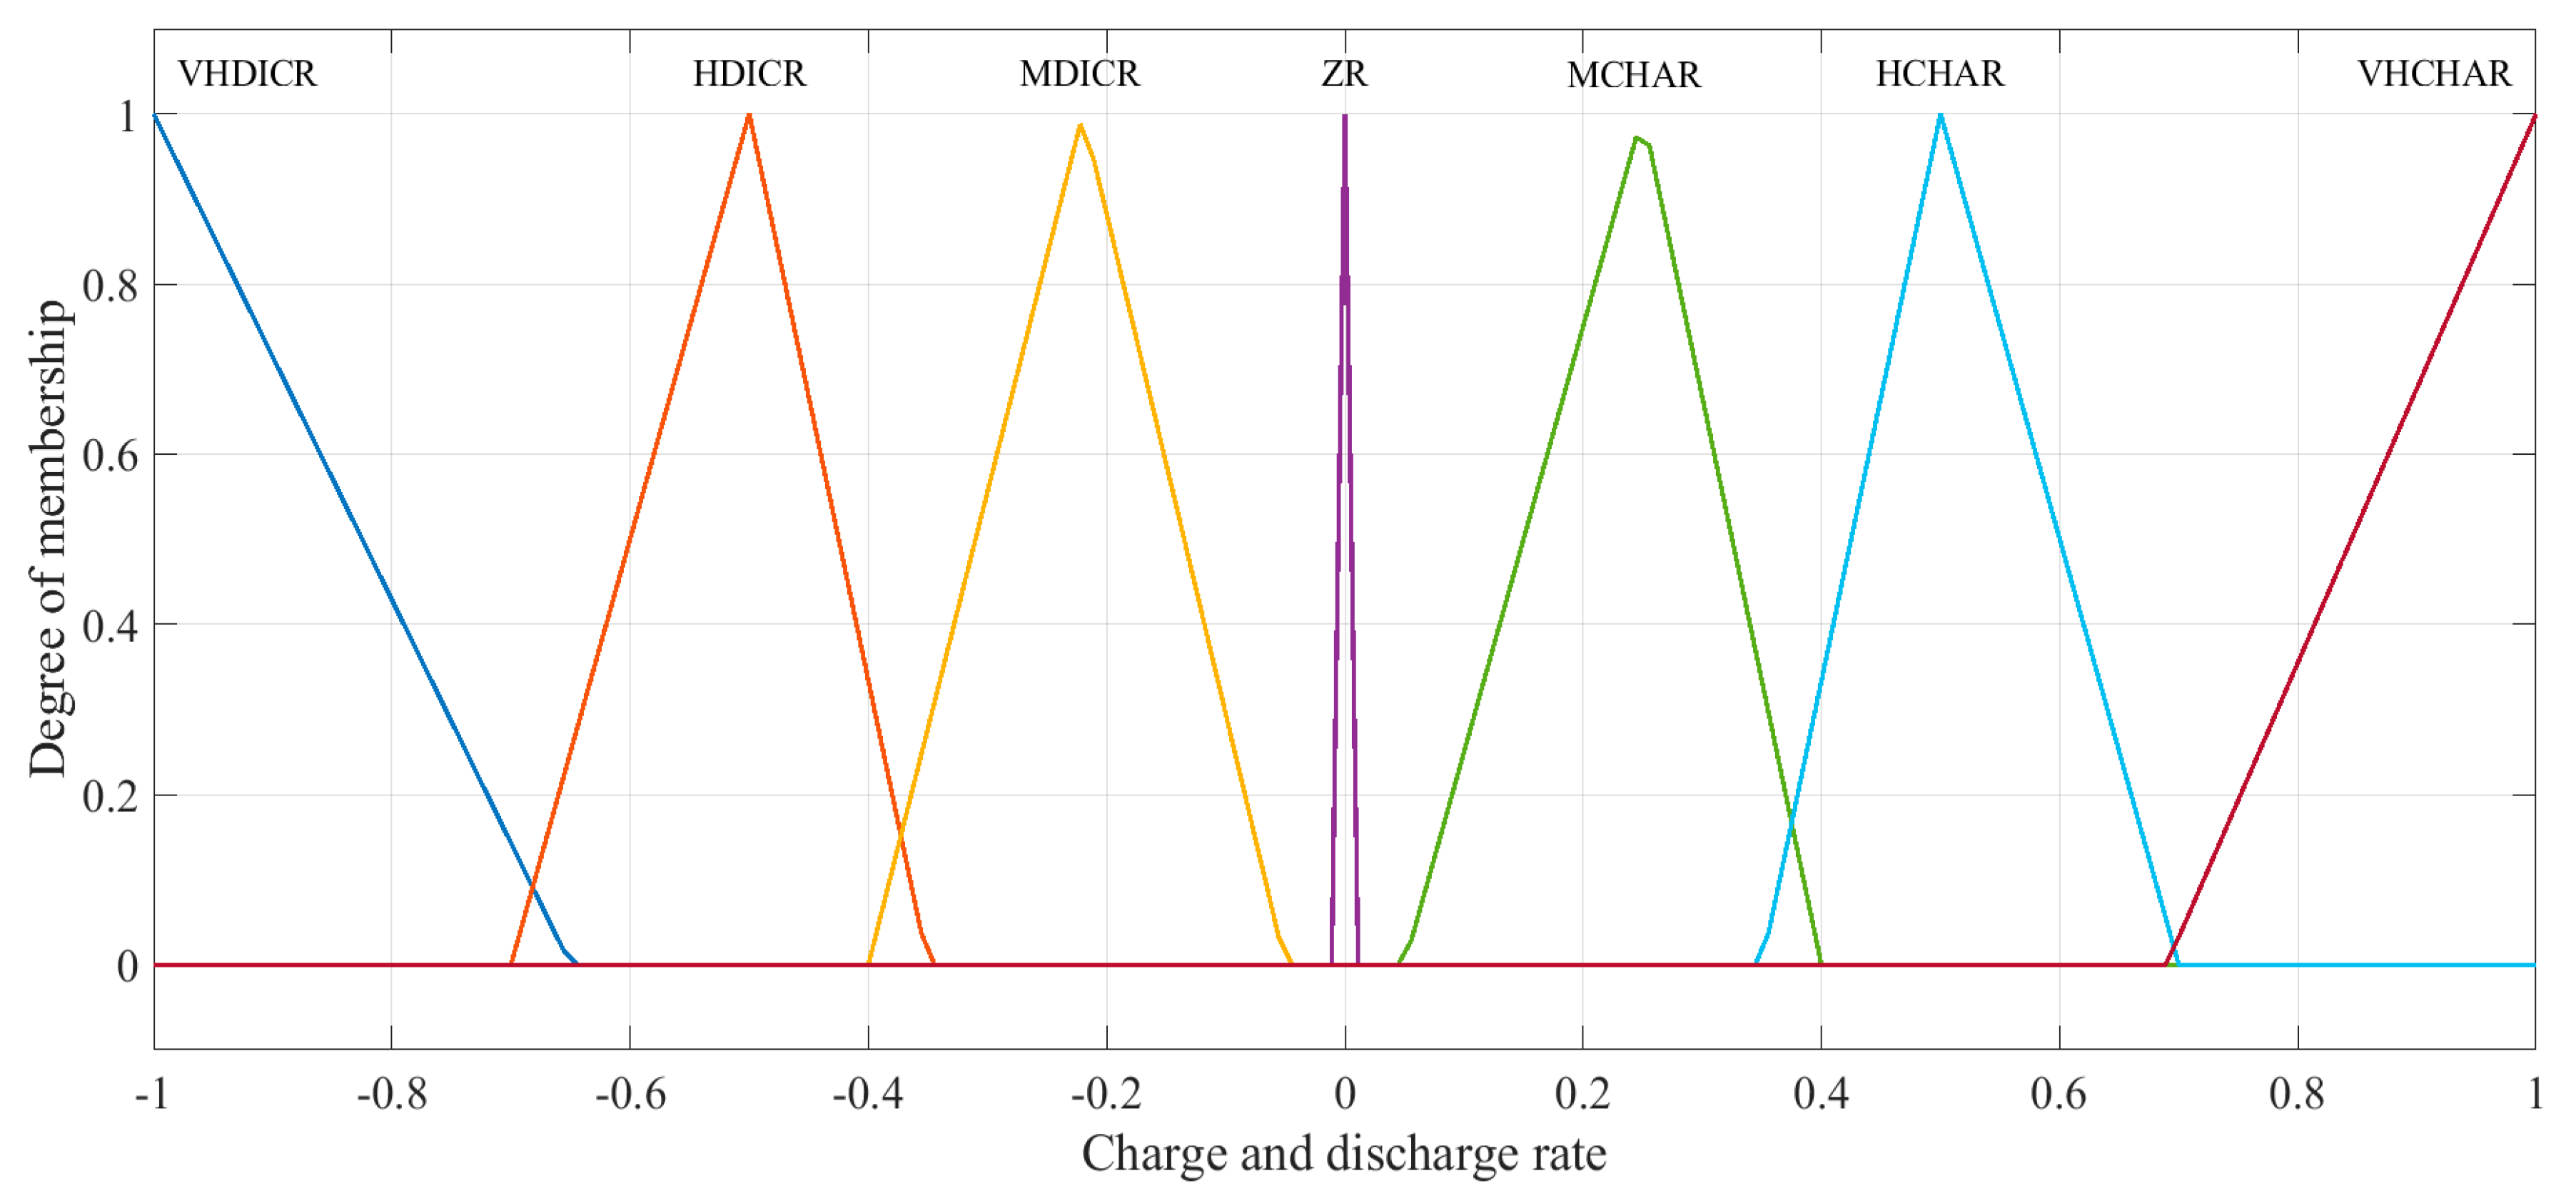
4.2.4. Char/Dischar Rate Membership Function
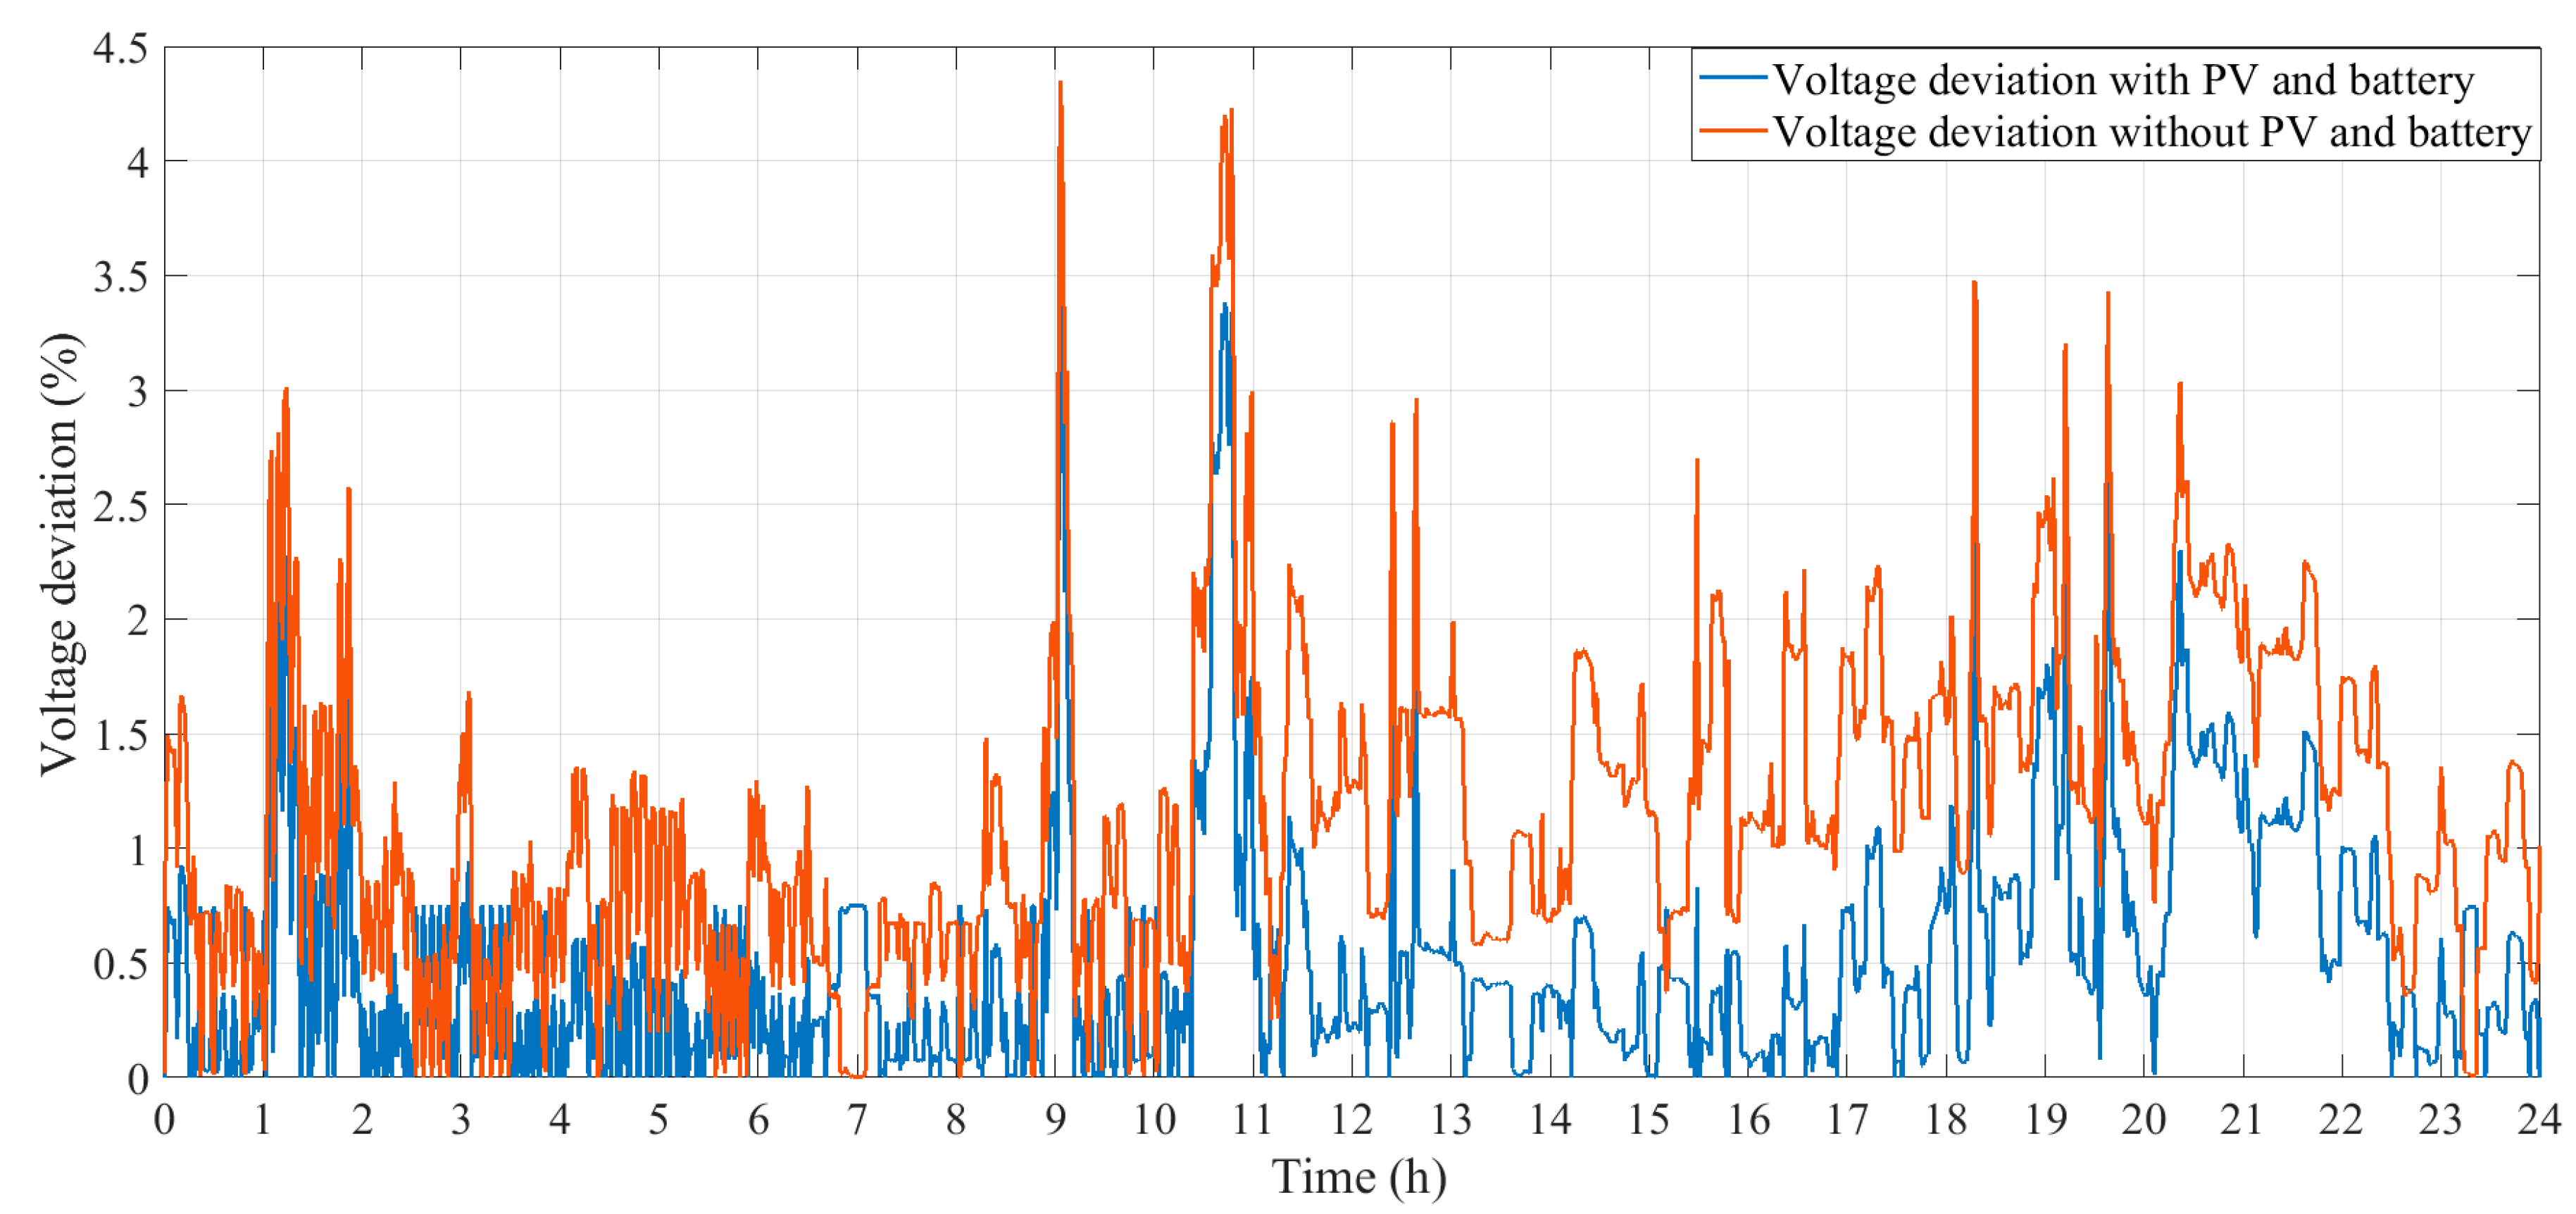
5. Results and Discussion
6. Conclusions
Author Contributions
Acknowledgments
Conflicts of Interest
Appendix A

| Input Membership Function SoC | Input Membership Function Voltage | Input Membership Function On/Off-Peak Hour | Output Charge/Discharge Rate |
|---|---|---|---|
| VLSOC | HNVoltage | Foff | ZR |
| VLSOC | HNVoltage | Fon | ZR |
| VLSOC | HNVoltage | Soff | ZR |
| VLSOC | HNVoltage | Son | ZR |
| VLSOC | HNVoltage | Toff | ZR |
| VLSOC | NOVoltage | Foff | ZR |
| VLSOC | NOVoltage | Fon | ZR |
| VLSOC | NOVoltage | Soff | ZR |
| VLSOC | NOVoltage | Son | ZR |
| VLSOC | NOVoltage | Toff | ZR |
| VLSOC | LPVoltage | Foff | MCHAR |
| VLSOC | LPVoltage | Soff | MCHAR |
| VLSOC | LPVoltage | Toff | MCHAR |
| VLSOC | LPVoltage | Fon | ZR |
| VLSOC | LPVoltage | Son | ZR |
| VLSOC | MPVoltage | Foff | HCHAR |
| VLSOC | MPVoltage | Soff | HCHAR |
| VLSOC | MPVoltage | Toff | HCHAR |
| VLSOC | MPVoltage | Fon | MCHAR |
| VLSOC | MPVoltage | Son | MCHAR |
| VLSOC | LNVoltage | Foff | ZR |
| VLSOC | LNVoltage | Fon | ZR |
| VLSOC | LNVoltage | Soff | ZR |
| VLSOC | LNVoltage | Son | ZR |
| VLSOC | LNVoltage | Toff | ZR |
| VLSOC | VHNVoltage | Foff | MDISC |
| VLSOC | VHNVoltage | Fon | MDISC |
| VLSOC | VHNVoltage | Soff | MDISC |
| VLSOC | VHNVoltage | Son | MDISC |
| VLSOC | VHNVoltage | Toff | MDISC |
| VLSOC | VHPVoltage | Foff | VHCHAR |
| VLSOC | VHPVoltage | Fon | VHCHAR |
| VLSOC | VHPVoltage | Soff | VHCHAR |
| VLSOC | VHPVoltage | Son | VHCHAR |
| VLSOC | VHPVoltage | Toff | VHCHAR |
| LSOC | HNVoltage | Foff | MDISC |
| LSOC | HNVoltage | Fon | MDISC |
| LSOC | HNVoltage | Soff | MDISC |
| LSOC | HNVoltage | Son | MDISC |
| LSOC | HNVoltage | Toff | MDISC |
| LSOC | NOVoltage | Foff | ZR |
| LSOC | NOVoltage | Fon | ZR |
| LSOC | NOVoltage | Soff | ZR |
| LSOC | NOVoltage | Son | ZR |
| LSOC | NOVoltage | Toff | ZR |
| LSOC | LPVoltage | Foff | MCHAR |
| LSOC | LPVoltage | Fon | ZR |
| LSOC | LPVoltage | Soff | MCHAR |
| LSOC | LPVoltage | Son | ZR |
| LSOC | LPVoltage | Toff | MCHAR |
| LSOC | MPVoltage | Foff | HCHAR |
| LSOC | MPVoltage | Soff | HCHAR |
| LSOC | MPVoltage | Toff | ZR |
| LSOC | MPVoltage | Fon | ZR |
| LSOC | MPVoltage | Son | ZR |
| LSOC | LNVoltage | Son | MDISC |
| LSOC | LNVoltage | Fon | MDISC |
| LSOC | LNVoltage | Foff | ZR |
| LSOC | LNVoltage | Soff | ZR |
| LSOC | LNVoltage | Toff | ZR |
| LSOC | VHNVoltage | Foff | VHDISC |
| LSOC | VHNVoltage | Fon | VHDISC |
| LSOC | VHNVoltage | Soff | VHDISC |
| LSOC | VHNVoltage | Son | VHDISC |
| LSOC | VHNVoltage | Toff | VHDISC |
| LSOC | VHPVoltage | Foff | VHCHAR |
| LSOC | VHPVoltage | Soff | VHCHAR |
| LSOC | VHPVoltage | Toff | VHCHAR |
| LSOC | VHPVoltage | Fon | HCHAR |
| LSOC | VHPVoltage | Son | HCHAR |
| MSOC | HNVoltage | Foff | HDISC |
| MSOC | HNVoltage | Fon | VHDISC |
| MSOC | HNVoltage | Soff | HDISC |
| MSOC | HNVoltage | Son | VHDISC |
| MSOC | HNVoltage | Toff | MDISC |
| MSOC | NOVoltage | Foff | ZR |
| MSOC | NOVoltage | Fon | ZR |
| MSOC | NOVoltage | Soff | ZR |
| MSOC | NOVoltage | Son | ZR |
| MSOC | NOVoltage | Toff | ZR |
| MSOC | LPVoltage | Foff | MCHAR |
| MSOC | LPVoltage | Soff | MCHAR |
| MSOC | LPVoltage | Toff | MCHAR |
| MSOC | LPVoltage | Fon | ZR |
| MSOC | LPVoltage | Son | ZR |
| MSOC | MPVoltage | Foff | MCHAR |
| MSOC | MPVoltage | Soff | MCHAR |
| MSOC | MPVoltage | Toff | MCHAR |
| MSOC | MPVoltage | Fon | ZR |
| MSOC | MPVoltage | Son | ZR |
| MSOC | LNVoltage | Foff | MDISC |
| MSOC | LNVoltage | Soff | MDISC |
| MSOC | LNVoltage | Toff | MDISC |
| MSOC | LNVoltage | Fon | MDISC |
| MSOC | LNVoltage | Son | MDISC |
| MSOC | VHNVoltage | Foff | VHDISC |
| MSOC | VHNVoltage | Fon | VHDISC |
| MSOC | VHNVoltage | Soff | VHDISC |
| MSOC | VHNVoltage | Son | VHDISC |
| MSOC | VHNVoltage | Toff | VHDISC |
| MSOC | VHPVoltage | Foff | VHCHAR |
| MSOC | VHPVoltage | Soff | VHCHAR |
| MSOC | VHPVoltage | Toff | VHCHAR |
| MSOC | VHPVoltage | Fon | MCHAR |
| MSOC | VHPVoltage | Son | MCHAR |
| HSOC | HNVoltage | Foff | VHDISC |
| HSOC | HNVoltage | Fon | VHDISC |
| HSOC | HNVoltage | Soff | VHDISC |
| HSOC | HNVoltage | Son | VHDISC |
| HSOC | HNVoltage | Toff | VHDISC |
| HSOC | NOVoltage | Foff | ZR |
| HSOC | NOVoltage | Fon | ZR |
| HSOC | NOVoltage | Soff | ZR |
| HSOC | NOVoltage | Son | ZR |
| HSOC | NOVoltage | Toff | ZR |
| HSOC | LPVoltage | Foff | MCHAR |
| HSOC | LPVoltage | Soff | MCHAR |
| HSOC | LPVoltage | Toff | MCHAR |
| HSOC | LPVoltage | Fon | ZR |
| HSOC | LPVoltage | Son | ZR |
| HSOC | MPVoltage | Foff | MCHAR |
| HSOC | MPVoltage | Soff | MCHAR |
| HSOC | MPVoltage | Toff | MCHAR |
| HSOC | MPVoltage | Fon | ZR |
| HSOC | MPVoltage | Son | ZR |
| HSOC | LNVoltage | Foff | MDISC |
| HSOC | LNVoltage | Fon | MDISC |
| HSOC | LNVoltage | Soff | MDISC |
| HSOC | LNVoltage | Son | MDISC |
| HSOC | LNVoltage | Toff | MDISC |
| HSOC | VHNVoltage | Foff | VHDISC |
| HSOC | VHNVoltage | Fon | VHDISC |
| HSOC | VHNVoltage | Soff | VHDISC |
| HSOC | VHNVoltage | Son | VHDISC |
| HSOC | VHNVoltage | Toff | VHDISC |
| HSOC | VHPVoltage | Foff | VHCHAR |
| HSOC | VHPVoltage | Soff | VHCHAR |
| HSOC | VHPVoltage | Toff | VHCHAR |
| HSOC | VHPVoltage | Fon | MCHAR |
| HSOC | VHPVoltage | Son | MCHAR |
References
- U.S. Energy Information Administration. International Energy Outlook 2017; U.S. Energy Information Administration: Washington, DC, USA, 2017.
- Noor, S.; Yang, W.; Guo, M.; van Dam, K.H.; Wang, X. Energy Demand Side Management within micro-grid networks enhanced by blockchain. Appl. Energy 2018, 228, 1385–1398. [Google Scholar] [CrossRef]
- Olkkonen, V.; Ekström, J.; Hast, A.; Syri, S. Utilising demand response in the future Finnish energy system with increased shares of baseload nuclear power and variable renewable energy. Energy 2018, 164, 204–217. [Google Scholar] [CrossRef]
- Lacal Arantegui, R.; Jäger-Waldau, A. Photovoltaics and wind status in the European Union after the Paris Agreement. Renew. Sustain. Energy Rev. 2018, 81, 2460–2471. [Google Scholar] [CrossRef]
- Dawoud, S.M.; Lin, X.; Okba, M.I. Hybrid renewable microgrid optimization techniques: A review. Renew. Sustain. Energy Rev. 2018, 82, 2039–2052. [Google Scholar] [CrossRef]
- Arcos-Vargas, A.; Cansino, J.M.; Román-Collado, R. Economic and environmental analysis of a residential PV system: A profitable contribution to the Paris agreement. Renew. Sustain. Energy Rev. 2018, 94, 1024–1035. [Google Scholar] [CrossRef]
- Anoune, K.; Bouya, M.; Astito, A.; Abdellah, A. Ben Sizing methods and optimization techniques for PV-wind based hybrid renewable energy system: A review. Renew. Sustain. Energy Rev. 2018, 93, 652–673. [Google Scholar] [CrossRef]
- Li, J. Optimal Sizing of Grid-Connected Photovoltaic Battery Systems for Residential Houses in Australia. Renew. Energy 2019, 136, 1245–1254. [Google Scholar] [CrossRef]
- Liu, J.; Mei, C.; Wang, H.; Shao, W.; Xiang, C. Powering an island system by renewable energy-A feasibility analysis in the Maldives. Appl. Energy 2017, 227, 18–27. [Google Scholar] [CrossRef]
- Yang, Y.; Bremner, S.; Menictas, C.; Kay, M. Battery energy storage system size determination in renewable energy systems: A review. Renew. Sustain. Energy Rev. 2018, 91, 109–125. [Google Scholar] [CrossRef]
- Segundo Sevilla, F.R.; Parra, D.; Wyrsch, N.; Patel, M.K.; Kienzle, F.; Korba, P. Techno-economic analysis of battery storage and curtailment in a distribution grid with high PV penetration. J. Energy Storage 2018, 17, 73–83. [Google Scholar] [CrossRef]
- Magnor, D.; Sauer, D.U. Optimization of PV Battery Systems Using Genetic Algorithms. Energy Procedia 2016, 99, 332–340. [Google Scholar] [CrossRef]
- Tervo, E.; Agbim, K.; DeAngelis, F.; Hernandez, J.; Kim, H.K.; Odukomaiya, A. An economic analysis of residential photovoltaic systems with lithium ion battery storage in the United States. Renew. Sustain. Energy Rev. 2018, 94, 1057–1066. [Google Scholar] [CrossRef]
- Furukakoi, M.; Adewuyi, O.B.; Matayoshi, H.; Howlader, A.M.; Senjyu, T. Multi objective unit commitment with voltage stability and PV uncertainty. Appl. Energy 2018, 228, 618–623. [Google Scholar] [CrossRef]
- Aryanezhad, M. Management and coordination of LTC, SVR, shunt capacitor and energy storage with high PV penetration in power distribution system for voltage regulation and power loss minimization. Int. J. Electr. Power Energy Syst. 2018, 100, 178–192. [Google Scholar] [CrossRef]
- Breetz, H.L.; Salon, D. Do electric vehicles need subsidies? Ownership costs for conventional, hybrid, and electric vehicles in 14 U.S. cities. Energy Policy 2018, 120, 238–249. [Google Scholar] [CrossRef]
- Rodríguez-Gallegos, C.D.; Yang, D.; Gandhi, O.; Bieri, M.; Reindl, T.; Panda, S.K. A multi-objective and robust optimization approach for sizing and placement of PV and batteries in off-grid systems fully operated by diesel generators: An Indonesian case study. Energy 2018, 160, 410–429. [Google Scholar] [CrossRef]
- Al Essa, M.J.M. Management of charging cycles for grid-connected energy storage batteries. J. Energy Storage 2018, 18, 380–388. [Google Scholar]
- Bandpey, M.F.; Firouzjah, K.G. Two-stage charging strategy of plug-in electric vehicles based on fuzzy control. Comput. Oper. Res. 2018, 96, 236–243. [Google Scholar] [CrossRef]
- Suresh, R.; Rengaswamy, R. Modeling and control of battery systems. Part II: A model predictive controller for optimal charging. Comput. Chem. Eng. 2018, 119, 326–335. [Google Scholar] [CrossRef]
- Suresh, R.; Rengaswamy, R. Capacity Fade Minimizing Model Predictive Control Approach for the Identification and Realization of Charge-Discharge Cycles in Lithium Ion Batteries; Elsevier Masson SAS: Amsterdam, The Netherlands, 2017; Volume 40, ISBN 978-0-444-64078-9. [Google Scholar]
- Falahati, S.; Abbas, S.; Shahidehpour, M. Grid frequency control with electric vehicles by using of an optimized fuzzy controller. Appl. Energy 2016, 178, 918–928. [Google Scholar] [CrossRef]
- Jiang, T.; Putrus, G.; Gao, Z.; Conti, M.; Mcdonald, S.; Lacey, G. Electrical Power and Energy Systems Development of a decentralized smart charge controller for electric vehicles. Int. J. Electr. Power Energy Syst. 2014, 61, 355–370. [Google Scholar] [CrossRef]
- Bruch, M.; Müller, M. Calculation of the cost-effectiveness of a PV battery system. Energy Procedia 2014, 46, 262–270. [Google Scholar] [CrossRef]
- Elia. Available online: http://www.elia.be/en/about-elia/legal-framework (accessed on 12 December 2018).
- UCI Individual Household Electric Power Consumption Data Set. Available online: https://archive.ics.uci.edu/ml/datasets/individual (accessed on 12 December 2018).
- Meteoblue 2018. Available online: https://www.meteoblue.com/en/weather/forecast/week (accessed on 12 December 2018).
- Ghorbani, N.; Kasaeian, A.; Toopshekan, A.; Bahrami, L.; Maghami, A. Optimizing a hybrid wind-PV-battery system using GA-PSO and MOPSO for reducing cost and increasing reliability. Energy 2018, 154, 581–591. [Google Scholar] [CrossRef]
- Ghasemi, M.; Ghavidel, S.; Ghanbarian, M.M.; Gharibzadeh, M.; Azizi Vahed, A. Multi-objective optimal power flow considering the cost, emission, voltage deviation and power losses using multi-objective modified imperialist competitive algorithm. Energy 2014, 78, 276–289. [Google Scholar] [CrossRef]
- Zafar, R.; Mahmood, A.; Razzaq, S.; Ali, W.; Naeem, U.; Shehzad, K. Prosumer based energy management and sharing in smart grid. Renew. Sustain. Energy Rev. 2018, 82, 1675–1684. [Google Scholar] [CrossRef]
- Abuelnasr, M.; El-Khattam, W.; Helal, I. Examining the influence of micro-grids topologies on optimal energy management systems decisions using genetic algorithm. Ain Shams Eng. J. 2018, 9, 2807–2814. [Google Scholar] [CrossRef]
- Sabino, S.; Grilo, A. Routing for Efficient Alarm Aggregation in Smart Grids: A Genetic Algorithm Approach. Procedia Comput. Sci. 2018, 130, 164–171. [Google Scholar] [CrossRef]
- Abdelkader, A.; Rabeh, A.; Mohamed Ali, D.; Mohamed, J. Multi-objective genetic algorithm based sizing optimization of a stand-alone wind/PV power supply system with enhanced battery/supercapacitor hybrid energy storage. Energy 2018, 163, 351–363. [Google Scholar] [CrossRef]
- Verma, O.P.; Manik, G.; Suryakant; Jain, V.K.; Jain, D.K.; Wang, H. Minimization of energy consumption in multiple stage evaporator using Genetic Algorithm. Sustain. Comput. Inform. Syst. 2017, 20, 130–140. [Google Scholar]
- Cortés, P.; Muñuzuri, J.; Berrocal-de-O, M.; Domínguez, I. Genetic algorithms to optimize the operating costs of electricity and heating networks in buildings considering distributed energy generation and storage. Comput. Oper. Res. 2018, 96, 157–172. [Google Scholar] [CrossRef]
- Ganjehkaviri, A.; Mohd Jaafar, M.N.; Hosseini, S.E.; Barzegaravval, H. Genetic algorithm for optimization of energy systems: Solution uniqueness, accuracy, Pareto convergence and dimension reduction. Energy 2017, 119, S125–S127. [Google Scholar] [CrossRef]
- Hong, Y.; Lee, C.W. Pareto fronts for multiobjective optimal design of the lithium-ion battery cell. J. Energy Storage 2018, 17, 507–514. [Google Scholar] [CrossRef]
- Zadeh, A. Fuzzy Sets. Inf. Control 1965, 8, 338–353. [Google Scholar] [CrossRef]
- Rajan, S.; Sahadev, S. Performance Improvement of Fuzzy Logic Controller Using Neural Network. Procedia Technol. 2016, 24, 704–714. [Google Scholar] [CrossRef]
- Falahati, S.; Taher, S.A.; Shahidehpour, M. A new smart charging method for EVs for frequency control of smart grid. Int. J. Electr. Power Energy Syst. 2016, 83, 458–469. [Google Scholar] [CrossRef]
- Keshtkar, A.; Arzanpour, S.; Keshtkar, F.; Ahmadi, P. Smart residential load reduction via fuzzy logic, wireless sensors, and smart grid incentives. Energy Build. 2015, 104, 165–180. [Google Scholar] [CrossRef]
- Bogno, B.; Sawicki, J.P.; Salame, T.; Aillerie, M.; Saint-Eve, F.; Hamandjoda, O.; Tibi, B. Improvement of safety, longevity and performance of lead acid battery in off-grid PV systems. Int. J. Hydrogen Energy 2017, 42, 3466–3478. [Google Scholar] [CrossRef]
- García-Plaza, M.; Eloy-García Carrasco, J.; Alonso-Martínez, J.; Peña Asensio, A. Peak shaving algorithm with dynamic minimum voltage tracking for battery storage systems in microgrid applications. J. Energy Storage 2018, 20, 41–48. [Google Scholar] [CrossRef]
- Dongol, D.; Feldmann, T.; Schmidt, M.; Bollin, E. A model predictive control based peak shaving application of battery for a household with photovoltaic system in a rural distribution grid. Sustain. Energy Grids Netw. 2018, 16, 1–13. [Google Scholar] [CrossRef]
- Schopfer, S.; Tiefenbeck, V.; Staake, T. Economic assessment of photovoltaic battery systems based on household load profiles. Appl. Energy 2018, 223, 229–248. [Google Scholar] [CrossRef]
- Von Appena, J.; Brauna, M. Interdependencies between self-sufficiency preferences, techno-economic drivers for investment decisions and grid integration of residential PV storage systems. Appl. Energy 2018, 229, 1140–1151. [Google Scholar] [CrossRef]
- Gur, K.; Chatzikyriakou, D.; Baschet, C.; Salomon, M. The reuse of electrified vehicle batteries as a means of integrating renewable energy into the European electricity grid: A policy and market analysis. Energy Policy 2018, 113, 535–545. [Google Scholar] [CrossRef]
- Luminus. Available online: https://www.luminus.be/nl/ (accessed on 19 December 2018).
- Vreg. Available online: https://www.vreg.be/en/support-system-green-certificates (accessed on 18 December 2018).
- Bourgault, B.C.; Bons, M.; Breitschopf, B.; Buzharovski, S.; Friedrichsen, N.; Grave, K.; Ivan, V.; Janeiro, L.; Karas, J.; Nierop, S.; et al. Prices and Costs of EU Energy Annex 1: Country Descriptions. Available online: https://ec.europa.eu/energy/sites/ener/files/documents/annex1_ecofys2016.pdf (accessed on 20 December 2018).
- Bertsch, V.; Geldermann, J.; Lühn, T. What drives the profitability of household PV investments, self-consumption and self-sufficiency? Appl. Energy 2017, 204, 1–15. [Google Scholar] [CrossRef]
- Couture, T.D.; Cory, K.; Kreycik, C.; Williams, E. Policymaker’s Guide to Feed-in Tariff Policy Design; National Renewable Energy Laboratory: Golden, CO, USA, 2010.
- CREG “Commission for Regulation of Electricity and Gas”. Available online: https://www.creg.be (accessed on 30 December 2018).
- Bode, O.; Shigenobu, R.; Senjyu, T.; Lotfy, M.E.; Motin, A. Multiobjective mix generation planning considering utility-scale solar PV system and voltage stability: Nigerian case study. Electr. Power Syst. Res. 2019, 168, 269–282. [Google Scholar]
- Andrew, O.; Fournier, J. ScienceDirect ScienceDirect ScienceDirect The placement Cooling loss Optimal of distributed generator for power minimization and voltage stability improvement Assessing the feasibility of using the heat demand-outdoor temperature function for a long-term district heat demand forecast. Energy Procedia 2017, 138, 134–139. [Google Scholar]
- Li, Y.; Gao, W.; Ruan, Y. Performance investigation of grid-connected residential PV-battery system focusing on enhancing self-consumption and peak shaving in Kyushu, Japan. Renew. Energy 2018, 127, 514–523. [Google Scholar] [CrossRef]
- Dehler, J.; Keles, D.; Telsnig, T.; Fleischer, B.; Baumann, M.; Fraboulet, D.; Faure-Schuyer, A.; Fichtner, W. Self-Consumption of Electricity from Renewable Sources. In Europe’s Energy Transition-Insights for Policy Making; Academic Press: Cambridge, MA, USA, 2017; pp. 225–236. [Google Scholar]
- Id, G.B.; Messagie, M.; Smekens, J.; Omar, N.; Vanhaverbeke, L. Cost Projection of State of the Art Lithium-Ion Batteries for Electric Vehicles Up to 2030. Energies 2017, 10, 1314. [Google Scholar]
- Naumann, M.; Karl, R.C.; Truong, C.N.; Jossen, A.; Hesse, H.C. Lithium-ion battery cost analysis in PV-household application. Energy Procedia 2015, 73, 37–47. [Google Scholar] [CrossRef]


| Parameters | Values | References |
|---|---|---|
| PV system price | 1852.88 €/kWp | [45,46] |
| PV lifetime | 20 years | [28] |
| Battery system price | 350 €/kWh | [45,47] |
| Battery lifetime | 10 years | [47] |
| Sell price per kWh peak time | 0.0966 €/kWh | [48,49] |
| Sell price per kWh off-peak time | 0.0712 €/kWh | [48,49] |
| Purchase price per kWh peak time | 0.0966 €/kWh | [48] |
| Purchase price per kWh off-peak time | 0.0712 €/kWh | [48] |
| Tax included in the price | 21% | [50] |
| Increase of electricity price per year | 2% | [51] |
| TCO (€) | VD (%) | |
|---|---|---|
| Before optimization | 1136 × 103 | 4.35 |
| After optimization | 1094 × 103 | 3.62 |
| PV Farm (MWp) | Battery Capacity (MWh) |
|---|---|
| 2 | 1.27 |
| Profits | Cost (Million Euros) |
|---|---|
| Profit from PV production (sell to the grid) | 0.0425 every year |
| Profit from PV production (load reduction) | 0.383 every year |
| Total yearly investment, O&M, and replacement cost | 0.3 |
© 2019 by the authors. Licensee MDPI, Basel, Switzerland. This article is an open access article distributed under the terms and conditions of the Creative Commons Attribution (CC BY) license (http://creativecommons.org/licenses/by/4.0/).
Share and Cite
Worighi, I.; Geury, T.; El Baghdadi, M.; Van Mierlo, J.; Hegazy, O.; Maach, A. Optimal Design of Hybrid PV-Battery System in Residential Buildings: End-User Economics, and PV Penetration. Appl. Sci. 2019, 9, 1022. https://doi.org/10.3390/app9051022
Worighi I, Geury T, El Baghdadi M, Van Mierlo J, Hegazy O, Maach A. Optimal Design of Hybrid PV-Battery System in Residential Buildings: End-User Economics, and PV Penetration. Applied Sciences. 2019; 9(5):1022. https://doi.org/10.3390/app9051022
Chicago/Turabian StyleWorighi, Imane, Thomas Geury, Mohamed El Baghdadi, Joeri Van Mierlo, Omar Hegazy, and Abdelilah Maach. 2019. "Optimal Design of Hybrid PV-Battery System in Residential Buildings: End-User Economics, and PV Penetration" Applied Sciences 9, no. 5: 1022. https://doi.org/10.3390/app9051022
APA StyleWorighi, I., Geury, T., El Baghdadi, M., Van Mierlo, J., Hegazy, O., & Maach, A. (2019). Optimal Design of Hybrid PV-Battery System in Residential Buildings: End-User Economics, and PV Penetration. Applied Sciences, 9(5), 1022. https://doi.org/10.3390/app9051022