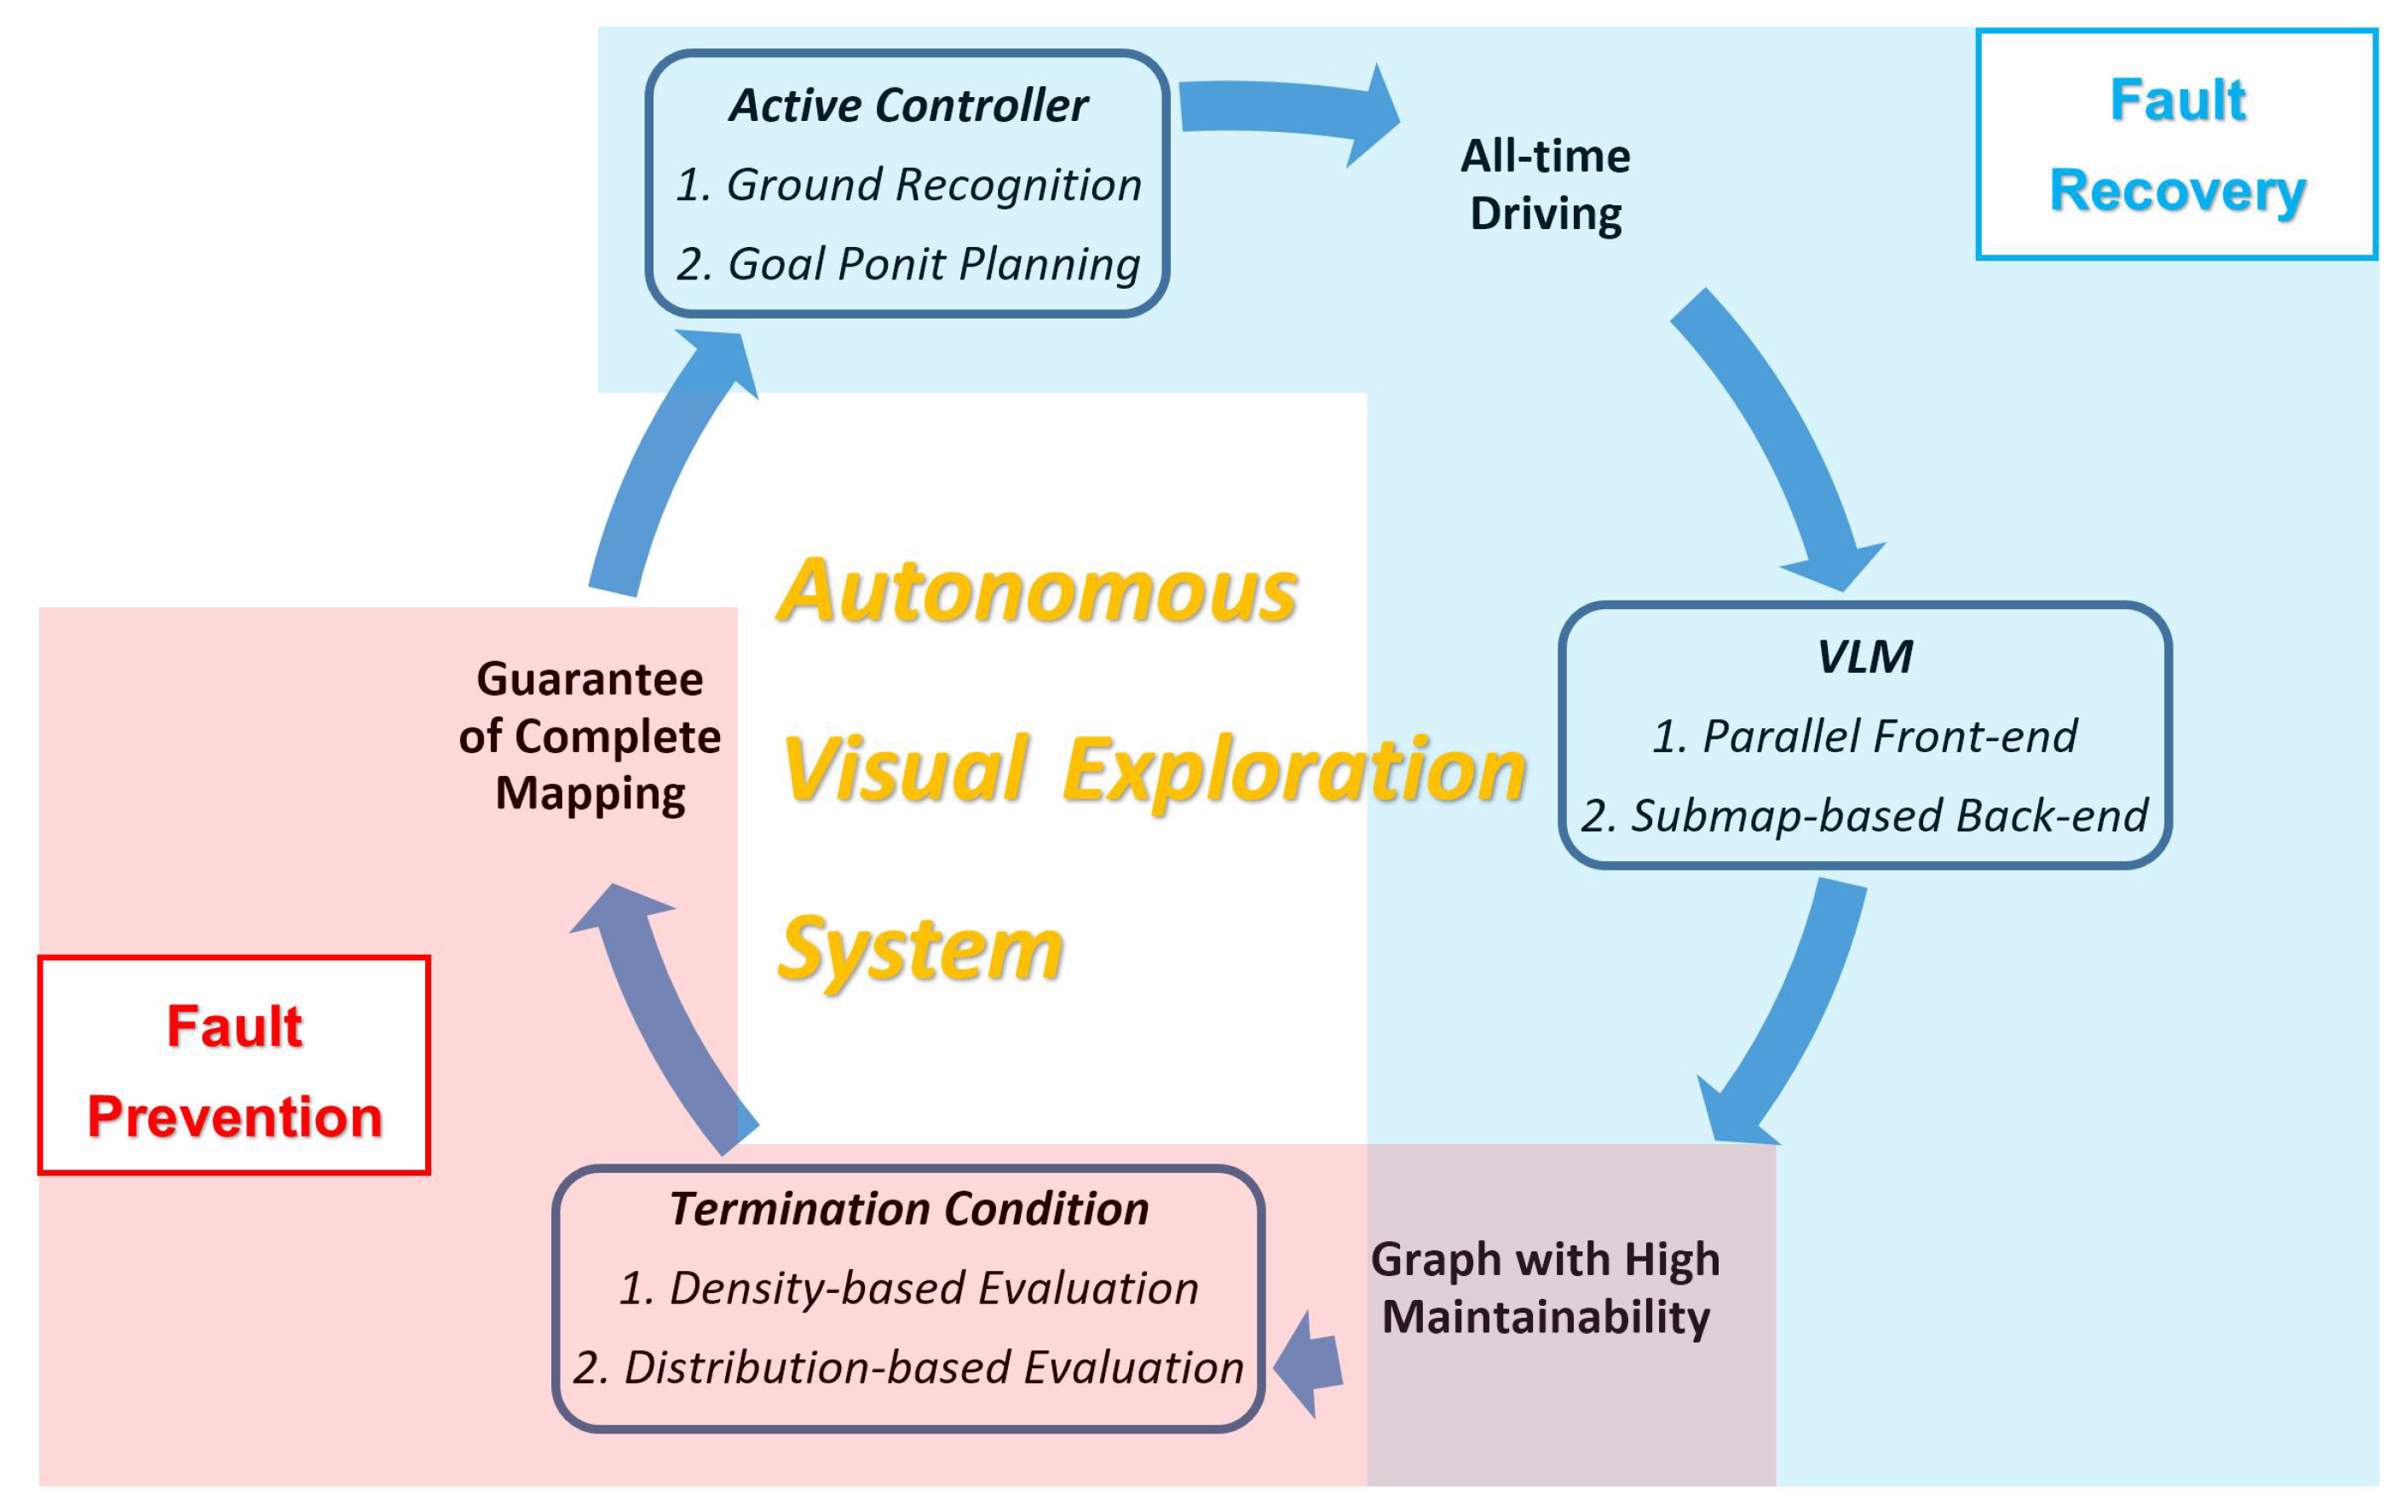
Article

Reliable Visual Exploration System with Fault Tolerance Structure

1
Biomimetic and Intelligent Robotics Lab, Guangdong University of Technology, Guangzhou 510006, China
2
Department of Computing Science, University of Alberta, Edmonton, AB T6G 2R3, Canada
*
Author to whom correspondence should be addressed.
Appl. Sci. 2019, 9(4), 662; https://doi.org/10.3390/app9040662
Submission received: 26 December 2018 / Revised: 4 February 2019 / Accepted: 8 February 2019 / Published: 15 February 2019
(This article belongs to the Section Computing and Artificial Intelligence)

Abstract

:

Featured Application

A fault tolerance structure is proposed for reliability improvement of visual tracking and mapping, and this structure can be applied to visual exploration with mobile robots.

Abstract

Reliability of visual tracking and mapping is a challenging problem in robotics research, and it limits the promotion of vision-based mobile robot applications to a great extent. In this paper, we propose to improve the reliability of visual exploration in terms of its fault tolerance. Three modules are involved in our visual exploration system: visual localization and mapping, active controller and termination condition. High maintainability of mapping is obtained by the submap-based visual mapping module, persistent driving is achieved by a semantic segmentation based active controller, and robustness of re-localization is guaranteed by a novel completeness evaluation method in the termination condition. All the modules are integrated tightly for maintaining mapping and improving visual tracking. The system is verified with simulations and real world experiments, and all the solutions to fault tolerance are verified to overcome the failure conditions of visual tracking and mapping.

1. Introduction

Visual exploration plays a crucial role in vision-based mobile robot applications. For visual localization and mapping, many related studies have been published [1,2] in VSLAM (Visual Simultaneous Localization and Mapping) area, whose focus has often been on precision. As indicated in [3], the improvement of robustness could be a major challenge for practical vision-based navigation system, and many studies have been published to tackle this problem [4,5]. Nevertheless, comparing with the related works that regard reliability improving as a CV (Computer Vision) problem, we attempt to address the issue by considering vision-based navigation as a fault tolerance system, where both platform driving and exploration termination are considered. Referring to [6,7], a fault tolerance structure is introduced here, where “fault” is defined as the failure of visual tracking and mapping.
For fault tolerance in mobile robots, besides VSLAM, additional problems should be considered [8]. One such problem involves the design of active controller for the mobile platform to determine the desired robot motion. For controlling, the localization of the mobile platform is always required [9]. Some related works search the goal point in the image space with a Homography transformation [10,11], where planar assumption is needed, and this assumption limits the generality and robustness of controller. Owing to the tremendous progress in pattern recognition [12,13] research, a reactive strategy according to the captured image has been proposed in recent years, and it is popularly studied in the community of autonomous driving [14,15,16]. In this paper, an active controller is designed and applied in the continuous operation of a mobile robot.
In addition to the active controller, termination conditions for exploration are introduced for exploration evaluation. Some existing termination conditions utilize the depth information from LiDAR sensor or RGB-D sensor [17], and makes use of the minimum of system entropy for path planning [18,19]. These methods are inapplicable to a vision exploration system since no depth information is provided. Based on the SVO system [2], an unknown environment exploration study has been developed [20]; the triangulation of visual features is required for frontier detection, which is fragile due to the nature of feature-based triangulation. Using the prior knowledge of the environment, such as its frontier or CAD (computer aided design) model, some termination conditions have been introduced [21,22]. Based on to the existing related works, without requiring any prior knowledge or computing feature triangulation, a coarse-to-fine termination condition is proposed in this study, and it is exploited for fault prevention.
With visual localization and mapping, active controller and termination condition, we are able to introduce a complete exploration system for reliable mobile robot mapping and tracking. The experimental results demonstrate the advantage of exploration with the proposed solutions to the failure in visual tracking and mapping. Our main contribution is proposing a fault tolerance structure for autonomous visual exploration. Besides visual mapping and localization, the active controller and the exploration termination condition are introduced for overcoming visual tracking and mapping failures at the level of mobile robot systems.
The rest of this paper is organized as follows: Section 2 presents the framework of our fault-tolerant robot navigation system. Section 4 introduces the vision-based mapping and localization. In Section 3, an active controller based on image semantic segmentation is described. Section 5 details the termination condition for environment exploration. Section 6 provides the evaluation of our proposed system, and Section 7 discusses of the experimental results. Section 8 concludes the paper.

2. Fault-Tolerant Visual Robot Navigation

To solve the problem of reliable visual exploration and overcome the failure of visual tracking and mapping, a visual exploration system with fault tolerance structure is proposed in this paper. In this section, the framework of our system is detailed. In addition, the solutions to fault tolerance in our framework are given.

2.1. Exploration System

The structure of our system is shown in Figure 1. The input of our system is the view from a monocular camera fixed on the mobile robot; the output is the control command for platform driving and the model of explored environment. Three modules are involved in our exploration system: active controller based on semantic scene segmentation, visual localization and mapping, and termination condition.
For maintaining continuous robot motion, an active controller is introduced. Thanks to the advance in deep learning-based image segmentation, a reactive controlling strategy can be designed. We plan the goal point in the image space with the help of ground recognition, which is accomplished by a pre-trained CNN (convolutional neural network). In addition, the main advantage of our active controller is that no real-time localization is needed, and the mobile platform is able to continue its motion and capture the view of the environment.
After image capturing, the images from the camera are used for environment modeling. The SfM (Structure from Motion) module in our system is labeled as VLM (visual localization and mapping). A pose-graph back-end is employed to estimate robot poses visited by the robot in its environment, and submap idea is introduced for robustness improving, which maintains a graph update within one of the submaps instead of keeping tracking in a single global graph.
From the aspect of the termination condition, after obtaining the pose graph from VLM, a mapping completeness evaluation is conducted. A coarse-to-fine evaluation is used for this purpose. The coarse completeness evaluation is calculated in terms of the coverage density of robot poses, represented by the vertexes within the pose graph. After the density satisfies the coarse evaluation, a fine evaluation is performed in terms of the distribution of existing keyframes. Only when both evaluations are satisfied will the exploration be terminated.

2.2. Fault Tolerance within an Exploration System

Within such a framework mentioned above, for achieving fault tolerance, a series of techniques are implemented to overcome the fault during visual exploration:
1. For fault recovery, by building multiple submaps, the visual mapping is strengthened in terms of graph maintainability.
2. By a higher frame rate with a parallel framework to perform VLM, the difficulty of data association for visual tracking is reduced.
3. Active controller is used for keeping a submap building all the time, which increases the strength by tracking recovering in terms of hardware.
4. Mapping completeness of explored space is conducted in order to improve the ability of re-localization based on the built map.
Within the visual exploration system, fault is defined as the failure of visual tracking and mapping; fault prevention is realized by parallel design in VLM and completeness evaluation in termination condition; fault recovery for maintaining mapping is realized by a submap-based back-end and active controller. The achievement of fault tolerance is summarized in Table 1.
The evaluations of each module in Section 6 are designed according to the solutions shown in Table 1, including the mapping maintenance and frame rate improvement in VLM, proper driving and obstacle avoidance without localization of active controller and re-localization enhancement by mapping completeness evaluation using the termination condition.

3. Active Controller Based on Semantic Segmentation

As is shown in Figure 1, the first module in our framework is the active controller. For robot exploration, we design a controller which is able to work without global localization and continue its motion so that fault recovery becomes feasible with respect to hardware control. Such a controller is proposed to overcome the fragility of visual localization. The pseudo-code of the active controller is given in Algorithm 1.
Algorithm 1 Framework of active controller
Require: Current captured image, represented as I
1:
Ground segmentation from I, denoted as G
2:
if I = then
3:
    Control command C generated from recover motion
4:
else
5:
    Goal point searching from G
6:
    Control command C generated from G with a PID controller
7:
end if
8:
returnC
In this section, we detail our active controller based on ground recognition. The pre-trained Pascal CNN [12] is applied to perform semantic image segmentation, and a Gaussian expression of the segmented image is used for goal planning. After obtaining the goal, the PID (proportion, integral and differential) controller is used for velocity command generation.

3.1. Ground Recognition

In most of the existing controllers, the localization of the mobile robot is needed for path planning. However, due to the fragility of visual tracking, it is hard to obtain global localization all the time. A reactive strategy is used in our system, it is able to perform ground recognition from in a single image.
For ground recognition, without loss of generality, two assumptions are made: the monocular camera is placed in the direction of the heading of the mobile platform; secondly, the camera is fixed with a pitch in which the ground can be observed most of the time; an illustration is shown in Figure 2.
Our system uses the Pascal context pre-trained model, whose output is the segmented image with the same size as the input image. In addition, neither prior-knowledge nor localization is needed for this segmentation. An example of the segmentation results is illustrated in Figure 3.

3.2. Goal Point Planner in Image Space

After obtaining the segmentation result, goal selection is conducted in the segmented image, by following the procedure shown in Algorithm 2.
Algorithm 2 Goal point planning from segmented ground
Require: Segmented ground, represented as G
1:
Gaussian expression of G along the x-axis and y-axis
2:
Main searching line generated from the Gaussian expression
3:
Set of searching line l search from the main searching line
4:
Find the farthest ground point p g o a l along all the lines in l search
5:
return p g o a l
In our study, we approximate the ground region as a 2D Gaussian function, and compute the mean and variance of the ground pixels along the x and y-axes, represented as m x , m y and v x , v y . Then, a line l m that passes through point ( m x , m y ) is regarded as the main searching line and its direction is determined by:
d m = v y · v x 1 ,
with l m a set of line is drawn which is centered on m x , m y , and in the direction of d m + i d , where i is the index of line within the line set and d is a given interval for searching lines generation. Each line is represented as l i , combined with l m , we get the complete searching line set, represented as l search .
For the image with a size of h w , where h is the height and w is the width, the original point o i m a g e is defined as the point at ( h 2 1 , 0 ) in image coordinates (the y-axis lies in the image height direction). With l search , we search the ground pixels p i along each line, and record the pixel which has the biggest Euclidean distance d ( ) from o i m a g e in the image space, represented as p g o a l in Equation (2). Such a strategy increases the ability of exploring by driving to the most promising unexplored space:
p g o a l = arg p i l search max d ( p i , o i m a g e ) .
Examples of the obtained p g o a l are illustrated in Figure 4, where the red point is the goal, the blue point is the mean of the segmented result, and the blue lines are the searching lines. When no ground can be recognized, pure rotation by a random among is executed as the means of recovery.
For motion control, PID controller is used for command generation. The error that is fed to the PID controller is defined as the distance between o i m a g e and p g o a l . Under such a motion command, the robot is able to move continuously even if it is not able to localize itself globally.

4. Visual Localization and Mapping

With the mobile robot driven by the active controller, the VLM module is used for environment modeling, and it is detailed in this section, which was first introduced in our previous study [23]. We achieve fault tolerance by improving the front-end of the SLAM system, as well as a submap-based graph optimization in the back-end.

4.1. Parallel Constraint Front-End

In the VLM front-end, a framework is designed for the place recognition of each new keyframe by considering multiple constraints in parallel so that an efficient solution is obtained. In addition, a multi-layer keyframe selection is introduced to limit the number of the keyframes. Fault prevention is in this case a by-product of a higher frame rate in this front-end.
A parallel framework is designed to speed up the building of loop-closure constraints. We separate the building of the constraints into different threads, and they are run in parallel, as is shown in Figure 5. Using such a strategy, the frame rate can be improved, which is linearly proportional to the number of built constraints before. With a higher frame rate, map maintainability will improve.
For keyframes selection, a multi-layer method is designed. The first step is calculating the distance of optical-flow; the second step is the difference of global descriptor over all of the keyframes. Since descriptor extraction is time-consuming, before descriptor extraction, we use an optical-flow method to calculate the appearance distance between the current frame and the last keyframe. Only when the image satisfies a similarity threshold will the global descriptor of the current image be extracted for keyframe selection and referenced frame recognition. Such a selection method can reduce on the time consumption by decreasing the time of the descriptor extraction.

4.2. Submap-Based Back-End

After obtaining the keyframes and constraints in the front-end, a pose-graph can be built, where keyframes are represented as vertexes in the graph. To build a submap-based back-end, instead of maintaining a single global graph, multiple submaps are maintained, and the visual tracking is always run within one of the submaps for overcoming tracking failure. The submap-based back-end can be seen in Figure 6.
Considering the fragility of visual tracking, when no reliable constraint can be built for a new keyframe, a new submap is initialized for keeping updating the graph all the time. After submaps’ initialization, the submaps are supposed to be merged by place recognition, and the scales in different submaps are aligned by global optimization.

5. Termination Condition: Completeness Evaluation

After environment modeling in VLM, the termination condition is evaluated to determine the completeness of mapping. For indoor exploration, a termination condition is needed since the explored space is limited. With completeness evaluation, the map information can be guaranteed to be rich enough for robust re-localization.
On account of the keyframe-based visual system, mapping completeness can be evaluated by the spatial density and distribution of collected keyframes. The organization of the proposed termination condition is illustrated in Figure 7, and the coarse completeness is calculated according to the local keyframe density; then, evaluation based on the global distribution of keyframes is examined for fine completeness evaluation. In such a mechanism, the density-based completeness evaluation is performed firstly, in order to obtain the number of samples for the statistics of distribution-based evaluation in the second step.

5.1. Density-Based Evaluation

The coarse evaluation is performed based on the spatial density of keyframes. With respect to the growth of the pose-graph, the number of edges and vertexes keeps increasing during exploration. Considering indoor applications, the vertexes in a limited space become denser and denser. Therefore, the exploration can be terminated if the vertexes are dense enough.
Since the number of loop-closure edges is proportional to the overlap between keyframe observations, and the overlap also increases with the increase of vertex density. In other words, for a certain number of edges N e d g e , when the size of needed new keyframe k c o u n t = 0 is small enough, and such a situation lasts for a certain duration D d e n s e , the vertexes in a limited space can be thought to be dense enough. This density-based evaluation is illustrated in Algorithm 3.
Algorithm 3 Density-based completeness evaluation
Require: Given threshold of the number of edge, represented as N e d g e ; Given threshold of the number of keyframe, represented as N k e y f r a m e ; Built graph of explored environment, represented as M g r a p h ; Threshold of dense constraints duration, represented as D d e n s e
1:
Counter of new edge e c o u n t = 0
2:
Counter of new keyframe k c o u n t = 0
3:
Counter of dense constraints building d c o u n t = 0
4:
while e c o u n t < N e d g e do
5:
    For new keyframe f n e w , build edges for it whose number is e n e w
6:
     e c o u n t + = e n e w
7:
     f n e w + = 1
8:
end while
9:
if f n e w < N k e y f r a m e then
10:
     d c o u n t + = 1
11:
else
12:
    Judgement of density-based evaluation j d e n s i t y = false
13:
end if
14:
if d c o u n t > D d e n s e then
15:
    Judgement of density-based evaluation j d e n s i t y = true
16:
else
17:
    Judgement of density-based evaluation j d e n s i t y = false
18:
end if
19:
return j d e n s i t y

5.2. Distribution-Based Evaluation

The density-based evaluation can be treated as a local completeness evaluation. Since there could be a situation that, during the evaluation, the robot platform is moving within a certain space only, the density of that space becomes dense enough to satisfy the verification, while the keyframes in other space are still spatially. Therefore, after the coarse evaluation is met and the number of vertexes is large enough, distribution-based evaluation is executed for evaluating globally.
Distribution-based evaluation, we terminate the exploration according to the Gaussian distribution of all the keyframes within the whole explored space.
Firstly, the explored space is grided evenly in a cellular decomposition method. An example is illustrated in Figure 8, where the completeness of mapping can be evaluated by the value of each grid. Regarding the fault prevention of localization, the more complete the mapping is, the more data association can be built. The resolution of gridding is determined by the requirement of mapping completeness [24], and it is given manually here. Then, the variance and mean of poses of the keyframes within a grid i can be calculated, represented as v i and m i . For an ideal exploration of a grid, the distribution of keyframe poses can be regarded as a Uniform Distribution U ( π , π ) , where the ideal variance and mean are known, written as v i d e a l and m i d e a l . Therefore, the explored score s i of a grid i can be defined as Equation (3):
s i = 1 / ( v i v i d e a l ) 2 + ( m i m i d e a l ) 2 .
For a practical problem, it is impossible to reach an ideal uniform distribution where an unlimited sampling is required; in addition, there is no need to build such a distribution since one frame can cover a certain range. By sampling with a given interval, the parameter of sub-ideal distribution can be seen in Table 2. The distribution with a 20-degree interval is used in our experiment.
For all the grids, we can get the scores of them, written as s grid , and the Gaussian expression of s grid can be computed, written as N ( n g r i d , σ g r i d ) . The termination condition is satisfied when Equation (4) is met:
s i s grid , n g r i d s i σ g r i d .

6. Experiments

For the evaluation of our exploration system, some simulations and experiments in the real world are set up to verify the system in different aspects. According to Table 1, all the solutions will be evaluated for overcoming the failure of visual tracking and mapping.
Firstly, the mobile platform and environment are introduced, as well as the simulation configuration. Secondly, experimental results of the active controller are provided in the aspect of all-time driving, including the obstacle avoidance and environment covering in different illumination. Thirdly, evaluation and comparisons for VLM are performed in terms of maintaining mapping and frame rate. Lastly, we evaluate the proposed termination condition by a series of experiments, which shows the fault prevention of re-localization with completeness evaluation.

6.1. Experiments Set-Up

For quantitative evaluation, two challenging datasets (UA-CSC1 and UA-CSC2) are collected, which contain the image sequence during exploration in our lab captured by a monocular camera, and ground truth from motion capture system. The configuration of experimental platform is illustrated as Figure 2, where the only input of our system is the image from monocular camera and the control command is generated for TurtleBot mobile robot (TurtleBot 2.0, Willow Garage, Palo Alto, CA, USA) with differential driving. The max linear speed of controller output is 0.3 m per second.
Regarding the active controller, simulations are designed to evaluate the controller in an indoor environment. The simulation is set-up in the Gazebo simulation environment. In addition, the results of demonstration in the real world are shown, and the ability of obstacle avoidance is verified.
To demonstrate the fault tolerance in VLM, comparison is designed. As a popular VSLAM system, ORB-SLAM 2.0 (abbreviated as ORB-SLAM in this section) is selected for comparison.
In the third part, evaluations of the proposed termination condition are shown. To show the fault prevention for localization by complete mapping, we conduct the experiments on the proposed completeness evaluation by the performance of re-localization with the built map. The successful percentage of re-localization is supposed to be improved by the termination condition.
The system is run on a computer with the Intel Core i5 (2.30 GHZ) CPU (Santa Clara, CA, USA), 8 GB memory and Nvidia GeForce GTX 960 GPU (Taiwan).

6.2. Evaluation of Active Controller

Both simulations in Gazebo and experiments in the real world are conducted with the active controller, and a differential driven platform is used. In addition, demonstrations are shown to evaluate the active controller. In addition, all the experiments and simulations in this section are performed without any visual localization.
In simulation, an indoor environment is set-up for ground texture generation. In addition, some obstacles are placed to test the ability of obstacle avoidance. With respect to the mobile platform, the TurtleBot model is utilized, and a monocular camera is fixed on it in the heading direction. The simulation result of obstacle avoidance is shown in Figure 9. In addition, given enough time (60 s), the process of exploration is shown in Figure 10.
For experiments in the real world, instead of the ideal illumination in the simulation environment, the illumination changes greatly outdoors, as well as the inconsistency of the ground texture. Due to the illumination invariance of the CNN based image segmentation method, the mobile platform is driven properly and avoids the obstacles successfully. The environment of experiment is shown in Figure 11. To evaluate the robustness of the controller, the experiment is also run on rainy nights (Figure 12), whose illumination is much different from that of Figure 11. Some shortcuts of the experiment are shown in Figure 13, and the demonstration can be seen in the attached video “Demonstration of Active Controller”.

6.3. Evaluation of VLM

We run multiple times on one dataset to compare VLM with ORB-SLAM. As for experimental indicators, we record the number of new keyframes in ORB-SLAM before each tracking failure, and calculate the average (A-KFs) and the standard deviation (SD-KFs) of that number. In addition, the same metrics are recorded for our system. The result is shown in Table 3.
To demonstrate the excellence of the parallel framework in the front-end, the average frame rate and RMSE (root mean squared error) of the experiments are calculated. For comparison, firstly, the system is run on one thread; secondly, the parallel framework of front-end and back-end (P-F&B) is added, which is similar to ORB-SLAM; lastly, the parallel constraints idea is added to the front-end for parallel multiple constraints building (P-MC). The comparison result is indicated in Table 4.
Regarding the submap-based back-end for overcoming the failure of tracking, we record the moment of tracking lost and loop-closure detection, as well as the error. The result is shown in Figure 14, where the deep blue curve is the localization error, the light blue curve is the response of tracking lost and the red curve is the response of loop-closure detection. In such a back-end, the mapping is always conducting within one of the submaps, and the error curve reduces when submaps are merged. In addition, the error does not increase after a certain duration of exploration, and a new frame is always able to be tracked within one of the submaps.

6.4. Evaluation of Termination Condition

With the active controller and VLM, the termination condition is verified by the performance of re-localization based on the built map. An exploration process is performed for environment modeling, and a set of images in the same environment captured with variant poses are collected for re-localization evaluation. These two processes are run in order.
During re-localization, all the vertexes that have been optimized are set to be static. In addition, no tracking edge is established here, since we try to solve a “kidnapping” localization problem, whose observation is an independent image instead of an image sequence. An evaluation metric is recorded: tracking percentage. We count the number of localized frames n l whose localization RMSE is less than 0.5, and calculate the ratio of n l and number of the considered frame n c . We believe that, if the exploration becomes more complete, more frames in different perspectives can be localized.
The experiment is designed to evaluate the completeness evaluation. Two series of experiments are set-up, and the tracking percentages with/without completeness evaluation are recorded to evaluate the impact of our proposed method. In addition, a series T d e n s i t y are given and the exploration duration for meeting the termination condition is recorded, while the mapping without completeness evaluation is terminated according to that recorded duration. The result is shown in Figure 15: the blue curve represents the result of exploration terminated by completeness evaluation; and the red curve represents the result terminated by the recorded time duration. The advance of exploration with completeness evaluation is indicated by a higher tracking percentage.
To verify the convergence of density-based evaluation, S n v is also provided, since the judgement of density-based evaluation is decided by it. The experimental result of S n v in density-based evaluation is shown in Figure 16.
To analyze the details of distribution-based evaluation, n g r i d is recorded to analyze the exploration score during exploration. The result is shown in Figure 17, which is the data from the same experiment of Figure 16. To show the trend of completeness evaluation, the data both before and after satisfying coarse evaluation is recorded, where the red dotted line is the moment that coarse evaluation is satisfied (the last time stamp in Figure 16).

7. Discussion

As the experimental results demonstrate, reliable performance is achieved with a couple of fault tolerance strategies. To improve the reliability of exploration, besides VLM, an active controller and exploration evaluation are introduced as a top layer of the mobile robot system to overcome the failure cases of visual tracking and map. A demonstration of autonomous exploration is provided in the attached video “Autonomous Visual Exploration”.
Regarding the designed active controller, the results of simulations and experiments are provided, which show the ability of environment coverage, as well as the feasibility of obstacle avoidance. Evaluations have been done in the Gazebo and in real experiments, and the experimental results are shown in Figure 9, Figure 10, Figure 11, Figure 12 and Figure 13. The active controller is able to drive the mobile platform properly without global localization in different situations, to achieve fault recovery by being able to move continuously until re-localization is obtained.
In the VLM modules, regarding the fault recovery for maintaining tracking and mapping, as is indicated in Table 3, the A-KFs of VLM are much larger than ORB-SLAM. As for the frame rate by parallel design, which is analyzed in Table 4, P-MC can improve the efficiency compared with the serial version and the P-F&B version, and the precision is similar. Such a performance strengthens the fault prevention by reliable data association.
With respect to maintaining mapping by submap-based back-end, as is shown in Figure 14, the error increases when visual tracking fails, and the error decreases when loop-closure is detected. Accounting for the whole exploration process, as the number of vertices in the map and the number of submaps increase, mapping is maintained all the time and the improved global consistency can be obtained. In other words, the use of submap-based mapping can to some extent overcome tracking failure by allowing the robot to operate within one of the submaps.
Considering the termination condition, we examine the effect of completeness evaluation on visual re-localization. The improvement introduced by completeness evaluation is indicated in Figure 15, where a higher re-localization percentage is obtained. The convergence of s n v is provided in Figure 16. Such a convergence verifies the feasibility of density-based evaluation. In addition, as is indicated in Figure 17, n g r i d increases during exploration, and the upward trend becomes obvious after density-based evaluation is satisfied. This verifies the feasibility of the proposed Coarse-to-Fine mechanism.
As can be seen in Table 1, our proposed solutions to the failure cases of visual tracking and mapping have been successfully verified, and the superiority with fault tolerance design in all the modules is shown quantitatively by different performance metrics.

8. Conclusions

A fault tolerance design for robust visual tracking and mapping is proposed in this paper. A visual localization and mapping module is used for environment modeling, where parallel design and a submap-based back-end are introduced for maintaining mapping and tracking. In addition, an active controller detached from global localization is developed. Due to the reactive strategy, our system is able to keep exploration and mapping even in the case of tracking failure. In addition, we propose a termination condition based on mapping completeness evaluation is proposed, which is verified to strengthen the re-localization performance of the built map.
Through experiments, the effectiveness of our system has been verified. For reliable visual exploration, we provide a feasible solution to fault tolerance through fault prevention and fault recovery.

Supplementary Materials

The following are available online at https://www.mdpi.com/2076-3417/9/4/662/s1, Video S1: Demonstration of Active Controller, Video S2: Autonomous Visual Exploration.

Author Contributions

W.C. and H.Z. co-organized the work, conceived and designed the structure and performed the experiments. W.C. wrote the manuscript. L.H. and Y.G. co-worked to prepare the final manuscript. Y.G. and H.Z. co-supervised the research.

Funding

The work in this paper is supported in part by the National Natural Science Foundation of China (Grant No. 61673125, 61703115), the Frontier and Key Technology Innovation Special Funds of Guangdong Province (Grant No. 2014B090919002, 2016B090910003), and the Program of Foshan Innovation Team of Science and Technology (Grant No. 2015IT100072).

Conflicts of Interest

The authors declare no conflict of interest.

References

  1. Mur-Artal Raúl, M.J.M.M.; Tardós, J.D. ORB-SLAM: A Versatile and Accurate Monocular SLAM System. IEEE Trans. Robot. 2015, 31, 1147–1163. [Google Scholar] [CrossRef] [Green Version]
  2. Forster, C.; Pizzoli, M.; Scaramuzza, D. SVO: Fast semi-direct monocular visual odometry. In Proceedings of the 2014 IEEE International Conference on Robotics and Automation (ICRA), Hong Kong, China, 31 May–7 June 2014; pp. 15–22. [Google Scholar]
  3. Cadena, C.; Carlone, L.; Carrillo, H.; Latif, Y.; Scaramuzza, D.; Neira, J.; Reid, I.; Leonard, J.J. Past, present, and future of simultaneous localization and mapping: Toward the robust-perception age. IEEE Trans. Robot. 2016, 32, 1309–1332. [Google Scholar] [CrossRef]
  4. Bourmaud, G.; Megret, R. Robust large scale monocular visual SLAM. In Proceedings of the IEEE Conference on Computer Vision and Pattern Recognition, Boston, MA, USA, 7–12 June 2015; pp. 1638–1647. [Google Scholar]
  5. Lin, X.; Chen, W.; He, L.; Guan, Y.; Liu, G. Improving robustness of monocular VT&R system with multiple hypothesis. In Proceedings of the IEEE International Conference on Robotics and Biomimetics, Macau, China, 5–8 December 2018; pp. 355–360. [Google Scholar]
  6. AbuKhalil, T.; Sobh, T.; Patil, M. Survey on decentralized modular robots and control platforms. In Innovations and Advances in Computing, Informatics, Systems Sciences, Networking and Engineering; Springer: Berlin/Heidelberg, Germany, 2015; pp. 165–175. [Google Scholar]
  7. Ding, K.; Morozov, A.; Janschek, K. Classification of Hierarchical Fault-Tolerant Design Patterns. In Proceedings of the 15th International Conference on Pervasive Intelligence & Computing, 3rd International Conference on Big Data Intelligence and Computing and Cyber Science and Technology Congress (DASC/PiCom/DataCom/CyberSciTech), 2017 IEEE 15th International Conference on Dependable, Autonomic and Secure Computing, Orlando, FL, USA, 6–10 November 2017; pp. 612–619. [Google Scholar]
  8. Lussier, B.; Lampe, A.; Chatila, R.; Guiochet, J.; Ingrand, F.; Killijian, M.O.; Powell, D. Fault tolerance in autonomous systems: How and how much? In Proceedings of the 4th IARP-IEEE/RAS-EURON Joint Workshop on Technical Challenges for Dependable Robots in Human Environments (DRHE), Nagoya, Japan, 16–18 June 2005. [Google Scholar]
  9. Lauri, M.; Ritala, R. Planning for robotic exploration based on forward simulation. Robot. Auton. Syst. 2016, 83, 15–31. [Google Scholar] [CrossRef] [Green Version]
  10. Arrospide, J.; Salgado, L.; Nieto, M.; Mohedano, R. Homography-based ground plane detection using a single on-board camera. IET Intell. Transp. Syst. 2010, 4, 149–160. [Google Scholar] [CrossRef]
  11. Pears, N.; Liang, B. Ground plane segmentation for mobile robot visual navigation. In Proceedings of the IEEE/RSJ International Conference on Intelligent Robots and Systems, Maui, HI, USA, 29 October–3 November 2001; Volume 3, pp. 1513–1518. [Google Scholar]
  12. Long, J.; Shelhamer, E.; Darrell, T. Fully convolutional networks for semantic segmentation. In Proceedings of the IEEE Conference on Computer Vision and Pattern Recognition, Boston, MA, USA, 7–12 June 2015; pp. 3431–3440. [Google Scholar]
  13. Krizhevsky, A.; Sutskever, I.; Hinton, G.E. ImageNet classification with deep convolutional neural networks. In Proceedings of the International Conference on Neural Information Processing Systems, Lake Tahoe, NV, USA, 3–6 December 2012; pp. 1097–1105. [Google Scholar]
  14. Fang, Y.; Dixon, W.E.; Dawson, D.M.; Chawda, P. Homography-based visual servo regulation of mobile robots. IEEE Trans. Syst. Man Cybern. Part B Cybern. A Publ. IEEE Syst. Man Cybern. Soc. 2005, 35, 1041–1050. [Google Scholar] [CrossRef]
  15. Sotelo, M.A.; Rodriguez, F.J.; Magdalena, L.; Bergasa, L.M.; Boquete, L. A Color Vision-Based Lane Tracking System for Autonomous Driving on Unmarked Roads. Auton. Robot. 2004, 16, 95–116. [Google Scholar] [CrossRef]
  16. Sidhwani, S.; Malkotiya, M.; Korde, N.; Unde, S.B.; Salunke, M. Autonomous Driving: Using a Vision based Approach. Int. J. Comput. Appl. 2014, 92, 20–24. [Google Scholar] [CrossRef]
  17. Heng, L.; Gotovos, A.; Krause, A.; Pollefeys, M. Efficient visual exploration and coverage with a micro aerial vehicle in unknown environments. In Proceedings of the 2015 IEEE International Conference on Robotics and Automation (ICRA), Seattle, WA, USA, 26–30 May 2015; pp. 1071–1078. [Google Scholar]
  18. Carrillo, H.; Dames, P.; Kumar, V.; Castellanos, J.A. Autonomous robotic exploration using occupancy grid maps and graph SLAM based on Shannon and Renyi Entropy. In Proceedings of the IEEE International Conference on Robotics and Automation, Seattle, WA, USA, 26–30 May 2015; pp. 487–494. [Google Scholar]
  19. Mu, B.; Giamou, M.; Paull, L.; Agha-Mohammadi, A.A.; Leonard, J.; How, J. Information-based Active SLAM via topological feature graphs. In Proceedings of the 2016 IEEE 55th Conference on Decision and Control (CDC), Las Vegas, NV, USA, 12–14 December 2016; pp. 5583–5590. [Google Scholar]
  20. Forster, C.; Pizzoli, M.; Scaramuzza, D. Appearance-based Active, Monocular, Dense Reconstruction for Micro Aerial Vehicles. In Proceedings of the Robotics: Science and Systems, Berkely, CA, USA, 12–16 July 2014. [Google Scholar]
  21. Seitz, S.M.; Curless, B.; Diebel, J.; Scharstein, D.; Szeliski, R. A Comparison and Evaluation of Multi-View Stereo Reconstruction Algorithms. In Proceedings of the 2006 IEEE Computer Society Conference on Computer Vision and Pattern Recognition, New York, NY, USA, 17–22 June 2006; pp. 519–528. [Google Scholar]
  22. Chaves, S.M.; Kim, A.; Eustice, R.M. Opportunistic sampling-based planning for active visual SLAM. In Proceedings of the IEEE/RSJ International Conference on Intelligent Robots and Systems, Chicago, IL, USA, 14–18 September 2014; pp. 3073–3080. [Google Scholar]
  23. Chen, W.; Zhu, L.; Guan, Y.; Kube, C.R.; Zhang, H. Submap-based Pose-graph Visual SLAM: A Robust Visual Exploration and Localization System. In Proceedings of the 2018 IEEE/RSJ International Conference on Intelligent Robots and Systems (IROS), Madrid, Spain, 1–5 October 2018. [Google Scholar]
  24. Galceran, E.; Carreras, M. A survey on coverage path planning for robotics. Robot. Auton. Syst. 2013, 61, 1258–1276. [Google Scholar] [CrossRef] [Green Version]
Figure 1. Structure of our visual exploration system, three modules are contained: visual localization and mapping (VLM), active controller and termination condition.
Applsci 09 00662 g001
Figure 2. Illustration of the set-up of the camera; it is fixed on the mobile robot platform in the heading direction.
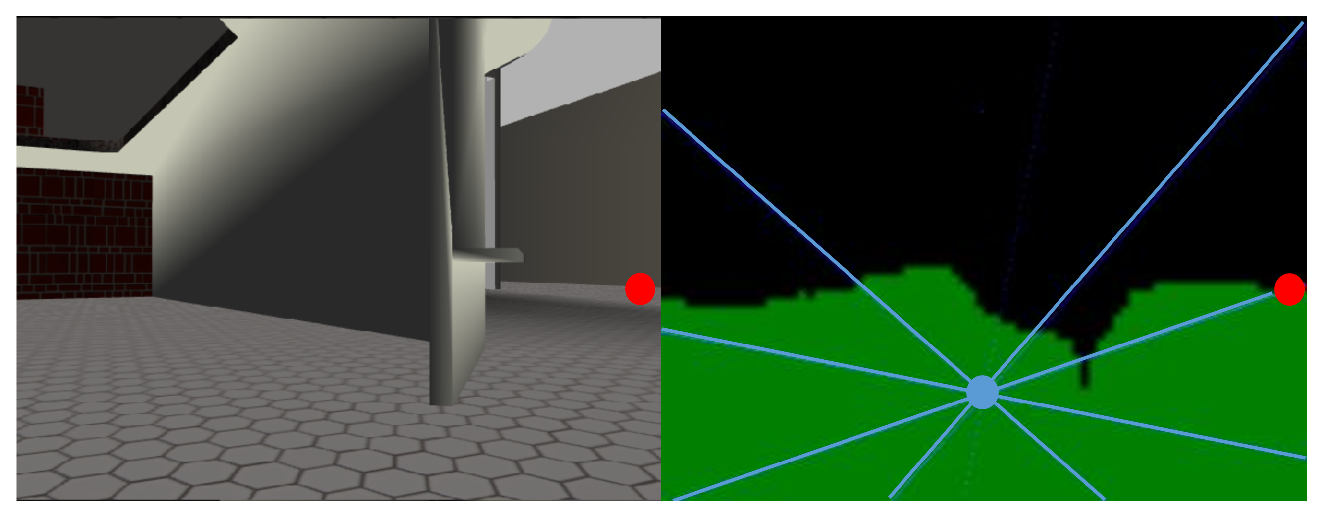
Applsci 09 00662 g002
Figure 3. Example of segmentation result, where a cylinder-style obstacle is detected and segmented from the ground. The segmented ground is shown as the green region at the bottom in the right image.
Applsci 09 00662 g003
Figure 4. Example of goal point planning, the red point is the goal point and is projected to the raw image in the left figure.
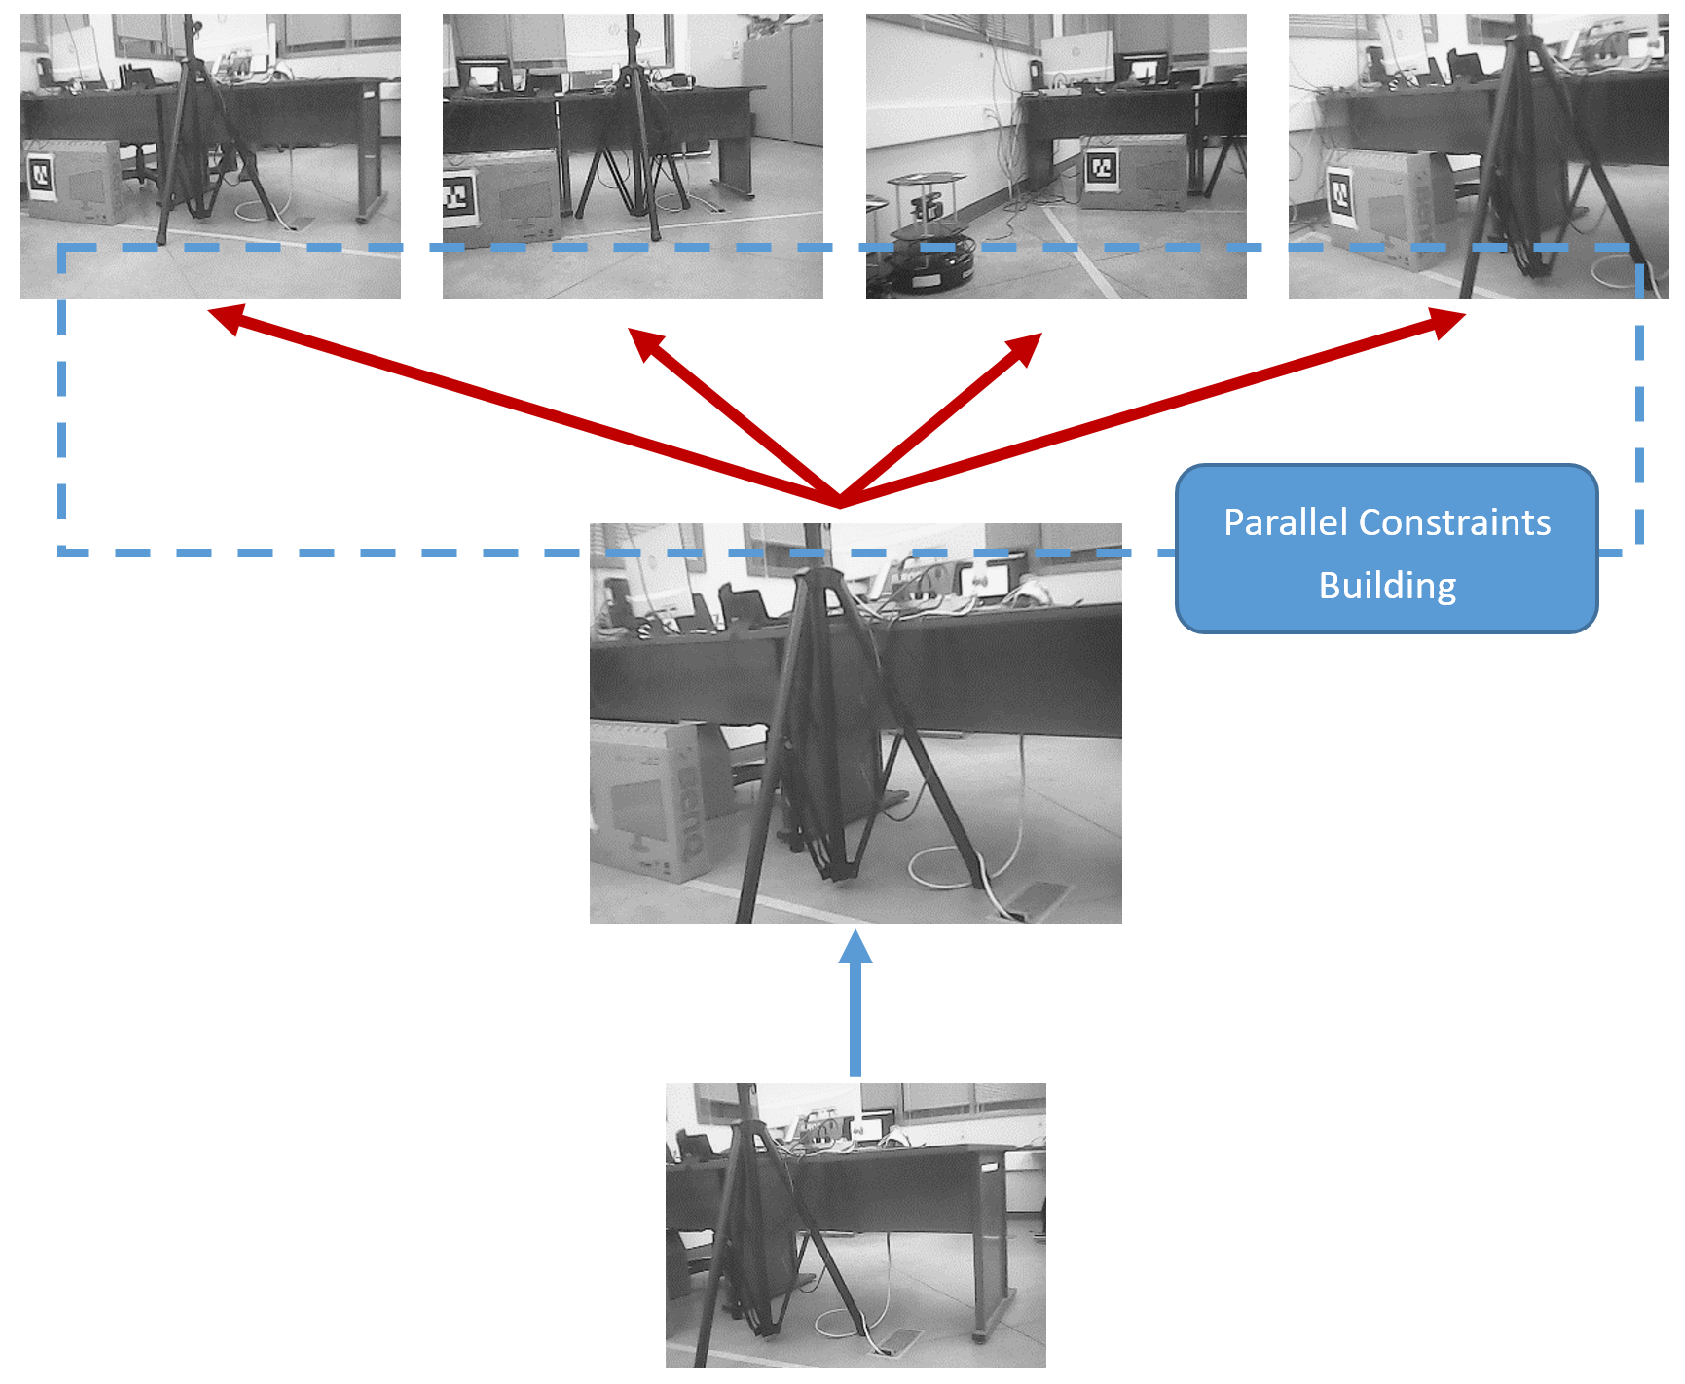
Applsci 09 00662 g004
Figure 5. Illustration of parallel design of new keyframe (middle image); besides a constraint from the last keyframe (blue arrow), multiple loop-closure constraints to existing reference frames (red arrows) are built in parallel.
Applsci 09 00662 g005
Figure 6. Illustration of submap-based back-end, three submaps are shown in the figure (red, green and blue), and they are connected by constraints (arrows) between/within submaps, where the yellow points are the switchable factors for robustness loop-closure detection.
Applsci 09 00662 g006
Figure 7. Organization of proposed termination condition, where the input is a built graph (including vertexes and edges), both density-based evaluation and distribution-based evaluation are contained in a coarse-to-fine mechanism.
Applsci 09 00662 g007
Figure 8. Example of grid map in the distribution-based evaluation. Arrows in the left figure are the pose of collected keyframes and the value of grid in the right figure is determined by the exploration score.
Applsci 09 00662 g008
Figure 9. Trajectory of obstacle avoidance in simulation. The blue line with arrow is the trajectory, and the colored points in the trajectory are the places where the avoidances of correspondent colored obstacles happen.
Applsci 09 00662 g009
Figure 10. The results of covering in simulation. The trajectory of the robot is represented by a set of red arrows. The green point is the start point of exploration and the blue one is the end point.
Applsci 09 00662 g010
Figure 11. Real world experiment in the sunny morning. The array is the robot trajectory, where the red dotted line in the upper figure is the place where obstacle avoidance happens.
Applsci 09 00662 g011
Figure 12. Environment of the experiment on rainy nights, for evaluation of illumination invariance.
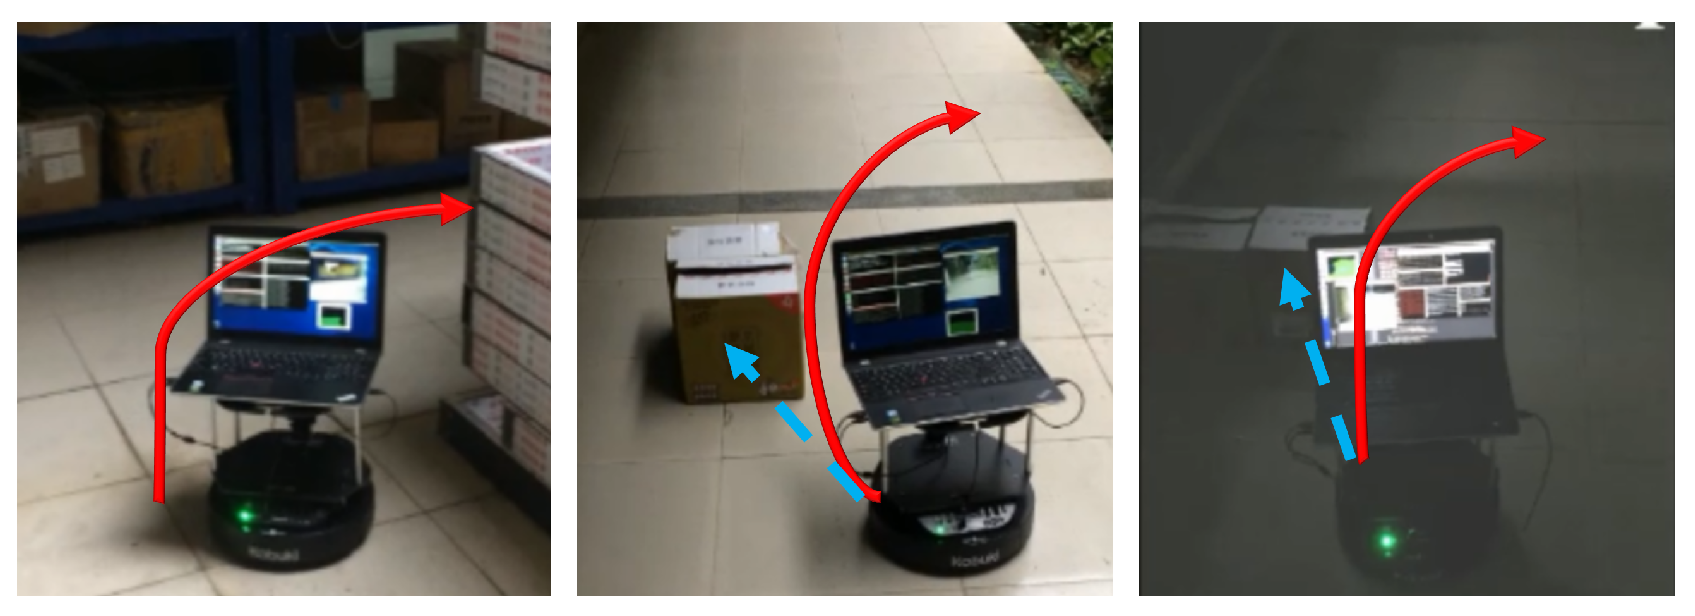
Applsci 09 00662 g012
Figure 13. Left figure, turning at the corner; mid figure, obstacle avoidance in morning; Right figure, obstacle avoidance at night. The blue dotted array is the motion before avoidance, and the red array is the motion during obstacle avoidance.
Applsci 09 00662 g013
Figure 14. Curve of localization error of submap-based back-end, which shows the ability of fault recovery after tracking is lost and verifies the ability of fault recovery by maintaining tracking. The deep blue curve is the error, the light blue curve is the response of tracking failure and the red curve is the response of loop-closure detection.
Applsci 09 00662 g014
Figure 15. Localization performance with/without completeness evaluation.
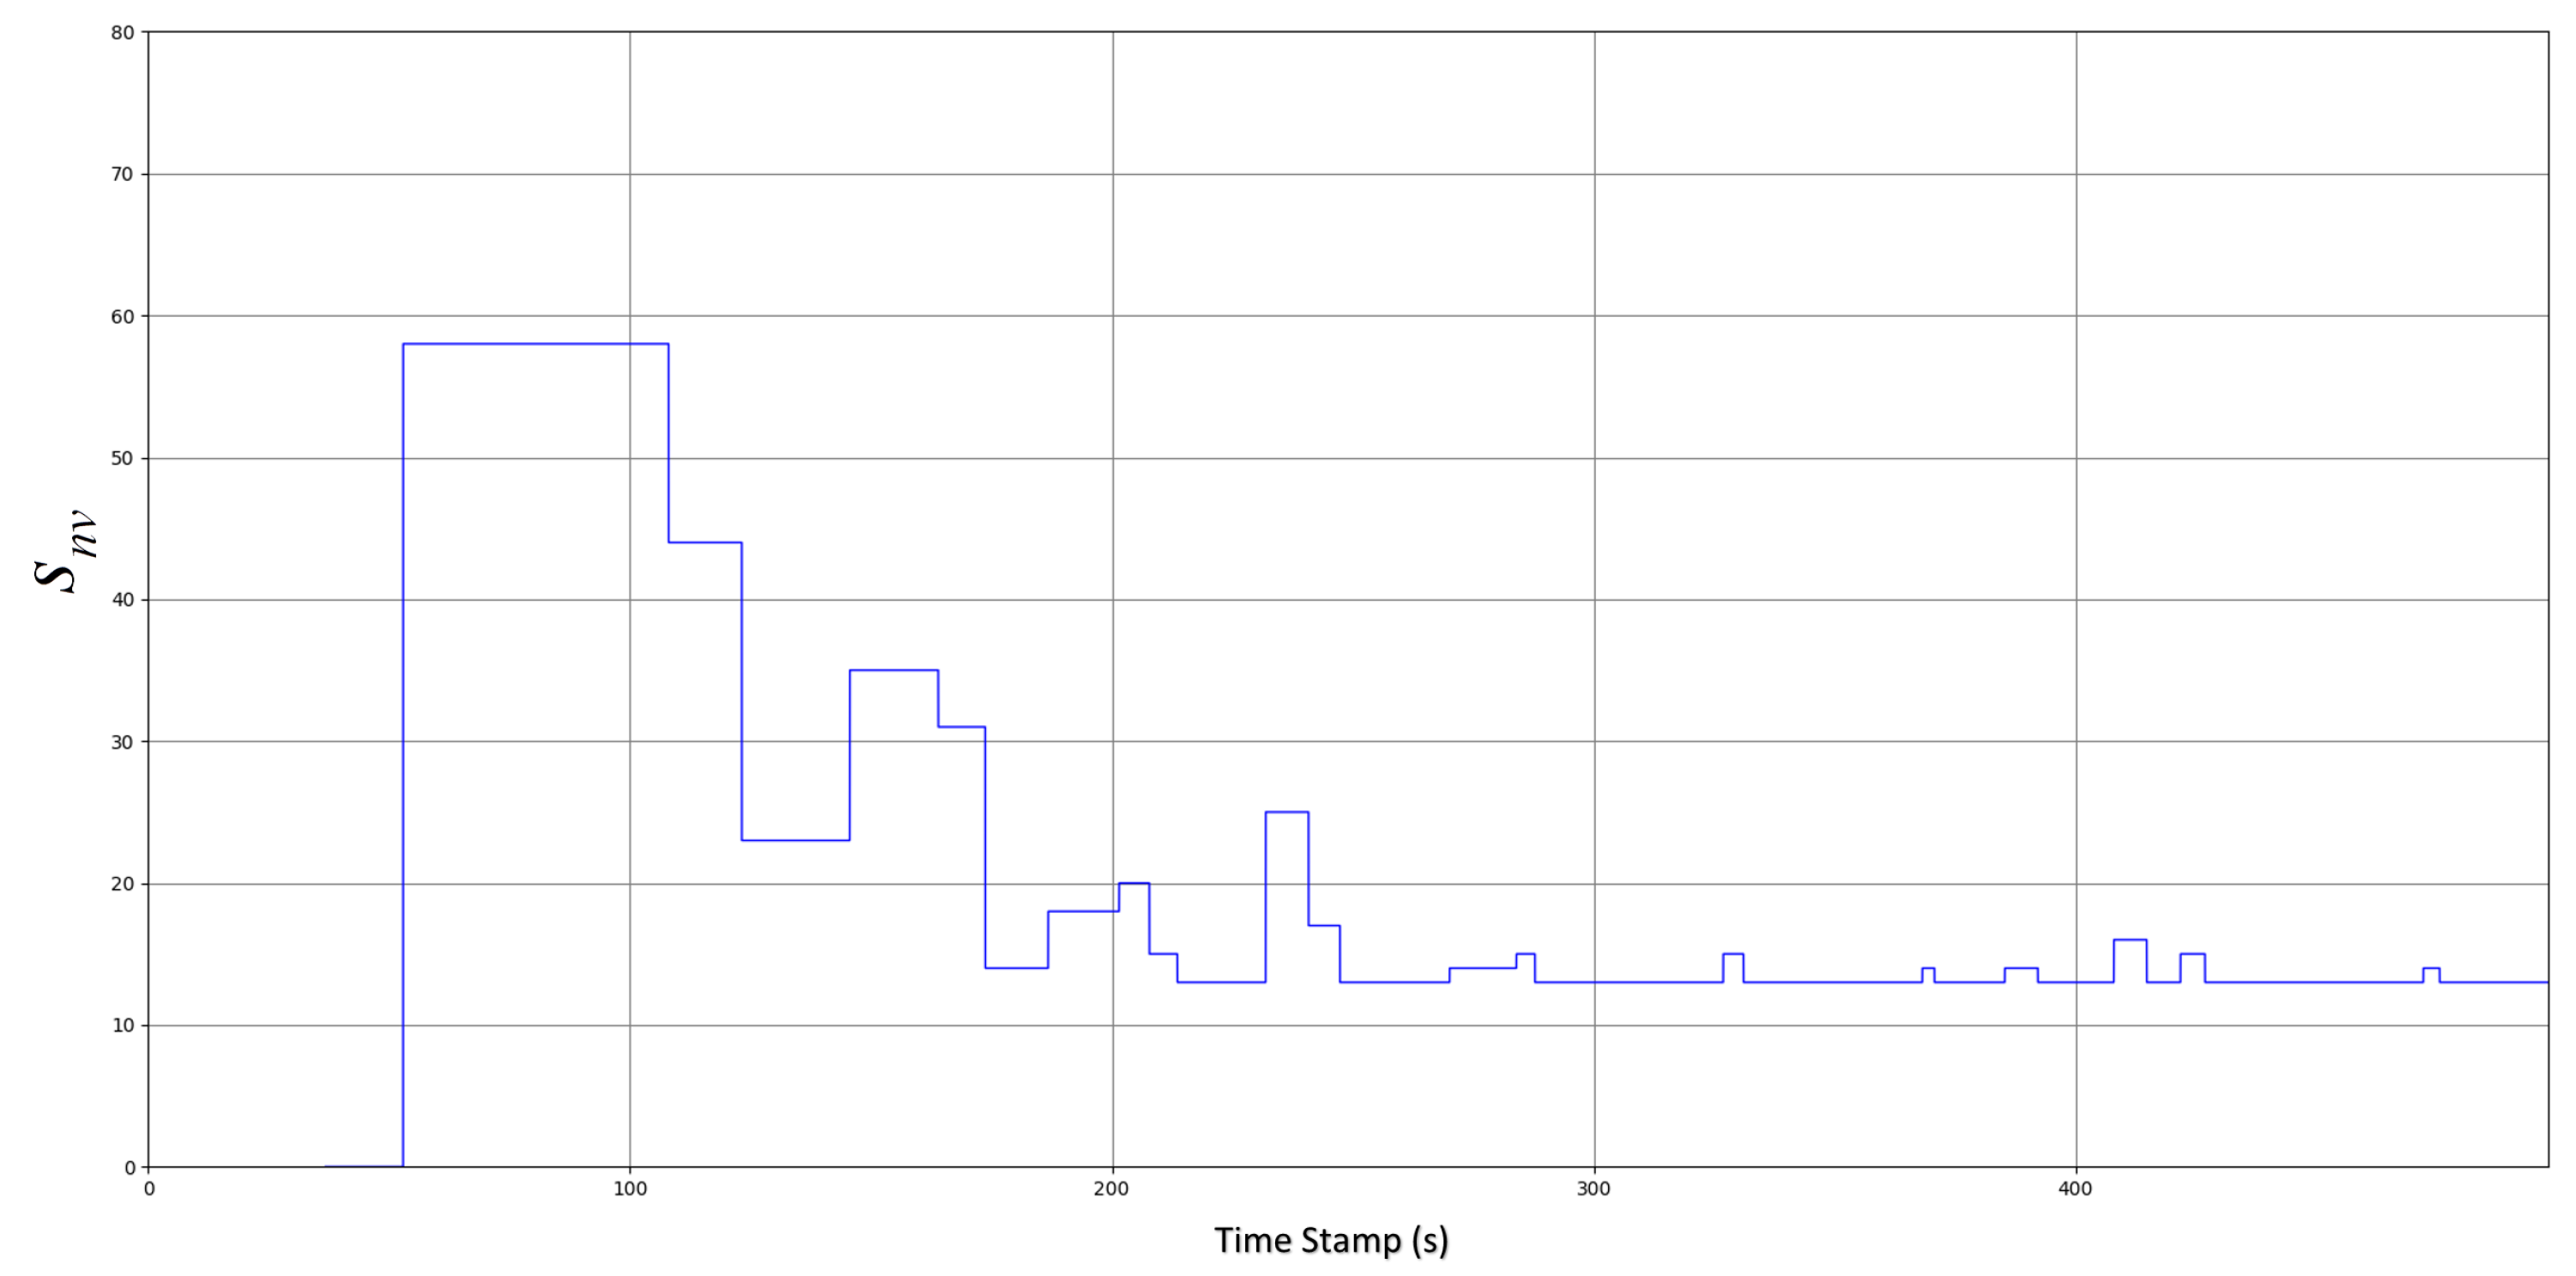
Applsci 09 00662 g015
Figure 16. Convergence of termination condition in density-based evaluation is verified, and the density-based evaluation can be satisfied after a certain time of exploration.
Applsci 09 00662 g016
Figure 17. Completeness evaluation in distribution-based evaluation.
Applsci 09 00662 g017
Table 1. Achievement of fault tolerance in all the modules within our proposed system, where VLM is the visual localization and mapping module, A-C is the Active Controller and T-C is the Termination Condition.
Fault ToleranceModuleSolution
Fault RecoveryVLMSubmap-based back-end, maintaining mapping within one of the submaps
Fault RecoveryA-CAll-time driving of mobile robot, keeping image capturing
Fault PreventionVLMParallel constraint building, higher frame rate for easier data association
Fault PreventionT-CCompleteness evaluation, rich environment information for localization
Table 2. Parametric distribution with interval sampling, where the ideal one is regarded as an evaluation standard for completeness calculation. A series of parametric results are shown with different sampling intervals, and they are applied in our implementation.
DistributionMeanStandard Deviation
Interval
Ideal01.813
1 degree01.821
10 degree01.889
20 degree01.964
30 degree02.039
Table 3. Continuous tracking performance, our submap-based system is able to map with a much higher A-KF than ORB-SLAM, since a fault recovery design is involved in VLM.
MethodA-KFsSD-KFs
UA-CSC1ORB13.882.37
VLM1069.2023.60
UA-CSC2ORB33.543.04
VLM836.8020.80
Table 4. Frame rate comparison of parallel multi-constraint front-end, where a higher frame rate is obtained by our parallel framework. Such a higher frame rate is beneficial to data association due to a shorter baseline.
Non-ParallelP-F&BP-MC+P-F&B
Framerate12.5724.6632.60
RMSE0.4070.4110.407

