Hepatic Steatosis Assessment Using Quantitative Ultrasound Parametric Imaging Based on Backscatter Envelope Statistics


Abstract
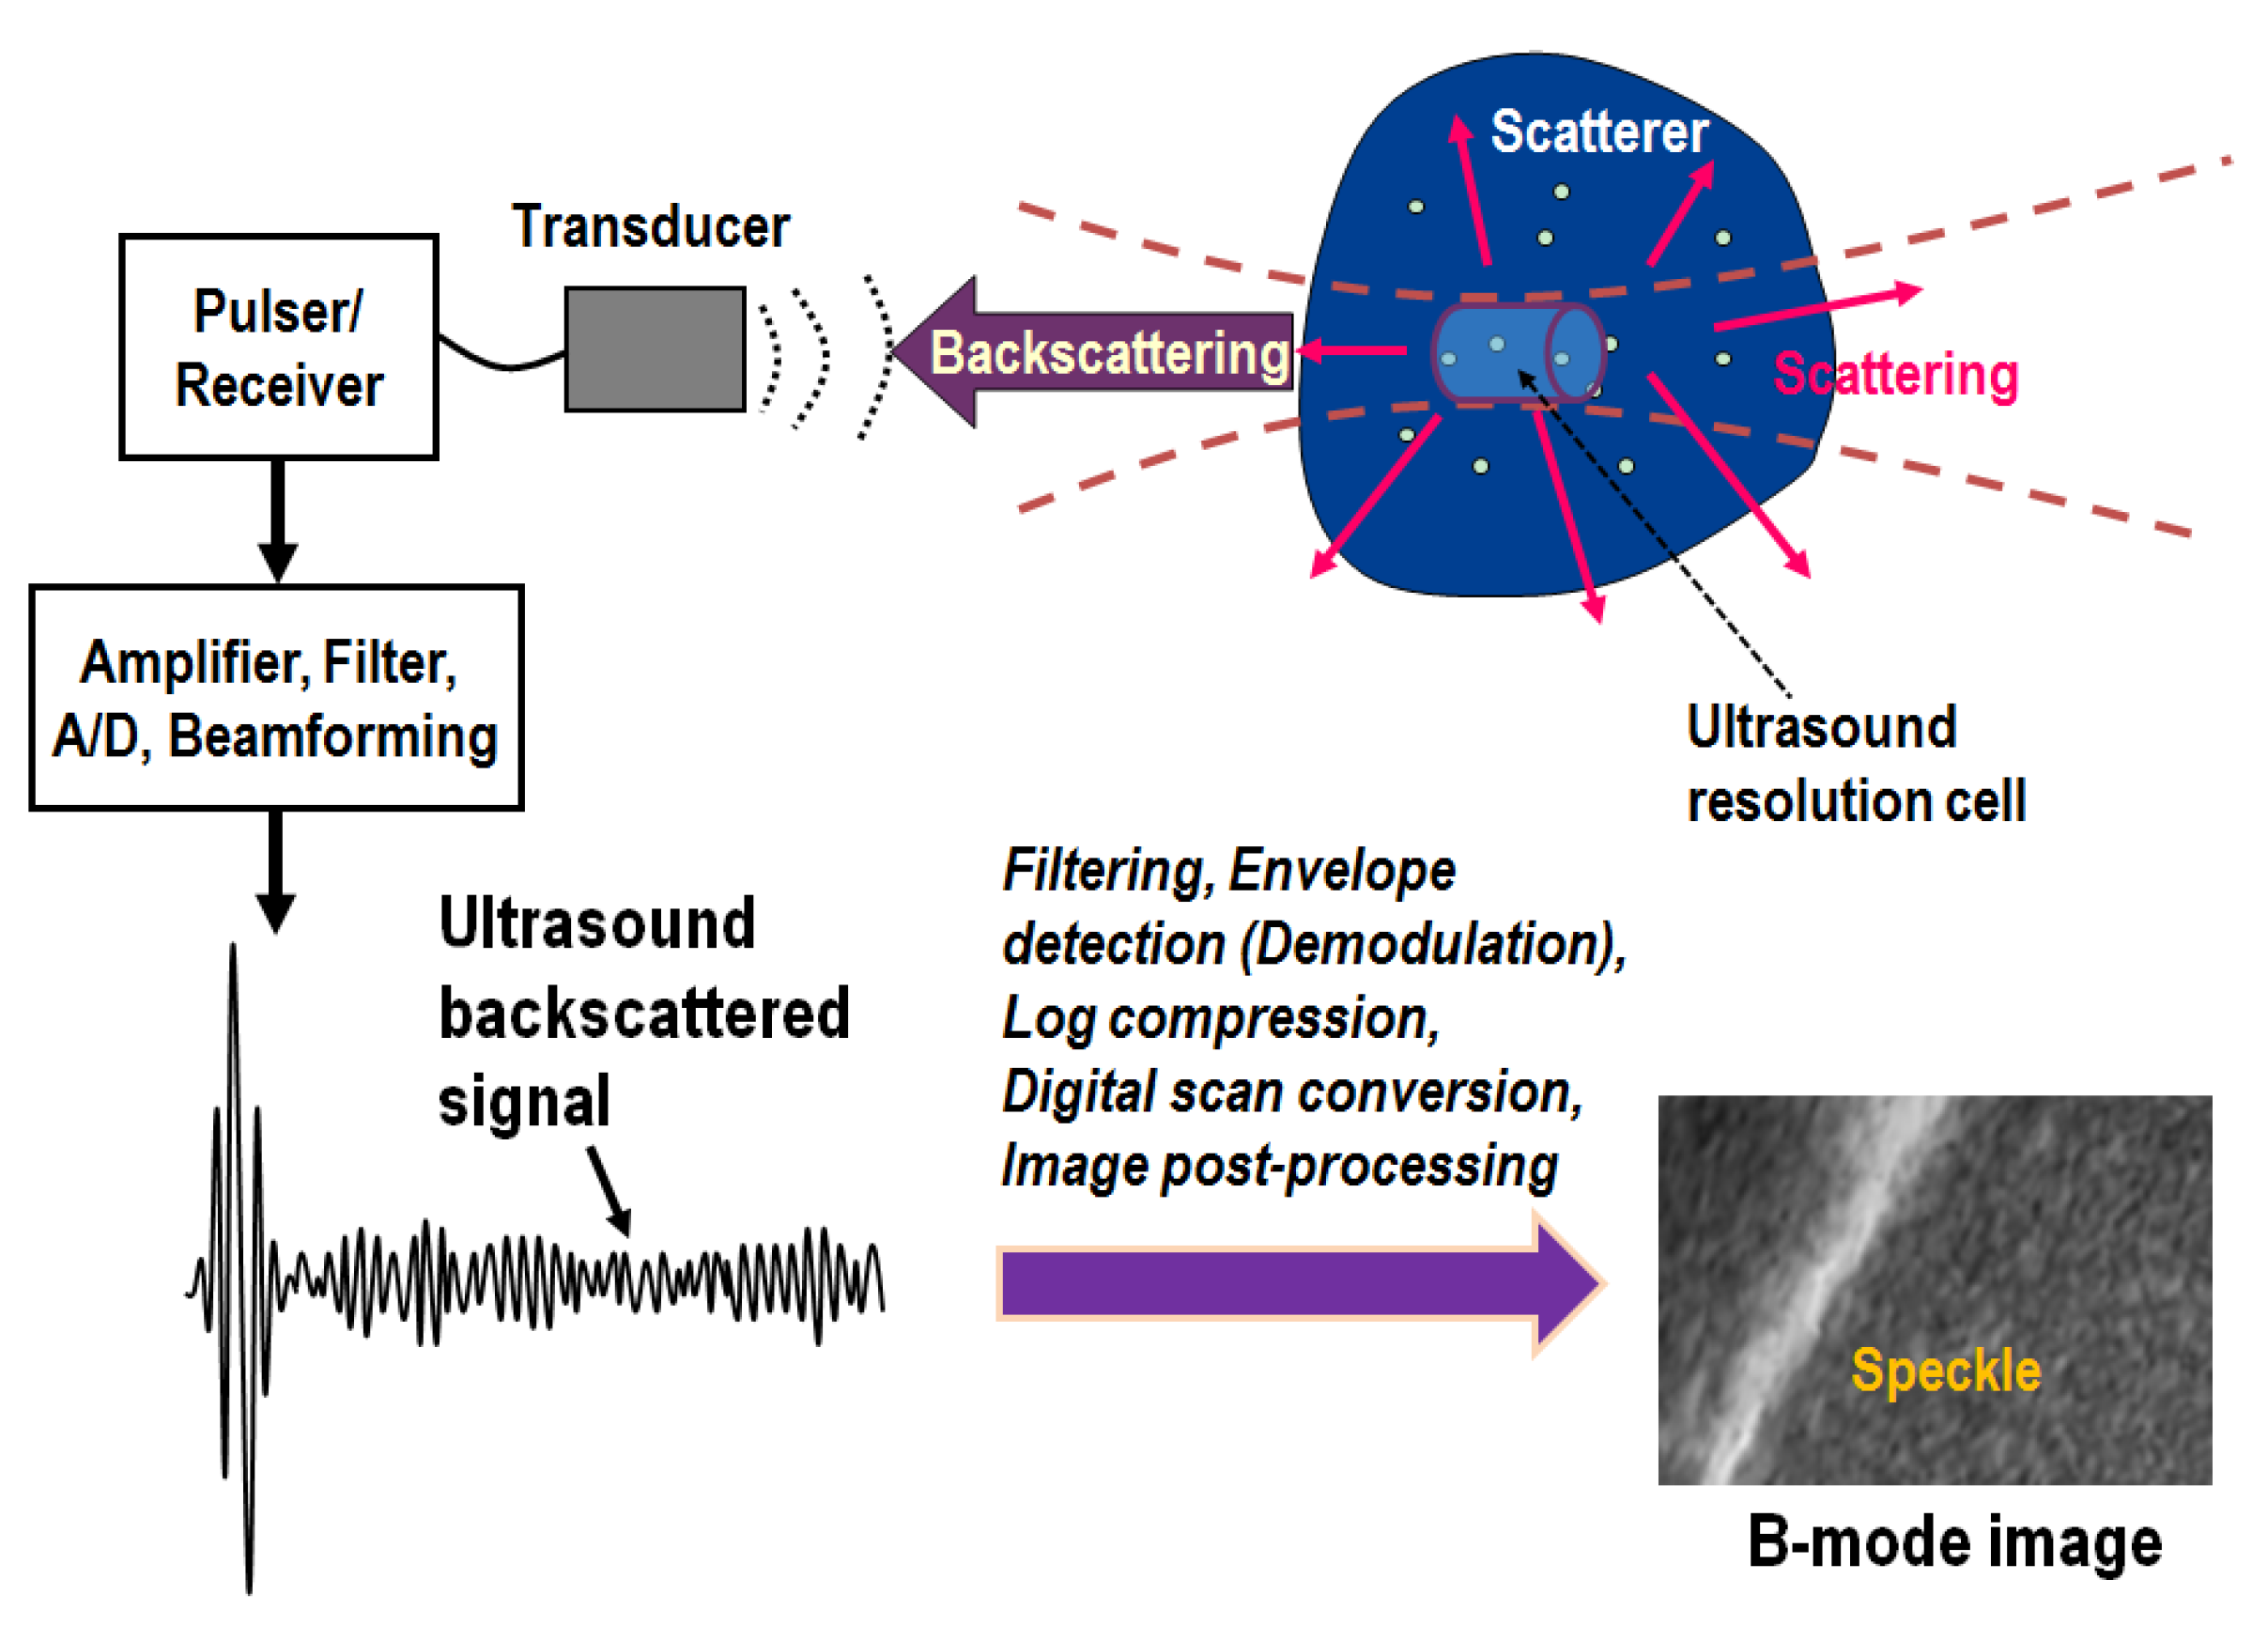
1. Introduction
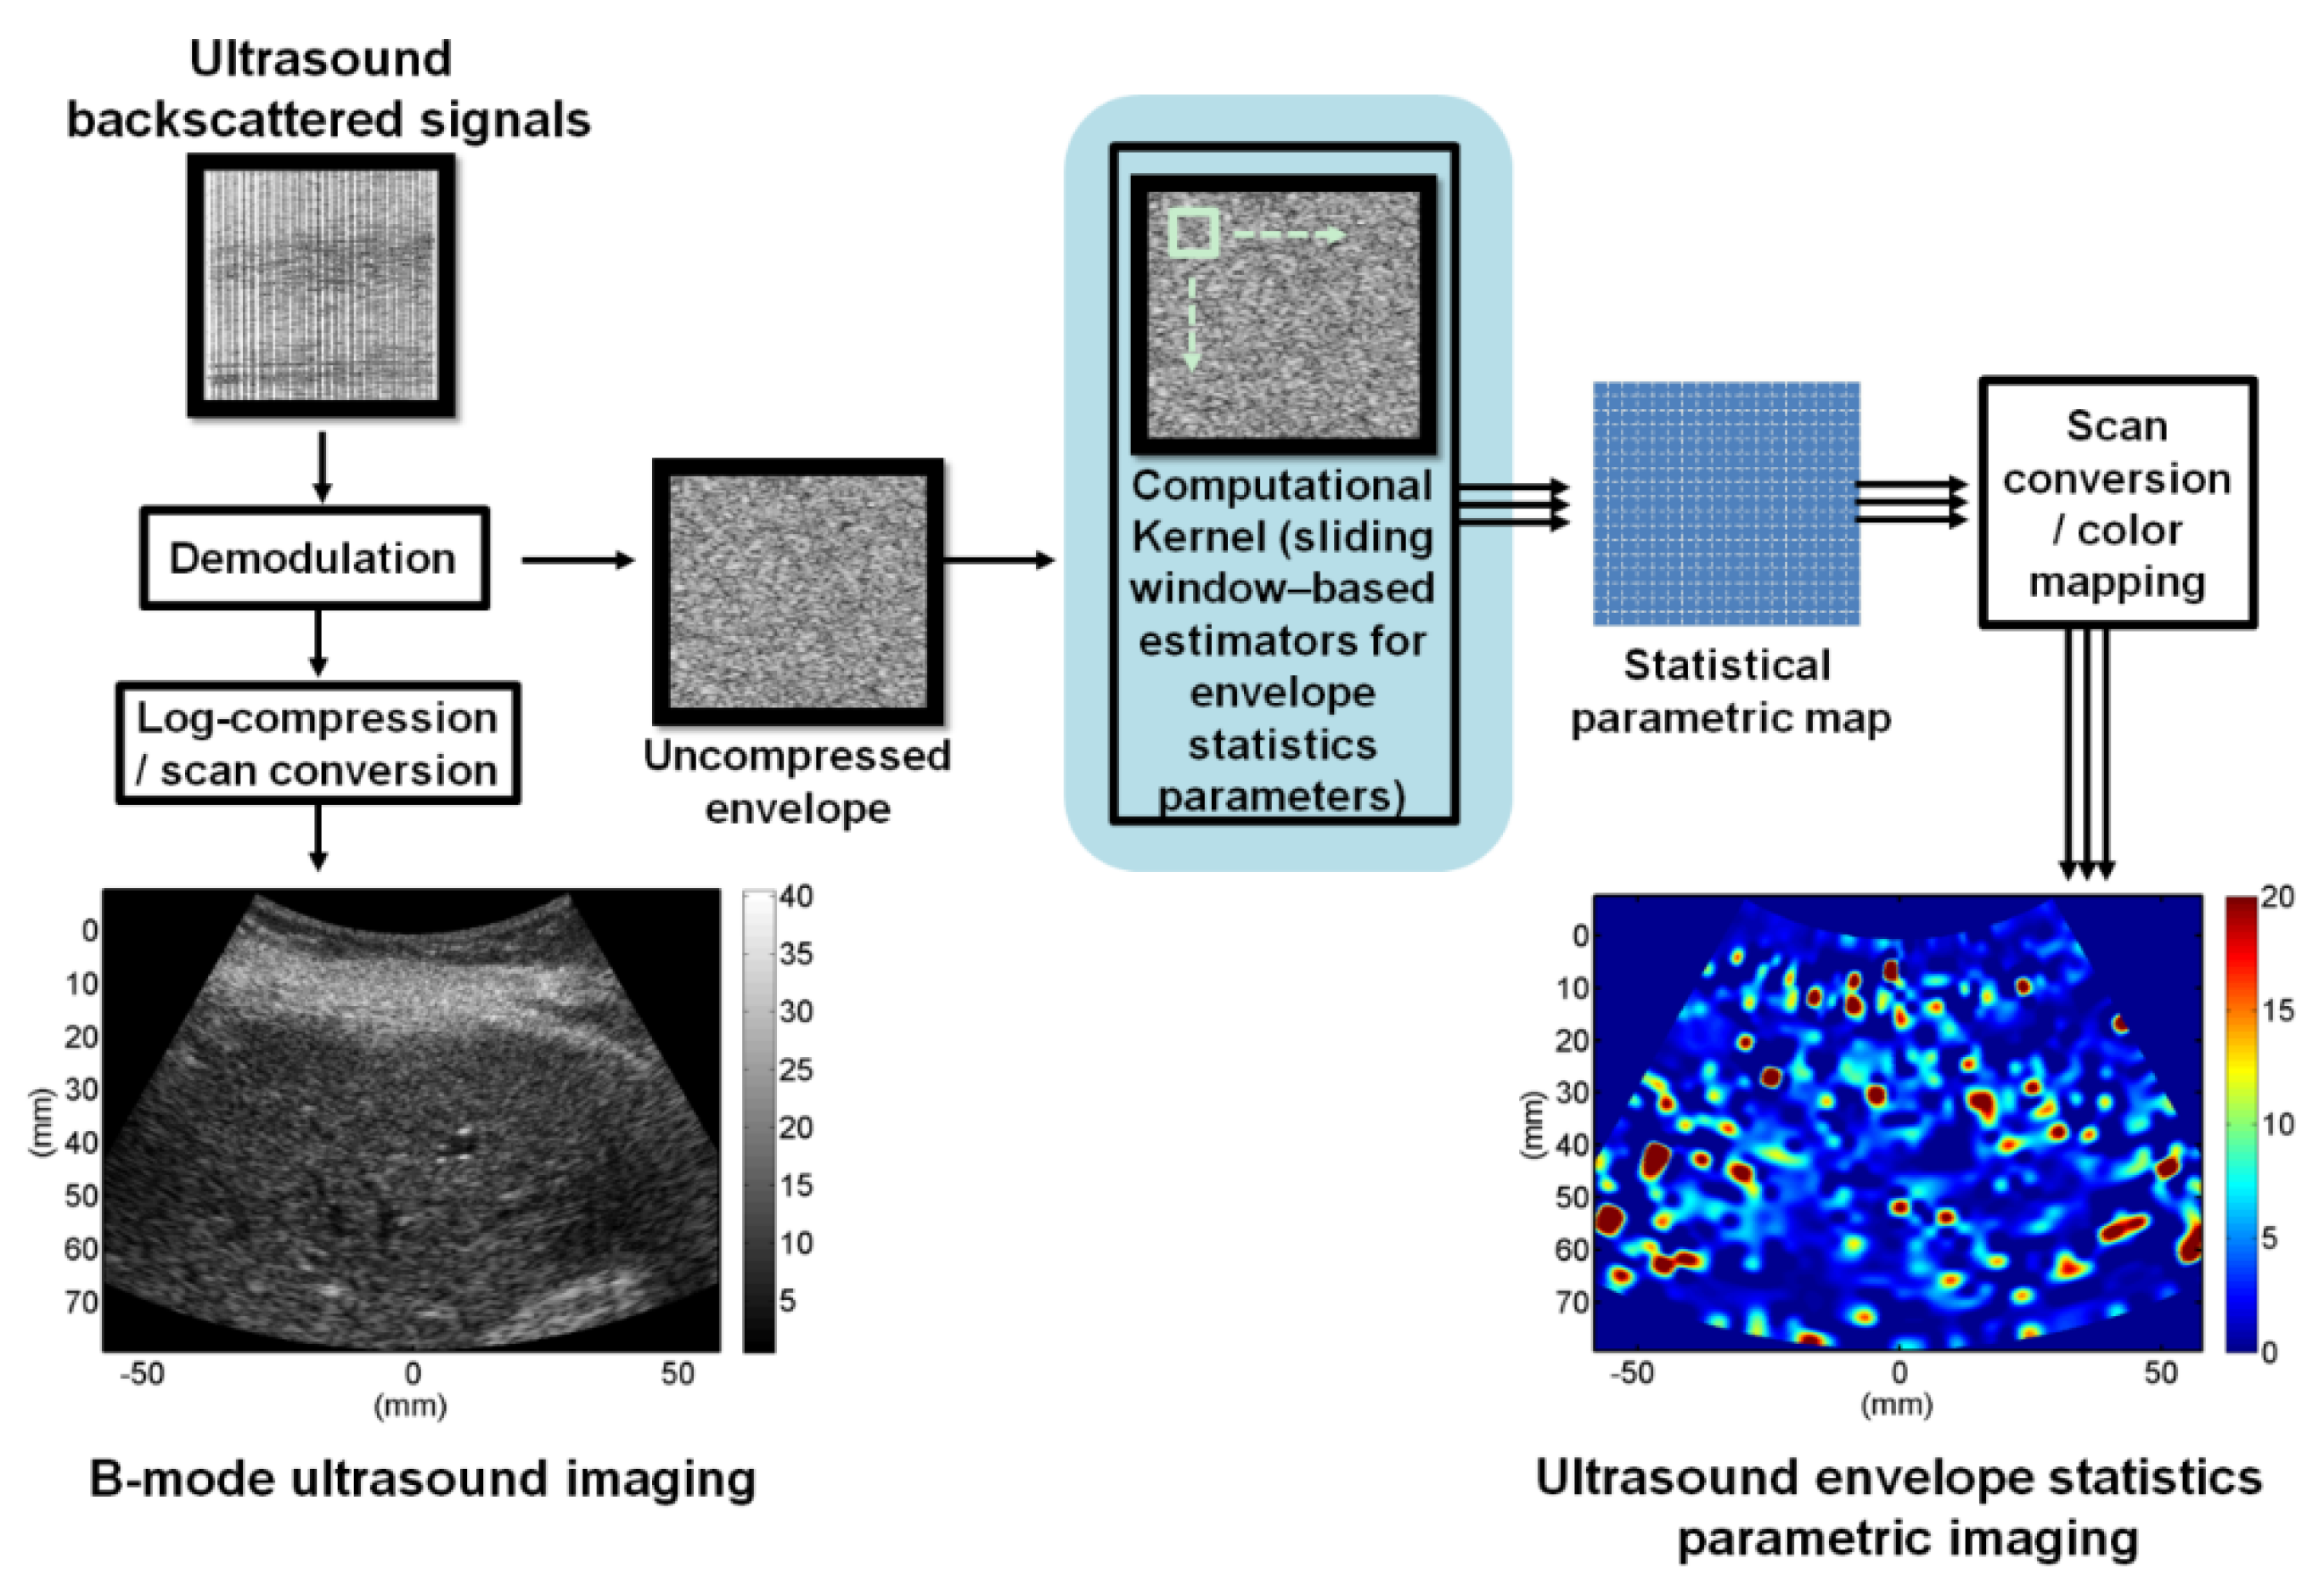
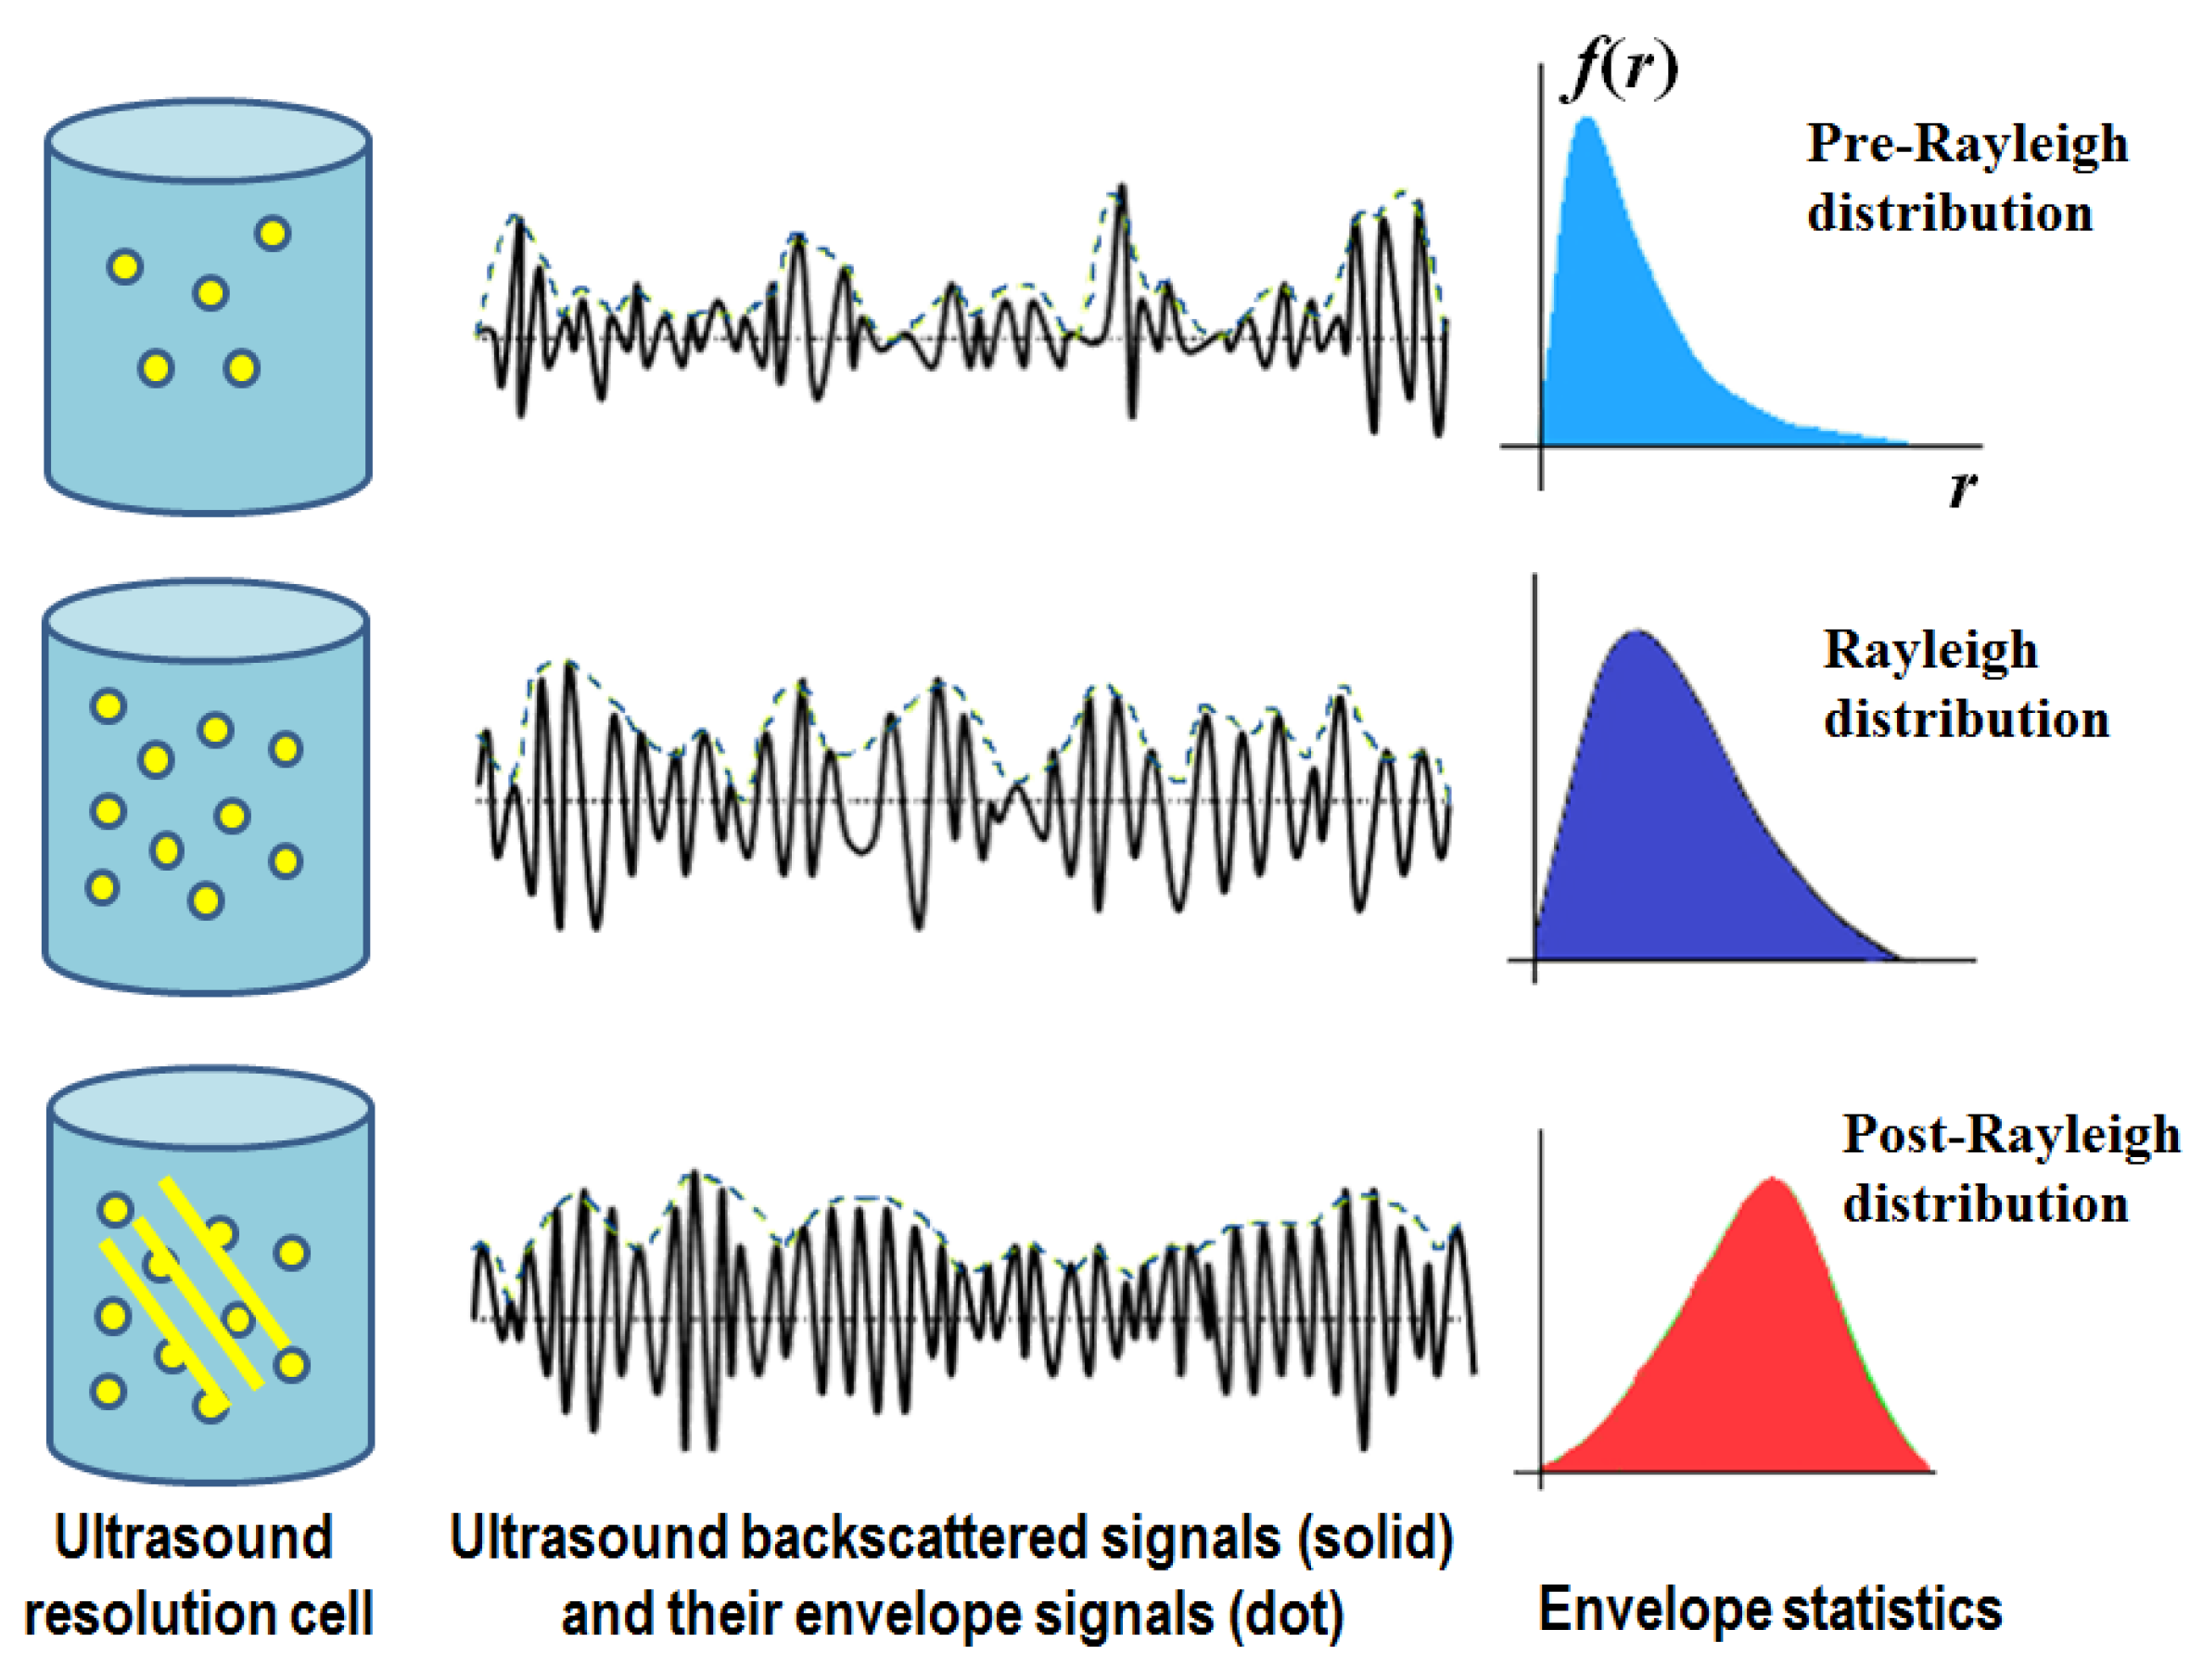
2. Ultrasound Envelope Statistics Parametric Imaging
3. Statistical Model-Based Ultrasound Envelope Statistics Parametric Imaging Techniques
3.1. Acoustic Structure Quantification Imaging
3.2. Ultrasound Nakagami Imaging
3.3. Ultatrasound Homodyned-K Imaging
4. Non-Model-Based Ultrasound Envelope Statistics Parametric Imaging Techniques
4.1. Ultrasound Kurtosis Imaging
4.2. Ultrasound Entropy Imaging
5. Discussion
Author Contributions
Funding
Conflicts of Interest
References
- Bellentani, S. The epidemiology of non-alcoholic fatty liver disease. Liver Int. 2017, 37, 81–84. [Google Scholar] [CrossRef] [PubMed]
- Zhang, Y.N.; Fowler, K.J.; Hamilton, G.; Cui, J.Y.; Sy, E.Z.; Balanay, M.; Hooker, J.C.; Szeverenyi, N.; Sirlin, C.B. Liver fat imaging-a clinical overview of ultrasound, CT, and MR imaging. Br. J. Radiol. 2018, 91, 20170959. [Google Scholar] [CrossRef] [PubMed]
- Kramer, H.; Pickhardt, P.J.; Kliewer, M.A.; Hernando, D.; Chen, G.H.; Zagzebski, J.A.; Reeder, S.B. Accuracy of liver fat quantification with advanced CT, MRI, and ultrasound techniques: Prospective comparison with MR spectroscopy. AJR Am. J. Roentgenol. 2017, 208, 92–100. [Google Scholar] [CrossRef] [PubMed]
- Huang, Q.; Wu, B.; Lan, J.; Li, X. Fully automatic three-dimensional ultrasound imaging based on conventional B-scan. IEEE Trans. Biomed. Circuits Syst. 2018, 12, 426–436. [Google Scholar] [CrossRef] [PubMed]
- Huang, Q.; Zeng, Z.; Li, X. 2.5-D extended field-of-view ultrasound. IEEE Trans. Med. Imaging 2018, 37, 851–859. [Google Scholar] [CrossRef] [PubMed]
- Huang, Q.; Lan, J.; Li, X. Robotic arm based automatic ultrasound scanning for three-dimensional imaging. IEEE Trans. Industr. Inform. 2019, 15, 1173–1182. [Google Scholar] [CrossRef]
- European Association for the Study of the Liver; European Association for the Study of Diabetes; European Association for the Study of Obesity. EASL-EASD-EASO Clinical Practice Guidelines for the management of non-alcoholic fatty liver disease. J. Hepatol. 2016, 64, 1388–1402. [Google Scholar] [CrossRef] [PubMed]
- Biswas, M.; Kuppili, V.; Edla, D.R.; Suri, H.S.; Saba, L.; Marinhoe, R.T.; Sanches, J.M.; Suri, J.S. Symtosis: A liver ultrasound tissue characterization and risk stratification in optimized deep learning paradigm. Comput. Methods Programs Biomed. 2018, 155, 165–177. [Google Scholar] [CrossRef]
- Byra, M.; Styczynski, G.; Szmigielski, C.; Kalinowski, P.; Michalowski, L.; Paluszkiewicz, R.; Ziarkiewicz-Wroblewska, B.; Zieniewicz, K.; Sobieraj, P.; Nowicki, A. Transfer learning with deep convolutional neural network for liver steatosis assessment in ultrasound images. Int. J. Comput. Assist. Radiol. Surg. 2018, 13, 1895–1903. [Google Scholar] [CrossRef]
- Mamou, J.; Oelze, M.L. Quantitative Ultrasound in Soft Tissues; Springer: Heidelberg, Germany, 2013; pp. 21–35. [Google Scholar]
- Dioguardi Burgio, M.; Imbault, M.; Ronot, M.; Faccinetto, A.; Van Beers, B.E.; Rautou, P.E.; Castera, L.; Gennisson, J.L.; Tanter, M.; Vilgrain, V. Ultrasonic adaptive sound speed estimation for the diagnosis and quantification of hepatic steatosis: A pilot study. Ultraschall Med. 2019, in press. [Google Scholar] [CrossRef]
- Zubajlo, R.E.; Benjamin, A.; Grajo, J.R.; Kaliannan, K.; Kang, J.X.; Bhan, A.K.; Thomenius, K.E.; Anthony, B.W.; Dhyani, M.; Samir, A.E. Experimental validation of longitudinal speed of sound estimates in the diagnosis of hepatic steatosis (part II). Ultrasound Med. Biol. 2018, 44, 2749–2758. [Google Scholar] [CrossRef] [PubMed]
- Fujiwara, Y.; Kuroda, H.; Abe, T.; Ishida, K.; Oguri, T.; Noguchi, S.; Sugai, T.; Kamiyama, N.; Takikawa, Y. The B-mode image-guided ultrasound attenuation parameter accurately detects hepatic steatosis in chronic liver disease. Ultrasound Med. Biol. 2018, 44, 2223–2232. [Google Scholar] [CrossRef] [PubMed]
- Han, A.; Andre, M.P.; Deiranieh, L.; Housman, E.; Erdman, J.W., Jr.; Loomba, R.; Sirlin, C.B.; O’Brien, W.D., Jr. Repeatability and reproducibility of the ultrasonic attenuation coefficient and backscatter coefficient measured in the right lobe of the liver in adults with known or suspected nonalcoholic fatty liver disease. J. Ultrasound Med. 2018, 37, 1913–1927. [Google Scholar] [CrossRef] [PubMed]
- Ozturk, A.; Grajo, J.R.; Gee, M.S.; Benjamin, A.; Zubajlo, R.E.; Thomenius, K.E.; Anthony, B.W.; Samir, A.E.; Dhyani, M. Quantitative hepatic fat quantification in non-alcoholic fatty liver disease using ultrasound-based techniques: A review of literature and their diagnostic performance. Ultrasound Med. Biol. 2018, 44, 2461–2475. [Google Scholar] [CrossRef] [PubMed]
- Zhou, Z.; Wu, W.; Wu, S.; Jia, K.; Tsui, P.H. A review of ultrasound tissue characterization with mean scatterer spacing. Ultrason. Imaging 2017, 39, 263–282. [Google Scholar] [CrossRef] [PubMed]
- Oelze, M.L.; Mamou, J. Review of quantitative ultrasound envelope statistics and backscatter coefficient imaging and contributions to diagnostic ultrasound. IEEE Trans. Ultrason. Ferroelectr. Freq. Control 2016, 63, 336–351. [Google Scholar] [CrossRef] [PubMed]
- Lee, D.H.; Lee, J.Y.; Lee, K.B.; Han, J.K. Evaluation of hepatic steatosis by using acoustic structure quantification US in a rat model: Comparison with pathologic examination and MR spectroscopy. Radiology 2017, 285, 445–453. [Google Scholar] [CrossRef]
- Zhou, Z.; Wu, S.; Lin, M.Y.; Fang, J.; Liu, H.L.; Tsui, P.H. Three-dimensional visualization of ultrasound backscatter statistics by window-modulated compounding Nakagami imaging. Ultrason. Imaging 2018, 40, 171–189. [Google Scholar] [CrossRef]
- Fang, J.; Zhou, Z.; Chang, N.F.; Wan, Y.L.; Tsui, P.H. Ultrasound parametric imaging of hepatic steatosis using the homodyned-K distribution: An animal study. Ultrasonics 2018, 87, 91–102. [Google Scholar] [CrossRef]
- Ma, H.Y.; Zhou, Z.; Wu, S.; Wan, Y.L.; Tsui, P.H. A computer-aided diagnosis scheme for detection of fatty liver in vivo based on ultrasound kurtosis imaging. J. Med. Syst. 2016, 40, 33. [Google Scholar] [CrossRef]
- Zhou, Z.; Tai, D.I.; Wan, Y.L.; Tseng, J.H.; Lin, Y.R.; Wu, S.; Yang, K.C.; Liao, Y.Y.; Yeh, C.K.; Tsui, P.H. Hepatic steatosis assessment with ultrasound small-window entropy imaging. Ultrasound Med. Biol. 2018, 44, 1327–1340. [Google Scholar] [CrossRef] [PubMed]
- Toyoda, H.; Kumada, T.; Kamiyama, N.; Shiraki, K.; Takase, K.; Yamaguchi, T.; Hachiya, H. B-mode ultrasound with algorithm based on statistical analysis of signals: Evaluation of liver fibrosis in patients with chronic hepatitis C. AJR Am. J. Roentgenol. 2009, 193, 1037–1043. [Google Scholar] [CrossRef] [PubMed]
- Kuroda, H.; Kakisaka, K.; Kamiyama, N.; Oikawa, T.; Onodera, M.; Sawara, K.; Oikawa, K.; Endo, R.; Takikawa, Y.; Suzuki, K. Non-invasive determination of hepatic steatosis by acoustic structure quantification from ultrasound echo amplitude. World J. Gastroenterol. 2012, 18, 3889–3895. [Google Scholar] [CrossRef] [PubMed]
- Shen, C.C.; Yu, S.C.; Liu, C.Y. Using high-frequency ultrasound statistical scattering model to assess nonalcoholic fatty liver disease (NAFLD) in mice. In Proceedings of the 39th International Conference on Telecommunications and Signal Processing (TSP), Vienna, Austria, 27–29 June 2016; pp. 379–382. [Google Scholar]
- Son, J.Y.; Lee, J.Y.; Yi, N.J.; Lee, K.W.; Suh, K.S.; Kim, K.G.; Lee, J.M.; Han, J.K.; Choi, B.I. Hepatic steatosis: Assessment with acoustic structure quantification of US imaging. Radiology 2016, 278, 257–264. [Google Scholar] [CrossRef] [PubMed]
- Karlas, T.; Berger, J.; Garnov, N.; Lindner, F.; Busse, H.; Linder, N.; Schaudinn, A.; Relke, B.; Chakaroun, R.; Troltzsch, M.; et al. Estimating steatosis and fibrosis: Comparison of acoustic structure quantification with established techniques. World J. Gastroenterol. 2015, 21, 4894–4902. [Google Scholar] [CrossRef] [PubMed]
- Kramer, C.; Jaspers, N.; Nierhoff, D.; Kuhr, K.; Bowe, A.; Goeser, T.; Michels, G. Acoustic structure quantification ultrasound software proves imprecise in assessing liver fibrosis or cirrhosis in parenchymal liver diseases. Ultrasound Med. Biol. 2014, 40, 2811–2818. [Google Scholar] [CrossRef] [PubMed]
- Shankar, P.M. A general statistical model for ultrasonic backscattering from tissues. IEEE Trans. Ultrason. Ferroelectr. Freq. Control 2000, 47, 727–736. [Google Scholar] [CrossRef]
- Tsui, P.H.; Wan, Y.L.; Tai, D.I.; Shu, Y.C. Effects of estimators on ultrasound Nakagami imaging in visualizing the change in the backscattered statistics from a Rayleigh distribution to a Pre-Rayleigh distribution. Ultrasound Med. Biol. 2015, 41, 2240–2251. [Google Scholar] [CrossRef]
- Ho, M.C.; Lee, Y.H.; Jeng, Y.M.; Chen, C.N.; Chang, K.J.; Tsui, P.H. Relationship between ultrasound backscattered statistics and the concentration of fatty droplets in livers: An animal study. PLoS ONE 2013, 8, e63543. [Google Scholar] [CrossRef]
- Lin, J.J.; Cheng, J.Y.; Huang, L.F.; Lin, Y.H.; Wan, Y.L.; Tsui, P.H. Detecting changes in ultrasound backscattered statistics by using Nakagami parameters: Comparisons of moment-based and maximum likelihood estimators. Ultrasonics 2017, 77, 133–143. [Google Scholar] [CrossRef]
- Han, M.; Wan, J.; Zhao, Y.; Zhou, X.; Wan, M. Nakagami-m parametric imaging for atherosclerotic plaque characterization using the coarse-to-fine method. Ultrasound Med. Biol. 2017, 43, 1275–1289. [Google Scholar] [CrossRef] [PubMed]
- Tsui, P.H.; Ma, H.Y.; Zhou, Z.; Ho, M.C.; Lee, Y.H. Window-modulated compounding Nakagami imaging for ultrasound tissue characterization. Ultrasonics 2014, 54, 1448–1459. [Google Scholar] [CrossRef] [PubMed]
- Wan, Y.L.; Tai, D.I.; Ma, H.Y.; Chiang, B.H.; Chen, C.K.; Tsui, P.H. Effects of fatty infiltration in human livers on the backscattered statistics of ultrasound imaging. Proc. Inst. Mech. Eng. H 2015, 229, 419–428. [Google Scholar] [CrossRef] [PubMed]
- Chan, D.F.; Li, A.M.; Chu, W.C.; Chan, M.H.; Wong, E.M.; Liu, E.K.; Chan, I.H.; Yin, J.; Lam, C.W.; Fok, T.F.; et al. Hepatic steatosis in obese Chinese children. Int. J. Obes. Relat. Metab. Disord. 2004, 28, 1257–1263. [Google Scholar] [CrossRef] [PubMed]
- Dutt, V.; Greenleaf, J.F. Ultrasound echo envelope analysis using a homodyned K distribution signal model. Ultrason. Imaging 1994, 16, 265–287. [Google Scholar] [CrossRef] [PubMed]
- Destrempes, F.; Cloutier, G. A critical review and uniformized representation of statistical distributions modeling the ultrasound echo envelope. Ultrasound Med. Biol. 2010, 36, 1037–1051. [Google Scholar] [CrossRef] [PubMed]
- Prager, R.W.; Gee, A.H.; Treece, G.M.; Berman, L.H. Decompression and speckle detection for ultrasound images using the homodyned K-distribution. Pattern Recognit. Lett. 2003, 24, 705–713. [Google Scholar] [CrossRef]
- Hruska, D.P.; Oelze, M.L. Improved parameter estimates based on the homodyned K distribution. IEEE Trans. Ultrason. Ferroelectr. Freq. Control 2009, 56, 2471–2481. [Google Scholar] [CrossRef]
- Destrempes, F.; Poree, J.; Cloutier, G. Estimation method of the homodyned K-distribution based on the mean intensity and two log-moments. SIAM J. Imaging Sci. 2013, 6, 1499–1530. [Google Scholar] [CrossRef]
- Hu, X.; Zhang, Y.; Deng, L.; Cai, G.; Zhang, Q.; Zhou, Y.; Zhang, K.; Zhang, J. Assessment of homodyned K distribution modeling ultrasonic speckles from scatterers with varying spatial organizations. J. Healthc. Eng. 2017, 2017, 8154780. [Google Scholar] [CrossRef]
- Cristea, A.; Franceschini, E.; Lin, F.; Mamou, J.; Cachard, C.; Basset, O. Quantitative characterization of concentrated cell pellet biophantoms using statistical models for the ultrasound echo envelope. Phys. Procedia 2015, 70, 1091–1095. [Google Scholar] [CrossRef]
- Byra, M.; Kruglenko, E.; Gambin, B.; Nowicki, A. Temperature monitoring during focused ultrasound treatment by means of the homodyned K distribution. Acta Phys. Pol. A 2017, 131, 1525–1528. [Google Scholar] [CrossRef]
- Hao, X.; Bruce, C.J.; Pislaru, C.; Greenleaf, J.F. Characterization of reperfused infarcted myocardium from high-frequency intracardiac ultrasound imaging using homodyned K distribution. IEEE Trans. Ultrason. Ferroelectr. Freq. Control 2002, 49, 1530–1542. [Google Scholar]
- Oelze, M.L.; O’Brien, W.D., Jr.; Zachary, J.F. Quantitative ultrasound assessment of breast cancer using a multiparameter approach. In Proceedings of the 2007 IEEE International Ultrasonics Symposium, New York, NY, USA, 28–31 October 2007; pp. 981–984. [Google Scholar]
- Trop, I.; Destrempes, F.; El Khoury, M.; Robidoux, A.; Gaboury, L.; Allard, L.; Chayer, B.; Cloutier, G. The added value of statistical modeling of backscatter properties in the management of breast lesions at US. Radiology 2015, 275, 666–674. [Google Scholar] [CrossRef] [PubMed]
- Byra, M.; Nowicki, A.; Wroblewska-Piotrzkowska, H.; Dobruch-Sobczak, K. Classification of breast lesions using segmented quantitative ultrasound maps of homodyned K distribution parameters. Med. Phys. 2016, 43, 5561–5569. [Google Scholar] [CrossRef] [PubMed]
- Dobruch-Sobczak, K.; Piotrzkowska-Wróblewska, H.; Klimoda, Z.; Karwat, P.; Litniewski, J.; Roszkowska-Purska, K.; Markiewicz-Grodzicka, E. Quantitative ultrasound parameters assessment of advanced breast cancer in evaluation the response to neoadjuvant chemotherapy. Eur. J. Cancer 2018, 92, S149–S150. [Google Scholar] [CrossRef]
- Mamou, J.; Coron, A.; Oelze, M.L.; Saegusa-Beecroft, E.; Hata, M.; Lee, P.; Machi, J.; Yanagihara, E.; Laugier, P.; Feleppa, E.J. Three-dimensional high-frequency backscatter and envelope quantification of cancerous human lymph nodes. Ultrasound Med. Biol. 2011, 37, 345–357. [Google Scholar] [CrossRef]
- Destrempes, F.; Franceschini, E.; Yu, F.T.; Cloutier, G. Unifying concepts of statistical and spectral quantitative ultrasound techniques. IEEE Trans. Med. Imaging 2016, 35, 488–500. [Google Scholar] [CrossRef]
- Roy-Cardinal, M.H.; Destrempes, F.; Soulez, G.; Cloutier, G. Assessment of carotid artery plaque components with machine learning classification using homodyned-K parametric maps and elastograms. IEEE Trans. Ultrason. Ferroelectr. Freq. Control 2019, in press. [Google Scholar] [CrossRef]
- Omura, M.; Yoshida, K.; Akita, S.; Yamaguchi, T. Verification of echo amplitude envelope analysis method in skin tissues for quantitative follow-up of healing ulcers. Jpn. J. Appl. Phys. 2018, 57, 07LF15. [Google Scholar] [CrossRef]
- Tang, A.; Destrempes, F.; Kazemirad, S.; Garcia-Duitama, J.; Nguyen, B.N.; Cloutier, G. Quantitative ultrasound and machine learning for assessment of steatohepatitis in a rat model. Eur. Radiol. 2019, in press. [Google Scholar] [CrossRef] [PubMed]
- Ghoshal, G.; Lavarello, R.J.; Kemmerer, J.P.; Miller, R.J.; Oelze, M.L. Ex vivo study of quantitative ultrasound parameters in fatty rabbit livers. Ultrasound Med. Biol. 2012, 38, 2238–2248. [Google Scholar] [CrossRef] [PubMed]
- Kuc, R. Ultrasonic tissue characterization using kurtosis. IEEE Trans. Ultrason. Ferroelectr. Freq. Control 1986, 33, 273–279. [Google Scholar] [CrossRef] [PubMed]
- Hughes, M.S. Analysis of digitized waveforms using Shannon entropy. J. Acoust. Soc. Am. 1993, 93, 892–906. [Google Scholar] [CrossRef]
- Zhou, Z.; Huang, C.C.; Shung, K.K.; Tsui, P.H.; Fang, J.; Ma, H.Y.; Wu, S.; Lin, C.C. Entropic imaging of cataract lens: An in vitro study. PLoS ONE 2014, 9, e96195. [Google Scholar] [CrossRef] [PubMed]
- Tsui, P.H.; Wan, Y.L. Effects of fatty infiltration of the liver on the Shannon entropy of ultrasound backscattered signals. Entropy 2016, 18, 341. [Google Scholar] [CrossRef]
- Lin, Y.H.; Liao, Y.Y.; Yeh, C.K.; Yang, K.C.; Tsui, P.H. Ultrasound entropy imaging of nonalcoholic fatty liver disease: Association with metabolic syndrome. Entropy 2018, 20, 893. [Google Scholar] [CrossRef]
- Ballestri, S.; Lonardo, A.; Romagnoli, D.; Carulli, L.; Losi, L.; Day, C.P.; Loria, P. Ultrasonographic fatty liver indicator, a novel score which rules out NASH and is correlated with metabolic parameters in NAFLD. Liver Int. 2012, 32, 1242–1252. [Google Scholar] [CrossRef]


| Authors | Technique | Study | # | Ref. Std. | Performance |
|---|---|---|---|---|---|
| Kuroda, 2012 [24] | ASQ imaging | Mouse model study | 9 | Histopathology | r = −0.72 (p = 0.0017) |
| Shen, 2016 [25] | ASQ imaging Ultrasound Nakagami imaging | Mouse model study | 24 | Histopathology | Both techniques can distinguish normal and fatty livers |
| Lee, 2017 [18] | ASQ imaging | Rat model study | 32 | MR spectroscopy | r = −0.90 (p < 0.001) |
| Karlas, 2015 [27] | ASQ imaging | Clinical study | 70 | MR spectroscopy | r = −0.43 (p = 0.004) |
| Son, 2016 [26] | ASQ imaging | Clinical study | 89 | MR spectroscopy | r = −0.87 (p < 0.001) |
| Ho, 2013 [31] | Ultrasound Nakagami imaging | Rat model study | 24 | Histopathology | r = 0.86 (p < 0.001) |
| Wan, 2015 [35] | Ultrasound Nakagami imaging | Clinical study | 107 | Ultrasonographic scoring system | r = 0.84 (p < 0.0001) |
| Zhou, 2018 [19] | Ultrasound Nakagami imaging | Rat model study | 18 | - | r2 = 0.94 |
| Ghoshal, 2012 [55] | Ultrasound HK imaging | Rabbit model study | 14 | Histopathology | Significant increase in the μ parameter |
| Fang, 2018 [20] | Ultrasound HK imaging | Rat model study | 36 | Histopathology | AUC = 0.947 (≥mild), 0.914 (≥moderate), 0.813 (≥severe) |
| Ma, 2016 [21] | Ultrasound kurtosis imaging | Clinical study | 107 | Ultrasonographic scoring system | AUC = 0.92 (≥mild), 0.90 (≥moderate), 0.82 (≥severe) |
| Tsui, 2016 [59] | Ultrasound entropy imaging | Clinical study | 107 | Ultrasonographic scoring system | r = 0.63 (p < 0.0001) |
| Lin, 2018 [60] | Ultrasound entropy imaging ASQ imaging | Clinical study | 394 | Ultrasonographic fatty liver indicator | r = 0.713 (p < 0.0001) r = –0.630 (p < 0.0001) |
| Zhou, 2018 [22] | Ultrasound entropy imaging | Clinical study | 53 142 | MR spectroscopy Histopathology | r = 0.74 (p < 0.0001) AUC = 0.80 (≥mild), 0.90 (≥moderate), 0.89 (≥severe) |
| Technique | Advantage | Limitation |
|---|---|---|
| ASQ imaging | Have been commercialized | Inconsistent findings for characterizing human hepatic steatosis |
| Ultrasound Nakagami imaging | Low computational complexity | The m parameter plateaus around 1 for higher scatterer concentrations |
| Ultrasound HK imaging | Have a physical meaning | High analytical complexity |
| Ultrasound kurtosis imaging | Easy to compute | Need further validation |
| Ultrasound entropy imaging | Allow a small-window (high-resolution) imaging | The dynamic range of Shannon entropy is limited |
© 2019 by the authors. Licensee MDPI, Basel, Switzerland. This article is an open access article distributed under the terms and conditions of the Creative Commons Attribution (CC BY) license (http://creativecommons.org/licenses/by/4.0/).
Share and Cite
Zhou, Z.; Zhang, Q.; Wu, W.; Wu, S.; Tsui, P.-H. Hepatic Steatosis Assessment Using Quantitative Ultrasound Parametric Imaging Based on Backscatter Envelope Statistics. Appl. Sci. 2019, 9, 661. https://doi.org/10.3390/app9040661
Zhou Z, Zhang Q, Wu W, Wu S, Tsui P-H. Hepatic Steatosis Assessment Using Quantitative Ultrasound Parametric Imaging Based on Backscatter Envelope Statistics. Applied Sciences. 2019; 9(4):661. https://doi.org/10.3390/app9040661
Chicago/Turabian StyleZhou, Zhuhuang, Qiyu Zhang, Weiwei Wu, Shuicai Wu, and Po-Hsiang Tsui. 2019. "Hepatic Steatosis Assessment Using Quantitative Ultrasound Parametric Imaging Based on Backscatter Envelope Statistics" Applied Sciences 9, no. 4: 661. https://doi.org/10.3390/app9040661
APA StyleZhou, Z., Zhang, Q., Wu, W., Wu, S., & Tsui, P.-H. (2019). Hepatic Steatosis Assessment Using Quantitative Ultrasound Parametric Imaging Based on Backscatter Envelope Statistics. Applied Sciences, 9(4), 661. https://doi.org/10.3390/app9040661