Article

Influence of Stress and Crack Patterns on the Sensitive Characteristics of Fissure Sandstone Permeability under Hydromechanical Coupling

State Key Laboratory of Coal Resources and Safe Mining, School of Mines, China University of Mining and Technology, Xuzhou 221116, China
*
Authors to whom correspondence should be addressed.
Appl. Sci. 2019, 9(4), 641; https://doi.org/10.3390/app9040641
Submission received: 8 December 2018 / Revised: 15 January 2019 / Accepted: 15 January 2019 / Published: 14 February 2019
(This article belongs to the Section Energy Science and Technology)

Abstract

:
The stress-sensitive of seepage characteristics after rock fracture has a crucial effect on the formation and closure of seepage channels, and it is important to study the sensitivity of fracture permeability for engineering seepage prevention. The aim of the current study was to investigate the permeability law of different fracture modes under unloading action. Firstly, the physical and mechanical parameters of the Voronoi polygon block and joint were fitted with rock properties obtained in the laboratory based on the fracture characteristics of triaxial seepage experiment samples. Crack reconstruction technology and a new hydraulic parameter fitting method were used to obtain the hydraulic aperture of microjoints and macrocracks. Then, six single crack models and four models based on typical fracture characteristics of rock samples were established to study the variation of the hydraulic aperture of microcracks and macroscopic cracks in unloading environment and the morphology of the main seepage passages, to explore the seepage characteristics of different angle cracks under different unloading stress paths, and to analyze the law of seepage variation of different crack forms under different stress environments. The results indicated that a horizontal hydraulic aperture is more sensitive to axial stress than a vertical hydraulic aperture and that a vertical hydraulic aperture is more sensitive to confining stress than a horizontal hydraulic aperture. For a single crack model, the sensitivity of a 70–90-degree crack to confining pressure is greater than that of a 40–60-degree crack. The axial stress sensitivity of a 40–60-degree crack is greater than that of a 70–90-degree crack. For a typical fracture model, under the same stress conditions, the sensitivity of four typical cracks to confining pressure is greater than that to axial pressure.

1. Introduction

Fractured rock mass contains a large number of macroscopic discontinuous surfaces such as microcracks, pores, and joint fissures, and their existence provides places for storage and migration of groundwater. The mining disturbance of underground works breaks the stress balance of the original rock and causes superposition of the original rock stress and the mining stress. The change in stress field often causes internal defects of the fractured rock to deteriorate further to form macroscopic cracks, resulting in a dramatic change in the permeability of the fractured rock mass which directly threatens the safety of underground engineering [1,2,3,4,5]. According to statistics, more than 90% of rock mass slope damage is related to groundwater permeability, 60% of mine accidents are related to groundwater, and 30–40% of dam accidents in hydropower projects are caused by osmosis [6]. Therefore, it is necessary to study the deformation and permeability characteristics of coal rock in the fracture zone of underground space.
The permeability and hydraulic coupling of rock mass have been hot topics in recent years. Domestic and foreign scholars have carried out correlation research on the mechanical characteristics and the permeability evolution rules of coal rock. In order to overcome the limitations of rock properties studied in in situ tests, Pratt et al. [7] carried out continuous tests on granite blocks in situ using different research methods (field and laboratory tests). Load paths included uniaxial, biaxial, and proportional stress, uniaxial “strain”, and “direct shear” tests. They compared and analyzed the deformation, wave velocity, resistivity, permeability, and other research methods, and studied the correlation between the stress action direction and permeability. Kranz et al. [8] conducted a seepage experimental study on granite with complete and jointed joints and analyzed the relationship between joint roughness and the permeability coefficient. Chen [9] used a Realistic Failure Process Analysis (RFPA) numerical simulation and seepage experiment to study the mechanical behavior and permeability characteristics of sandstone under different surrounding rocks stresses and different pore pressures. Zhu et al. [10,11] studied the seepage characteristics of porous sandstone with a confining pressure of 13–550 MPa and pore water pressure of 10 MPa through the laboratory seepage experimental method and analyzed the influences of stress and failure mode on the axial permeability of sandstone and found that the change in permeability is closely related to the mechanical load path. Wang et al. [12] measured the permeability law of sedimentary rock in the process of total stress and strain and found that before the peak strength is reached, the permeability decreases with an increase in stress, and in the strain-softening stage, the permeability decreases significantly. At present, a large number of research work is focused on the evolution of rock permeability during the process of loading, and in fact, the excavation of underground chambers and the formation of seepage passages during the coal mining process is mainly affected by essential differences in the rock unloading behavior, rock under unloading, the loading conditions of the mechanical properties, permeability characteristics, etc. [13,14,15]. In order to fit the real stress environment of rock mass engineering, the permeability characteristics of rock under the unloading stress path must be studied in-depth.
In general, the research methods of rock seepage characteristics include field measurements, laboratory triaxial seepage experiments, and numerical simulation methods. The rock permeability obtained by the field measurement method is usually reliable, but because of the complicated engineering geology conditions and the expensive test cost, field measurement has not been widely applied [16,17,18]. At present, the permeability tests of coal and rock samples are carried out in the laboratory and seepage experiments can provide scientific researchers with valuable data; however, the seepage experiment system is a confined space, so the hydraulic aperture changes in microscopic and macroscopic cracks cannot be monitored during the experiment, and the fracture modes of rock samples cannot be predicted after the peak. It is impossible to quantitatively analyze the pore connectivity and fluid seepage path, and a seepage experiment of an intact rock sample cannot provide information about the strength, deformation, and seepage of rock samples with different fracture forms. In recent years, with the rapid development of computer computing performance, the numerical simulation method for rock permeability has been done more often. The most commonly used numerical simulation methods include the finite element, discrete element, and finite-discrete mixed models [19,20]. In the finite software, during the process of deformation, the material points of the study area still maintain the adjacent relationship of the shape and are unable to simulate the fracture and separation process of the block. The continuous method has difficulty presenting the microscopic and macroscopic crack morphologies, and the seepage process of the fluid is simulated by giving the block water mechanical parameters [21]. Compared with the finite element method, the discrete element and hybrid methods can simulate the movement and separation of the block. In the discrete element method (DEM), the rock is simulated by the joint between the polygon block and the block. The polygon block cannot be destroyed. The fissures are generated along the edge of the polygon, and the initiation, expansion, and closure of joints between polygonal blocks can simulate the formation of fractures in rock by simulating the responses of microscopic and macroscopic cracks under stress load. The fluid cannot pass through the block, and the fluid flow process can be simulated by giving hydraulic parameters to the joints [22,23].
Because of the complex morphology and uneven distribution of the pore structure, researchers have selected fracture models to carry out seepage experiments. The influence of the macroscopic crack angle and crack model on the seepage characteristics has not been addressed in the literature. In fact, different crack angles and different fracture modes of rock samples have great influences on the seepage flow. In order to deepen the understanding of the permeability law of different fracture modes under unloading action, this paper considered the intrinsic advantages of DEM in simulating fracture seepage. The Udec polygon method was used to study the seepage characteristics of sandstone without filling fissure. The crack reconstruction technique, based on the fracture feature of experimental rock samples, was used to establish two kinds of stress–water coupling numerical models: (1) the variable-angle single-crack model and (2) the typical fracture model based on the fracture characteristics of a rock sample. The established models were used to study the variation in the hydraulic aperture of microcracks and macroscopic cracks in an unloading environment as well as the morphology of the main seepage passages. The seepage characteristics of different angle cracks under different unloading stress paths were explored, and the laws of seepage variation of different crack forms under different stress environments were analyzed.

2. Materials and Methods

2.1. Study Case

This paper focuses on a sensitivity analysis of the seepage characteristics of macroscopic crack sandstone. The rocks samples were taken from Laosangou coal mine, located 15 km northwest of Xuejiawan town, Jungar banner, Erdos city, Inner Mongolia, as shown in Figure 1a. Laosangou coal mine is located in the Eastern part of the Loess Plateau of Ordos, with a high north and a low south. The area of Loess covers a wide range with a large thickness and contains local Aeolian sand. The landform of the landscape of the Loess plateau is affected by flowing water, wind erosion, and other external forces. The highlands are known as Liang Mao, and below them is the gully which criss-crosses the area. The vegetation is scarce. The design of the Laosangou coal mine’s first coal seam is #6 coal mine. Through the old three ditch coal mines in the early mining area of the #6 coal seam, a large amount of drilling data has been collected for mathematical statistics. The coal seam is buried deep—459.00–706.63 m of it can be mined—with an average depth of 573.54 m. The seam thickness is 8.51–33.04 m, with an average of 19.84 m. The local area of the mine hole distribution is shown in Figure 1b. The ZKJ612 Drill column diagram is shown in Figure 1c. This paper mainly focuses on the study of sandstone at a buried depth of around 570 m. The direct water-filled aquifer of the main coal seam in Laosangou mine field comprises coal seam and the roof and floor aquifers. The water-rich water is weak–medium, and the type of exploration in this area is two category two type, that is, the hydrogeological condition of the fissure aquifer is medium deposit.

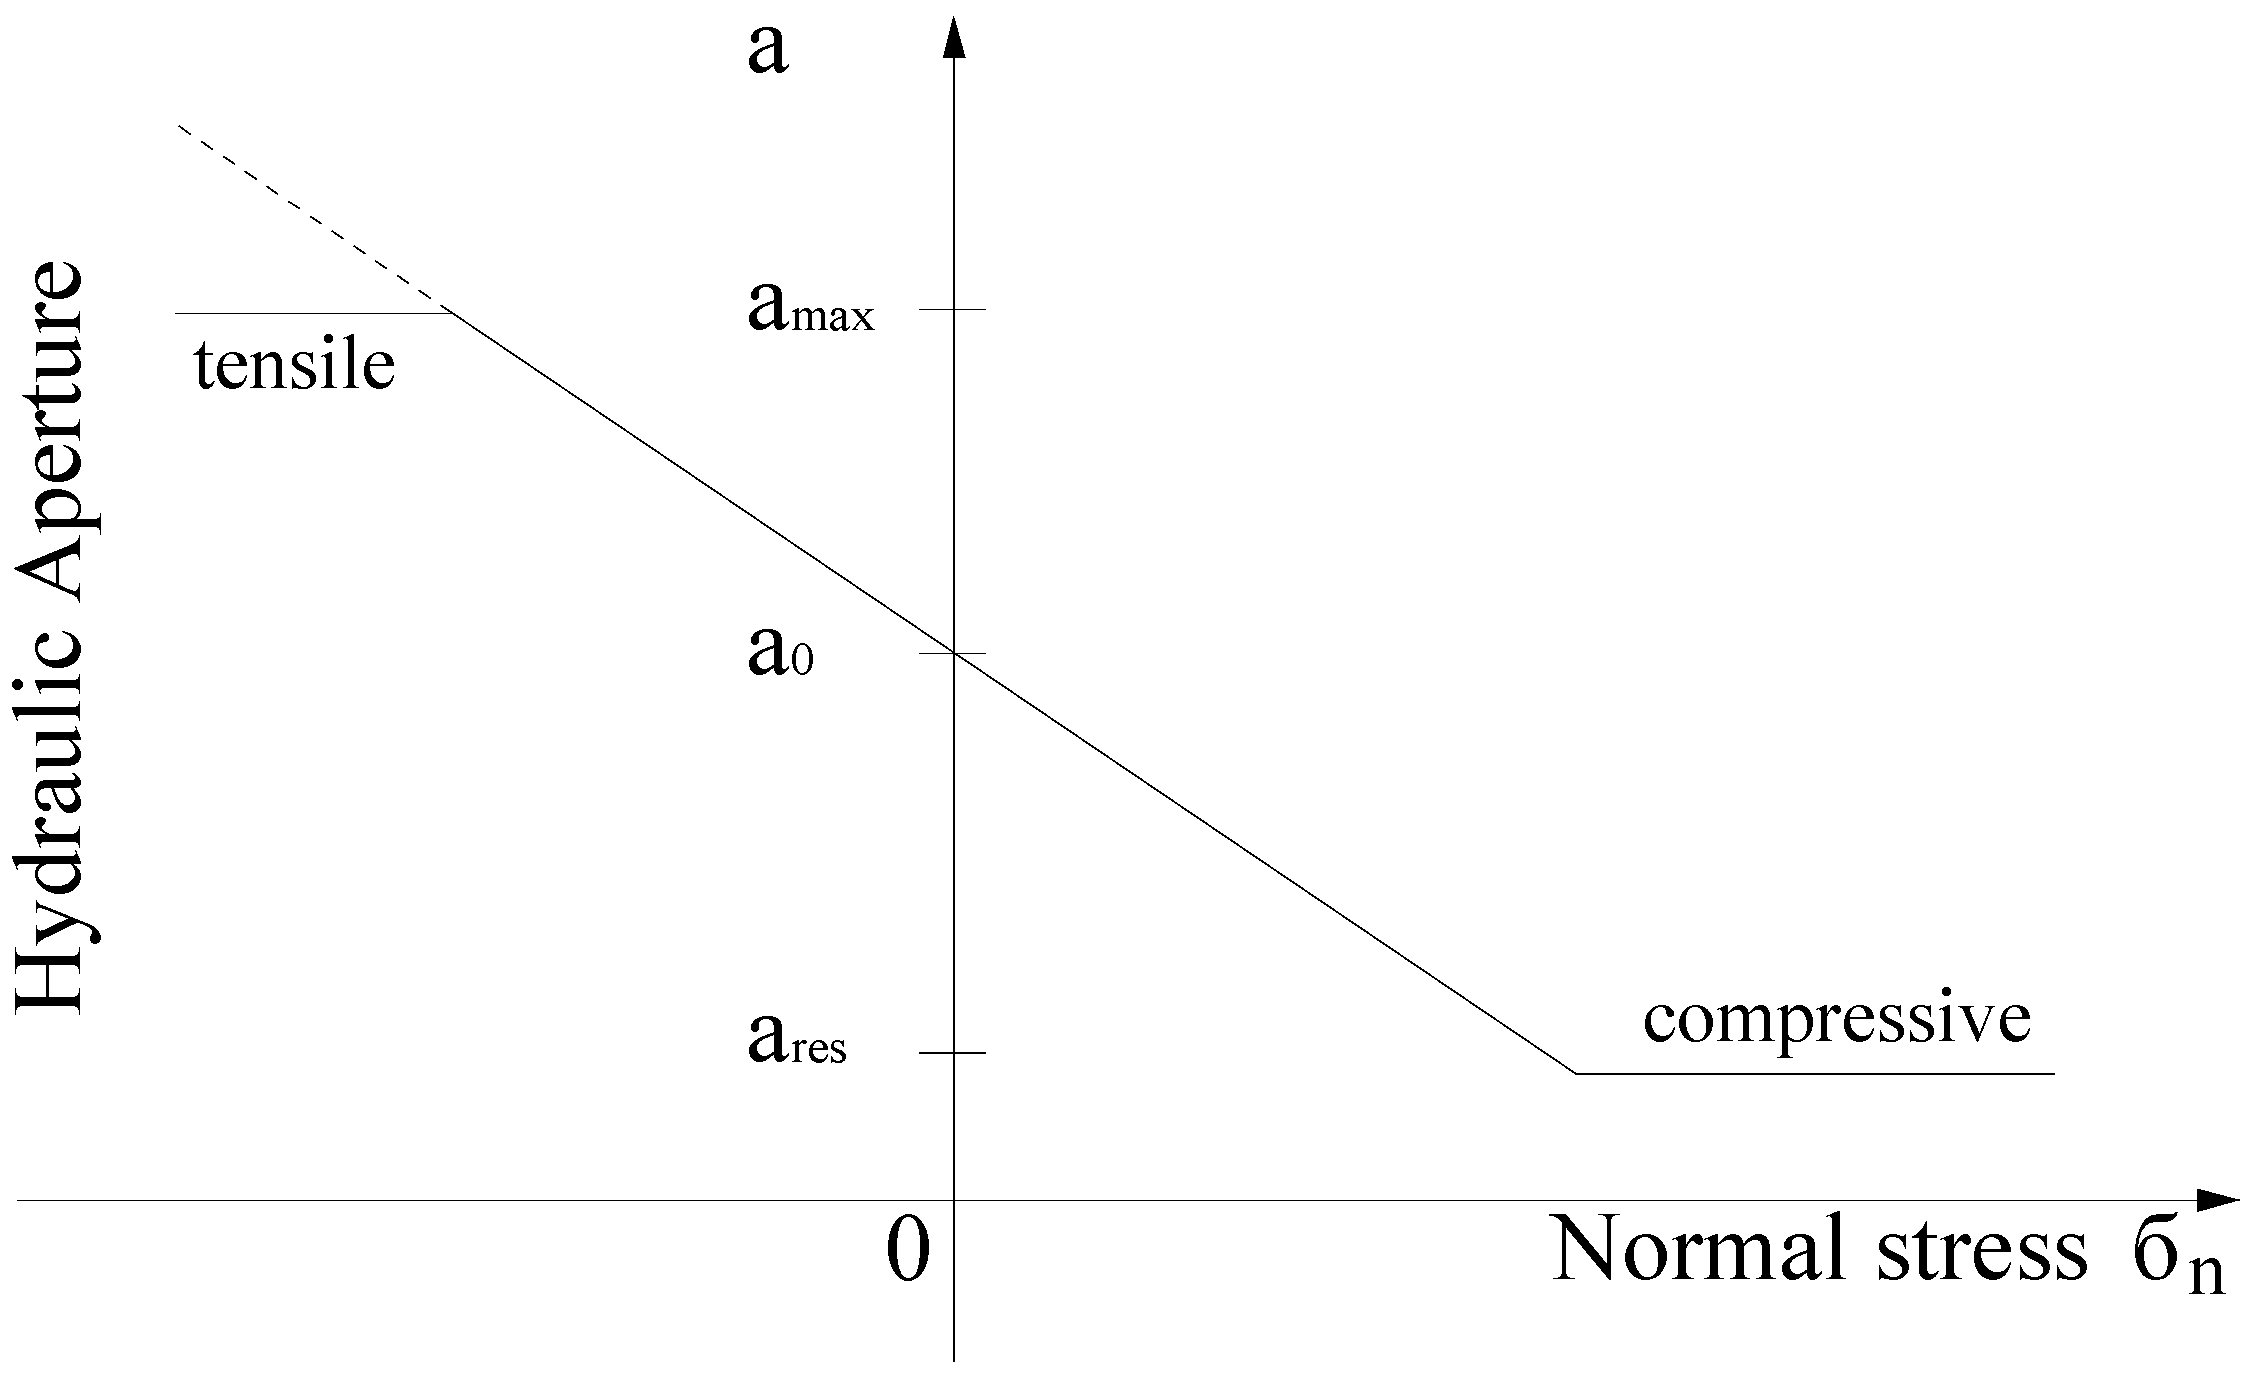
2.2. Contact Constitutive Model

Many studies have shown that the Udec 2D polygon is a common DEM that can reliably simulate the mechanical behavior of rocks under laboratory and field conditions [24,25,26,27]. The strength of rock mass is mainly controlled by the properties of joints between blocks. There are two modes of failure for each joint (tensile and shear damage) [28,29]. Based on the Molar Coulomb criterion and the strength properties of the joint surface (cohesive force C, internal friction angle (Φ), tensile strength (t)), the judgment was made that (1) when the normal stress (σn) is greater than the joint tensile strength (T), tensile failure occurs at joints, and the normal stress and shear stress values of the joints are 0 and (2) when shear failure occurs in the joints, the shear stress (τs) should meet the following conditions:
| σ n | T ,
| τ s | C + | σ n | tan ϕ = τ max .
In the formula, C is the joint cohesion, Φ is the joint friction angle, and σn is the normal stress on the joint surface. The constitutive model of the jointed joints is shown in Figure 2.
The fluid can only flow in the joints between the polygonal blocks [23] (Figure 3). The flow calculation formula of joints between two block planes is as follows.
q = k b a x p l ,
k = 1 12 μ .
The parameter k is the permeability coefficient of the joints, a is the width of the crack, b is the empirical coefficient, μ is the fluid viscosity, x is the crack aperture index, l is the length of the joint fracture, and ∆P is the pressure between the domains. The cubic law is now widely used: x = 3 and b = 1. Under the action of external force, polygon blocks deforms, resulting in displacement of joints between two block planes, and thereby causing the hydraulic aperture of joints to change, as shown in Figure 4. The hydraulic aperture of joints is calculated by the following formula.
a = a 0 + a ,
a = σ n k n .
where a0 is the joint hydraulic aperture under zero stress, σn is the normal stress on the joint, kn is the stiffness of the joints, and ares is the residual hydraulic aperture of the joints.
The relationship between the normal stress and the hydraulic aperture of joints is shown in Figure 5. ares is the minimum value of the hydraulic aperture of the joints and amax is the maximum hydraulic aperture of the joints. This was assumed for reasons of computational efficiency, because the timestep required for stability of the fluid flow algorithm is inversely proportional to the joint conductivity. As the conductivity is proportional to the cube of the aperture, the considerable variation in the permeability due to stress changes can still be modeled despite this constraint. When the value of the joint’s aperture is less than ares, the deformation behavior of the joint mechanics has no effect on the joint aperture. The hydraulic aperture value of the joints is ares. When the value of the joint aperture is greater than that of amax, the deformation behavior of the joint mechanics also has no effect on the joint aperture. The joint hydraulic aperture value is amax. The software default amax is five times ares. In order to study the hydraulic characteristics of the macrocracks, the ratio of amax to ares should be reasonably set. In this paper, the ratio of amax to ares was set to 223 for the simulation process.
This paper is focused on the permeability characteristics of a fractured rock sample after reaching a state of saturation under a known stress environment and is only interested in the joint seepage after stabilization. So, this article used the steady-state model of seepage. Two methods can be used to determine whether the seepage in the joints reaches a state of balance: (a) “print Max” is entered in the command window of Udec. When the inflow is equal to the outflow, the joint seepage is balanced. (b) The pore pressure of the joints of the model is monitored, and when the pore pressure in the joints is unchanged, the joint seepage reaches an equilibrium state. After the model has been balanced, “Print Max” is entered in the Udec command window to record the joint maximum and average joint flow rates.

2.3. Numerical Simulation Model Construction

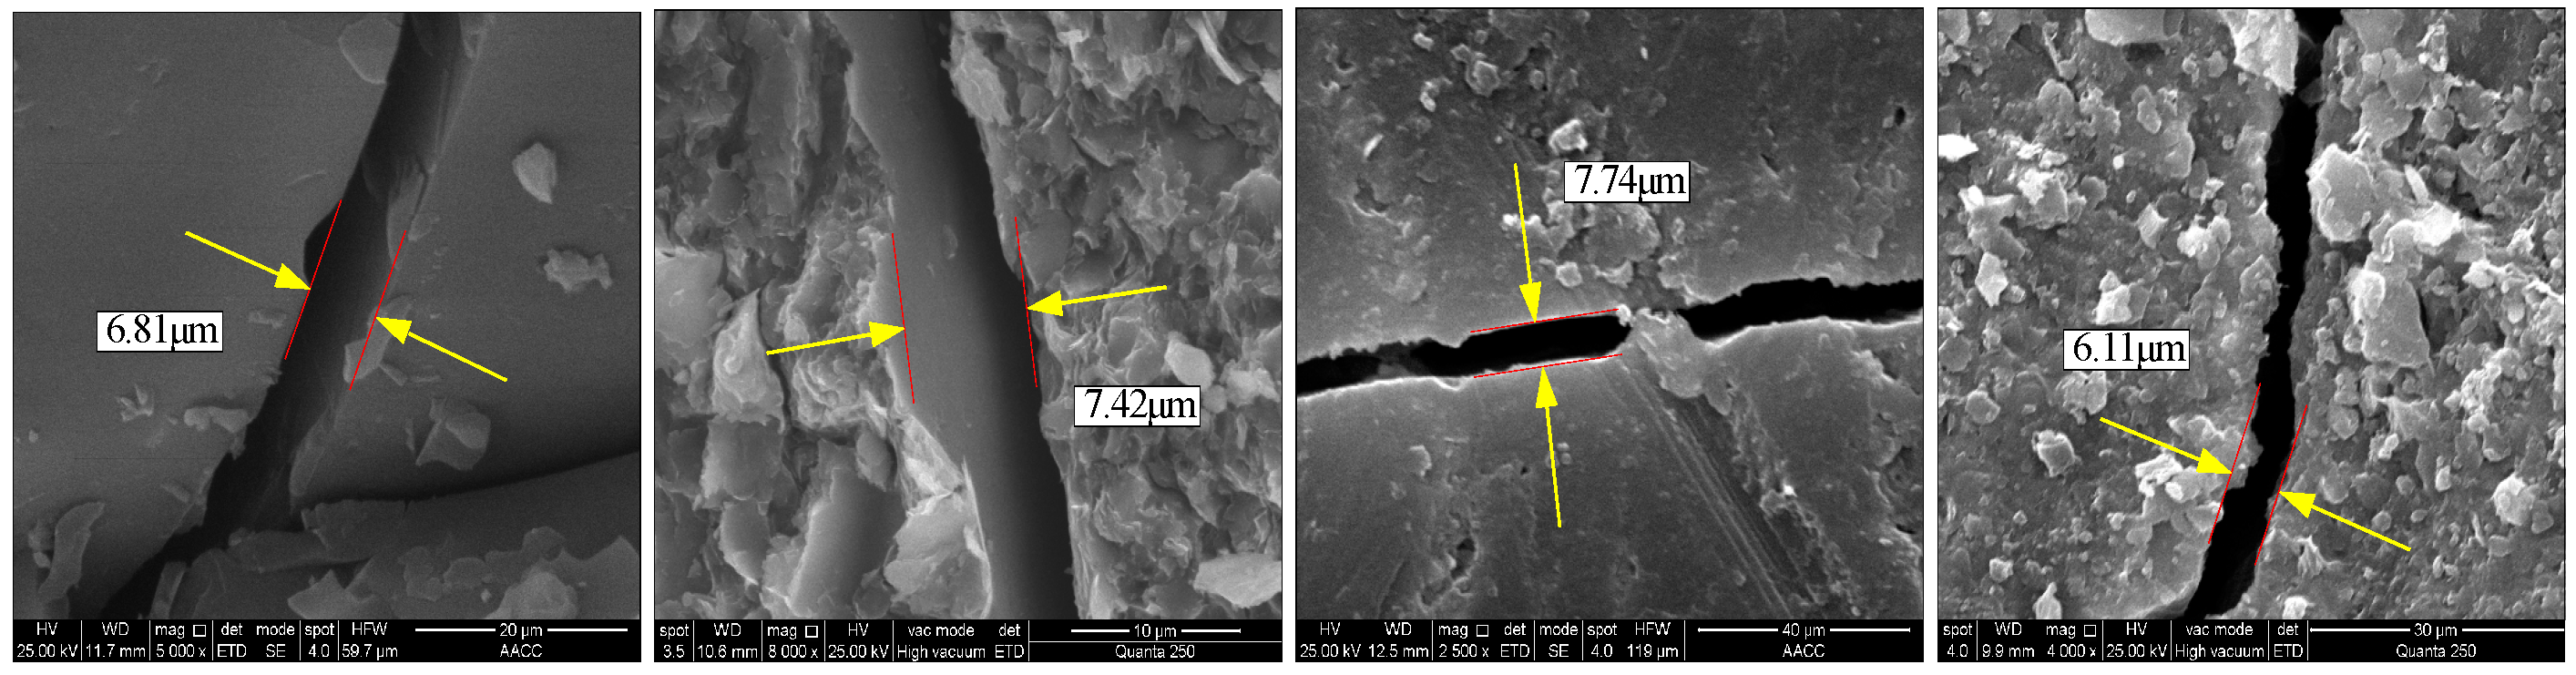
2.3.1. Numerical Model Parameter Validation

During the process of a numerical simulation, the selection of reasonable physical and mechanical parameters can allow the simulation to effectively reproduce the rock’s mechanical behavior. In order to determine physical and mechanical parameters of the blocks and joints of the model, the previous methods are selected to check the parameters [30,31,32,33], and the numerical simulation is fitted with the data of the Basic Mechanics experiment (compressive experiment and tensile test), in the simulation process, according to the failure criterion of the joint, as shown in formulas (1) and (2). A ‘FISH’ program is used to determine whether the joint is broken when the joints have tensile damage. The broken joints are classified into the “tensile damage” group, and when the joints produce shear damage they are allocated to the “shear damage” group; the number of broken joints in each group is recorded separately.
The dimensions of the rock sample for compression test is 50 × 100 mm (diameter × height). Udec software was used to establish a two-dimensional numerical model with dimensions of 50 × 100 mm (width × height). The experimental results of the uniaxial compression test and the numerical simulation are shown in Figure 6. An “X”-shaped form of destruction is present on the specimen when the rock specimen is destroyed (Figure 6a). The same failure mode is also obtained in the numerical simulation, as shown in Figure 6b. Figure 6c is the stress–strain curve of the uniaxial compression test of the model. The stress peak of the specimen’s uniaxial compression is 75.03 MPa. In terms of stress peaks and stress curves, the results of the numerical simulation show good consistency with the experimental data. The damage percentage is the number of damaged joints divided by the total number of joints before reaching the peak stress of 65%. The joints mainly show tensile failure beyond this stress value. The joints start to produce shear damage, and the amount of destruction rapidly increases when peak stress is reached. The percentages of joints damaged due to shear and tensile are 20% and 15%, respectively, after the peak stress. The shear failure is stable at 42%. The tensile failure is stable at 17%. Nearly 59% percent of the joints in the model are destroyed. The rate of shear damage is ~2.5 times the rate of tensile failure.
The dimensions of the rock sample for tensile testis is 50 × 25 mm (diameter × thickness). A two-dimensional numerical model with diameter of 50 mm is established with Udec software. The tensile fractures in the numerical simulation are presented as straight lines throughout the specimen, as shown in Figure 7b, which is consistent with the damage pattern obtained by the laboratory test, as shown in Figure 7a. Figure 7c is the stress–strain curve of the tensile test of the model. Before the stress peak, the stress increases linearly with the increase in strain. A “cliff-type” drop in stress values occurs after reaching the stress peaks. The numerical simulation results and laboratory results correlate well. In the curve, it can be seen that tensile failure is the main failure form in the tension experiment, and when the stress reaches the peak stress level of 25%, tensile damage gradually starts, and after the peak, the number of joints with tensile damage is stable at ~16.7% after a sharp increase. Nearly 17.5% of the joints in the model are damaged, and only a small number of joints show shear damage.
The physical and mechanical parameters of the block and joints applied in the numerical model are shown in Table 1. The fitting results of the uniaxial compression and tensile experiments show that the physical and mechanical parameters selected in Table 1 are reasonable.

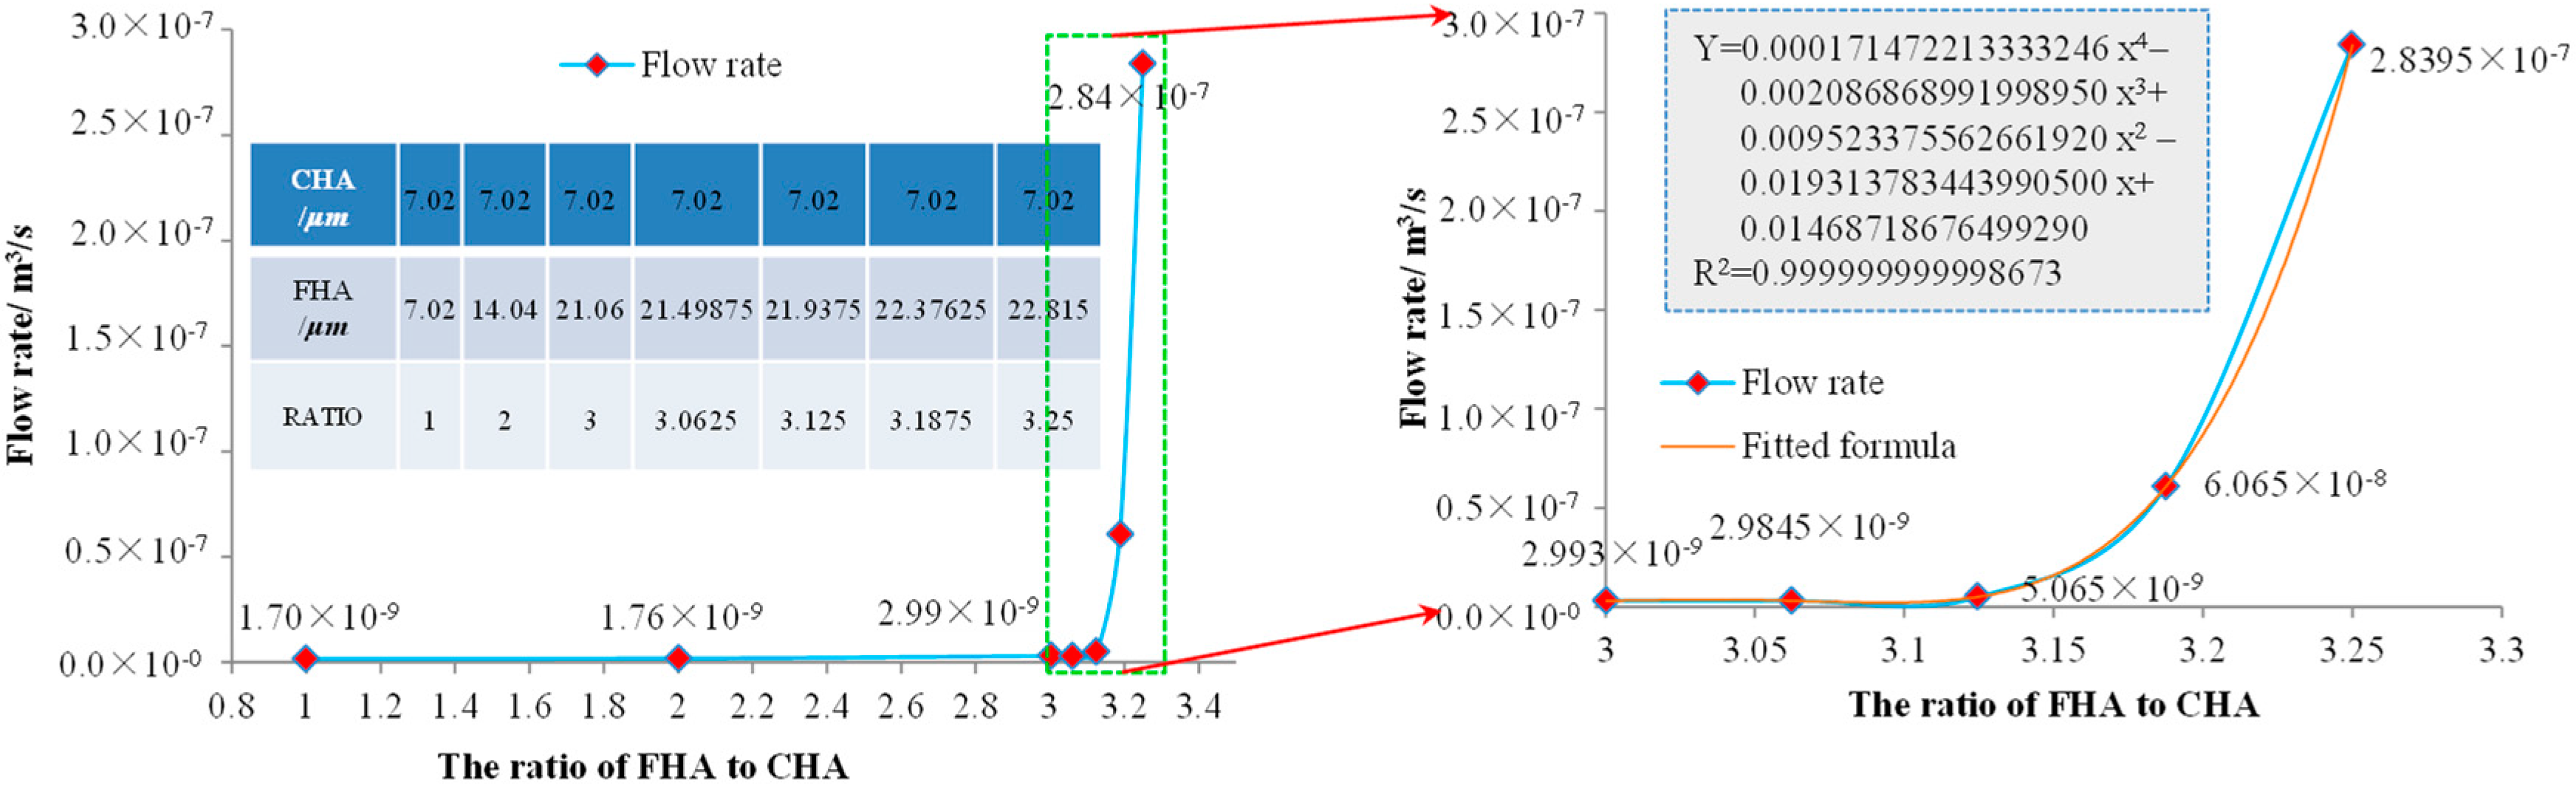
2.3.2. Hydraulic Parameter Fitting

In order to ensure that the numerical model can effectively represent the hydraulic behavior of the rock, the rational hydraulic parameters in the model should be determined first, and a new fitting method for hydraulic parameters is presented in this paper. The specific process used was follows.
(1) Crack reconstruction technology.
The fracture characteristics of triaxial seepage experiment rock samples were determined by the following method. The research group carried out the triaxial seepage experiment on the Laosangou sandstone sample (Figure 1). The experimental parameters and seepage characteristics of the rock sample after the peak are shown in Table 2. The estimated seepage quantity was 4.057 × 10⁻⁸ m3/s. The post-peak sandstone samples are shown in Figure 8a. The angle between the fracture surface and the horizontal line was 68°, and the rupture surface ran through the bottom surface of the rock sample. A ruptured surface existed in the sandstone sample. The rupture surface was wide open and completely separated into two parts after the sample had been taken out [34]. (2) The macrocrack internal node information was obtained as follows. The macroscopic crack profile of the rock sample was drawn with CAD software. The “pline” command in CAD software was used to draw the crack contour. The “list” command in CAD software was used to obtain the coordinates of data points sequentially. The ‘FISH’ program was used to transform the CAD file into a Udec model, and then, the macrocrack internal node information was obtained. (3) To fit the model construction, Udec software was used to establish a two-dimensional numerical model with dimensions of 100 × 50 mm (height × width). In this process, first, the Voronoi tessellation generator command is used to divide blocks into small polygons and joints by setting the number of seeds, which usually have a relatively uniform size. The cracks in the model are grouped based on the fish language: “contact” and “fracture”. “Contact” represents microscopic cracks inside the rock sample, and “fracture” represents the macroscopic cracks that occur after the rock sample breaks, as shown in Figure 8b.
(2) Hydraulic aperture of a microjoint under zero stress conditions.
The rock samples of the Laosangou coal mine were observed using scanning electron microscopy. This method is based on the research foundations of coal petrology and structural geology. After the chemical and physical changes, the rock mass was characterized by residual traces [35]. The development characteristics of the pore, the fissure morphology, and the size of the rock mass were observed by scanning electron microscopy. The observation results are shown in Figure 6. The fracture widths, as shown in the graph, were 6.81 μm, 7.42 μm, 7.74 μm, and 6.77 μm, respectively, as shown in Figure 9 and the hydraulic aperture in the model under zero stress state is the average of the above four values, i.e., a0 = 7.02 μm.
(3) Hydraulic aperture of the macrocrack.
In order to ensure the rationality of the fitting parameters, the hydraulic conditions of the reconstructed model boundary were kept consistent with the boundary conditions of the triaxial seepage experiment. An axial pressure of 82 MPa was applied to the upper and lower boundaries of the model. A confining pressure of 12 MPa was exerted on the left and right sides, and the osmotic pressure difference between the upper and lower sides was 2 MPa. The two sides of the model are known as the impervious boundary, as shown in Figure 8c. In order to reduce the impact of accidental factors, the model of each condition was simulated at least five times. The initial joint hydraulic aperture of the “contact” group joint was a0 = 7.02 μm. The initial joint hydraulic aperture of the “fracture” group joint was R × a0. At the same time, the joint hydraulic aperture of the “tensile damage” and “shear damage” groups was reassigned, and the initial joint hydraulic aperture of the “tensile damage” and “shear damage” groups was also R × a0. These values were used to simulate the permeability of the rock sample after secondary failure. Values of R = 1, 2, 3, 3.0625, 3.125, 3.1875, and 3.25, respectively, were used. The change curve of the seepage flow rate produced by changes in the R value is shown in Figure 10. When R was less than 3, the R value had almost no response to the joint seepage flow. When R was greater than or equal to 3, there was a quartic polynomial relationship between the flow rate and the R value. The correlation was above 99%, and the relationship between the R value and the joint average flow was obtained with the following formula.
Y = aR^4 − bR^3 + cR^2 − dR + e.
In the formula,
Y: flow rate (m3/s)
R: ratio of FHA to CHA
a = 0.000171472213333246
b = 0.002086868991998950
c = 0.009523375562661920
d = 0.0193137834439905
e = 0.01468718676499290
The value of Y = 4.05721705398765 × 10⁻⁸ was converted into a function relation, and a R value of 3.17492492492493 was obtained, and the joint hydraulic opening of the crack was shown to be about 22.29 μm.

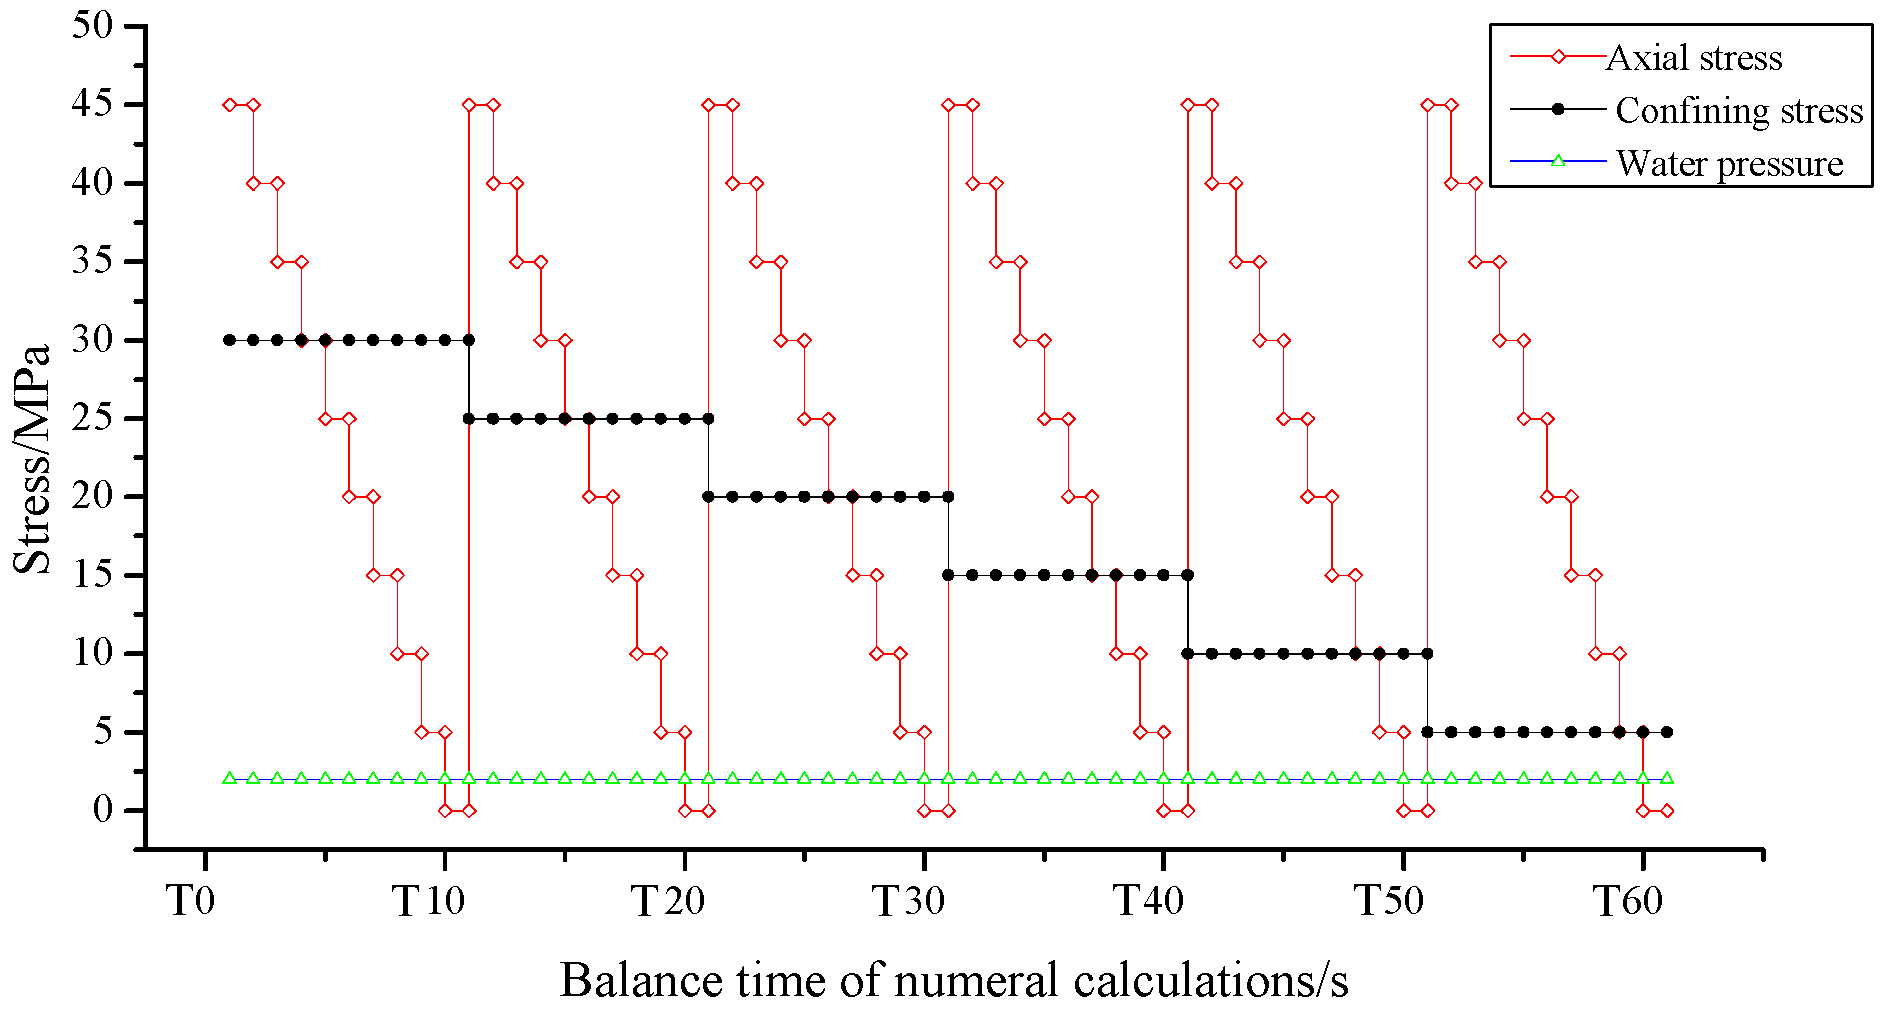
2.3.3. Determination of Numerical Simulation Scheme

Based on the crack reconstruction technique, this paper established 10 seepage calculation models. The models can be divided into two types: (1) A single crack model with a crack angle of 40–90 degrees. Figure 11a shows the design scheme of the single-crack model, and Figure 11b shows the calculation models of the single-crack at different angles of the corresponding design scheme. Six single-crack models of 40 to 90 degrees were constructed to study the influence of different macroscopic crack angles on the seepage flow rate and stress sensitivity of different angle cracks. (2) The other model is the seepage model of a rock sample based on the typical experimental failure forms. Four types (named type I, type II, type III, and type Y) of fracture rock samples were chosen for analysis in this paper, as shown in Figure 12, and were used to investigate the seepage characteristics and stress sensitivity of rock specimens with different destructive forms. The seepage pressure difference between the ends of the model was 2 MPa. Both sides of the model had an impervious boundary. The method of determining the equilibrium point of the joint seepage flow was introduced in the previous part of the paper. When the model reached a state of balance, the “Print max” command was entered in the command window to record the seepage flow rate and the average joint hydraulic aperture. The experimental stress path is shown in Figure 13. In order to reduce the impacts of accidental factors, the model was calculated under each condition at least five times.

3. Results and Discussion

This section discusses the findings of the study involving the seepage characteristics of rock specimens with different crack patterns under the specified stress path. It also analyzes the characteristics of the seepage flow, the seepage flow increment, and the hydraulic aperture of joints under different stress environments and discusses the stress sensitivity characteristics of rock specimens with different crack patterns.

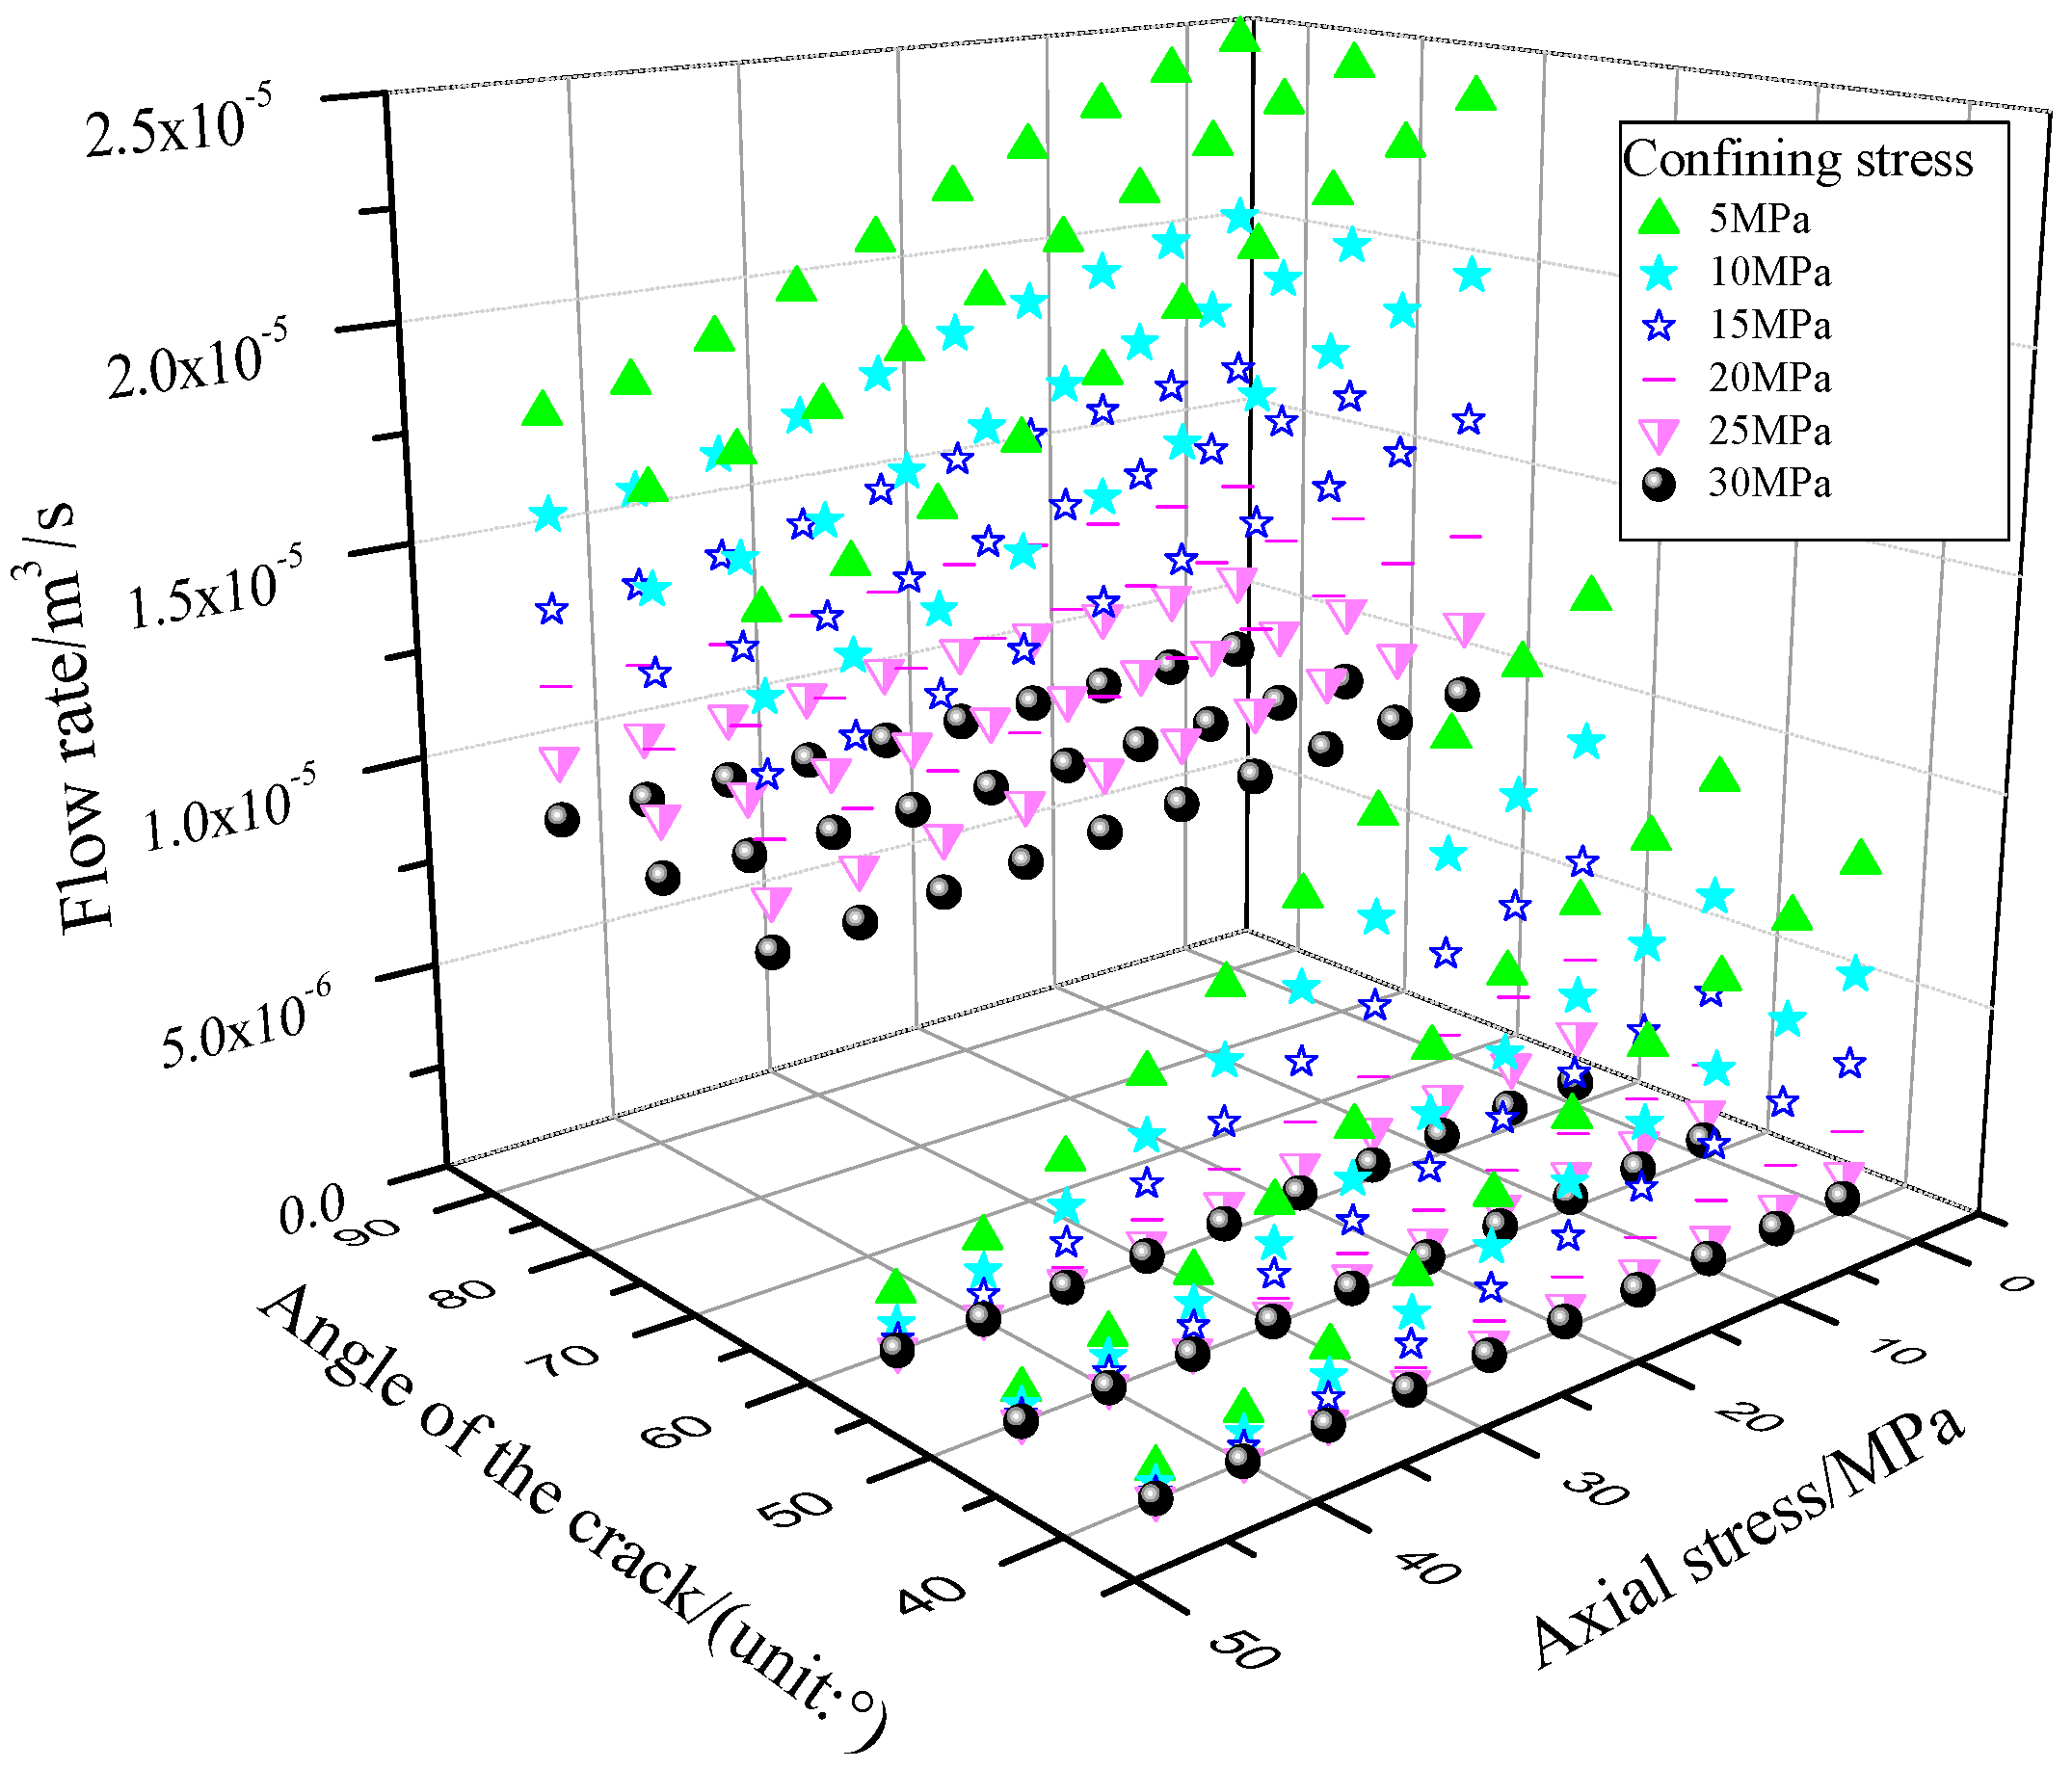
3.1. Experimental Results of Single-Crack Specimens with Different Angles

The seepage flow rates of the specimen under different stress conditions and different fracture angles are shown in Figure 14. The x-axis represents the crack angle, the y-axis represents the axial stress, and the z-axis is the seepage flow rate value. With an increase in the fracture angle, the flow rate value increased gradually. The flow rate values of 40–60 degrees increased slowly. At 60 to 70 degrees, the flow value suddenly changed and increased sharply. The flow rate increased slowly from 70 to 90 degrees. The variation law of seepage flow was similar at 40–60 degrees. The variation in the seepage flow at 70–90 degrees was small. To further analyze the characteristics of the seepage flow, seepage flow increment, and hydraulic aperture of joints under different stress environments, a detailed analysis was carried out for three cases, each with a fixed angle, a fixed axial pressure, and a fixed confining pressure.

3.1.1. Fixed Angle

The 70-degree crack model was chosen as an example to analyze the experimental results, in order to explore the influences of axial pressure and confining pressure on the microscopic and macroscopic joint seepage and the seepage channels. The joint hydraulic aperture and seepage channel were analyzed in detail under two kinds of stress boundary conditions: (1) axial stress 5 MPa, confining pressure 30–5 MPa and (2) confining pressure 5 MPa, axial stress 45–0 MPa.
(1) An axial pressure of 5 MPa was applied to the upper boundary of the model. The confining pressure was 30 MPa to 5 MPa. The pressure difference between the upper and lower ends was ∆p = p2 − p1 = 2 MPa. The hydraulic aperture of the joints is shown in Figure 15. The joint flow and the main seepage channel are shown in Figure 16.
When the confining compressive stress level is at 30 MPa or 25 MPa, almost all vertical joints and a large number of inclined joints reach the residual value. The closure of the vertical joint directly leads to a large number of closures in the vertical seepage channel. At this time, the microscopic seepage channel is mainly composed of a large number of horizontal joints and a small number of inclined joints. At 30 MPa, the macroscopic joint aperture values were mainly 1.78 × 10⁻⁵, while at 25 MPa, the macrojoint aperture values were mainly 1.78 × 10⁻⁵ and 2.0 × 10⁻⁵. When the confining pressure was lowered to 20 MPa or 15 MPa, almost all vertical joints and a few inclined joints reached the residual value. The closure of the vertical joint directly led to a large number of closures in the vertical seepage channel. The microscopic seepage channel was mainly composed of a large number of horizontal joints and inclined joints. At 20 and 15 MPa, the macrojoint aperture values were mainly 2.0 × 10⁻⁵. When the confining pressure reduced to 10 MPa or 5 MPa, only the local vertical joints reached the residual value. The network structure, consisting of vertical joints, inclined joints, and horizontal joints, contributed to the formation of seepage channels. The macrojoint openings at 10 MPa and 5 MPa were mainly 2.23 × 10⁻⁵. In the process of reducing the confining pressure, the large influence of the confining pressure on the microscopic vertical joints will lead to a large change in the vertical microscopic seepage channel. The increase in the joint aperture value of the macroscopic crack causes an increase in the seepage flow rate so that the main seepage channel is composed of macroscopic cracks, as shown in Figure 16.
(2) A 5 MPa confining pressure was applied to the boundary of both sides of the model. The axial pressure was 45 MPa to 0 MPa. The difference in pressure between the upper and ends was ∆p = p2 − p1 = 2 MPa. The hydraulic aperture values of the joints are shown in Figure 17. The main seepage channels of the joints were the same as those shown in Figure 16, except for the presence of a slightly different joint flow rate, which is not described here.
When the axial stress level was greater than 35 MPa, almost all of the horizontal joints and a large number of the inclined joints reached the residual value. Closure of a horizontal joint directly led to a large number of closures in the horizontal seepage channel. At this time, the microscopic seepage channel was mainly composed of a large number of vertical joints and a small number of inclined joints. The macrojoint aperture values were mainly 1.78 × 10⁻⁵, 2.0 × 10⁻⁵, and 2.23 × 10⁻⁵. When the axial stress reduced to the 25–15 MPa stress interval, almost all of the horizontal joints and a small number of inclined joints reached the residual value. The closure of the horizontal joint also directly led to a large number of closures in the horizontal seepage channel. The macrojoint aperture values were mainly 2.0 × 10⁻⁵ and 2.23 × 10⁻⁵. When the axial stress reduced to the 10–0 MPa interval, only local horizontal joints reached the residual value. The network structure, consisting of vertical joints, inclined joints, and horizontal joints, contributed to the formation of seepage channels. At 10–0 MPa, the macrojoint aperture values were mainly 2.23 × 10⁻⁵. The main seepage channel was composed of macroscopic cracks (Figure 16). During the process of axial pressure reduction, the large influence of the axial stress on the microhorizontal joints led to a large change in the horizontal microscopic flow channel, which had less influence on the vertical microscopic seepage channel.
The variation law of infiltration flow at 40–60 degrees is similar, as is that at 70–90 degrees. When the crack angle increased from 60 to 70 degrees, the rate of the cliff-type of seepage flow increased. In Figure 14, the experimental data for the 60- and 70-degree crack angles were selected to analyze the seepage change rule for the 60- and 70-degree crack models. Figure 18 and Figure 19 are flow rate change curves for the 60-degree and 70-degree crack models, respectively. As the axial pressure (Figure 18a and Figure 19a) and confining pressure (Figure 18b and Figure 19b) decrease, the seepage flow rate change can be divided into two increasing stages: The slopes of the two stages, K1 and K2, were calculated, respectively. Positive values of K indicate that the flow value is gradually increasing. In order to facilitate a comparative analysis, the average values of K1 and K2 were used as the slope values. In Figure 18a and Figure 19a, the seepage flow is shown to gradually increase with the decrease of axial pressure. The lowest slope values were 9.18 × 10⁻⁹ and 3.73 × 10⁻⁸ with a confining pressure of 30 MPa. The highest slope values were 2.23 × 10⁻⁷ and 1.80 × 10⁻⁷ with a confining pressure of 5 MPa. As the confining pressure decreased, the slope value increased gradually. The sensitivity of the 60-degree crack to axial stress was greater than that of the 70-degree crack; In Figure 18b and Figure 19b, the seepage flow is shown to gradually increase with a decrease in confining pressure. The lowest slope values were 4.73 × 10⁻⁸ and 2.93 × 10⁻⁷ with an axial pressure of 45 MPa. The highest slope values were 4.59 × 10⁻⁷ and 5.52 × 10⁻⁷ with an axial pressure of 0 MPa. As the axial pressure decreased, the slope value gradually increased, and the sensitivity of the 70-degree crack to the confining pressure was greater than that of the 60-degree crack.

3.1.2. Fixed Axial Pressure

Experimental data collected under the conditions of 40 MPa and 10 MPa axial pressure (Figure 14) were selected for analysis, as shown in Figure 20a,b, respectively. When the axial pressure was 40 MPa (Figure 20a), with 5 MPa of confining pressure. The seepage flow increment for the 40 to 90-degree cracks were 1.00 × 10⁻⁷, 7.00 × 10⁻⁷, 1.39 × 10⁻⁵, 1.70 × 10⁻⁶, and 9.00 × 10⁻⁷, respectively. When the confining pressure decreased from 30 MPa to 5 MPa, the seepage flow increments for cracks of 40–90 degrees were 1.11 × 10⁻⁶, 1.21 × 10⁻⁶, 1.91 × 10⁻⁶, 7.97 × 10⁻⁶, 9.23 × 10⁻⁶, and 9.84 × 10⁻⁶, respectively. When the axial pressure was 10 MPa (Figure 20b) with a confining pressure of 5 MPa. The seepage flow increments for the 40 to 90 cracks were 5.9 × 10⁻⁷, 2.93 × 10⁻⁶, 1.2 × 10⁻⁵, 7.0 × 10⁻⁷, and 5.0 × 10⁻⁷. When the confining pressure decreased from 30 MPa to 5 MPa, the seepage flow increments for the 40–90-degree cracks were 6.56 × 10⁻⁶, 7.09 × 10⁻⁶, 9.87 × 10⁻⁶, 1.33 × 10⁻⁵, 1.43 × 10⁻⁵, and 1.47 × 10⁻⁵. The flow rate change rule was similar under the conditions of 40 MPa and 10 MPa, but the flow rate value with 10 MPa was significantly higher than that under the condition of 40 MPa.
Under the condition of fixed axial pressure, when the confining pressure reduced from 30 MPa to 5 MPa, the seepage flow increment of different crack angles increased. This indicates that the sensitivity of permeability to the confining pressure was increasing. In addition, the seepage flow increments for the 70–90-degree cracks were more than those of the 40–60-degree cracks, which indicates that the stress sensitivity of the 70–90-degree cracks to confining pressure is greater than that of the 40–60-degree cracks. When the axial pressure decreased from 40 MPa to 10 MPa, the seepage flow increment for a given crack angle increased significantly, indicating that the sensitivity of the crack to the confining pressure gradually increased with a decrease in axial pressure.

3.1.3. Fixed Confining Pressure

Experimental data collecting under the conditions confining pressures of 20 and 10 MPa (Figure 14) were selected for analysis, as shown in Figure 21a,b, respectively. When the confining pressure was 20 MPa (Figure 21a), with 0 MPa of axial pressure, the seepage flow increments for the 40 to 90-degree cracks were 3.30 × 10⁻⁷, 1.43 × 10⁻⁶, 9.75 × 10⁻⁶, –3.00 × 10⁻⁷, and 1.00 × 10⁻⁷, respectively. When the axial pressure decreased from 45 MPa to 0 MPa, the seepage flow increments for the 40–60-degree cracks were 1.94 × 10⁻⁶, 2.26 × 10⁻⁶, and 3.65 × 10⁻⁶, respectively. The seepage flow increments of the 70–90-degree cracks were 3.30 × 10⁻⁶, 2.00 × 10⁻⁶, and 1.60 × 10⁻⁶, respectively. When the confining pressure was 10 MPa (Figure 2b) with 0 MPa of axial pressure, the seepage flow increments for the 40–90-degree cracks were 7.20 × 10⁻⁷, 2.77 × 10⁻⁶, 1.06 × 10⁻⁵, 2.00 × 10⁻⁷, and 2.00 × 10⁻⁷. When the axial pressure decreases from 45 MPa to 0 MPa, the seepage flow increments for the 40–60-degree cracks were 5.44 × 10⁻⁶, 6.12 × 10⁻⁶, and 8.65 × 10⁻⁶. As the crack angle increased, the seepage flow increment also increased. The seepage flow increments for the 70–90-degree cracks were 6.60 × 10⁻⁶, 5.30 × 10⁻⁶, and 4.60 × 10⁻⁶. The flow rate change rule was similar under confining pressures of 20 MPa and 10 MPa, but the flow rate value at 10 MPa was significantly higher than that at 20 MPa.
When the crack angle was less than 60 degrees, with an increase in the angle, the flow rate increment caused by the decrease of axial pressure increased. When the crack angle was greater than 70 degrees, with an increase in the angle, the flow increment caused by the decrease in axial pressure decreased. This indicates that when the crack angle is less than 60 degrees, the sensitivity of the single crack model to the axial pressure increases with an increase in the angle, and when the crack angle is greater than 70 degrees, the sensitivity of the single crack model to the axial pressure decreases gradually with an increase in the angle. The axial stress sensitivity of the 40–60-degree cracks is slightly greater than that of the 70–90-degree cracks. As the confining pressure decreases, the sensitivity of the single crack model to axial stress increases.

3.2. Average Joint Aperture of the Single Crack Model with Different Angles

The average joint aperture values of the specimen under different stress conditions and different fracture angles are shown in Figure 22. The x-axis represents the crack angle, the y-axis represents the axial stress, and the z-axis represents the average contact hydraulic value. Under the actions of axial stress and confining pressure, the variation in the average joint aperture value is similar in different fracture angle models.
Experimental data collected for the 60- and 70-degree angles (Figure 22) were selected for analysis; Figure 23 shows the change curves of the average joint hydraulic aperture values with different confining pressures and axial pressures. When the axial pressure was 45 MPa, the average joint hydraulic aperture values of the 60-degree and 70-degree cracks under the condition of 5–30 MPa were 3.98 × 10⁻⁶, 3.52 × 10⁻⁶, 3.07 × 10⁻⁶, 2.64 × 10⁻⁶, 2.21 × 10⁻⁶, and 1.80 × 10⁻⁶, respectively. The average joint hydraulic aperture value of the single crack model with different angles was approximately equal when the stress of the environment was kept equal. The average joint hydraulic aperture values of the 60- and 70-degree crack angles were approximately equal, but the seepage flow increased sharply, as shown in Figure 14. The main reasons for this are as follows. When the crack angle is greater than 70 degrees, the seepage channel formed by the macrocrack is directly connected to the seepage boundary to form the main seepage channel (Figure 16). When the crack angle is less than 60 degrees, the macroscopic crack needs to form a seepage channel through a connection with the surrounding microscopic crack. This is a reasonable explanation for this phenomenon, because 60-degree cracks have relatively high sensitivity to axial stress and confining pressure (Figure 18), while 70-degree cracks are more sensitive to confining pressure than axial pressure (Figure 19).
Under the actions of axial stress and confining pressure, the variation in the average joint aperture value is similar in different fracture angle models. When the crack angle ranged from 40 to 60 degrees. The average joint hydraulic aperture value increased slightly with an increase in the angle. When the crack angle was greater than 60 degrees, the average joint hydraulic aperture value was almost stable at a constant value. The average joint hydraulic aperture value increased gradually with a decrease in the axial stress.

3.3. Experimental Results for the Four Typical Crack Models

The seepage flow rate of the specimen under different stress conditions and different fracture forms is shown in Figure 24. The x-axis represents the crack forms, the y-axis represents the axial stress, and the z-axis represents the seepage flow rate value. Under the same hydraulic environment conditions, the seepage flow rate of the rock sample with “type Ⅲ” cracks was the largest and the seepage flow rate of “type Ⅰ” was the smallest.

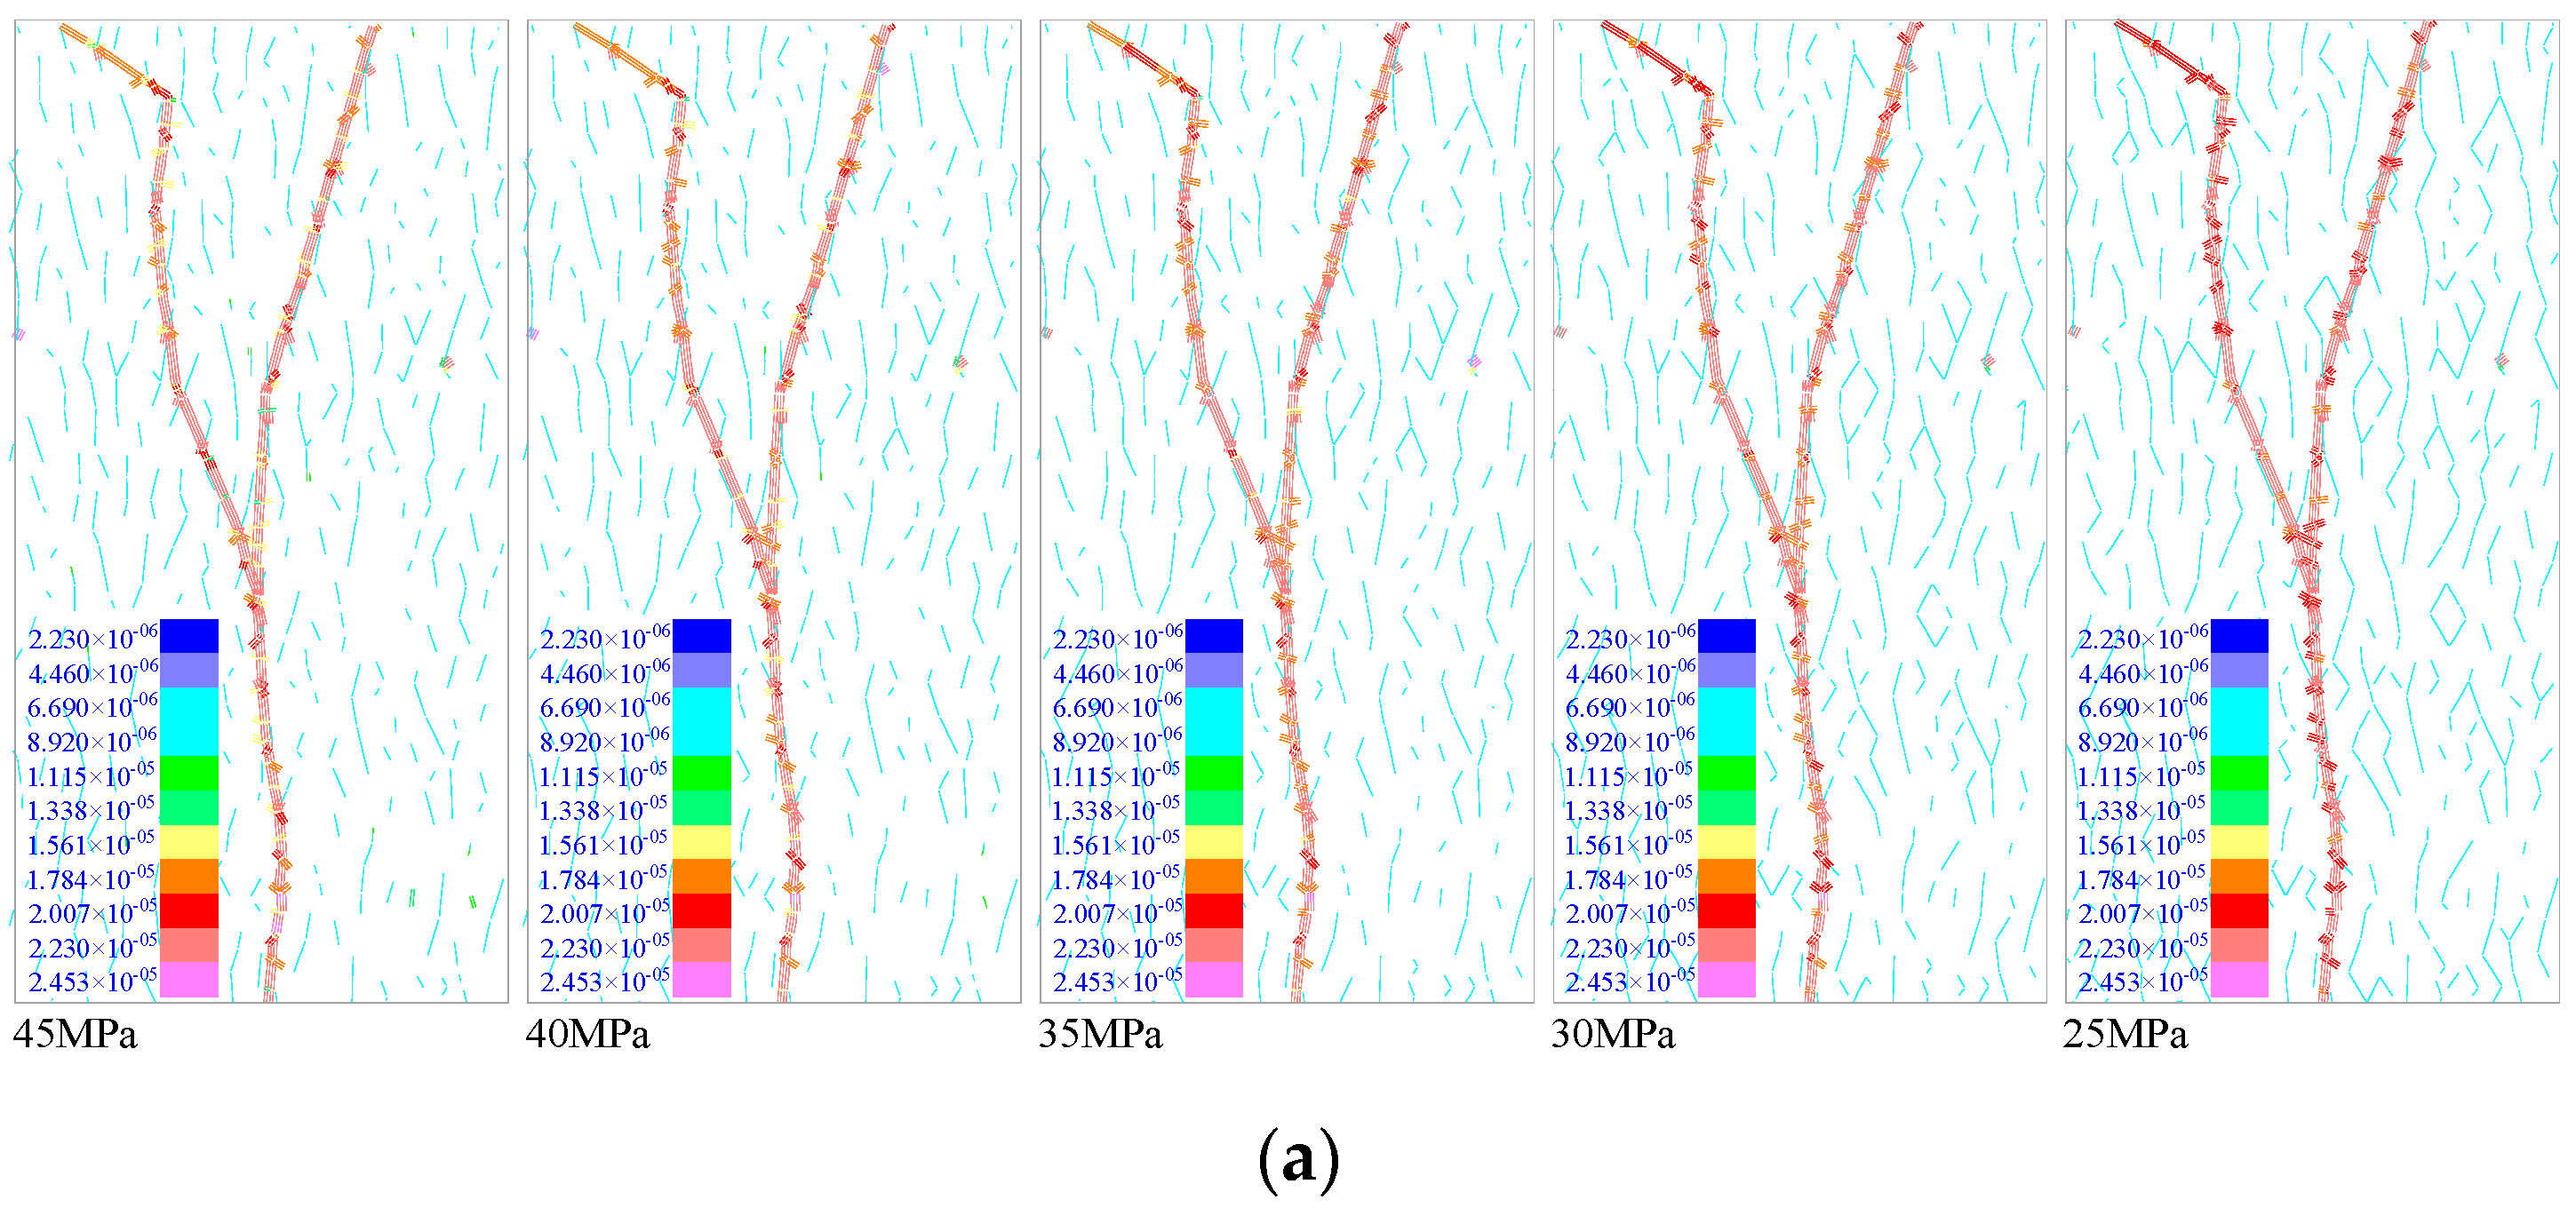
3.3.1. Simulation Results of the “Type Y” Crack Model

The “type Y” crack model was chosen as an example to analyze the experimental results, in order to explore the influences of the axial pressure and confining pressure on the microscopic and macroscopic joint seepage and seepage channels. The joint hydraulic aperture and seepage channel were analyzed in detail under two stress boundary conditions: (1) axial stress 5 MPa, confining pressure 30–5 MPa and (2) confining pressure 5 MPa, axial stress 45–0 MPa.
(1) An axial pressure of 5MPa was applied to the upper boundary of the model. The confining pressure was 30 MPa to 5 MPa. The pressure difference between the upper and lower ends was ∆p = p2 − p1 = 2 MPa. The hydraulic aperture values of the joints are shown in Figure 25. The joint flow rate and the main seepage channel are shown in Figure 26.
The variation law of hydraulic aperture of microscopic joints, as shown in Figure 25, is similar to that of Figure 15, with the decrease of confining pressure, a large number of vertical joints and inclined joints changes from closed state to open state. The network structure—consisting of vertical joints, inclined joints, and horizontal joints—contributed to the formation of seepage channels. In the process of reducing the confining pressure, the large influence of the confining pressure on microscopic vertical joints led to a large change in the vertical microscopic seepage channel. The increase in the joint aperture value of the macroscopic crack caused an increase in the seepage flow rate, and the main seepage channel was composed of macroscopic cracks and presented a Y-shape, as shown in Figure 26.
(2) A confining pressure of 5 MPa was applied to the right and left sides of the model. The axial pressure was 45 MPa to 0 MPa. The difference between the upper and lower ends was ∆p = p2 − p1 = 2 MPa. The hydraulic aperture values of the joints are shown in Figure 27.
The variation law of hydraulic aperture of microscopic joints, as shown in Figure 27, is similar to that of Figure 17, with the decrease of axial pressure, a large number of horizontal joints, and inclined joints changes from closed state to open state. The network structure, consisting of vertical joints, inclined joints, and horizontal joints, contributed to the formation of seepage channels. The main seepage channel was composed of macroscopic cracks and presented a Y-shape (similar to Figure 26). During the process of axial pressure reduction, the large influence of axial stress on the microhorizontal joints led to large changes in the horizontal microscopic flow channel, which had less influence on the vertical microscopic seepage channel.
Experimental data collected for the Y-type crack model (Figure 24) were selected for analysis. Figure 28 shows the flow rate change curves of the Y-type crack model with decreases in the axial pressure (Figure 28a) and confining pressure (Figure 28b). The seepage flow rate change can be divided into two increasing stages. The slopes of the two stages—K1 and K2—were calculated, respectively. The positive values of K indicate that the flow value gradually increased. In order to facilitate a comparative analysis, the average values of K1 and K2 were used as the slope values. The lowest slope value was 4 × 10⁻⁸ when the confining pressure was 30 MPa, and the highest slope value was 1.90 × 10⁻⁷ when the confining pressure was 5 MPa. As the confining pressure decreased, the slope value and seepage flow rate gradually increased, as shown in Figure 28a. The minimum slope value was 9.6 × 10⁻⁷ when the axial pressure was 45 MPa, and the maximum slope value was 1.23 × 10⁻⁶ when the axial pressure was 0 MPa. With a decrease in the axial pressure, the slope value gradually increased. The maximum slope value shown in Figure 28b is 6.47 times the maximum value in Figure 31a, and the minimum slope value shown in Figure 28b is 23.99 times the minimum value in Figure 28a. Once again, this indicates that the influence of the confining pressure on the seepage of Y-type cracks is greater than that of axial pressure.

3.3.2. Fixed Axial Pressure

The flow rate change curves of different crack modes and confining pressure values with axial pressures of 40 MPa and 10 MPa are shown in Figure 29. The flow rate change rule was similar under axial pressures of 40 MPa and 10 MPa, but the flow rate value was significantly higher under 10 MPa compared to 40 MPa. This indicates that the flow rate decreases with an increase in axial pressure. The seepage flow rate was, in order from large to small, type Ⅲ, type Ⅱ, type Y, 70-degree, and then type Ⅰ. As the confining pressure decreased, the seepage flow rate gradually increased and the increment of the seepage flow rate also increased.

3.3.3. Fixed Confining Pressure

The flow rate change curves of different crack modes and axial pressures with confining pressures of 20 MPa and 10 MPa are shown in Figure 30. The flow rate change rule was similar with confining pressures of 20 MPa and 10 MPa, but the flow rate value was significantly higher under 10 MPa compared to 20 MPa. This indicates that the flow rate increases as the confining pressure decreases. The seepage flow rate was in the order of type Ⅲ, type Ⅱ, type Y, 70-degree, and then type Ⅰ. As the axial pressure decreased, the seepage flow rate gradually increased and the increment of the seepage flow rate also increased.
When the confining pressure was 10 MPa, the axial pressure decreased from 30 MPa to 5 MPa. The seepage increment of the type Ⅰ crack model was the largest (6.5 × 10⁻⁶), while that of the other four cracks models was about 4 × 10⁻⁶. When the axial pressure was 10 MPa, the confining pressure decreased from 30 MPa to 5 MPa. The seepage increment of the type Ⅲ crack model was the largest (3.058 × 10⁻⁵), while the seepage increment of the 70-degree model was the smallest (1.329 × 10⁻⁵), as shown in Figure 31a. When the confining pressure was 20 MPa, the axial pressure decreased from 30 MPa to 5 MPa. The seepage increment of the type Ⅰ crack model was the largest (3.99 × 10⁻⁶), while that of the other four cracks models was about 2 × 10⁻⁶. When the axial pressure was 20 MPa, the confining pressure decreased from 30 MPa to 5 MPa. The seepage increment of the type Ⅲ crack model was the largest (2.886 × 10⁻⁵), while the seepage increment of the type Ⅰ model was the smallest (1.114 × 10⁻⁵). When the confining pressure was at a constant value (10 MPa in Figure 31a and 20 MPa in Figure 31b) and the axial pressure decreased from 30 MPa to 5 MPa, the seepage increment of the type Ⅰ crack model was the largest, and the seepage increments of the type Ⅲ, type Ⅱ, type Y, and 70-degree crack models were almost stable at the same value, indicating that these crack models have similar levels of sensitivity to axial pressure. The seepage increment (10−5) when the confining pressure reduced from 30 MPa to 5 MPa was an order of magnitude greater than the seepage increment (10−6) when the axial pressure reduced from 30 MPa to 5 MPa (10−6), indicating that the permeability of a crack is more sensitive to confining pressure than to axial pressure. The order of seepage increment from large to small cracks was type Ⅲ, type Ⅱ, type Y, type Ⅰ, and then the 70-degree model, which indicates that the order of sensitivity of the permeability of the crack to the confining pressure was type Ⅲ, type Ⅱ, type Y, type Ⅰ, and then the 70-degree model.
Studying stress-sensitive characteristics is one of the most important issue in mining technology. There are essential differences in seepage characteristics of rocks under unloading and loading conditions. In order to fit the real stress environment of rock mass engineering, the engineering properties of rock under unloading stress path must be studied deeply. In recent years, with the rapid development of computer computing performance, numerical simulation calculation method has been more tried in the field of fractured rock seepage. In this paper, the numerical simulation calculation method was conducted on the basis of a new method for hydraulic parameter fitting and crack reconstruction technology involving the typical experimental failure form. DEM is used to investigated the seepage characteristics of different fracture modes under unloading action. The paper presents an application of a DEM particle method and this type of analysis in an excellent example how DEM can be adopted in order to further understand seepage behavior of fissured rock under the unloading stress path. Permeability of fractured rocks, in addition to stress and crack angles, highly depends on the dimensions, spacing, connectivity, and degree of mineralization of fractures [36]. However, because of the limitations of numerical modelling, such as simplification and assumption in computational models, many influencing factors did not be considered during numerical calculation. In future research, 3D model and more impact factors on the permeability of fractured rock under unloading action should be considered for research in this area.

4. Conclusions

(1) On the basis of crack reconstruction technology involving the typical experimental failure form, this paper presented a new method for hydraulic parameter fitting. The joint hydraulic aperture values of microcracks in rock samples under zero stress were obtained by scanning electron microscopy. The hydraulic parameters of macroscopic cracks were obtained by fitting the results of a triaxial seepage experiment and a numerical simulation. It was found that under the fitting experiment condition, when K (the ratio of the macroscopic crack aperture value to the microscopic joint hydraulic aperture value) <3, changes in the K value had little influence on the joint seepage flow. When K was greater than or equal to 3, there was a quartic polynomial relationship between the flow rate and the K value.
(2) The seepage channel of the model is composed of microscopic cracks and macroscopic cracks. With a decrease in the confining pressure, a large number of vertical microscopic joints change from closed to open. With a decrease in the axial pressure, a large number of horizontal microscopic joints change from closed to open. The horizontal hydraulic aperture was shown to be more sensitive to axial stress than the vertical hydraulic aperture, and the vertical hydraulic aperture was shown to be more sensitive to confining stress than the horizontal hydraulic aperture. The network structure formed under conditions of low stress aids in the formation of the microscopic seepage channel. The main seepage channel in the model is composed of macroscopic cracks. The hydraulic aperture of the macroscopic cracks gradually increases as the level of stress decreases.
(3) For the single crack model with different angles, as the crack angle increases, under the same stress conditions, the seepage flow rate increases continuously, and the seepage flow rate has a cliff-like increase when the crack angle changes from 60 to 70 degrees. As the confining pressure decreases, the increment of the seepage flow rate increases continuously. The sensitivity of the 70–90-degree cracks to the confining pressure is greater than that of the 40–60-degree cracks. With a decrease in axial pressure, the increment of the seepage flow rate increases continuously. The sensitivity of the 40–60-degree cracks to the axial pressure is greater than that of the 70–90-degree cracks. As the axial pressure decreases, the seepage flow increment for the 40–60-degree cracks increases, while that of the 70–90-degree cracks decreases. The sensitivity of the crack to axial stress first increases and then decreases. The sensitivity of the 40–60-degree cracks to axial stress is greater than that of the 70–90-degree cracks. As the confining pressure decreases, the stress sensitivity of the crack to axial stress increases gradually. As the axial pressure decreases, the stress sensitivity of the crack to the confining pressure increases continuously.
(4) The results of the typical crack models indicated that under the same stress conditions, the order of seepage flow rate, from large to small, is type Ⅲ, type Ⅱ, type Y, and then the 70-degree and type Ⅰ models. As the confining pressure decreases, the seepage flow rate and the increment of seepage flow rate increase. As the axial pressure decreases, the seepage flow rate increases, but the increment of seepage flow rate is almost stable at a given value. The increment of the seepage flow rate (10−5) when the confining pressure reduced from 30 MPa to 5 MPa was an order of magnitude greater than the increment of seepage flow rate (10−6) when the axial pressure reduced from 30 MPa to 5 MPa, indicating that the permeability of cracks is more sensitive to the confining pressure than to the axial pressure. The sensitivity of the crack permeability to the confining pressure is, in order from large to small, type Ⅲ, type Ⅱ, type Y, type Ⅰ, and then the 70-degree model.

Author Contributions

D.Z. and S.Z. conceived and designed the research. D.Z. and S.Z. analyzed the data and wrote the paper. G.F. and W.Y. verified the results and polished the article. Q.Z. and S.L. collected the measured data. All of the authors have read and approved the final manuscript.

Funding

The research was financially supported by the National Basic Research Program of China (2015CB251600), the Jiangsu Basic Research Program (Natural Science Foundation, BK20150051), the National Natural Science Foundation (51504240), and the Qing Lan Project (Grant Sujiaoshi (2016) 15).

Acknowledgments

We also thank the Lao Sangou Coal Mine for their support. The authors are also grateful for the helpful comments provided by the anonymous reviewers and the journal’s editors.

Conflicts of Interest

The authors declare no conflicts of interest.

Terminology

TJoint tensile strength
τsJoint shear stress
qFlow rate
aWidth of the joint
WFluid viscosity
lLength of the joint
PPressure between the domains
kPermeability coefficient of the joints
σnNormal stress on the joint
knStiffness of the joints
KIntact bulk modulus
GIntact shear modulus
knNormal stiffness of contacts
ksShear stiffness of contacts
a0Contact hydraulic aperture at zero normal stress
aresResidual hydraulic aperture
amaxMaximum hydraulic aperture
CHAContact hydraulic aperture
FHAFracture hydraulic aperture
RRatio of FHA to CHA

References

  1. Zheng, S.H.; Zhao, Y.S.; Duan, K.L. An experimental study on the permeability law of natural fracture under 3-d stresses. Chin. J. Rock Mech. Eng. 1999, 18, 133–136. [Google Scholar] [CrossRef]
  2. Forster, I.; Enever, J. Hydrogeological Response of Overburden Strata to Underground Mining; Report 1; Office of Energy: Washington, DC, USA, 1992; p. 104. [Google Scholar]
  3. Choi, S.K.; Wold, M.; Wood, J. Modelling of interburden gas flows at Appin Colleiry. In Proceedings of the Symposium on Safety on Mines: The Role of Geology, Newcastle, UK, 24–25 November 1997; pp. 105–117. [Google Scholar]
  4. Xue, Y.; Gao, F.; Liu, X.; Liang, X. Permeability and pressure distribution characteristics of the roadway surrounding rock in the damaged zone of an excavation. Int. J. Min. Sci. Technol. 2017, 27, 211–219. [Google Scholar] [CrossRef]
  5. Xia, B.; Zhang, X.; Yu, B.; Jia, J. Weakening effects of hydraulic fracture in hard roof under the influence of stress arch. Int. J. Min. Sci. Technol. 2018. [Google Scholar] [CrossRef]
  6. Zhao, Y.L. The fluid-solid coupling response in fractured rock mass and its engineering application. In The Introduction, 1st ed.; Science Press: Beijing, China, 2016; pp. 1–6. ISBN 978-7-03-046557-3. [Google Scholar]
  7. Pratt, H.R.; Swolfs, H.S.; Brace, W.F.; Black, A.D.; Handin, J.W. Elastic and transport properties of an in situ jointed granite. Int. J. Rock Mech. Min. 1977, 14, 35–45. [Google Scholar] [CrossRef]
  8. Kranz, R.L.; Frankel, A.D.; Engelder, T.; Scholz, C.H. The permeability of whole and jointed Barre granite. Int. J. Rock Mech. Min. 1979, 18, 225–234. [Google Scholar] [CrossRef]
  9. Chen, X.; Yu, J.; Tang, C.; Li, H.; Wang, S. Experimental and Numerical Investigation of Permeability Evolution with Damage of Sandstone Under Triaxial Compression. Rock Mech. Rock. Eng. 2017, 50, 1529–1549. [Google Scholar] [CrossRef]
  10. Zhu, W.; Wong, T.F. The transition from brittle faulting to cataclastic flow: Permeability evolution. J. Geophys. Res. 1997, 102, 3027–3041. [Google Scholar] [CrossRef] [Green Version]
  11. Zhu, W.; Montesi, L.G.J.; Wong, T.F. Shear-enhanced compaction and permeability reduction: Triaxial extension tests on porous sandstone. Mech. Mater. 1997, 25, 199–214. [Google Scholar] [CrossRef]
  12. Wang, J.A.; Park, H.D. Fluid permeability of sedimentary rocks in a complete stress-strain process. Eng. Geol. 2002, 63, S0013–S7952. [Google Scholar] [CrossRef]
  13. Huang, R.Q.; Huang, D. Experimental research on mechanical properties of granites under unloading condition. Chin. J. Rock Mech. Eng. 2008, 27, 2205–2213. [Google Scholar] [CrossRef]
  14. Jin, Y.U.; Hong, L.I.; Xu, C.; Cai, Y.Y.; Mu, K.; Zhang, Y.Z. Experimental study of permeability and acoustic emission characteristics of sandstone during processes of unloading confining pressure and deformation. Chin. J. Rock Mech. Eng. 2014, 33, 69–79. [Google Scholar] [CrossRef]
  15. Yin, G.; Jiang, C.; Wang, J.G.; Xu, J. Geomechanical and flow properties of coal from loading axial stress and unloading confining pressure tests. Int. J. Rock Mech. Min. 2015, 76, 155–161. [Google Scholar] [CrossRef]
  16. Zhang, P.; Yang, T.; Yu, Q.; Xu, T.; Shi, W.; Li, S. Study of a Seepage Channel Formation Using the Combination of Microseismic Monitoring Technique and Numerical Method in Zhangmatun Iron Mine. Rock Mech. Rock. Eng. 2016, 49, 1–10. [Google Scholar] [CrossRef]
  17. Qu, Q.; Xu, J.; Wu, R.; Qin, W.; Hu, G. Three-zone characterisation of coupled strata and gas behaviour in multi-seam mining. Int. J. Rock Mech. Min. 2015, 78, 91–98. [Google Scholar] [CrossRef]
  18. Adhikary, D.P.; Guo, H. Modelling of Longwall Mining-Induced Strata Permeability Change. Rock Mech. Rock. Eng. 2015, 48, 345–359. [Google Scholar] [CrossRef]
  19. Lisjak, A.; Grasselli, G. A review of discrete modeling techniques for fracturing processes in discontinuous rock masses. J. Rock Mech. Geotech. Eng. 2014, 6, 301–314. [Google Scholar] [CrossRef] [Green Version]
  20. Jing, L.; Hudson, J.A. Numerical methods in rock mechanics. Int. J. Rock Mech. Min. Sci. 2002, 39, 409–427. [Google Scholar] [CrossRef]
  21. Bai, Q.S.; Tu, S.H.; Zhang, C. DEM investigation of the fracture mechanism of rock disc containing hole(s) and its influence on tensile strength. Theor. Appl. Fract. Mech. 2016, 86. [Google Scholar] [CrossRef]
  22. Ghazvinian, E.; Diederichs, M.S.; Quey, R. 3D random Voronoi grain-based models for simulation of brittle rock damage and fabric-guided microfracturing. J. Rock Mech. Geotech. Eng. 2014, 6, 506–521. [Google Scholar] [CrossRef]
  23. Itasca Consulting Group Inc. UDEC: Universal Distinct Element Code; Version 5.0; ICG: Minneapolis, MN, USA, 2011. [Google Scholar]
  24. Damjanac, B.; Fairhurst, C. Evidence for a long-term strength threshold in crystalline rock. Rock Mech. Rock Eng. 2010, 43, 513–531. [Google Scholar] [CrossRef]
  25. Kazerani, T.; Yang, Z.Y.; Zhao, J.A. discrete element model for predicting shear strength and degradation of rock joint by using compressive and tensile test data. Rock Mech. Rock Eng. 2012, 45, 695–709. [Google Scholar] [CrossRef]
  26. Abdollahipour, A.; Marji, M.F.; Bafghi, A.Y. DEM simulation of confining pressure effects on crack opening displacement in hydraulic fracturing. Int. J. Min. Sci. Technol. 2016, 26, 557–561. [Google Scholar] [CrossRef]
  27. Zhang, S.; Tang, S.J.; Zhang, D.S.; Fan, G.W.; Wang, Z. Determination of the Height of the Water-Conducting Fractured Zone in Difficult Geological Structures: A Case Study in Zhao Gu No. 1 Coal Seam. Sustainability 2017, 9, 1077. [Google Scholar] [CrossRef]
  28. Yao, C.; Jiang, Q.H.; Shao, J.F. Numerical simulation of damage and failure in brittle rocks using a modified rigid block spring method. Comput. Geotech. 2015, 64, 48–60. [Google Scholar] [CrossRef]
  29. Zhang, C.; Tu, S.; Zhang, L.; Chen, M. A study on effect of seepage direction on permeability stress test. Arab. J. Sci. Eng. 2016, 41, 1–14. [Google Scholar] [CrossRef]
  30. Zhang, S.; Zhang, D.; Wang, Z.; Chen, M. Influence of stress and water pressure on the permeability of fissured sandstone under hydromechanical coupling. Mine Water Environ. 2018, 37, 1–12. [Google Scholar] [CrossRef]
  31. Gao, F.Q.; Stead, D. The application of a modified Voronoi logic to brittle fracture modelling at the laboratory and field scale. Int. J. Rock Mech. Min. 2014, 68, 1–14. [Google Scholar] [CrossRef]
  32. Gao, F.Q. Simulation of Failure Mechanisms Around Underground Coal Mine Openings Using Discrete Element Modelling. Ph.D. Dissertation, Simon Fraser University, Burnaby, BC, Canada, 2013. [Google Scholar]
  33. Bai, Q.S.; Tu, S.H.; Zhang, C. Discrete element modeling of progressive failure in a wide coal roadway from water-rich roofs. Int. J. Coal Geol. 2016, 167, 215–229. [Google Scholar] [CrossRef]
  34. Wang, Z. Study on Permeability Evolution Law of Overlying Strata under Ultra-Thick Seam Mining in Laosangou Coal Mine. Master’s Thesis, China University of Mining and Technology, Xuzhou, China, 2017. [Google Scholar]
  35. Xie, H.P.; Chen, Z.D. Analysis of Rock Fracture Micro-Mechanism. J. China Coal Soc. 1989, 14, 57–67. [Google Scholar] [CrossRef]
  36. Ramandi, H.L.; Mostaghimi, P.; Armstrong, R.; Saadatfar, M.; Pinczewski, W.V. Porosity and permeability characterization of coal: A micro-computed tomography study. Int. J. Coal Geol. 2016, 154–155, 57–68. [Google Scholar] [CrossRef]
Figure 1. Geological situation of the study area. (a) Location of the study site. (b) Plan of drill hole distribution. (c) Stratigraphic column.
Applsci 09 00641 g001aApplsci 09 00641 g001b
Figure 2. Contact constitutive model. (a) Normal and shear stiffness between blocks. (b) Constitutive behavior in terms of shear and tension (i = s, n) [19].
Applsci 09 00641 g002
Figure 3. The fluid flow rate of contact.
Applsci 09 00641 g003
Figure 4. The contact hydraulic aperture.
Applsci 09 00641 g004
Figure 5. Relationship between the normal stress and hydraulic aperture of the joints.
Applsci 09 00641 g005
Figure 6. Calibration of the numerical model to the uniaxial compression tests: (a) failure pattern of the laboratory sample; (b) failure pattern of the numerical model; and (c) stress–strain curve of the numerical model.
Applsci 09 00641 g006
Figure 7. Calibration of the numerical model to the Brazilian tests: (a) failure pattern of the laboratory sample; (b) failure pattern of the numerical model; and (c) stress–strain curve of the numerical model.
Applsci 09 00641 g007
Figure 8. Post-peak fracture rock sample and reconstruction model. (a) the outline of the crack (b) Joint groups (c) Seepage calculation model.
Applsci 09 00641 g008
Figure 9. Microscopic crack structure of rock samples.
Applsci 09 00641 g009
Figure 10. Flow rate change curves of the fitting model.
Applsci 09 00641 g010
Figure 11. Single crack model with different angles: (a) design scheme and (b) calculation model.
Applsci 09 00641 g011
Figure 12. Seepage calculation model based on the experimental typical failure form: (a) type I; (b) type II; (c) type III; and (d) type Y.
Applsci 09 00641 g012
Figure 13. Stress path of the seepage experiment.
Applsci 09 00641 g013
Figure 14. Seepage results with different crack angles.
Applsci 09 00641 g014
Figure 15. Joint hydraulic aperture values.
Applsci 09 00641 g015
Figure 16. Main seepage channel.
Applsci 09 00641 g016
Figure 17. Joint hydraulic aperture values. (a) 45–25 MPa. (b) 20–0 MPa.
Applsci 09 00641 g017
Figure 18. Flow rate change curves with a 60-degree crack: (a) variation in flow rate with the axial pressure and (b) variation in flow rate with the confining pressure.
Applsci 09 00641 g018
Figure 19. Flow rate change curves with a 70-degree crack: (a) variation in flow rate with the axial pressure and (b) variation in flow rate with the confining pressure.
Applsci 09 00641 g019
Figure 20. Flow rate change curves of different angles: (a) axial pressure 40 MPa and (b) axial pressure 10 MPa.
Applsci 09 00641 g020
Figure 21. Flow rate change curves of different angles: (a) confining pressure of 20 MPa and (b) confining pressure of 10 MPa.
Applsci 09 00641 g021
Figure 22. Average joint aperture values of different angle crack models.
Applsci 09 00641 g022
Figure 23. Change curve of the average joint hydraulic aperture value: (a) 60-degree crack angle and (b) 70 degree crack angle.
Applsci 09 00641 g023
Figure 24. Seepage results of different fracture forms.
Applsci 09 00641 g024
Figure 25. Joint hydraulic aperture.
Applsci 09 00641 g025
Figure 26. Main seepage channel.
Applsci 09 00641 g026
Figure 27. Joint hydraulic aperture. (a) 45–25 MPa and (b) 20–0 MPa.
Applsci 09 00641 g027aApplsci 09 00641 g027b
Figure 28. Flow rate change curves of the Y-type crack model: (a) variation in flow rate with the axial pressure and (b) variation in flow rate with the confining pressure.
Applsci 09 00641 g028
Figure 29. Flow rate change curves of different crack modes: (a) axial pressure of 40 MPa and (b) axial pressure of 10 MPa.
Applsci 09 00641 g029
Figure 30. Flow rate change curves of different crack modes: (a) confining pressure of 20 MPa and (b) confining pressure of 10 MPa.
Applsci 09 00641 g030
Figure 31. Contrast diagram of the seepage flow increment when the stress level changed from 30 MPa to 5 MPa. (a) 10 MPa and (b) 20 MPa.
Applsci 09 00641 g031
Table 1. Mechanical parameters obtained by sample fitting with the numerical model.
PropertiesValues
Intact bulk modulus, K (GPa)6.5
Intact shear modulus, G (GPa)2.8
Normal stiffness of contacts, kn (GPa/m)6100.0
Shear stiffness of contacts, ks (GPa/m)2440.0
Contact cohesion, ccont (MPa)29.4
Contact friction angle, Φcont (◦)29.0
Contact tensile strength, σtcont (MPa)6.9
Residual cohesion (MPa)2.0
Residual friction (°)15.0
Residual tension (MPa)0.0
Contact hydraulic aperture at zero normal stress, a0 (m)7.02 × 10⁻⁶
Residual hydraulic aperture, ares (m)1 × 10⁻⁷
Table 2. Seepage experimental parameters.
LithologyConfining PressureOsmotic Pressure DifferencePeak StressPost-Peak Permeability
gritstone12 MPa2 MPa82 MPa4.0 × 10−13 cm2

