Article

Classification of Corn Stalk Lodging Resistance Using Equivalent Forces Combined with SVD Algorithm

1
College of Mechanical and Electrical Engineering, Henan Agricultural University, Zhengzhou 450002, China
2
Agronomy College of Henan Agricultural University, Zhengzhou 450002, China
3
State Key Laboratory of Wheat and Maize Crop Science, Zhengzhou 450002, China
*
Authors to whom correspondence should be addressed.
Appl. Sci. 2019, 9(4), 640; https://doi.org/10.3390/app9040640
Submission received: 23 December 2018 / Revised: 10 February 2019 / Accepted: 12 February 2019 / Published: 14 February 2019

Abstract

:
Corn stalk lodging, which involves the breakage of the stalk below the ear following either bad weather, insect infestation or stormy rain, usually leads to harvest loss, increased harvesting time and higher drying costs. The objective of this study was to develop a method that can classify corn stalk lodging resistance. This method, which employed the maximum equivalent force exerted on a corn stalk, corresponding stalk agronomic traits, and the singular value decomposition (SVD) algorithm, showed that the five corn varieties with different stalk lodging resistance from two planting densities of 60,000 plants/ha and 75,000 plants/ha can be effectively classified. A customized device was designed to measure the equivalent forces. Three factors, including the planting density, the stalk diameter, and the maximum equivalent force with comprehensive contributions of −0.4603, 0.4196 and 0.4068, which are related to principal components, play an important role in the classification of corn stalk lodging resistance. The results showed that the corn stalk lodging resistance decreased with increase in planting density; however, with the increase in stalk diameter and maximum equivalent force, the lodging resistance significantly increased. Corn breeders can develop higher lodging resistance-based corn varieties by using this approach.

Graphical Abstract

1. Introduction

Reduction of yield in corn at harvest has been estimated from 5% to 20% per year globally [1]. Stalk lodging resistance is one of the major factors that influence on both yield and quality of corn. Accurate information about the properties of corn stalk lodging resistance has not been obtained due to field experimental limitations [2]. As is already known, the strength of the corn’s stalk is associated with internode length and thickness [3]. Consequently, the stalk lodging rate is influenced by the same factors (i.e., internode length and thickness). Both stalk and root lodging occur under strong winds before harvest. Fracture or recurrent arching of the lower stalk internodes are known to be two causes of stalk lodging. Root lodging refers to stalks leaning from the crown, and involves a certain disturbance of the root system. In the past, selection of corn varieties possessing high lodging resistance depended on counting lodged plants by harvest [4]. This method, however, is disadvantageous, as a high coefficient of variation is frequently produced by various uncontrolled environmental factors such as wind and rain storms [5,6,7]. For instance, a harsh wind storm may lead to flattening of a whole corn field irrespective of the lodging resistance of stalks in the field, and therefore makes it hard to discriminate stronger varieties from weaker ones [8,9,10]. Wind-induced corn stalk lodging often occurs during the mid-growing season, when soil has been saturated by heavy rainfall and the rainfall is accompanied or followed by a high wind speed [11,12,13].
At present, wind tunnel experiment in a laboratory is used in approximating the stalk lodging characteristics [14,15]. In this method (i.e., wind tunnel experiment), a direct relationship is deduced between the stalk lodging resistance and the wind speed [16,17]. Though the wind tunnel experiments are useful in intuitively determining the stalk lodging resistance in corn, it has a drawback in that it is unsuitable for on-site quantitative studies [18]. Other laboratory measurements of stalk lodging resistance include hydraulic machinery, such as stalk crushing strength (SCS) and rind penetrometer resistance (RPR), which provides mechanical characteristics of corn stalks [19,20,21,22]. For rapid corn stalk lodging resistance measurements, a stalk hardness meter was developed, and it showed that the stalk strength decreased with planting density increase for the same corn varieties [23,24]. Mechanical measurements of stalk strengths are time-consuming methods, and at the same time destructive (crush the stalk or physically break) [25,26]. Moreover, rind penetration resistance, a method that has been used for many years, cannot fully show how corn stalk lodging is related to the natural wind due to the influence of probe shapes [27,28].
Rapid advances in lodging resistance measurement can be attained by establishing new testing procedures that approximate stalk lodging resistance without any influence from environmental factors [29]. A portable instrument for real-time measurement of corn stalk bending strength has been demonstrated successfully [30]. However, in order to solve problems caused by any single factor that was chosen to classify the stalk lodging resistance, the present study proposes a novel method for estimating corn stalk lodging properties by employing the singular value decomposition (SVD) algorithm and how it can be used in classifying corn varieties. This classification method does not only consider corn stalk lodging in relation to stalk resistance, but also provides a potential selective plant breeding tool for agricultural scientists.

2. Materials and Methods

2.1. Experimental Samples

In this experiment design, five varieties of corn labeled Zhengdan958 (ZD958), Xianyu335 (XY335), Yudan606 (YD606), Xundan20 (XD20), and Denghai605 (DH605) were chosen for conducting experiments. Corn experiment plots of 6 m long with 6 rows 0.6 m wide with a plant distribution of two planting densities, 60,000 plants/ha and 75,000 plants/ha were considered. Different varieties of corn were grown in the Science and Education Farm of Henan Agriculture University, Zhengzhou (113.66° E, 34.76° N). Fertilizers containing the same nutrients and components were applied on the corn samples throughout the course of their growth (10.8 g/kg organic matter, 0.93 g/kg nitrogen (N), 25 mg/kg phosphorus (P) and 125 mg/kg potassium (K)). The corn stalks in the stage of silking (20 days prior to maturity) were applied for these experiments in 2016 and 2017, respectively. For standardization, the pull force was applied at the level of 440 mm along the corn stalks above the ground.

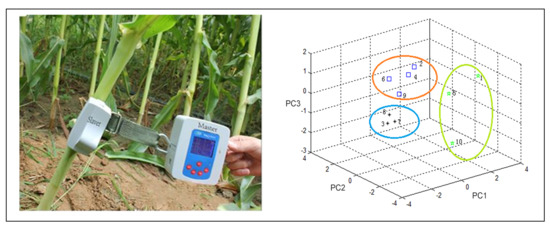
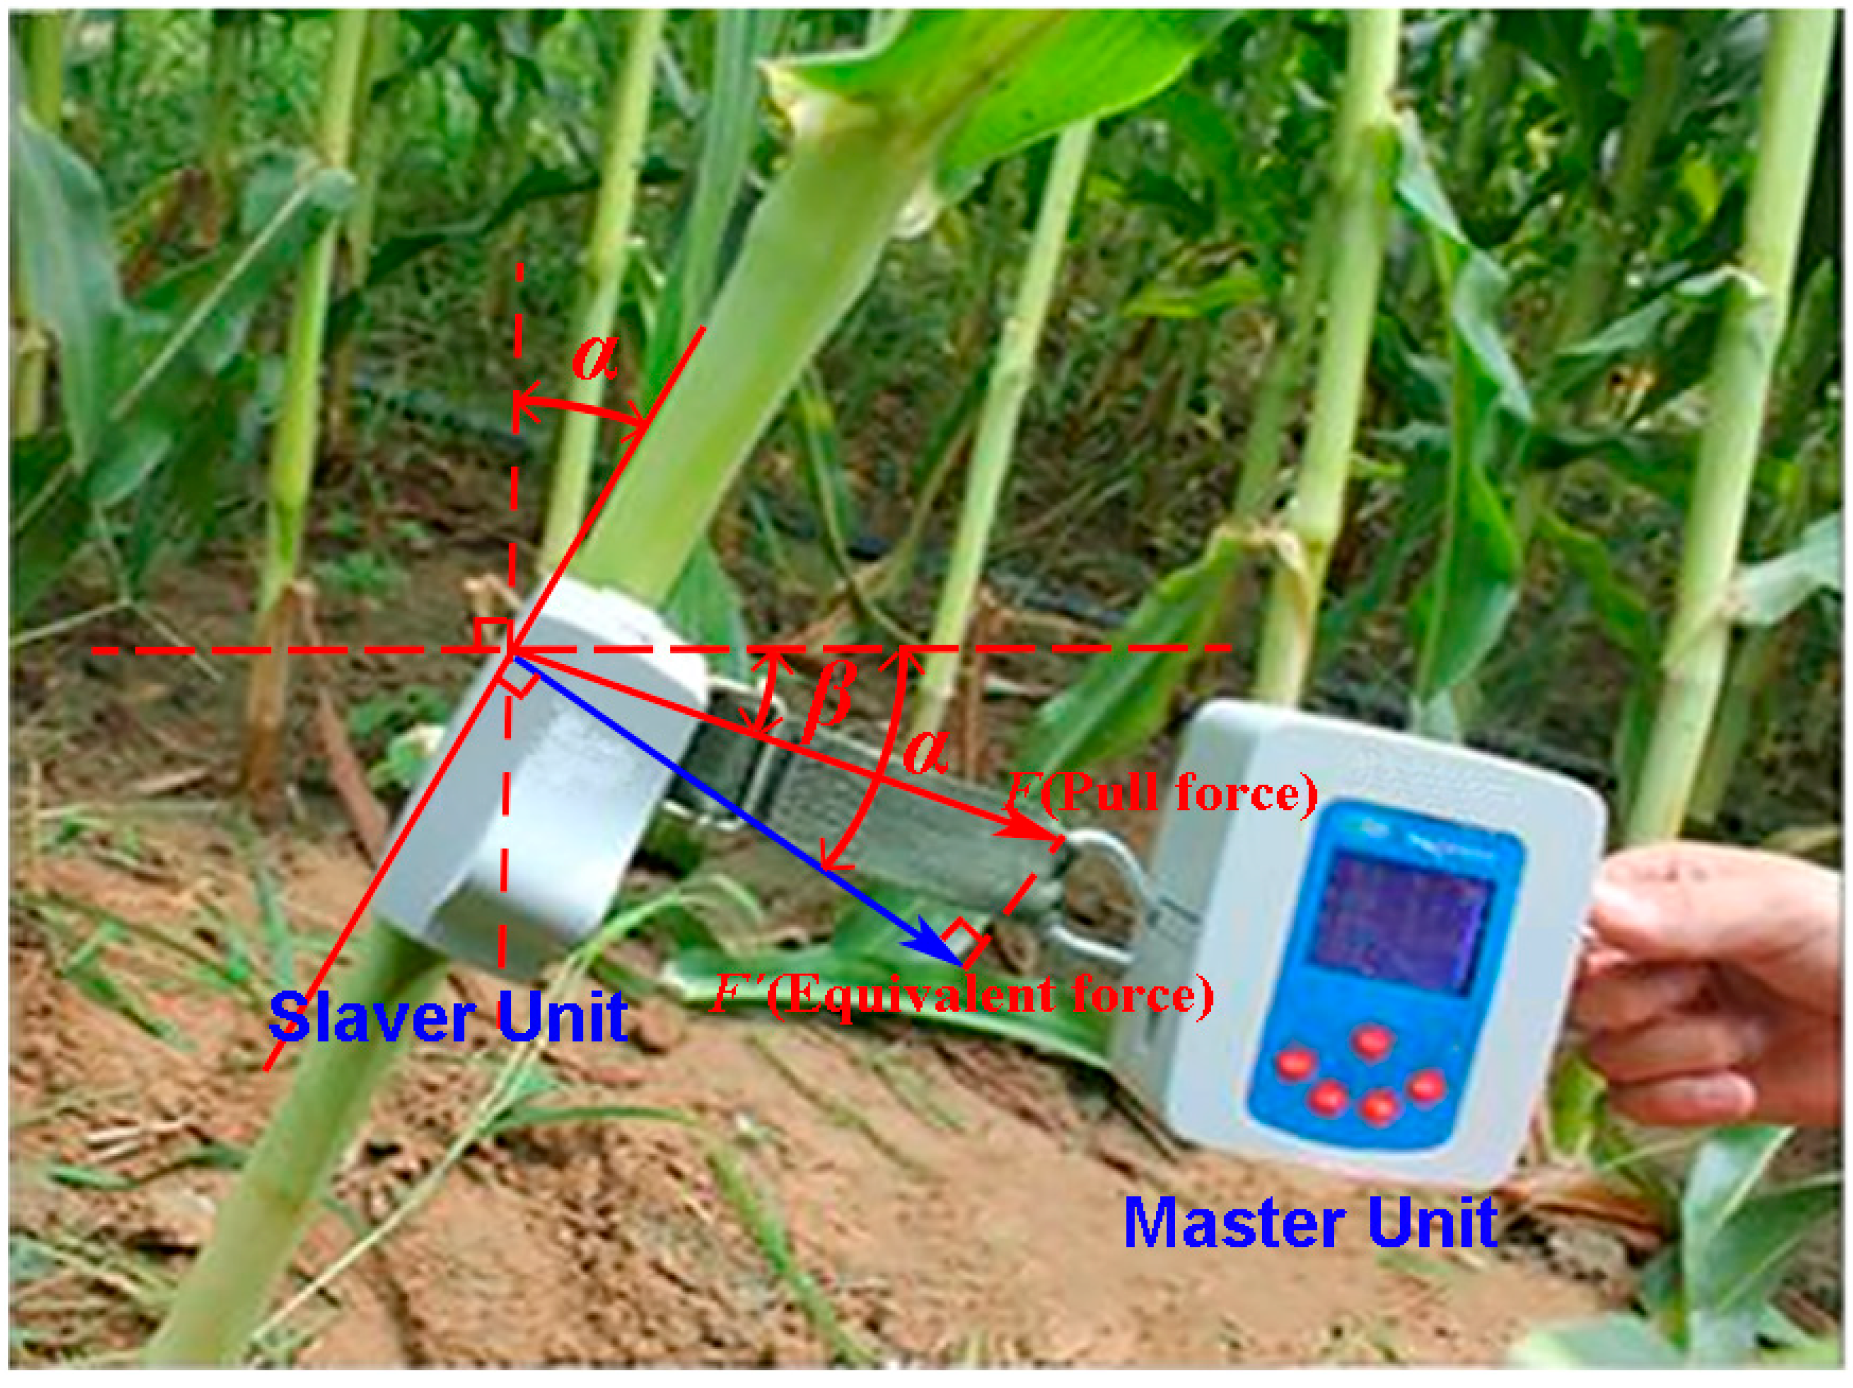
2.2. Measurement of Equivalent Forces Exerted on Corn Stalks

A schematic diagram of equivalent force is depicted in Figure 1; the Slaver unit was fixed on the corn stalk with an inelastic belt, which is also connected to the strain sensor by a hook during the field measurement. After the Slaver unit and the Master unit were fixed on, a well-distributed force was exerted on the stalk by the operator to avoid the high dynamic tension in the measurement process. The pull force vector F was measured by the Master unit along with the Slaver. A downward vector along with the corn stalk, and a rightward vector perpendicular to the corn stalk, form the pull force vector F. Both downward and rightward vectors are independent of each other and have an influence upon the corn stalk in the bending process when the pull force is exerted on the corn stalk. In order to evaluate the stalk lodging properties, an equivalent pull force was calculated (Equation (1)) to eliminate the influence caused by the direction of pull force. For normalization, the pull force was applied at 440 mm up the corn stalk from the ground. In this experiment, the stalk lodging angles were fluctuated in the range of 0° to 45° in the vertical plane. The angle β and stalk lodging angle α were monitored by the home-made device at the same time. The stalk lodging angle α, monitored by the single axis angle sensor 2 (SCA60C-N1000060), was transmitted by RF transceiver 2 (NRF24L01), which was mounted inside the Slaver unit, to RF transceiver 1 (NRF24L01) in the Master unit. The original pull force F, measured by the strain sensor (JLBS-5Kg), and angle β, obtained by the single axis angle sensor 1 (SCA60C-N1000060) mounted inside the Master unit, were processed by using the microcontroller (PIC24FV16KA304). The measurement results and equivalent forces were finally displayed on the liquid crystal display (LCD) screen (BJ12864F) in real-time. For the case depicted in Figure 1, the formula for calculating the equivalent force can be written as
F = F cos ( α + β )
where F represents the pull force, α is a positive value measured by the Slaver unit. The angle β is a negative value under the direction of pull force F. Consequently, the influence caused by the directions of pull force is eliminated when the equivalent force is consistently perpendicular to the corn stalk.

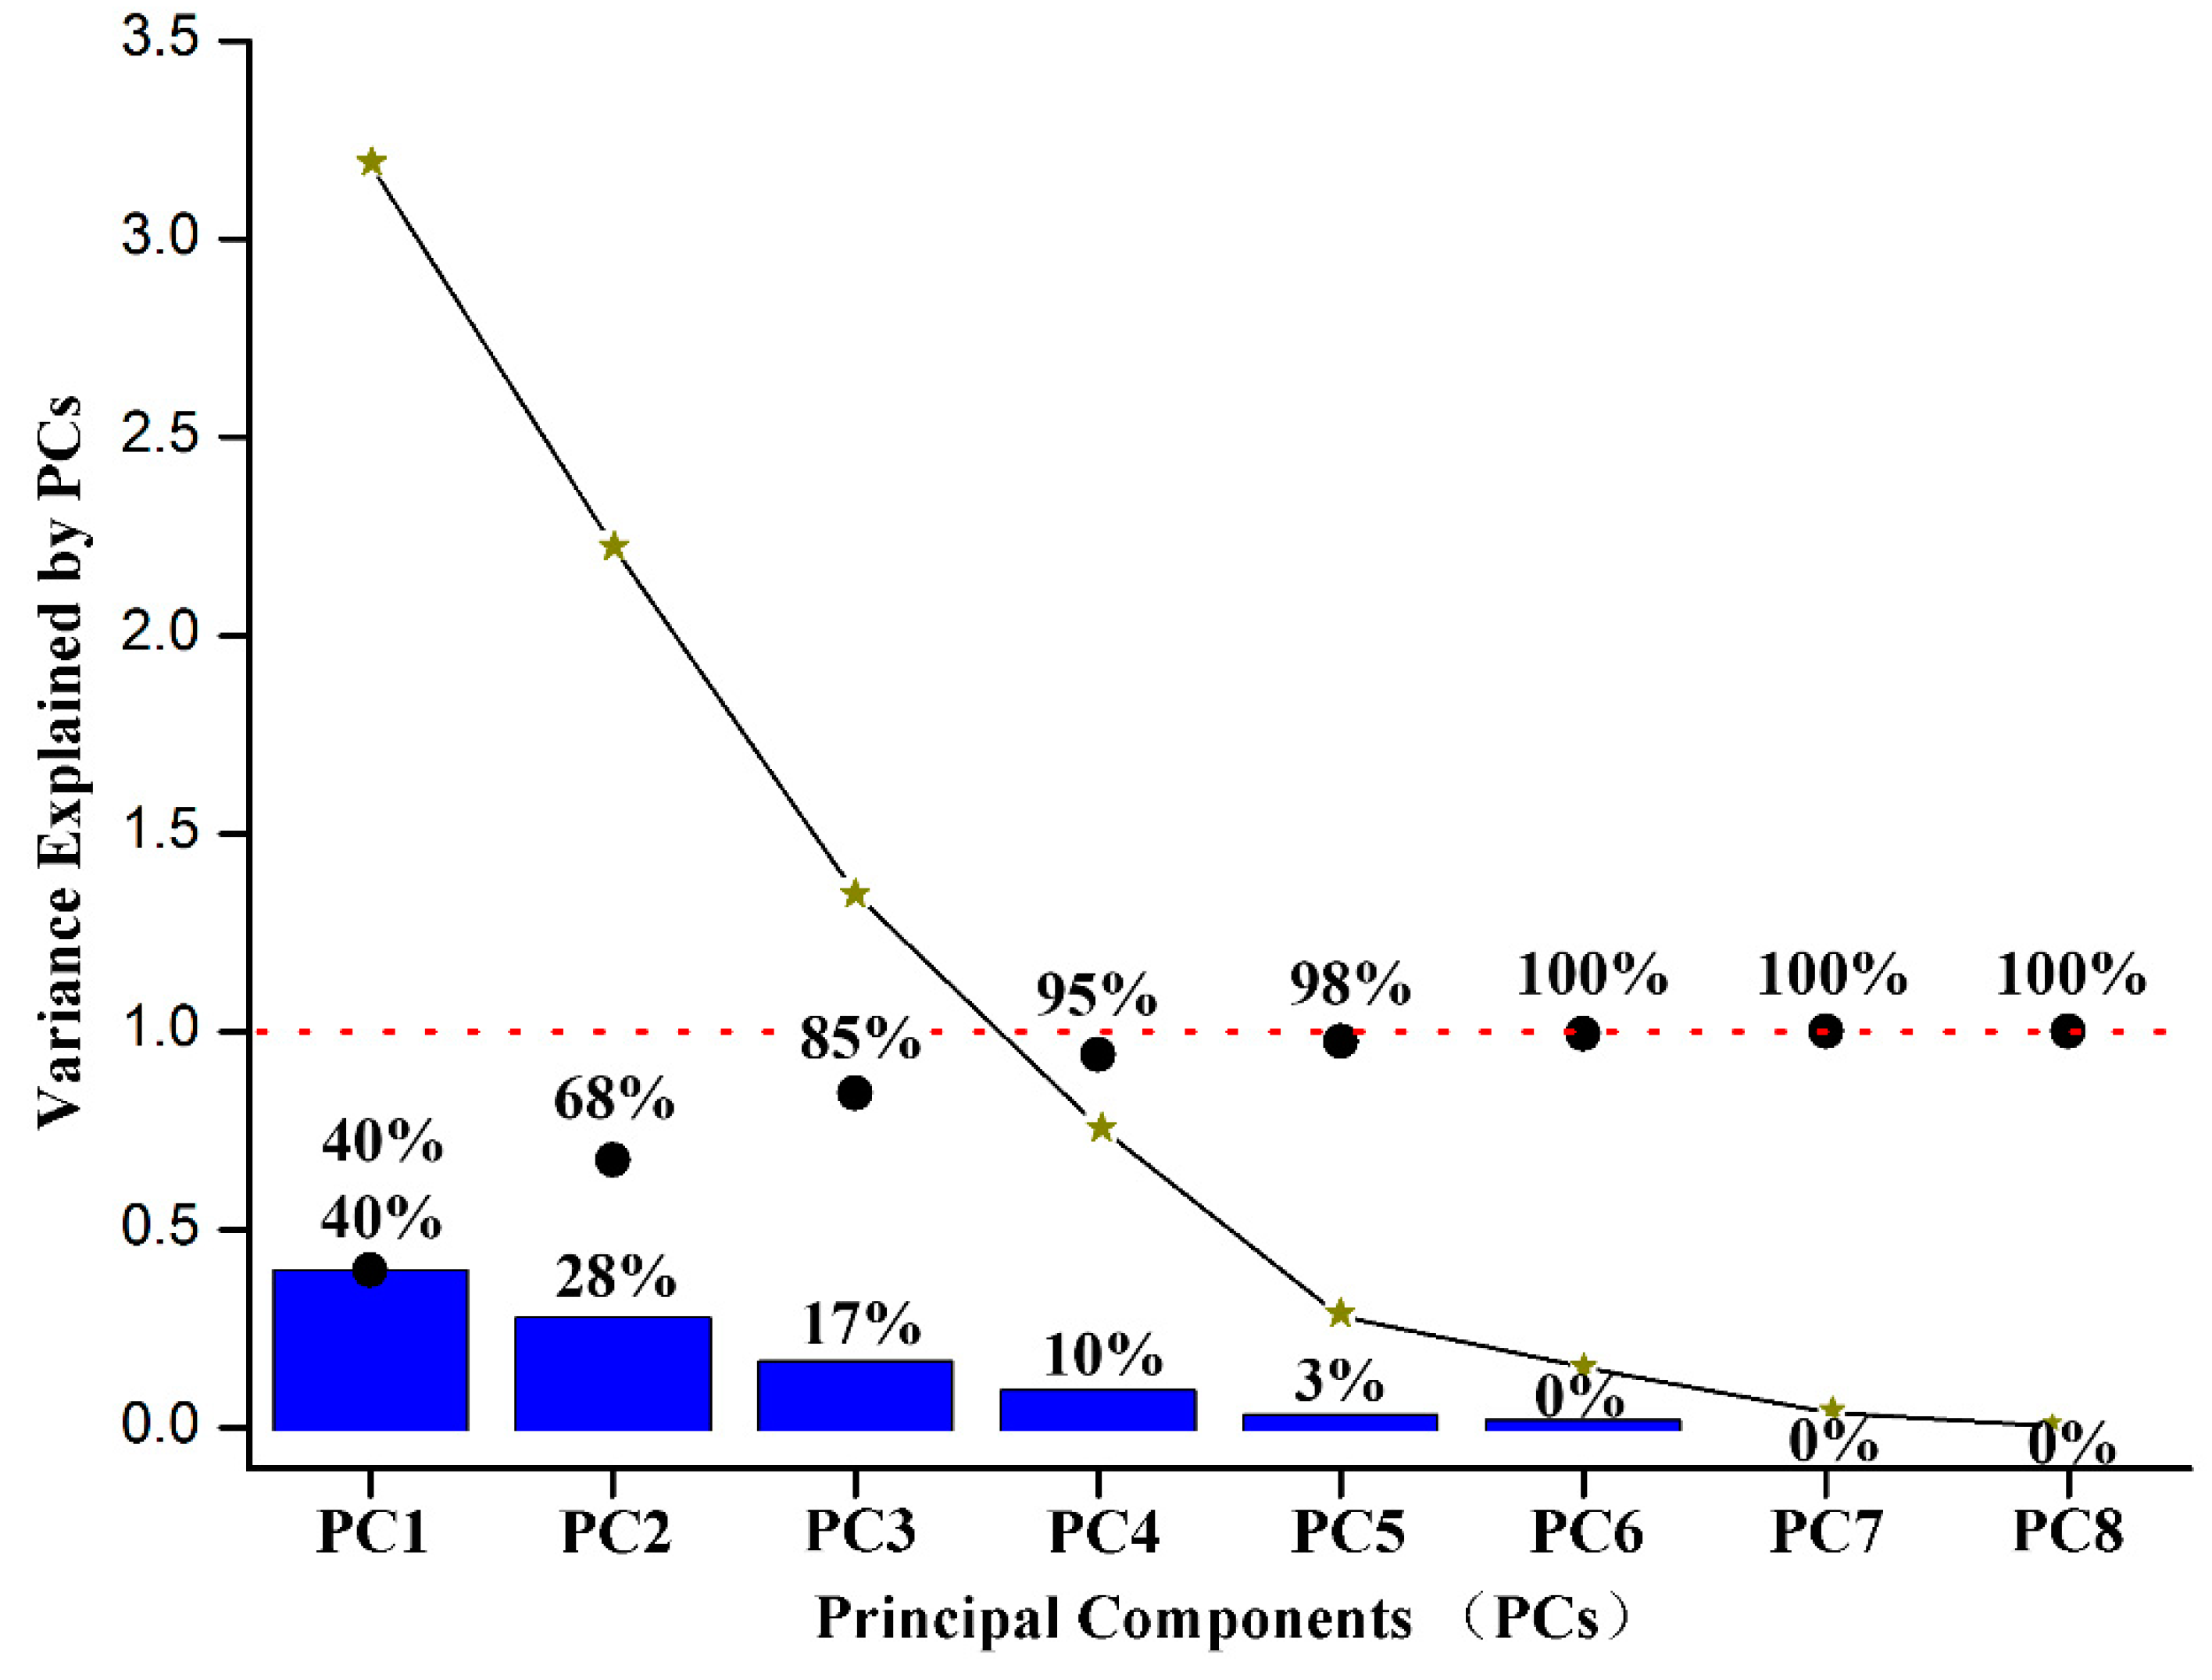
2.3. Singular Value Decomposition Algorithm

In this study, the singular value decomposition (SVD) algorithm was utilized to classify the corn stalk lodging properties of the five corn varieties effectively. X was given by the values of variables obtained from the corn stalks in an m × n matrix (m ≥ n).
X = ( x 11 x 12 x 1 n x 21 x 22 x 2 n x m 1 x m 2 x m n )
where the number of the parameters of corn stalks that were obtained in this experiment is noted as a variable n, and m denotes the sample number of the corn stalks. Accordingly, the standardization matrix X* has the following form written as
X * = ( x * 11 x * 12 x * 1 n x * 21 x * 22 x * 2 n x * m 1 x * m 2 x * m n )
x* in this matrix with asterisks are standardized variables, which calculated by the following formula:
x * = x μ σ
µ is the mean and σ is the standard deviation.
The covariance matrix of the standardized matrix X* can be expressed as:
R = ( r 11 r 12 r 1 n r 21 r 22 r 2 n r m 1 r m 2 r m n )
where the respective rij values of the covariance matrix R are given by the following formula:
r i j = 1 m 1 t = 1 m x t i * x t j * ( i , j = 1 , 2 , , n )
A unique solution can be found by finding the SVD of matrix R. Considering the measurement results of m samples recorded by the home-made device and n features (variables), the whole data set can form a M row, N column matrix, which is denoted by R = U 1 M , 1 M 1 M , 1 N V 1 N , 1 N T . Here, U and V are the normalized eigenvector of the matrix R T R and the matrix R R T , respectively. The eigenvectors denote the contribution of each principal component to the sample. Σ is the square root of the diagonal matrix of the eigenvalues of the matrices R R T and R T R , which indicates the importance of the corresponding principal components.
Principal component analysis (PCA) is a multivariate method that analyzes a data set in which observations are described by several inter-correlated quantitative dependent variables. PCA is applied to extract the important information from the data set and to represent it as a set of new orthogonal variables. Mathematically, PCA depends upon the eigen-decomposition of positive semi-definite matrices and upon the SVD of rectangular matrices. In computational terms, the principal components are found by calculating the eigenvectors and eigenvalues of the data covariance matrix. The eigenvector with the largest eigenvalue is the direction of greatest variation. In this experiment, the eigenvalues obtained by SVD, showed that the variance in the matrix R can be explained by 3 principal components and the first three eigenvalues, and their corresponding eigenvector coefficients were used in the evaluation of the corn’s stalk lodging properties.

3. Results and Discussion

3.1. The Agronomic Traits and Stalk Lodging Properties

In this study, agronomic traits, the maximum equivalent forces, and corresponding stalk lodging angles were measured for the five corn varieties with two planting densities of 60,000 plants/ha and 75,000 plants/ha, respectively. The experimental results indicated in Table 1 are the average values of five repeated measurements in parallel on the same corn variety with a similar growth status.
The results in Table 1 showed that stalk lodging angles varies between 25°~45°among the corn varieties and corresponding planting densities. It can also be seen that the maximum equivalent force, plant height, ear height, ear position coefficient, and internode length decrease with increase in planting densities, whereas stalk diameter exhibited a decreasing trend. It was observed that the stalk diameter was more sensitive to increase in plant density (see Table 1). The plant height, however, displayed slight changes implying that it was insensitive to the planting density. To a certain extent, the corn varieties with superior lodging properties can tolerate higher planting density and have greater yield potential.

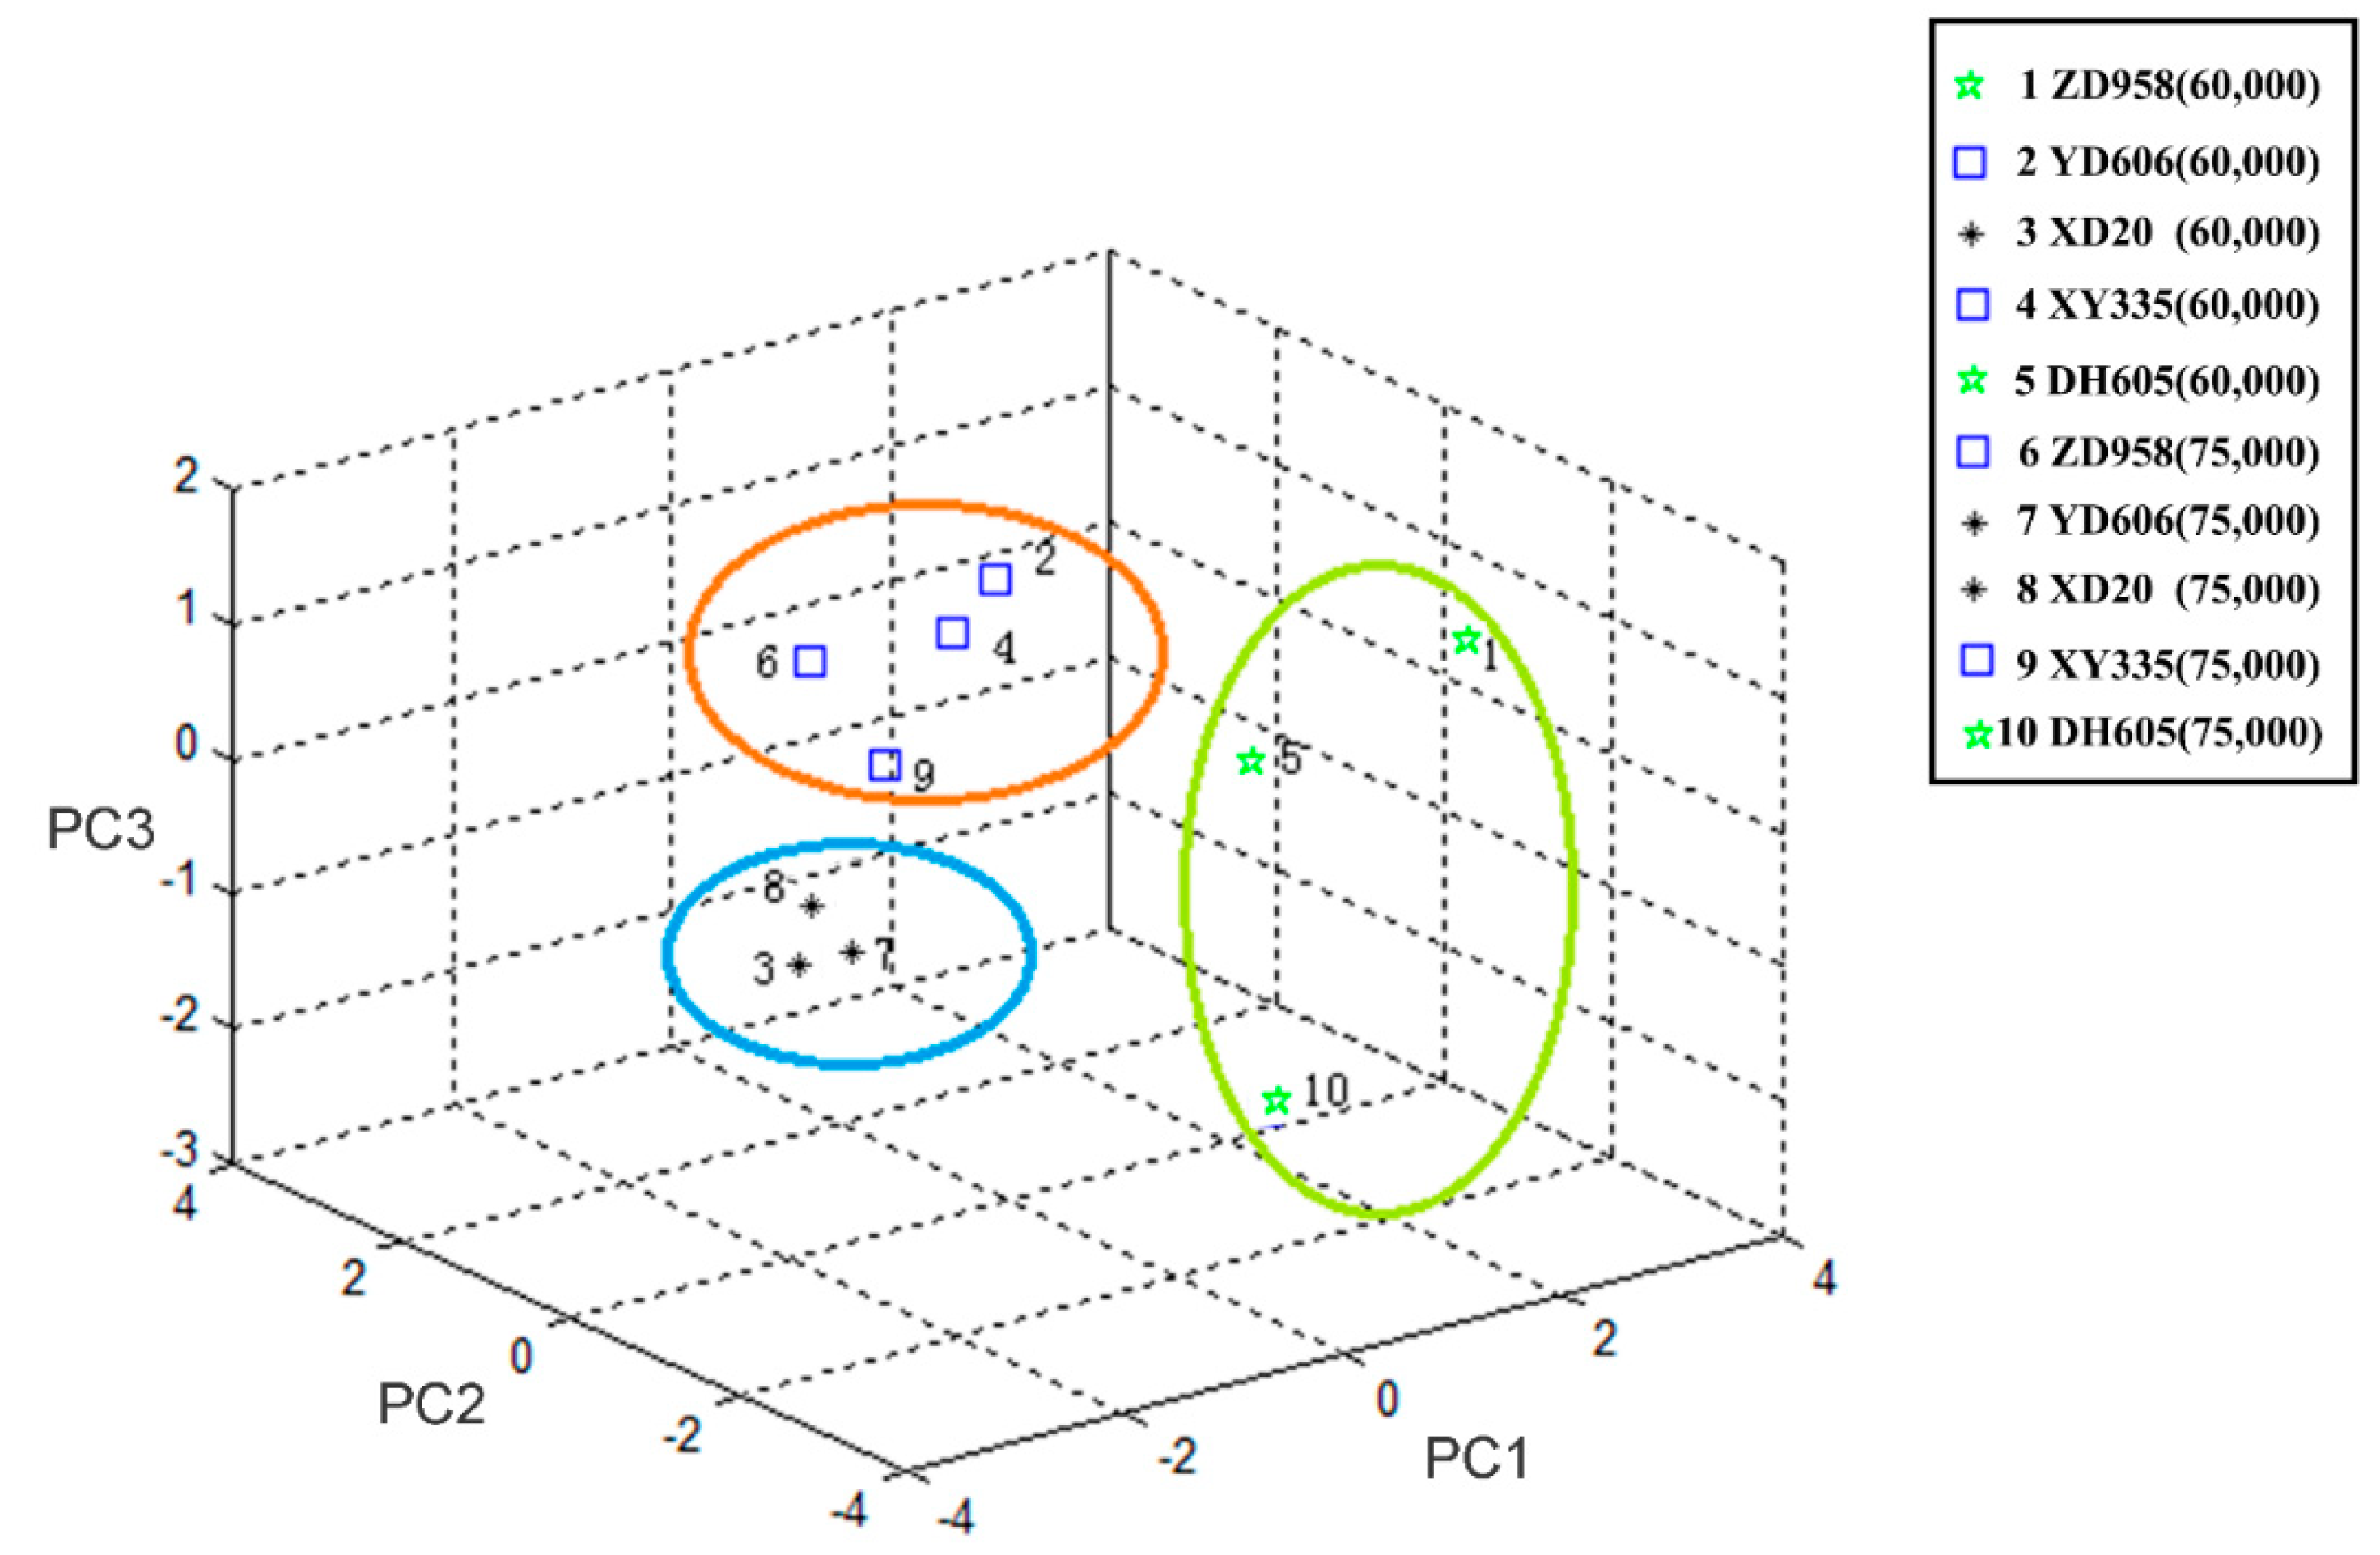
3.2. Classification of Stalk Lodging Resistance

Some multivariate analytical methods can be used by agricultural scientists to classify corn varieties and to search for those with the best stalk lodging properties. From the measurement results, the eigenvalues calculated using the SVD algorithm are displayed in Figure 2. The eigenvalues of the first three principal components are expectedly much higher than the others. These components explain the variations of the experimental results listed in Table 1. The first component (PC1) explains 40% of the variation, the second component (PC2) and third component (PC3) explains 28% and 17% of the variations, respectively. The first three eigenvalues accounted for 85% of the total eigenvalues. Therefore, in the current experiment, a truncation value tr = 3 was used and the first three eigenvalues and their corresponding eigenvector coefficients were used in evaluating the corn’s stalk lodging properties.
A three-dimensional scattering plot of the first three principle components obtained from SVD analysis of the measurement results are shown in Figure 3. The contours of the Gaussian distributions of data are represented by the error ellipses. From the error ellipses, the five corn varieties with two planting densities were evidently identified and segregated. The green ellipse represented corn stalks with high lodging properties such as ZD958 (60,000), DH605 (60,000), and DH605 (75,000). The orange ellipse represented those with medium lodging properties such as YD606 (60,000), XY335 (60,000), ZD958 (75,000), and XY335 (75,000) while blue ellipse represented those corn varieties with low lodging properties of corn stalks such as XD20 (60,000), YD606 (75,000), and XD20 (75,000). The lodging rate was calculated by dividing the number of lodged stalks of corn with the total number of corns in the planting area. The average lodging rates were recorded before harvest in 2016 and 2017 (see Table 2). The one-way analysis of variance (ANOVA) test was applied to verify the significant differences among the average lodging rates. The statistical results show that the average lodging rates of DH605 (60,000), DH605 (75,000), and ZD958 (60,000) were relatively lower than other corn varieties, and the most serious lodging stalks happened in the corn variety of XD20 (75,000), XD20 (60,000), and YD606 (75,000). Obviously, the results of stalk lodging resistance obtained from the SVD algorithm are consistent with the actual results of stalk lodging rate.

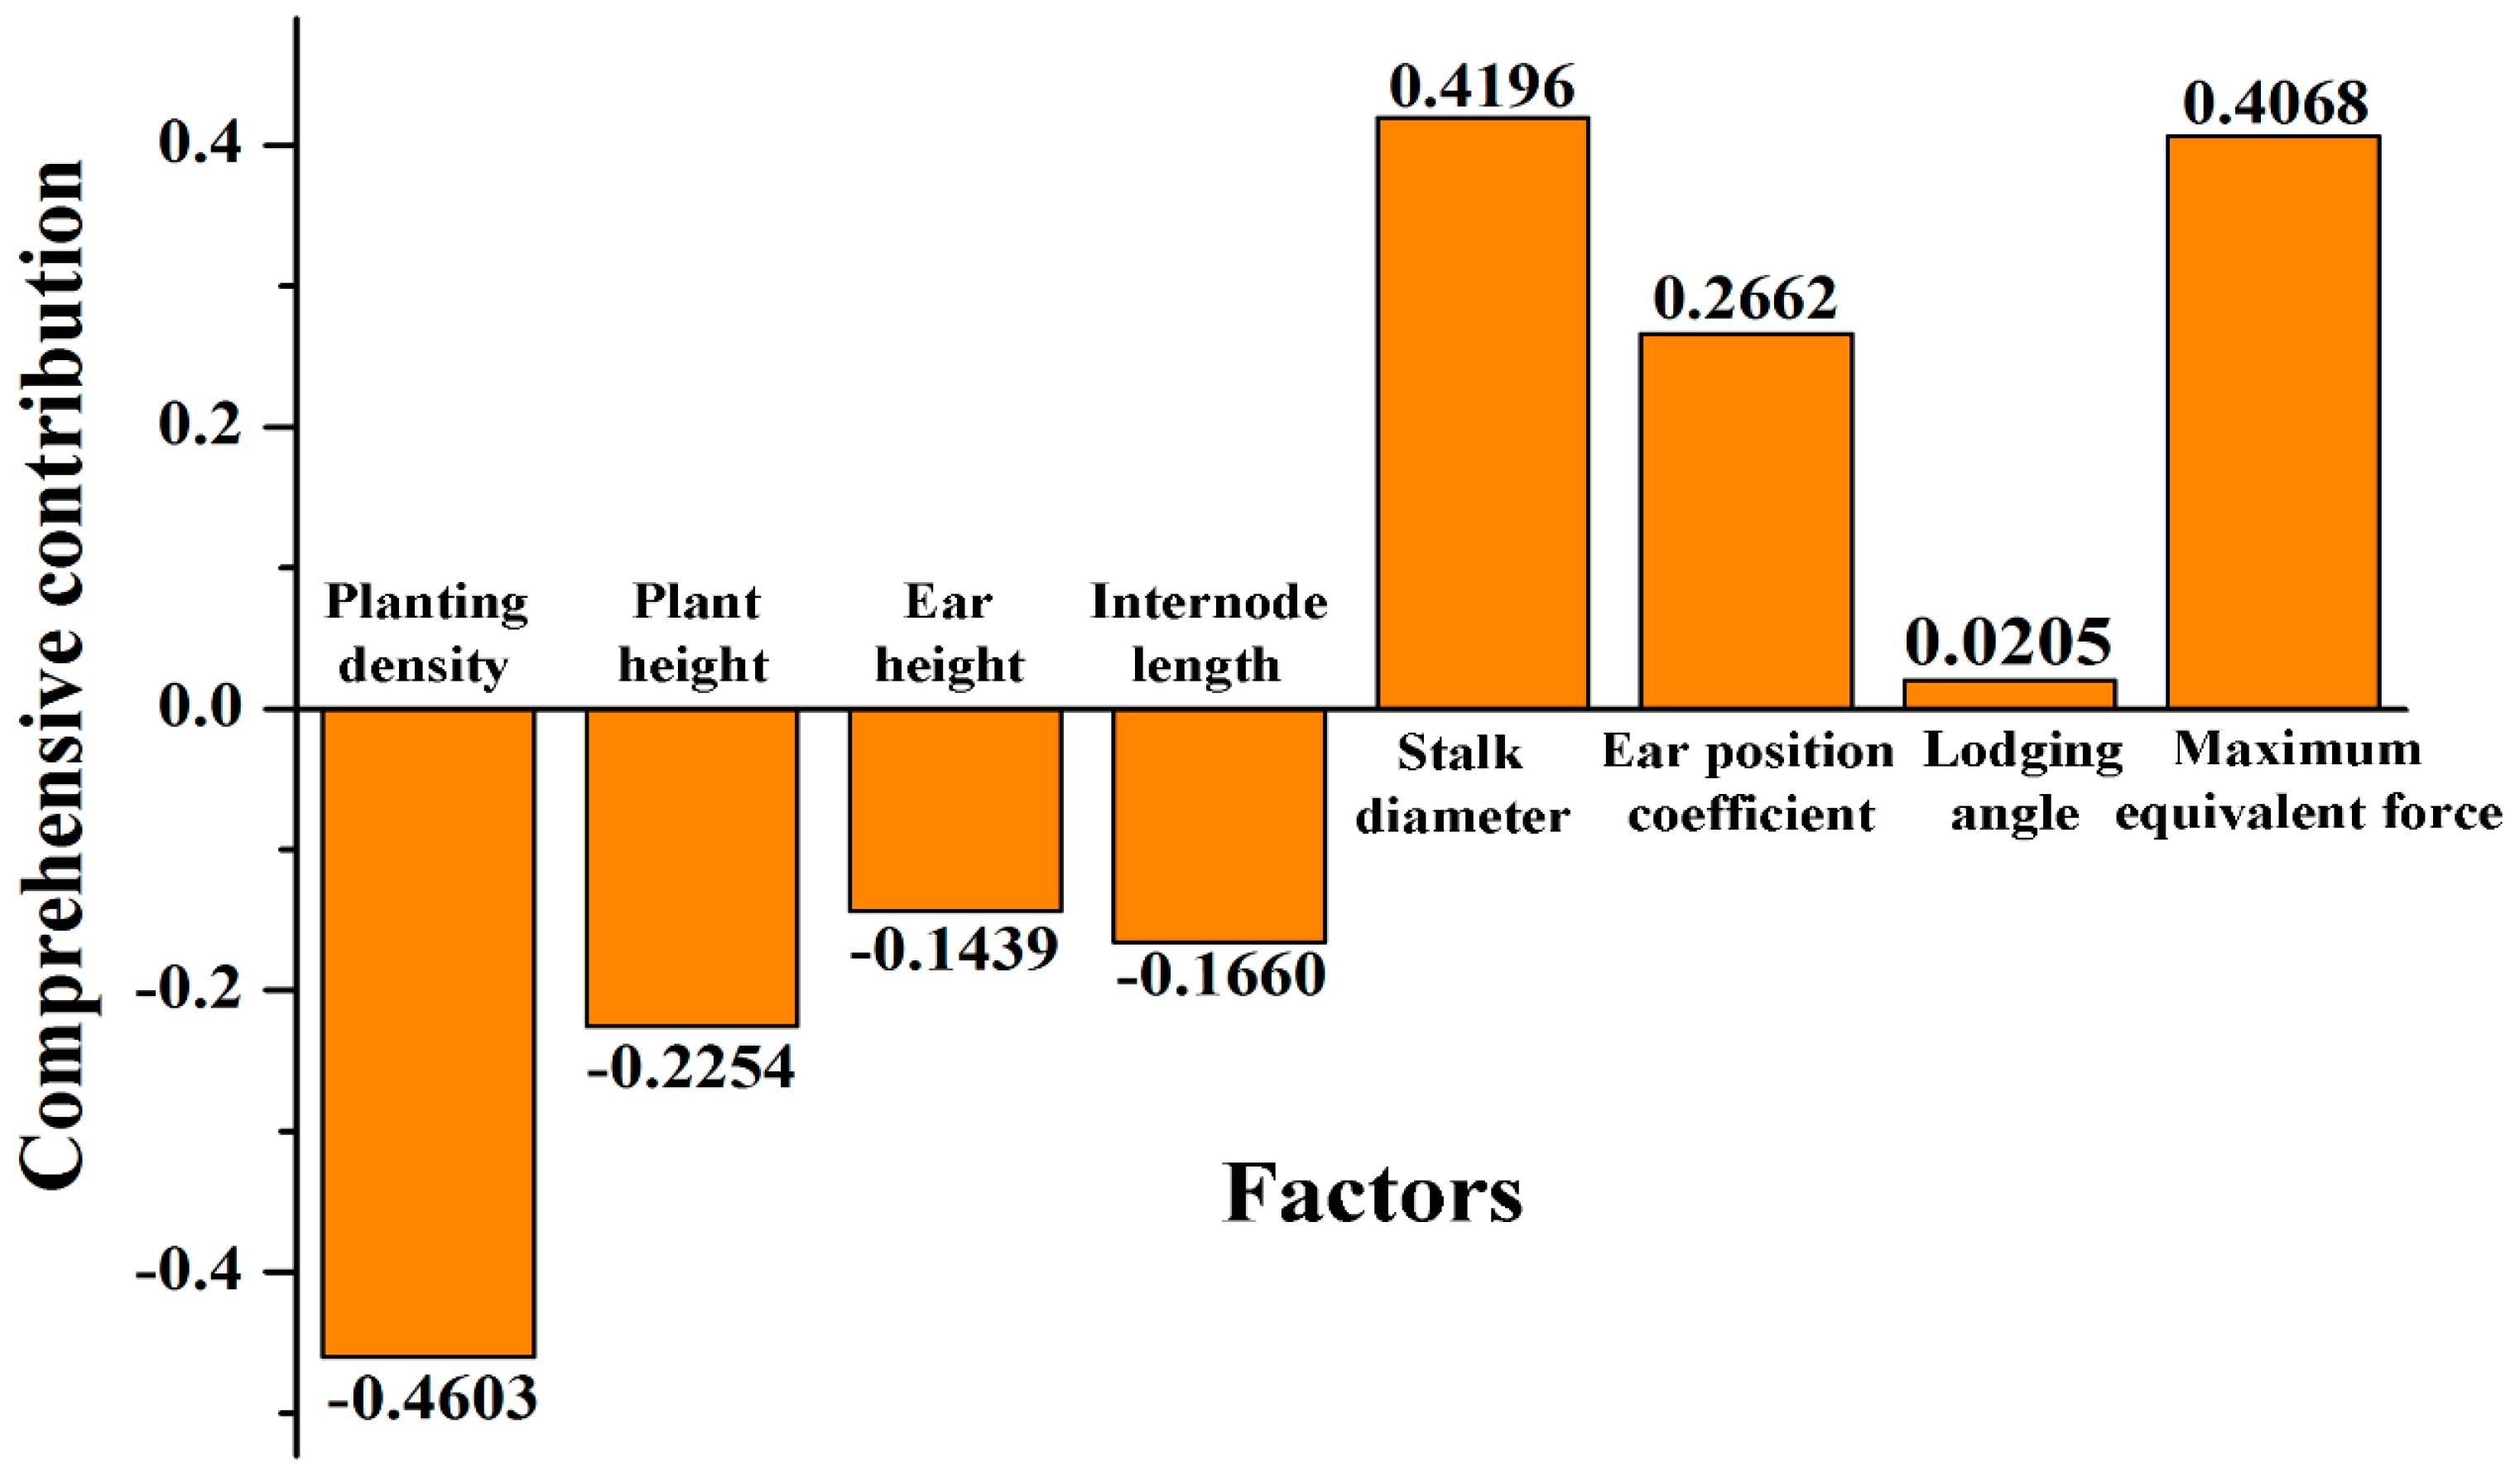
3.3. Comprehensive Evaluation of Different Factors Affecting Corn Stalk Lodging Resistance

Comprehensive contributions of the various factors related to principal components (see Figure 4) were used to make factors into observed variables. The comprehensive contribution values were calculated through summing the coefficients of each principal component and multiplying them with their corresponding weights (40%, 28% and 17%). Obviously, the larger the comprehensive contribution, the more important the factor is in explaining the variation amongst the factors [31,32]. It is obvious that from Figure 4 that the three factors, including the planting density, the stalk diameter, and the maximum equivalent force, play an important role in corn stalk lodging resistance. The corn stalk lodging resistance decreased with increase in planting density. Besides, the stalk lodging resistance significantly increased with increase in stalk diameter and the maximum equivalent force. The other factors, such as plant height and internode length were also seen to have a relatively slight effect on corn stalk lodging resistance. Corn breeders can develop higher lodging resistance-based corn varieties by using this approach.

4. Conclusions

In this work, a method of classifying corn stalk lodging resistance was developed. The results revealed that the average lodging rates of DH605 (60,000), DH605 (75,000), and ZD958 (60,000) were relatively lower than other corn varieties, and the most serious lodging stalks happened in the corn variety of XD20 (75,000), XD20 (60,000), and YD606 (75,000). This nondestructive method demonstrated that the corn stalk lodging resistance can be calculated by employing both the measured equivalent forces and the corresponding stalk agronomic traits. Obviously, the classification results of stalk lodging resistance obtained from the SVD algorithm was consistent with the stalk lodging rate calculated by counting the lodging stalks in the field survey. Five varieties of corn labeled Zhengdan958 (ZD958), Xianyu335 (XY335), Yudan606 (YD606), Xundan20 (XD20), and Denghai605 (DH605) was well classified by setting a proper truncation using the SVD algorithm. Three factors including the planting density, the stalk diameter, and the maximum equivalent force with comprehensive contributions of −0.4603, 0.4196 and 0.4068, which are related to principal components, played an important role in the classification of corn stalk lodging resistance. Corn varieties with appropriate planting densities and the increased stalk lodging resistance can have high yield. Both the stalk diameter and the maximum equivalent forces are also important parameters to be used in evaluating corn varieties. From the measurement results, corn breeding scientists may use this classification method in screening corn varieties for high lodging resistance. This novel quantitative and nondestructive method could provide a great potential to classify the corn stalk lodging properties in real-time at the field level.

Author Contributions

J.H., Q.G., R.C. and S.L. conceived and designed the experiments. Q.G. and R.C. designed the measurement device. Q.G., R.C. and J.H. wrote the main manuscript text. Q.G., L.M. and H.S. prepared Figures. Q.G., R.C., and M.W. performed the experiments. All authors reviewed the manuscript.

Funding

This research was funded by the National Natural Science Foundation of China (31671581).

Acknowledgments

Thank Professor Zephania Birech from the Department of Physics, University of Nairobi, Kenya for critical revision of the text and for his indispensable suggestions. We are greatly indebted to Professor Jihua Tang from State Key Laboratory of Wheat and Maize Crop Science for field work.

Conflicts of Interest

The authors declare no conflicts of interest.

References

  1. Lewis, R.S.; Kernodle, S.P. A method for accelerated trait conversion in plant breeding. Theor. Appl. Genet. 2009, 118, 1499–1508. [Google Scholar] [CrossRef] [PubMed]
  2. Flint-Garcia, S.A. Quantitative Trait Locus Analysis of Stalk Strength in Four Maize Populations. Crop Sci. 2003, 43, 13–22. [Google Scholar] [CrossRef]
  3. Zhao, X.; Wang, W.; Chu, X. Early detection of Aspergillus parasiticus infection in maize kernels using near-infrared hyperspectral imaging and multivariate data analysis. Appl. Sci. 2017, 7, 90. [Google Scholar] [CrossRef]
  4. Robertson, D.J.; Lee, S.Y.; Julias, M. Maize stalk lodging: Flexural stiffness predicts strength. Crop Sci. 2016, 56, 1711–1718. [Google Scholar] [CrossRef]
  5. Huang, M.; He, C.; Zhu, Q. Maize seed variety classification using the integration of spectral and image features combined with feature transformation based on hyperspectral imaging. Appl. Sci. 2016, 6, 183. [Google Scholar] [CrossRef]
  6. Qiu, Z.; Chen, J.; Zhao, Y. Variety identification of single rice seed using hyperspectral imaging combined with convolutional neural network. Appl. Sci. 2018, 8, 212. [Google Scholar] [CrossRef]
  7. Esechie, H.A. Relationship of stalk morphology and chemical composition to lodging resistance in maize (Zea mays L.) in a rainforest zone. J. Agric. Sci. 1985, 104, 429–433. [Google Scholar] [CrossRef]
  8. Liu, Q.; Ma, J.; Zhao, Q. Physical Traits Related to Rice Lodging Resistance under Different Simplified-Cultivation Methods. Agron. J. 2018, 110, 127–132. [Google Scholar] [CrossRef]
  9. Hu, H.; Meng, Y.; Wang, H. Identifying quantitative trait loci and determining closely related stalk traits for rind penetrometer resistance in a high-oil maize population. Theor. Appl. Genet. 2012, 124, 1439–1447. [Google Scholar] [CrossRef] [PubMed]
  10. Allcroft, D.J.; Glasbey, C.A. Analysis of crop lodging using a latent variable model. Agric. Sci. 2003, 140, 383–393. [Google Scholar] [CrossRef]
  11. Berk, P.; Hocevar, M.; Stajnko, D. Development of alternative plant protection product application techniques in orchards, based on measurement sensing systems: A review. Comput. Electron. Agric. 2016, 124, 273–288. [Google Scholar] [CrossRef]
  12. Sharma, L.K.; Bu, H.; Franzen, D.W. Use of corn height measured with an acoustic sensor improves yield estimation with ground based active optical sensors. Comput. Electron. Agric. 2016, 124, 254–262. [Google Scholar] [CrossRef] [Green Version]
  13. Niu, L.; Feng, S.; Ru, Z. Rapid determination of single-stalk and population lodging resistance strengths and an assessment of the stem lodging wind speeds for winter wheat. Field Crop. Res. 2012, 139, 1–8. [Google Scholar] [CrossRef]
  14. Sterling, M.; Baker, C.J.; Berry, P.M. An experimental investigation of the lodging of wheat. Agric. For. Meteorol. 2003, 119, 149–165. [Google Scholar] [CrossRef]
  15. Kono, M.; Takahashi, J. The effect of wind force with reference to lodging of paddy rice. Soil Sci. Plant Nutr. 1964, 10, 20–27. [Google Scholar] [CrossRef] [Green Version]
  16. Berry, P.M.; Sterling, M.; Spink, J.H. Understanding and reducing lodging in cereals. Adv. Agron. 2004, 84, 215–269. [Google Scholar] [CrossRef]
  17. Sanchez, A.C.; Subudhi, P.K.; Rosenow, D.T. Mapping QTLs associated with drought resistance in sorghum (Sorghum bicolor L. Moench). Plant Mol. Biol. 2002, 48, 713–726. [Google Scholar] [CrossRef]
  18. Oliveira, P.C.; Moura, J.P.; Fernandes, L.F. A non-destructive method based on digital image processing for calculate the vigor and the vegetative expression of vines. Comput. Electron. Agric. 2016, 124, 289–294. [Google Scholar] [CrossRef]
  19. Colbert, T.R.; Darrah, L.L.; Zuber, M.S. Effect of Recurrent Selection for Stalk Crushing Strength on Agronomic Characteristics and Soluble Stalk Solids in Maize. Crop Sci. 1984, 24, 473–478. [Google Scholar] [CrossRef]
  20. Peiffer, J.A.; Flint-Garcia, S.A. The genetic architecture of maize stalk strength. PLoS ONE 2013, 8, e67066. [Google Scholar] [CrossRef]
  21. Li, K.; Yan, J.; Li, J. Genetic architecture of rind penetrometer resistance in two maize recombinant inbred line populations. BMC Plant Biol. 2014, 14, 152. [Google Scholar] [CrossRef]
  22. Le, H.R.; Collins, K.M.; Greaves, D.M. Mechanics and materials in the design of a buckling diaphragm wave energy converter. Mater. Des. 2015, 79, 86–93. [Google Scholar] [CrossRef] [Green Version]
  23. Butrón, A.; Malvar, R.A.; Revilla, P. Rind puncture resistance in maize: Inheritance and relationship with resistance to pink stem borer attack. Plant Breed. 2002, 121, 378–382. [Google Scholar] [CrossRef]
  24. Martin, S.A.; Darrah, L.L.; Hibbard, B.E. Divergent selection for rind penetrometer resistance and its effects on European corn borer damage and stalk traits in corn. Crop Sci. 2004, 44, 711–717. [Google Scholar] [CrossRef]
  25. Robertson, D.J.; Julias, M.; Gardunia, B.W. Corn stalk lodging: A forensic engineering approach provides insights into failure patterns and mechanisms. Crop Sci. 2015, 55, 2833–2841. [Google Scholar] [CrossRef]
  26. Twumasi-Afriyie, S.; Hunter, R.B. Evaluation of quantitative methods for determining stalk quality in short-season corn genotypes. Can. J. Plan. Sci. 1982, 62, 55–60. [Google Scholar] [CrossRef]
  27. Chen, S.F.; Danao, M.G.C.; Brown, P.J. Stalk Strength and Sugar Content of 55 Dual-Purpose Sorghum Inbreds. Appl. Eng. Agric. 2015, 31, 489–496. [Google Scholar] [CrossRef]
  28. Gou, L.; Huang, J.; Sun, R. Variation characteristic of stalk penetration strength of maize with different density-tolerance varieties. Trans. Chin. Soc. Agric. Eng. 2010, 26, 156–162. [Google Scholar] [CrossRef]
  29. Cloninger, F.D.; Zuber, M.S.; Calvert, O.H. Methods of evaluating stalk quality in corn. Phytopathology 1970, 60, 295–300. [Google Scholar] [CrossRef]
  30. Guo, Q.; Chen, R.; Sun, X. A Non-Destructive and Direction-Insensitive Method Using a Strain Sensor and Two Single Axis Angle Sensors for Evaluating Corn Stalk Lodging Resistance. Sensors 2018, 18, 1852. [Google Scholar] [CrossRef]
  31. Li, J.; Ma, Y.; Zhang, R. Principal Components Analysis and Comprehensive Evaluation of Free Amino Acids in Ripe Fruits of Different Mulberry Varieties. Food Sci. 2016, 37, 132–137. [Google Scholar] [CrossRef]
  32. Liu, L.; Cao, L.; Du, M. Comprehensive evaluation on yield and quality of Pinellia ternata from Sichuan based on principal component and cluster analysis. Chin. Trad. Herb. Drugs 2016, 47, 2519–2525. [Google Scholar] [CrossRef]
Figure 1. Schematic diagram for calculating the equivalent force under the pull force exerted upon the stalk.
Applsci 09 00640 g001
Figure 2. The principal components (PCs) with individual variances. The accumulated contributions of each PCs are represented with black dots, while the solid line depicts the eigenvalue.
Applsci 09 00640 g002
Figure 3. The scatter plot of the component scores obtained from five corn varieties with two planting densities.
Applsci 09 00640 g003
Figure 4. Comprehensive contribution of various factors affecting the corn stalk lodging resistance.
Applsci 09 00640 g004
Table 1. The agronomic traits and stalk lodging properties from five corn varieties with two planting densities.
Density
(plants/ha)
VarietiesPlant Height
(mm)
Ear Height
(mm)
Internode Length
(mm)
Stalk Diameter
(mm)
Ear Position CoefficientLodging Angle (°)Maximum Equivalent Force (N)
60,000DH6052510.00 b950.00 e71.00 d23.59 a0.38 c42.40 a50.76 a
60,000XD202640.00 a1250.00 a98.10 a21.49 b0.47 a38.09 b24.79 d
60,000XY3352360.00 c990.00 d94.00 b20.49 c0.42 b26.50 c37.61 b
60,000YD6062500.00 b1120.00 b93.00 b20.81 d0.45 ab41.10 a34.50 c
60,000ZD9582500.00 b1000.00 c74.20 c24.09 a0.40 b40.50 ab38.83 b
75,000DH6052650.00 d995.00 e80.00 c24.21 a0.38 c37.90 a39.93 a
75,000XD203020.00 a1340.00 a109.30 a23.51 b0.44 ab25.60 c26.07 d
75,000XY3352920.00 b1180.00 c111.00 a21.43 c0.40 b28.90 b38.30 a
75,000YD6062680.00 c1250.00 b95.10 b22.37 c0.47 a29.50 b34.69 c
75,000ZD9582450.00 e1100.00 d78.20 d24.79 a0.45 ab26.22 c37.50 b
Note: The lowercase letters a, b, c, d and e in Table 1 indicate the significant differences between different corn varieties for each stalk agronomic traits, which were achieved by using the Least Significant Difference (LSD) (the p-value = 0.05). Here, the plant height is the distance from root surface to tip of tassels. The ear height is the distance from root surface to node of top ear. The internode length is the average internode length of the stalk between the 3rd node and 4th node counting from the ground. The stalk diameter at mid-growth stages is measured by using a Vernier caliper. The ear position coefficient is the ratio of the ear height to the plant height.
Table 2. The lodging rates recorded from the experimental samples in 2016 and 2017.
Samples (plant/ha)Lodging Rates Recorded in 2016 (%)Lodging Rates Recorded in 2017 (%)Average Lodging Rates (%)
DH605 (60,000)0.00 g0.00 f0.00 f
DH605 (75,000)3.18 f2.96 e3.07 e
ZD958 (60,000)7.33 e8.01 d7.67 d
YD606 (60,000)8.24 de8.10 d8.17 d
XY335 (60,000)8.23 d8.77 d8.50 d
ZD958 (75,000)9.11 d9.55 cd9.33 cd
XY335 (75,000)9.74 cd10.00 c9.87 cd
YD606 (75,000)10.11 c10.43 c10.27 c
XD20 (60,000)21.21 b22.13 b21.67 b
XD20 (75,000)31.22 a29.30 a30.26 a
Note: Values within columns followed by different letters are statistically different at p = 0.05, and different lowercase letters denote differences between each average lodging rate.

