1. Introduction
An advent of pedicle screws for spinal and chiropractic treatments were 1950s by Boucher [
1]. However, problems including bending, fracture, loosening, detachment, and movement of pedicle screws from the bone have been constantly raised due to the insufficient fixation strength of the interface between the screw and bone. This is because the selection of pedicle screw design and surgical method fail to consider the bone density of various patients. There are various reasons for pedicle screw fixation failure such as sudden shock, fatigue, insufficiency of surgical techniques, and stability of pedicle screws [
2,
3,
4,
5,
6]. Screw loosening occurs between 0.6% and 11%, and screw fracture due to stress concentration occurs between 2.6% and 60%. This causes serious postoperative complications, and surgery is subsequently needed. Specifically, in the cases of older patients or patients with osteoporosis, fixation failure and loosening of the pedicle in the body frequently occur [
7,
8,
9]. The fixation failure ratio of the pedicle screw is approximately 0.8–1.7% due to decreases in and loosening of the fixation strength at the interface between the pedicle screw and bone. Additionally, the fixation failure leads to decreases in the stress and fracture load capacity as well as stress shielding. Therefore, this also causes the micro bone fracture of vertebra due to decreases in bone mineral density [
7,
8,
10]. Thus, it is important to avoid screw loosening from the viewpoint of biomechanics and to secure mechanical stability in the vertebrae. Hence, it is necessary to improve the pedicle screw design to increase the pullout force. Furthermore, the pedicle screw design should be selected by considering a patient’s condition and bone density, and postoperative stability of a patient should be improved through appropriate surgical methods.
The design variables that affect the pullout force including outer diameter, conical angle, and core diameter vary widely. The results of previous studies indicate that increases in the outer diameter and decreases in the pitch increase the contact area between the bones which have low density (0.16 g/cc) to high density (0.32 g/cc) and the screw, and thereby improve the pullout force [
11,
12]. Increases in outer diameter, however, are extremely limited due to the vertebrae size and thickness based on patients. Furthermore, the pitch variation is extremely limited because the torque decreases when the pitch of screw decreases and bone damage accordingly increases. The conical angle is another variable that contributes to increased pullout stiffness and improves the stability of the inserted screw when compared to the cylindrical type [
12,
13,
14]. Furthermore, the core diameter reduces in the case of a screw with the same outer diameter, and the thread height increases. Additionally, the pullout force increase due to increase of the contact area between bone and screw increases [
15,
16,
17]. The influence of screw design variables on pullout force is actively examined. Nevertheless, there is a paucity of studies on the correlation between the pullout force and each variable that influences the pullout force. Specifically, while inserting a screw into a patient, it is necessary to consider the pullout force as well as bone damage after insertion and failure [
18]. Previous studies focused on improving the pullout force based on the screw design with the exception of bone damage. Thus, it is difficult to predict that bone damage occurs due to torque and external force occurs when a screw that exhibits high pullout strength is inserted into patients with various bone densities. Thus, it is necessary to increase the pullout force by improving the pedicle screw design and also to simultaneously analyze bone damage and fracture behavior of the bone when a screw is inserted into the human body [
19,
20].
In this study, a pedicle screw with core diameter and conical angle as variables of screw design that contribute to pullout force improvement was designed and manufactured. A non-parametric test was performed due to uncertainty and influence of the relationship between the various screw design parameters and pullout behaviors. The effects of each variable on the pullout force and its correlation were investigated. Additionally, by considering various bone mineral density of the patients, the experiment was divided into two groups, namely osteoporotic bone density (grade 10 (0.16 g/cc)) and normal bone density (grade 20 (0.32 g/cc)). Following the pullout of the screw, the cross-sectional area of the PUF (polyurethane foam) was observed via micro-CT, and bone damage was quantitatively analyzed. The effects and correlation of pedicle screw design variables (i.e., core diameter and conical angle) and bone density on the pullout force, bone damage, and fracture behavior were analyzed, and an optimal screw design was suggested.
3. Results
In order to effectively explain the deformation of the artificial bone at the contact area with the screw during the pullout behavior, the microstructure and compressive behavior of the artificial bone were observed first.
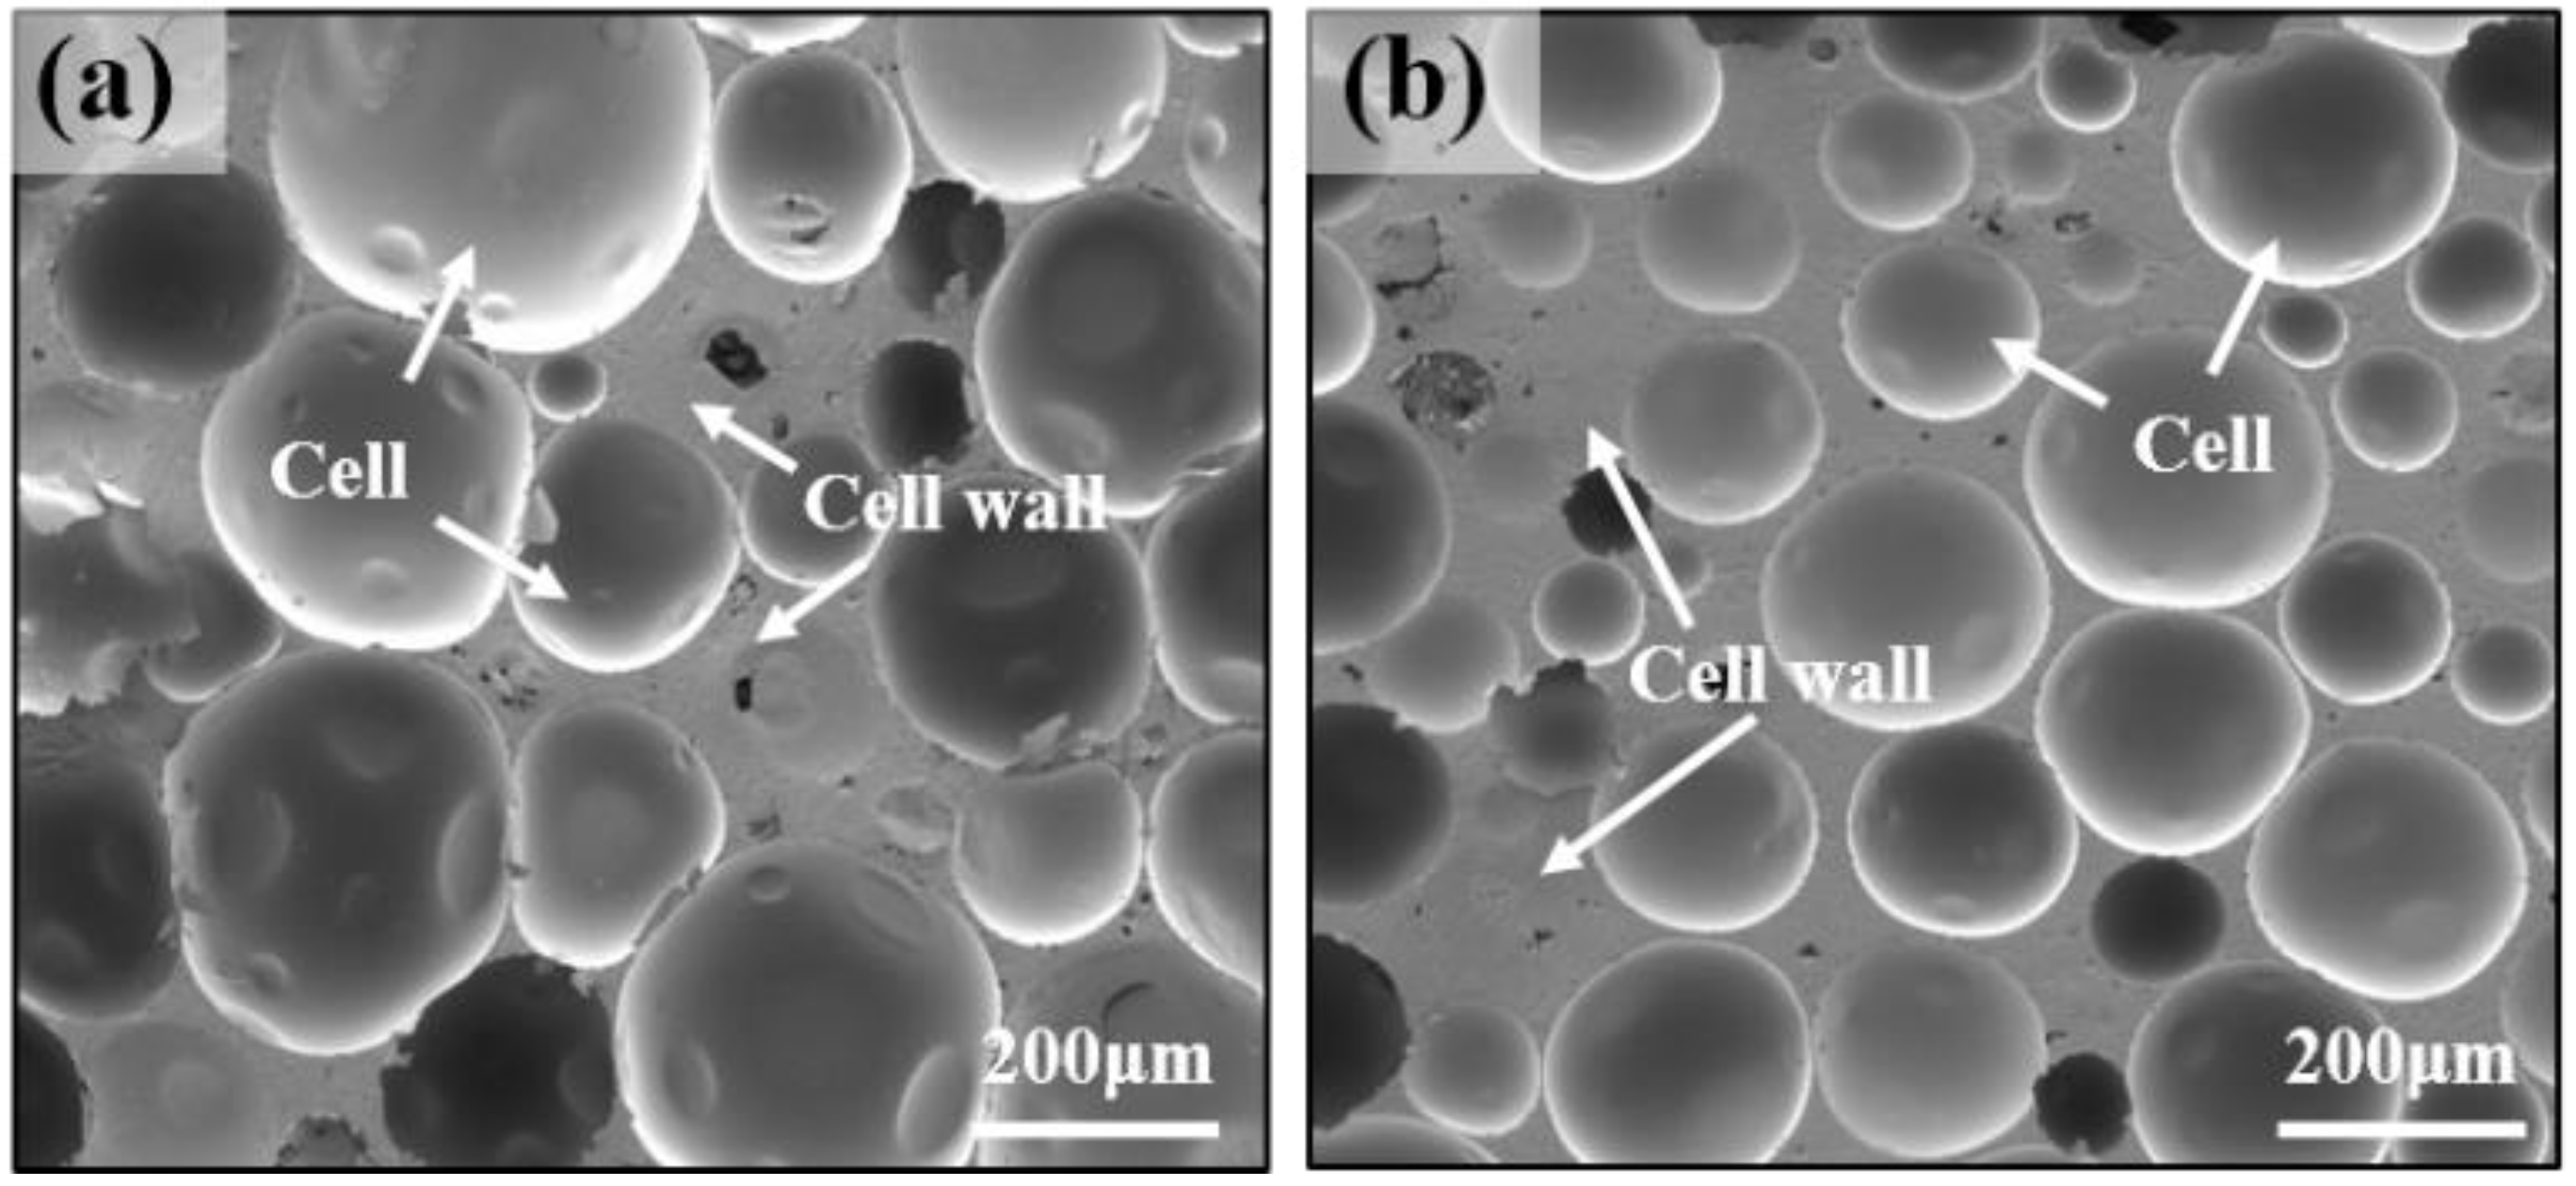
Figure 1 shows the microstructure of an artificial bone with osteoporotic bone density (grade10 (0.16 g/cc)) and normal bone density (grade 20 (0.32 g/cc)). The cell size range of osteoporotic bone was 37–100 μm, and normal bone exhibited a smaller cell size range than that of the osteoporotic bone as shown in the microstructures in
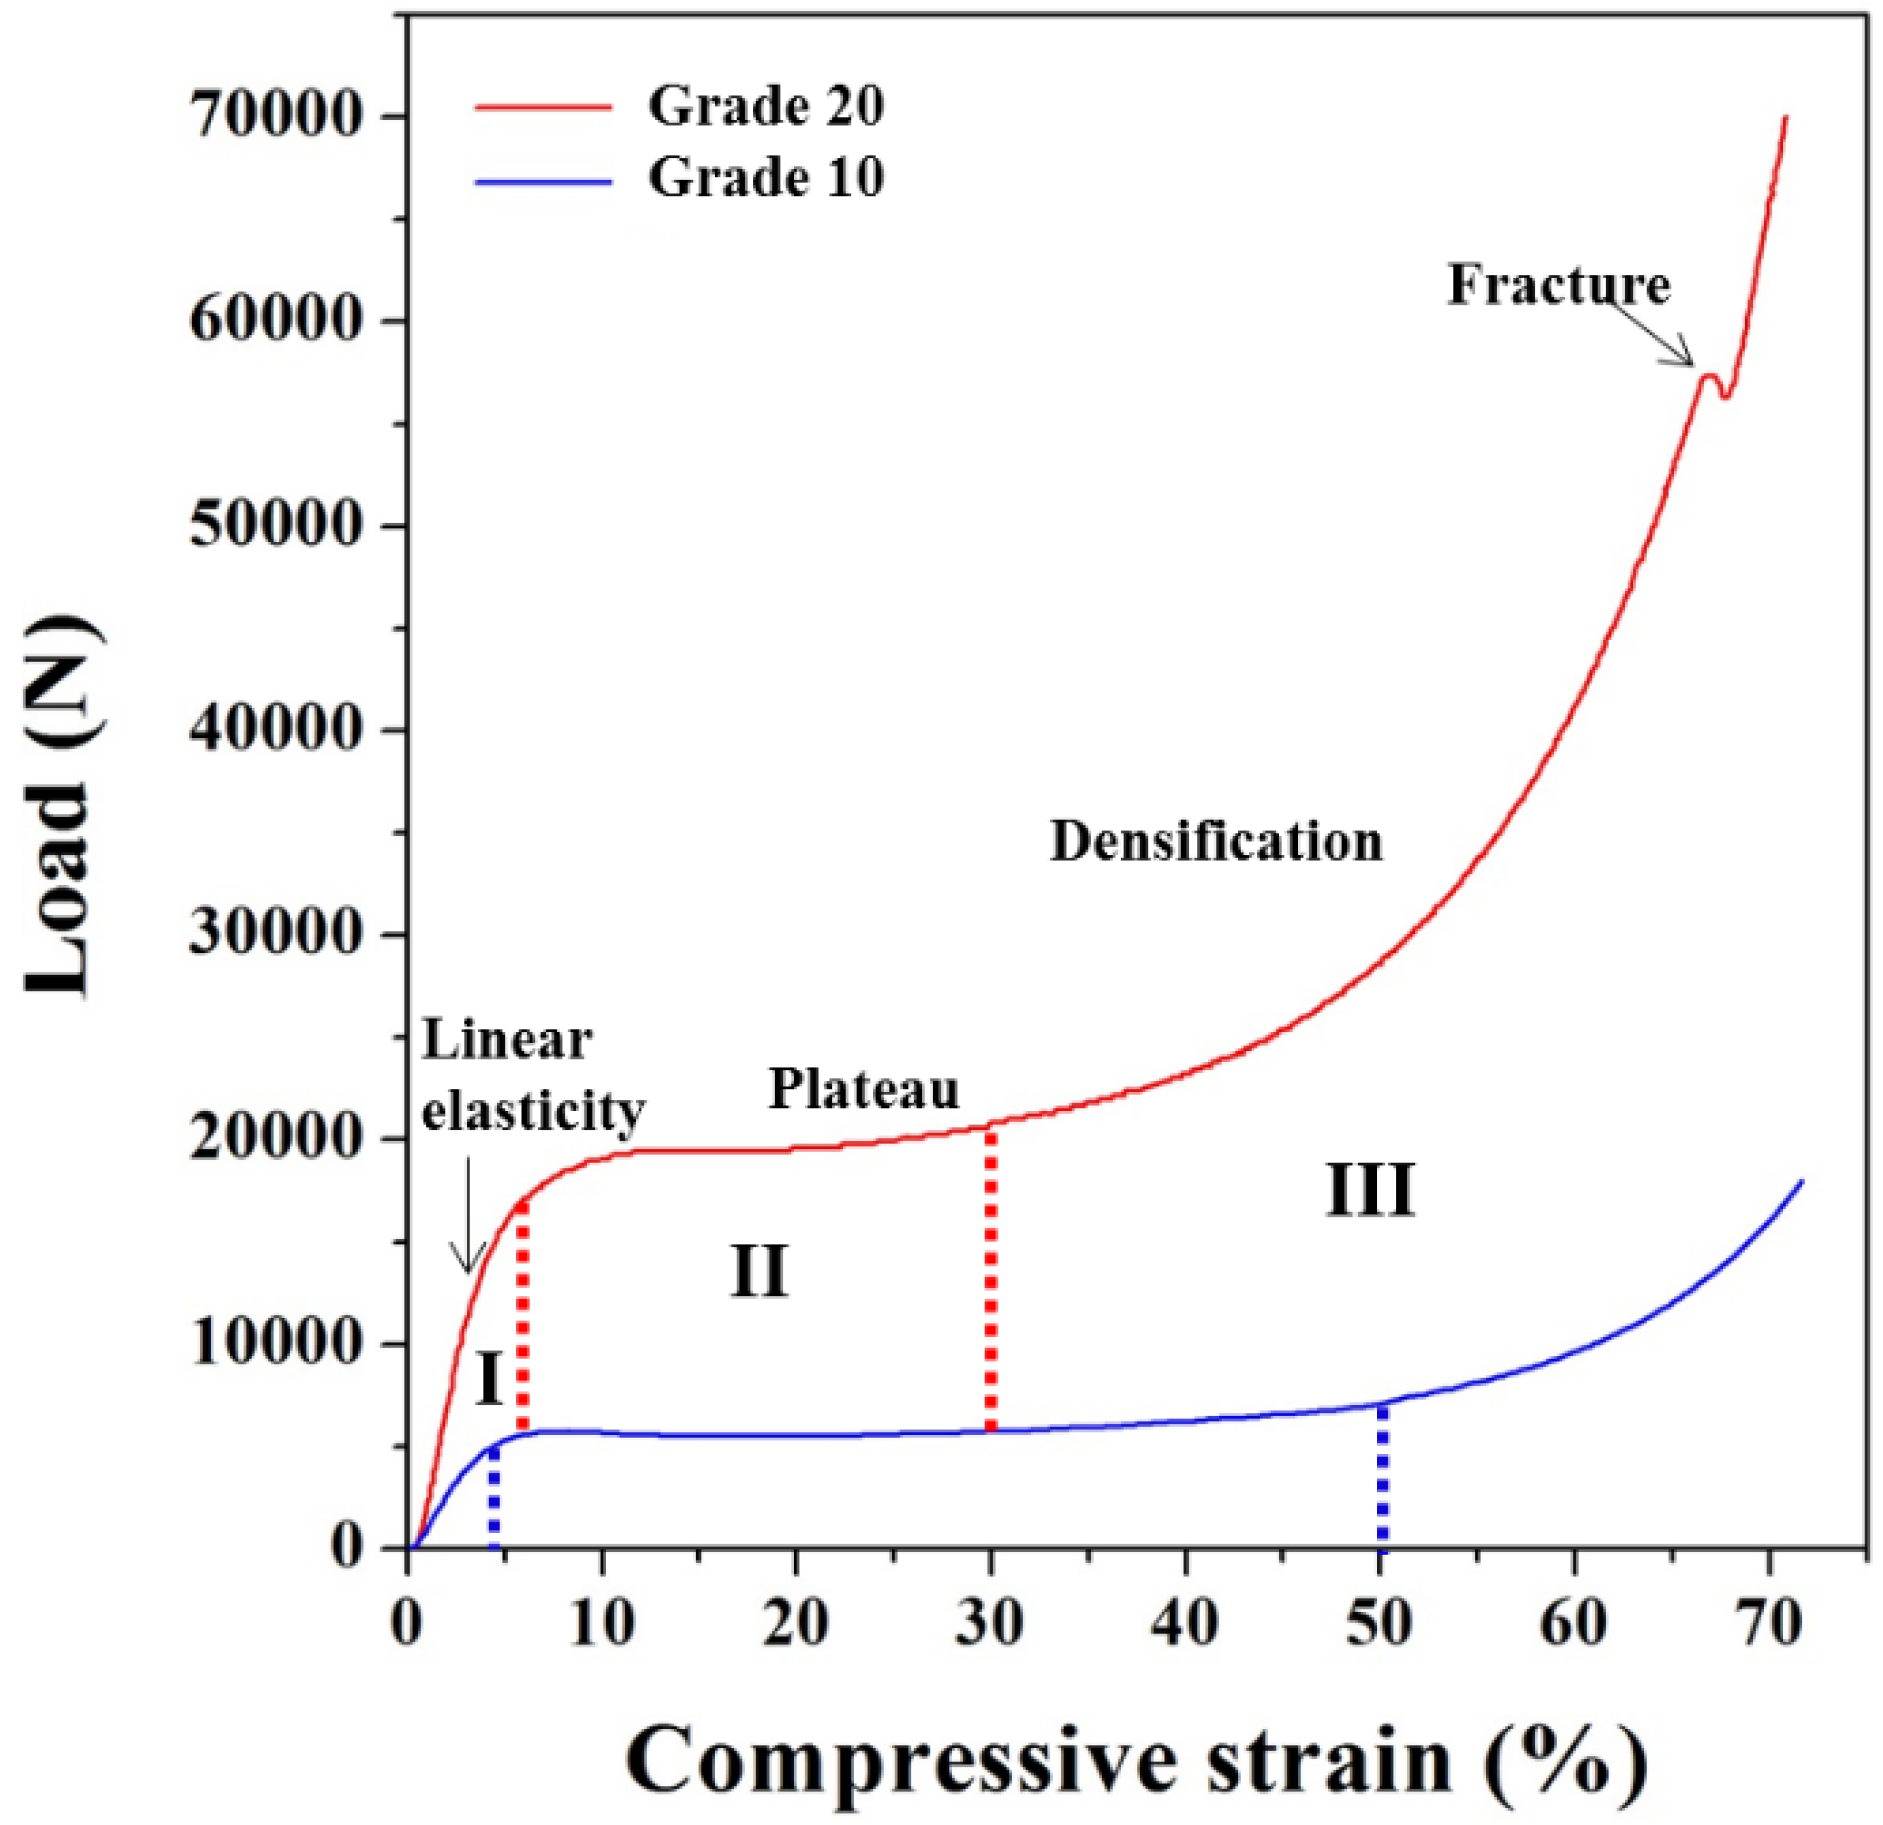
Figure 1. The compressive behavior of the artificial bone that exhibit the aforementioned microstructure is shown in
Figure 2. When the density of the artificial bone doubled, the yield compressive stress increased by approximately three to four times.
Table 1 shows the values of each experimental variable.
Previous studies suggest that the insertion depth was fixed at 20 mm, and the pullout test was conducted by choosing screw sizes corresponding to 5.5, 6.5, and 7.5ø, which are most commonly used for fracture treatment of vertebrae. The results indicate that the pullout force tended to increase with increases in repulsion force from compression due to screw volume and increases in contact area between the artificial bone and screw. Images of the pedicle screw designed and manufactured by considering the parameters which are the core diameter and conical angle are shown in the
Figure 3. The
Figure 3d shows the schematic diagram of pullout test. The core diameter and conical angle were determined as 3.75ø, 4.1ø, 5.5ø, 5.72°, 8.58°, and 11.42°, respectively, and the initial point at which the conical angle starts was fixed at 27.95 mm from the tip of the screw. When the core diameter increased and conical angle increased, the thread height at the top of the screw decreased. With respect to a pedicle screw used in patients, the purpose of the treatment and the patient's condition (i.e., bone thickness, density, and size) should be considered and applied to patients. Thus, the pedicle screw was completely inserted at 50 mm based on the length of the screw designed and manufactured in the study. Thus, the pullout force increased by approximately 4–5 times when compared with that in the previous study [
12,
24].
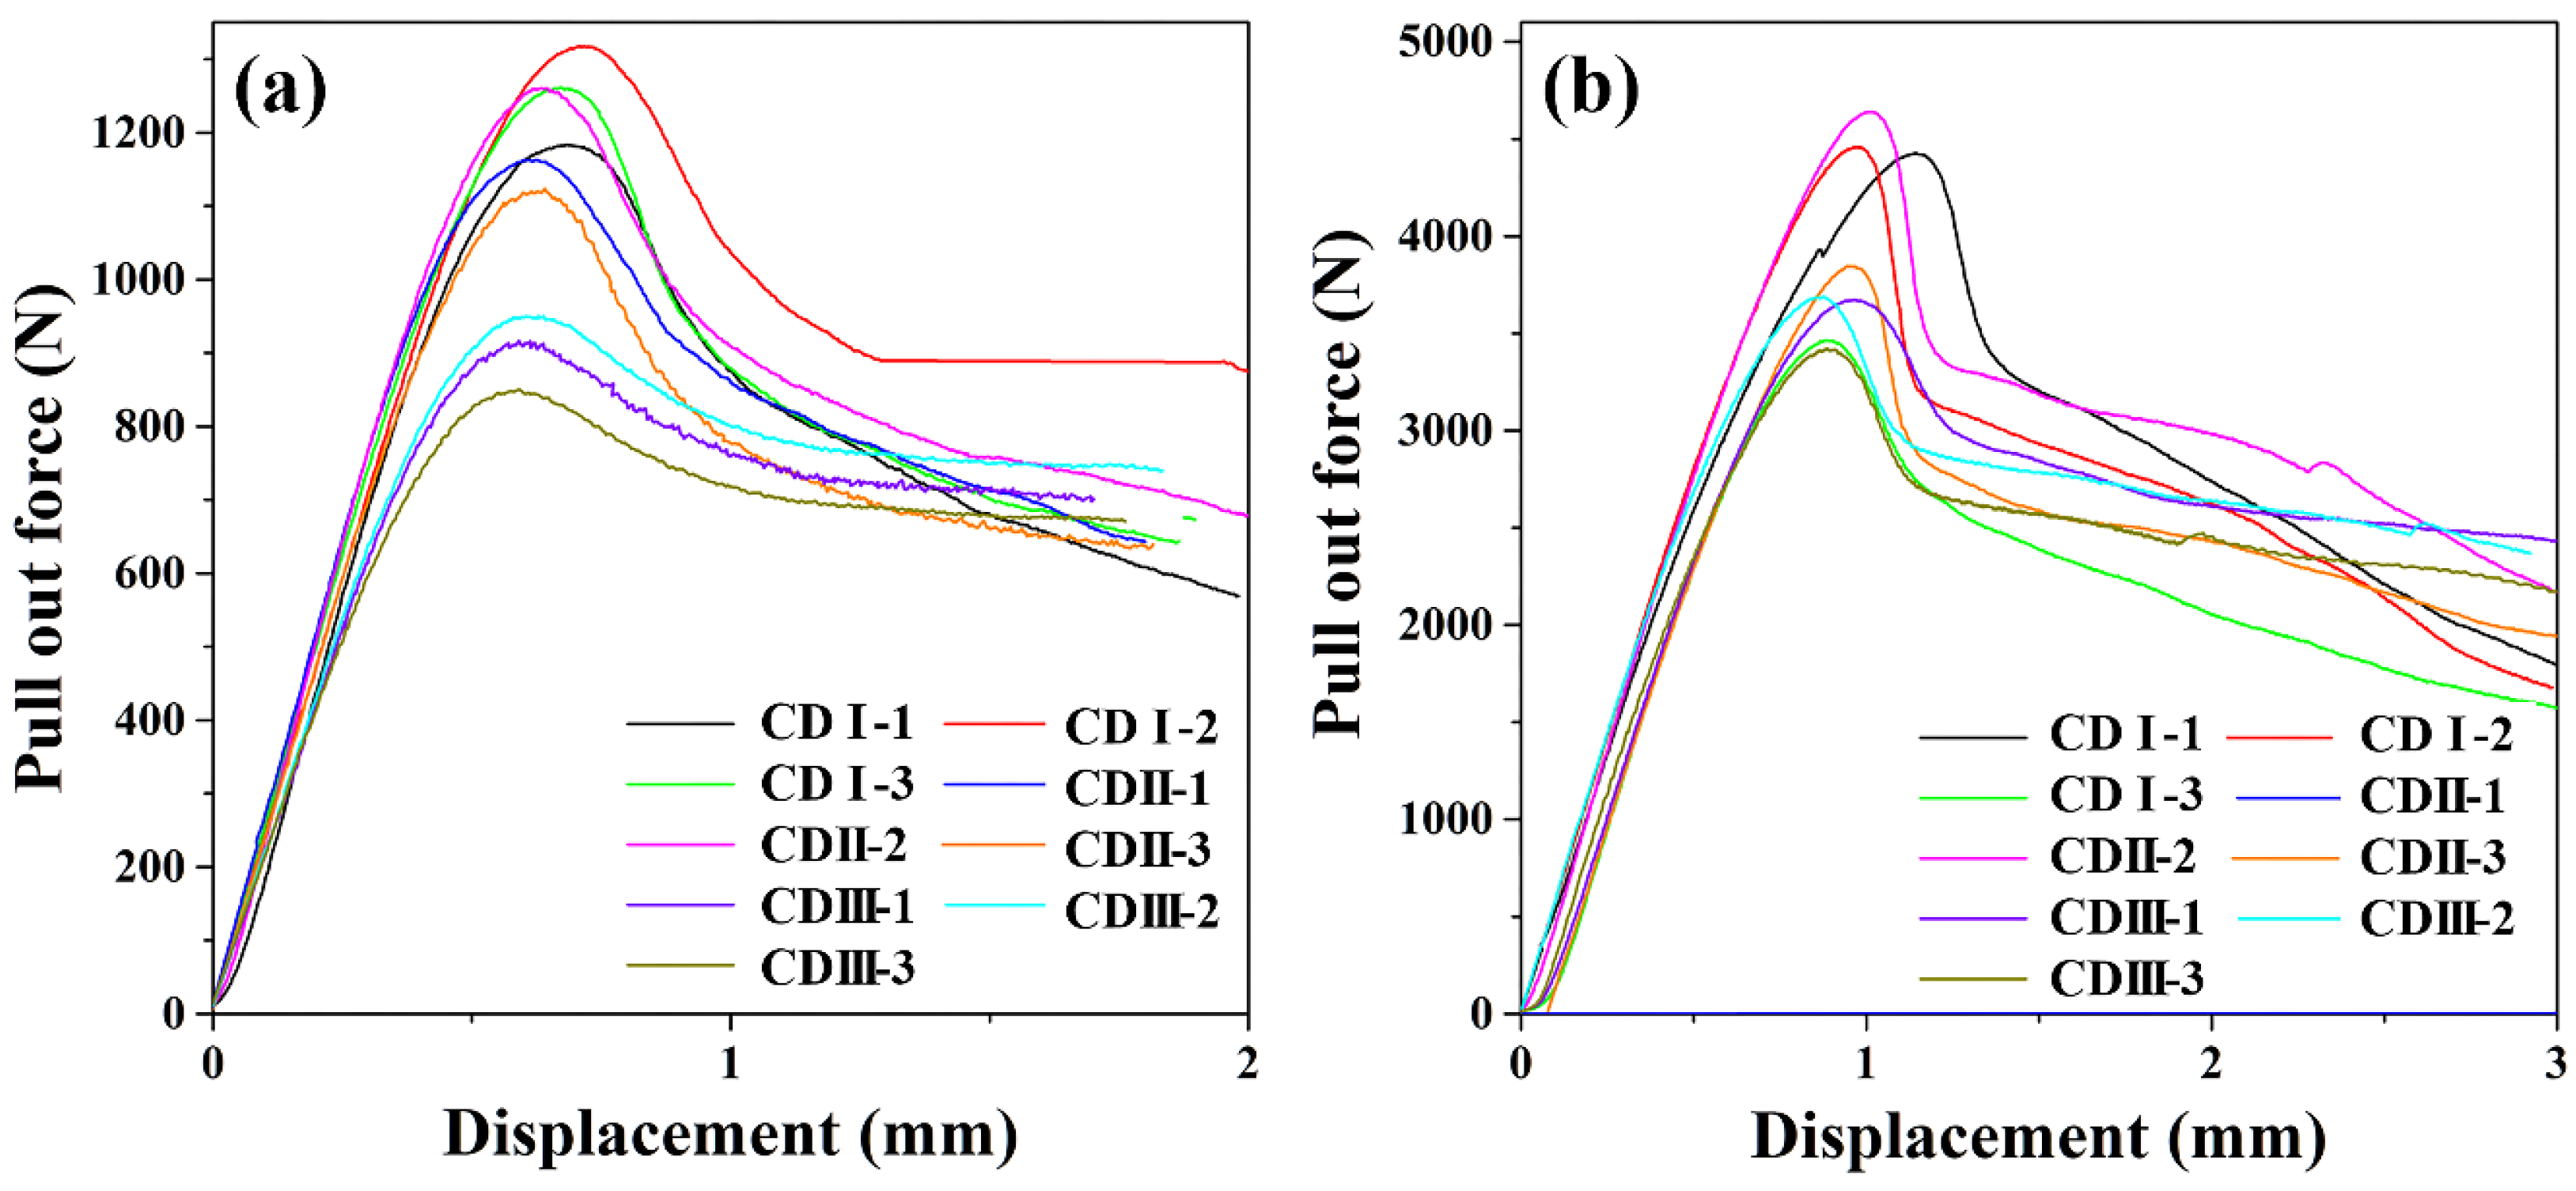
The core diameter was determined as 3.75ø, 4.1ø, and 5.5ø, and classified into CD I, II, and III groups, respectively. In addition, the pedicle screws with conical angles of 5.72°, 8.58°, and 11.42° are represented by CD(I/II/III)-1, CD(I/II/III)-2, and CD(I/II/III)-3, respectively.
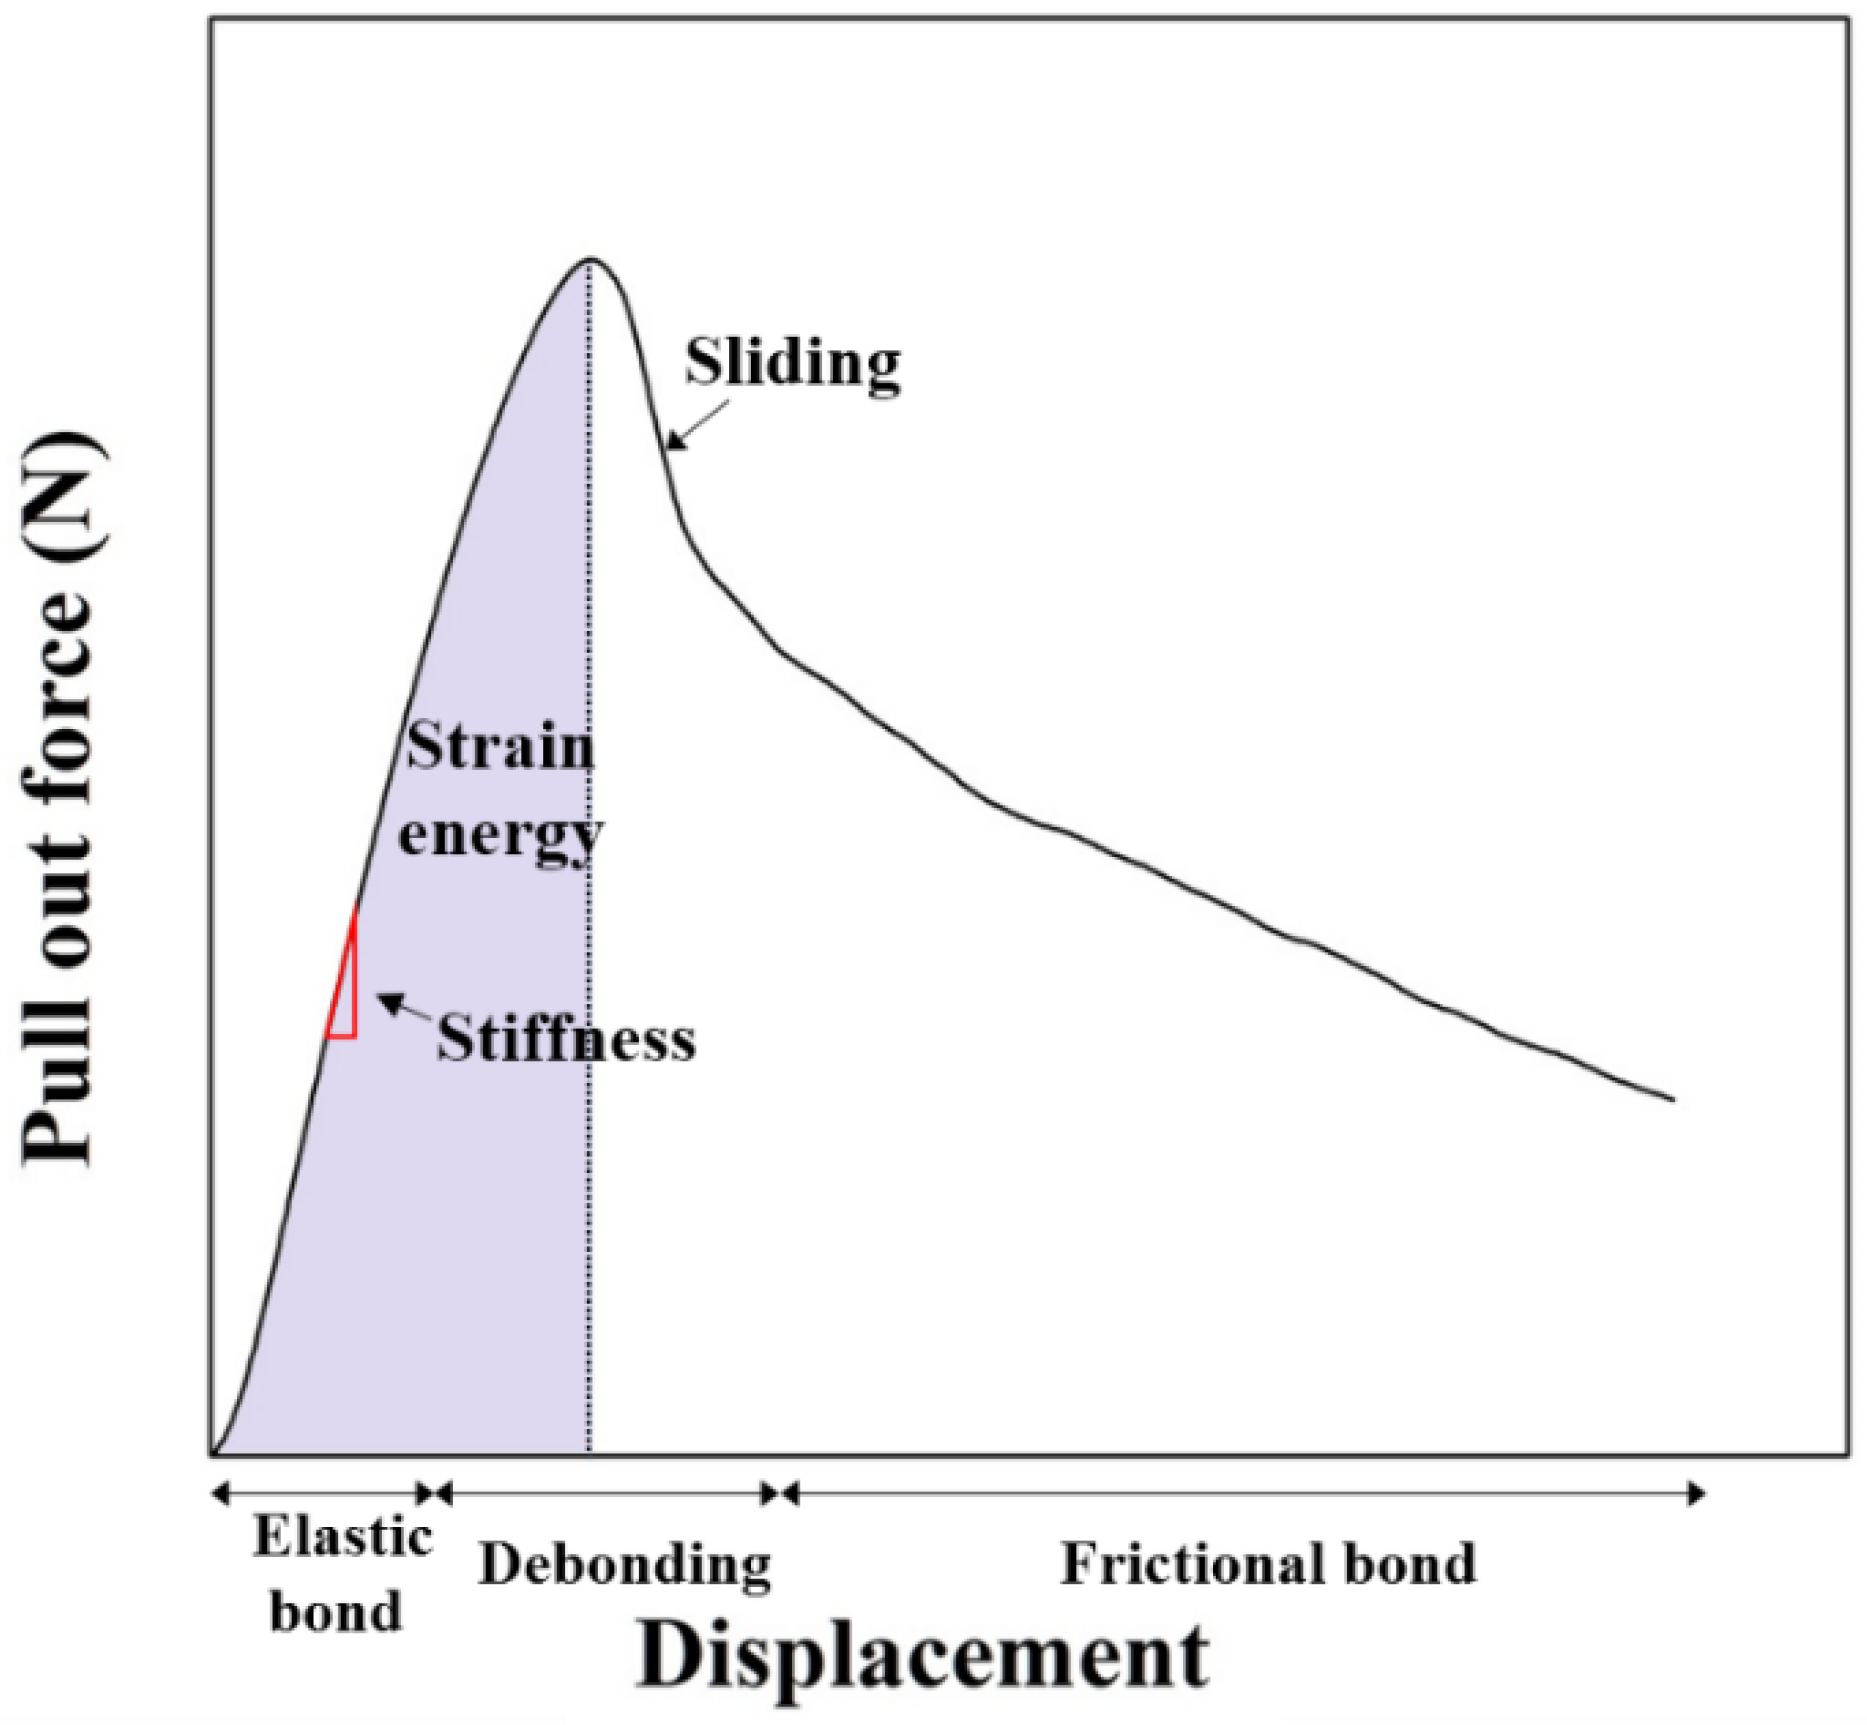
Figure 4 shows the pullout force–displacement curve of the pullout test based on each screw design and bone density. The initial linear region in the graph was termed as the elastic bond section, and its slope was different based on the design of the pedicle screw. In the pullout curve, the slope of the initial linear region of grade 10 that exhibits low density exceeded that of grade 20 on the whole. The schematic diagram of the pullout behavior of the screw is shown in
Figure 5.
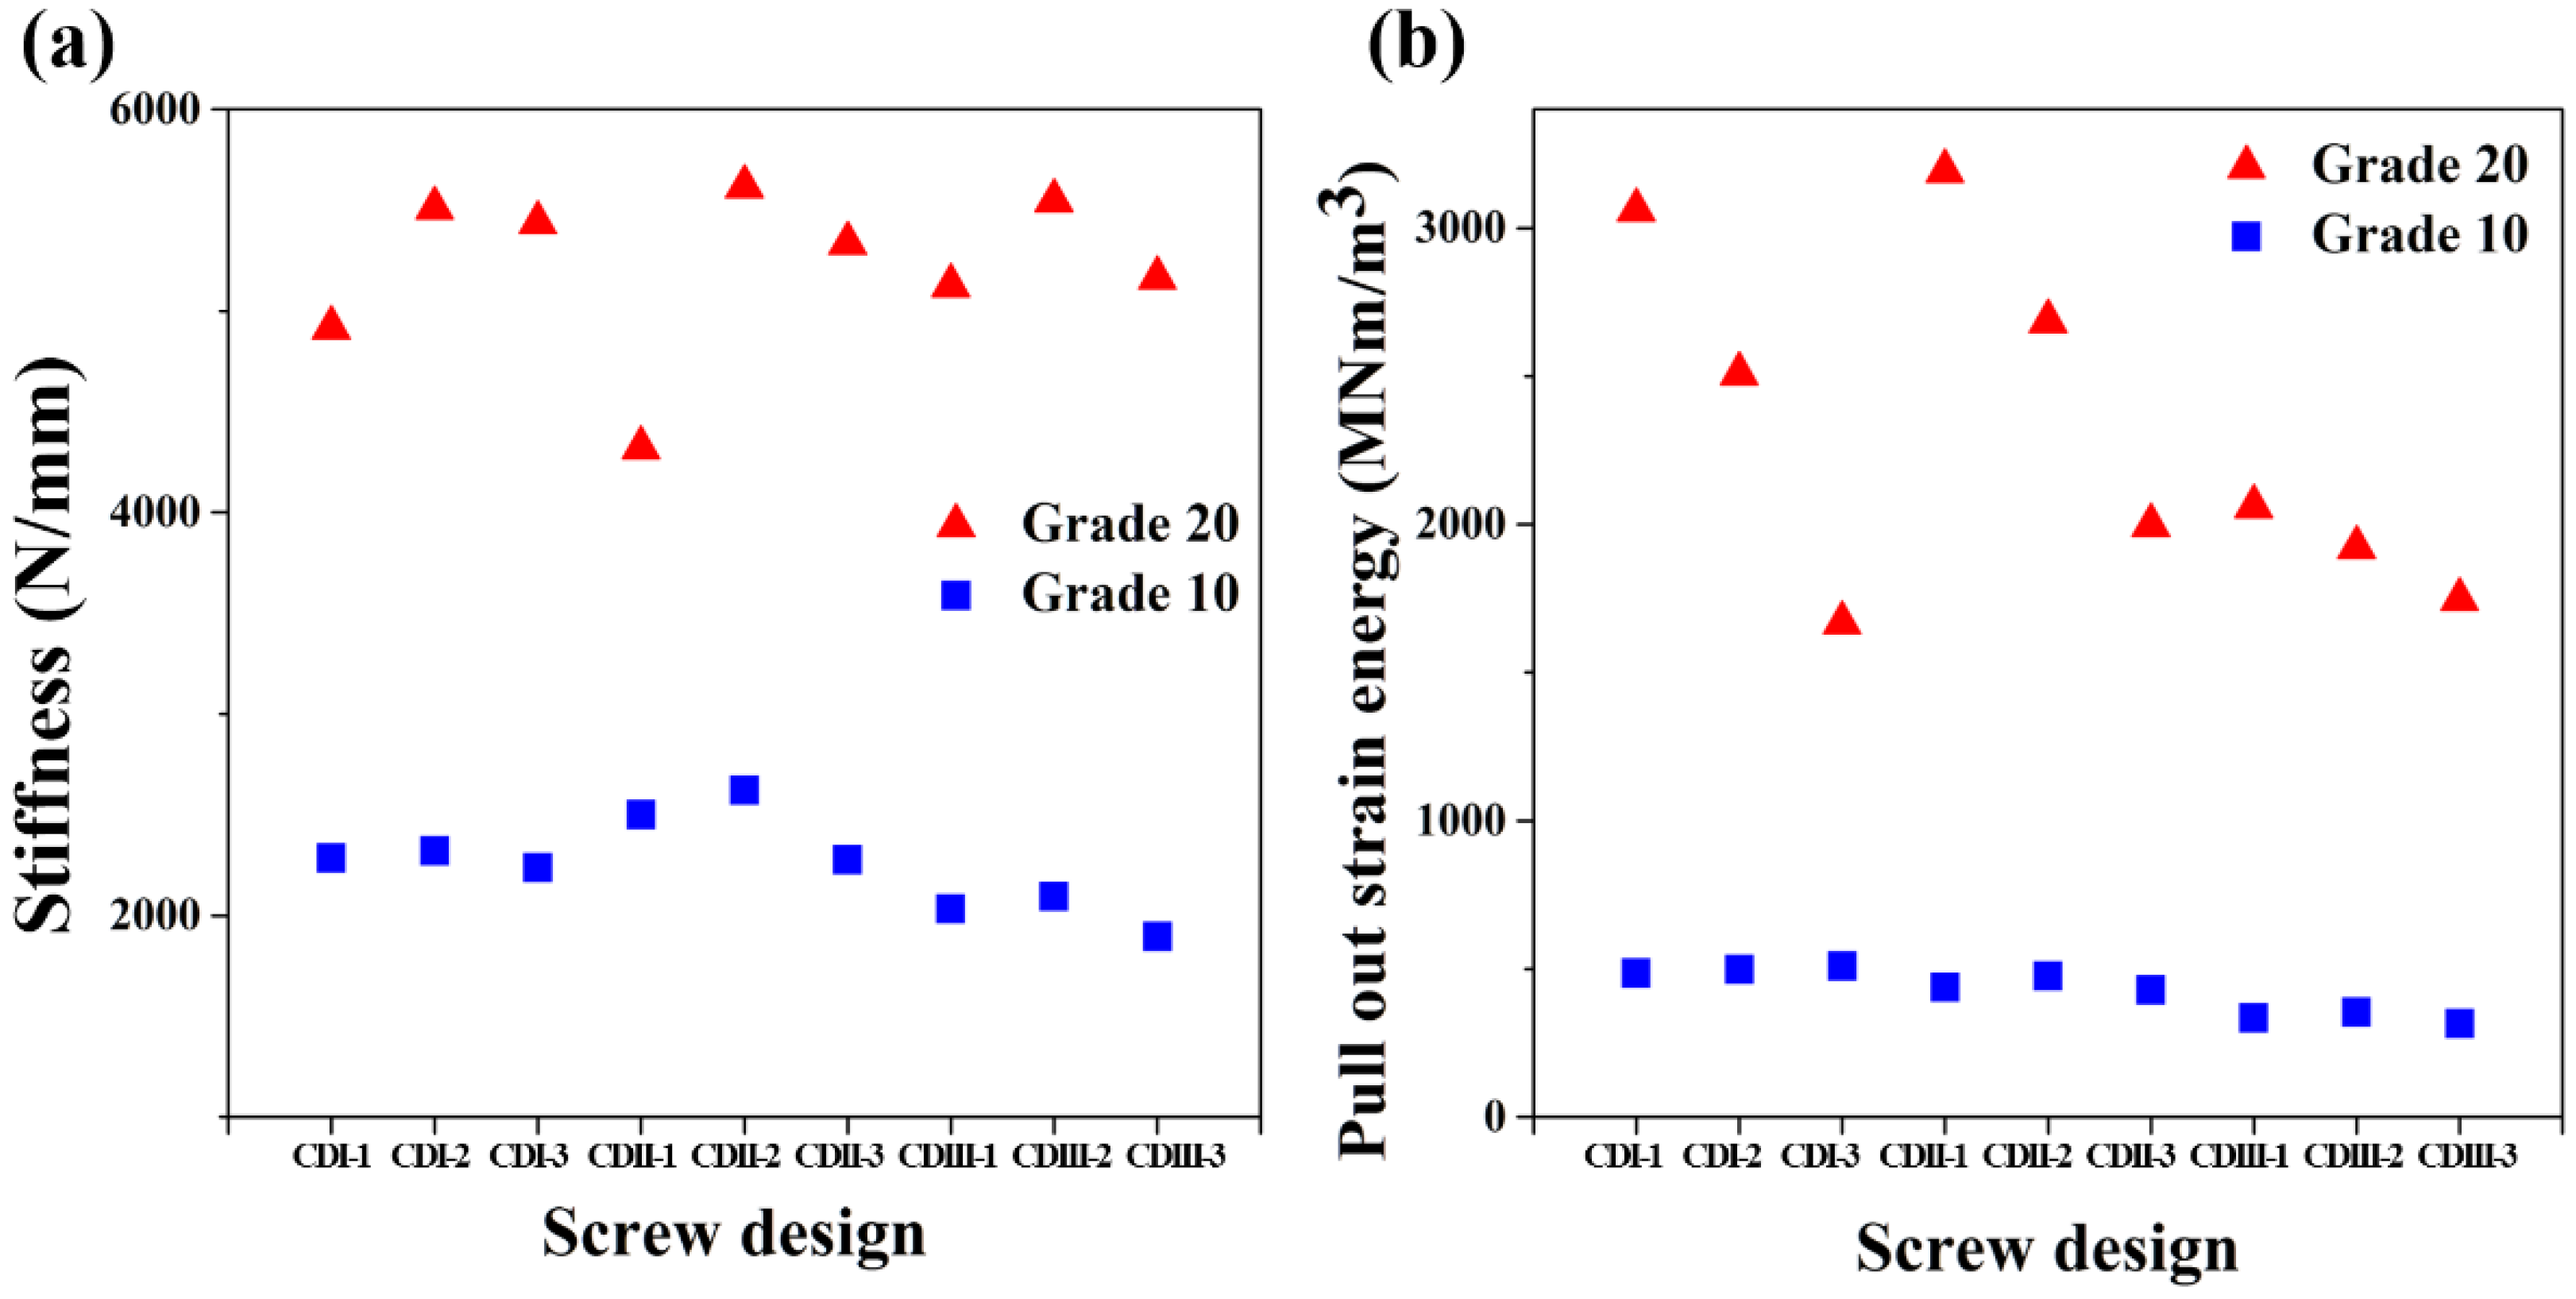
Figure 6a shows the stiffness measured in the linear elastic region of the pullout curve based on each screw design. The stiffness corresponded to the stress wherein the material retained its shape and implied the resist force on the pull stress applied to the screw in the pullout test [
25]. The stiffness increased 2.5 times when the density doubled. Additionally, there was no significant change in stiffness with increases in the core-diameter although stiffness increased with increases in the conical angle and decreased again at a conical angle corresponding to 8.58°.
Conversely, the area under the pullout curve from the start of pullout test to the maximum pullout load is termed as pullout strain energy [
25]. The pullout strain energy based on the design of the screw was calculated and shown graphically in
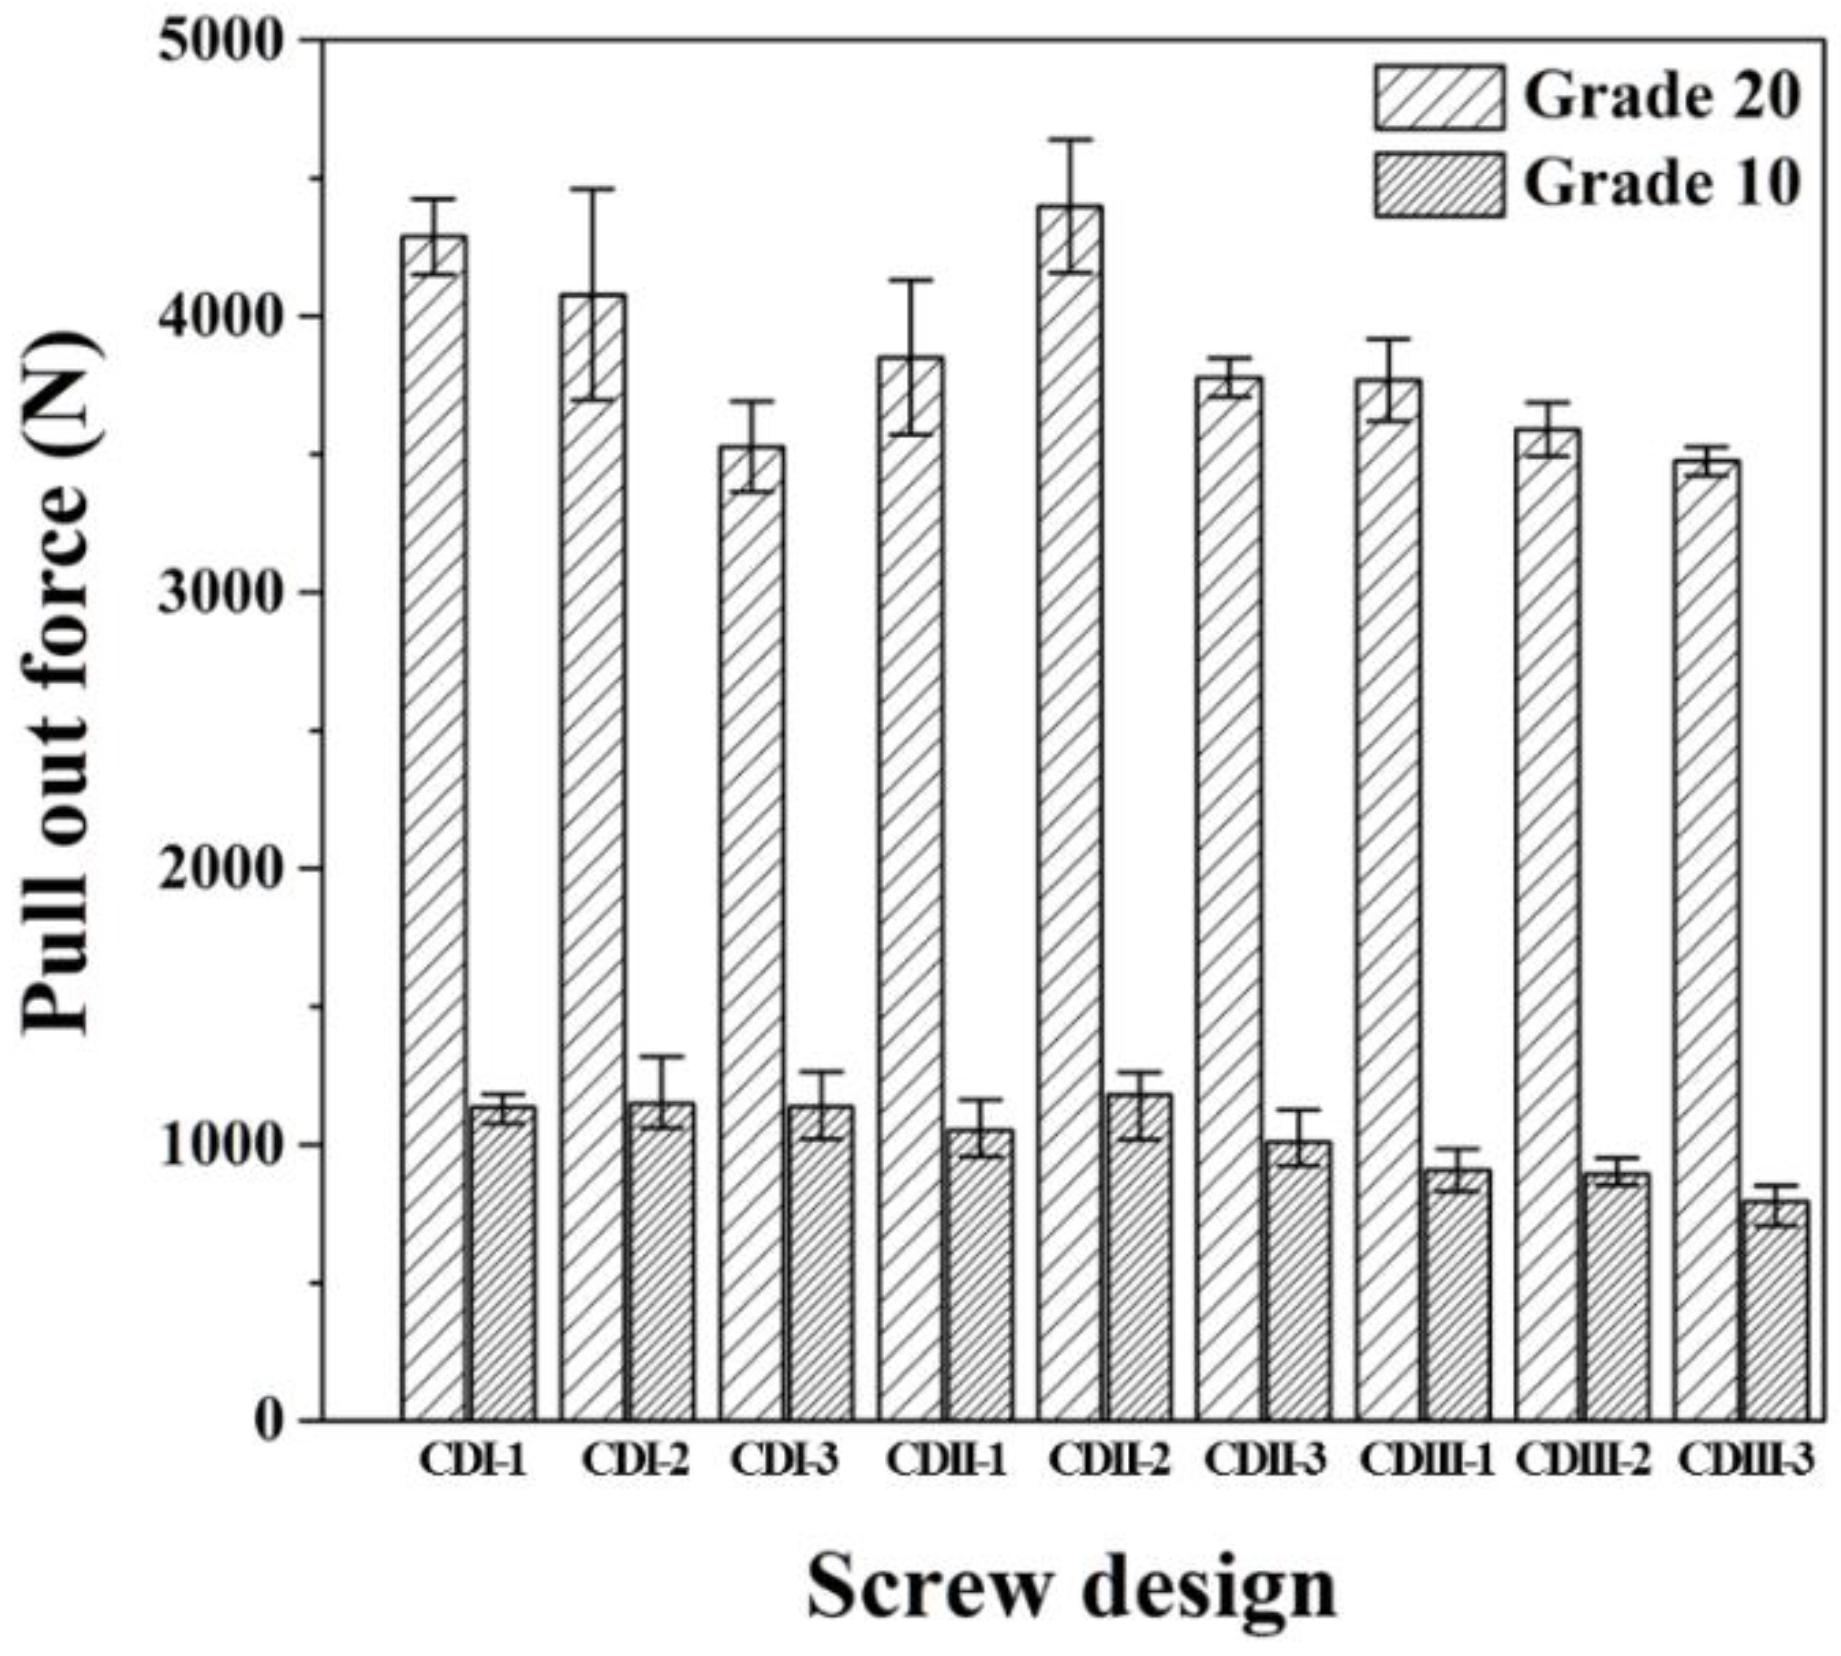
Figure 6b. The pullout strain energy of grade 20 exceeded that of grade 10. Furthermore, at grade 20, and the change in the strain energy sharply decreased when the core diameter increased to 5.5ø. Furthermore, the degree of strain energy changed with the changes in conical angle in CDI and CDII group was significantly reduced. Conversely, at grade 10, the strain energy did not change significantly based on the screw design parameters. Overall, the pullout strain energy tended to decrease when the conical angle decreased irrespective of the density. The pullout strength based on each pedicle screw design is shown graphically in
Figure 7. At the density of grade 10, the pullout force power was higher in the order of CDII-2, CDI-2, and CDI-3. In grade 20, the pullout force was higher in the order of CDII-2, CDI-1, and CDI-2.
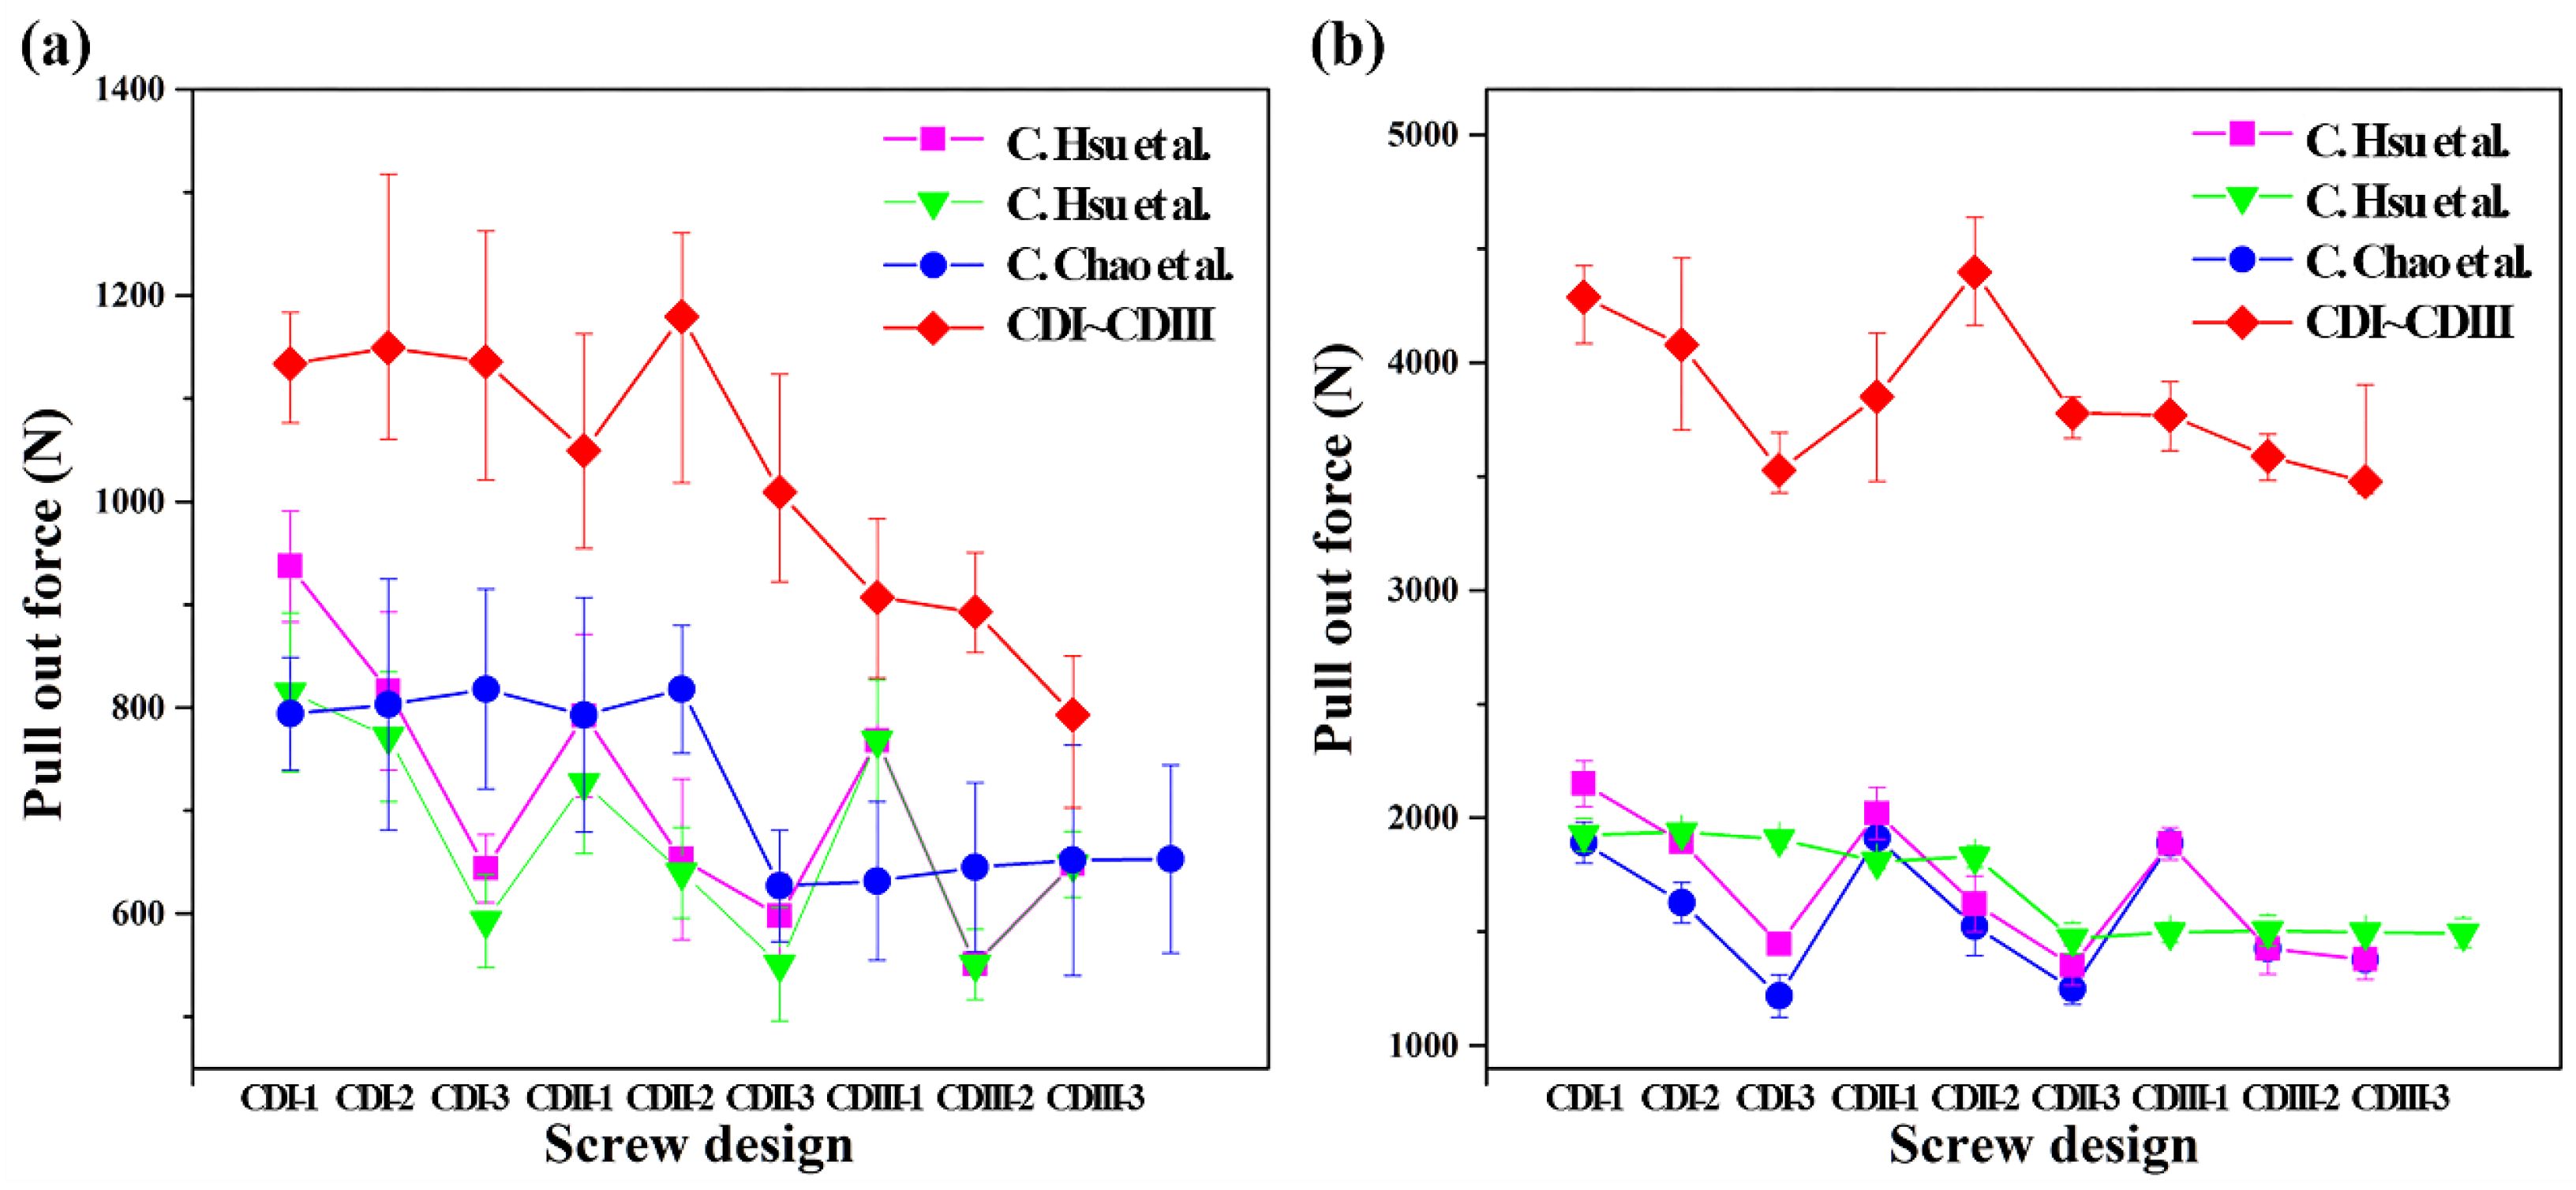
The pullout force of the screw designed in the study was compared with those in previous studies as shown in
Figure 8, and the results indicate that it exhibited a significant improvement when compared to that in previous studies [
12,
24]. The pullout force of grade 10 improved by approximately more than 200–500 N. Specifically, with respect to grade 20 that corresponds to normal bone density, the pullout force improved by approximately 2–2.5 times that in other study results.
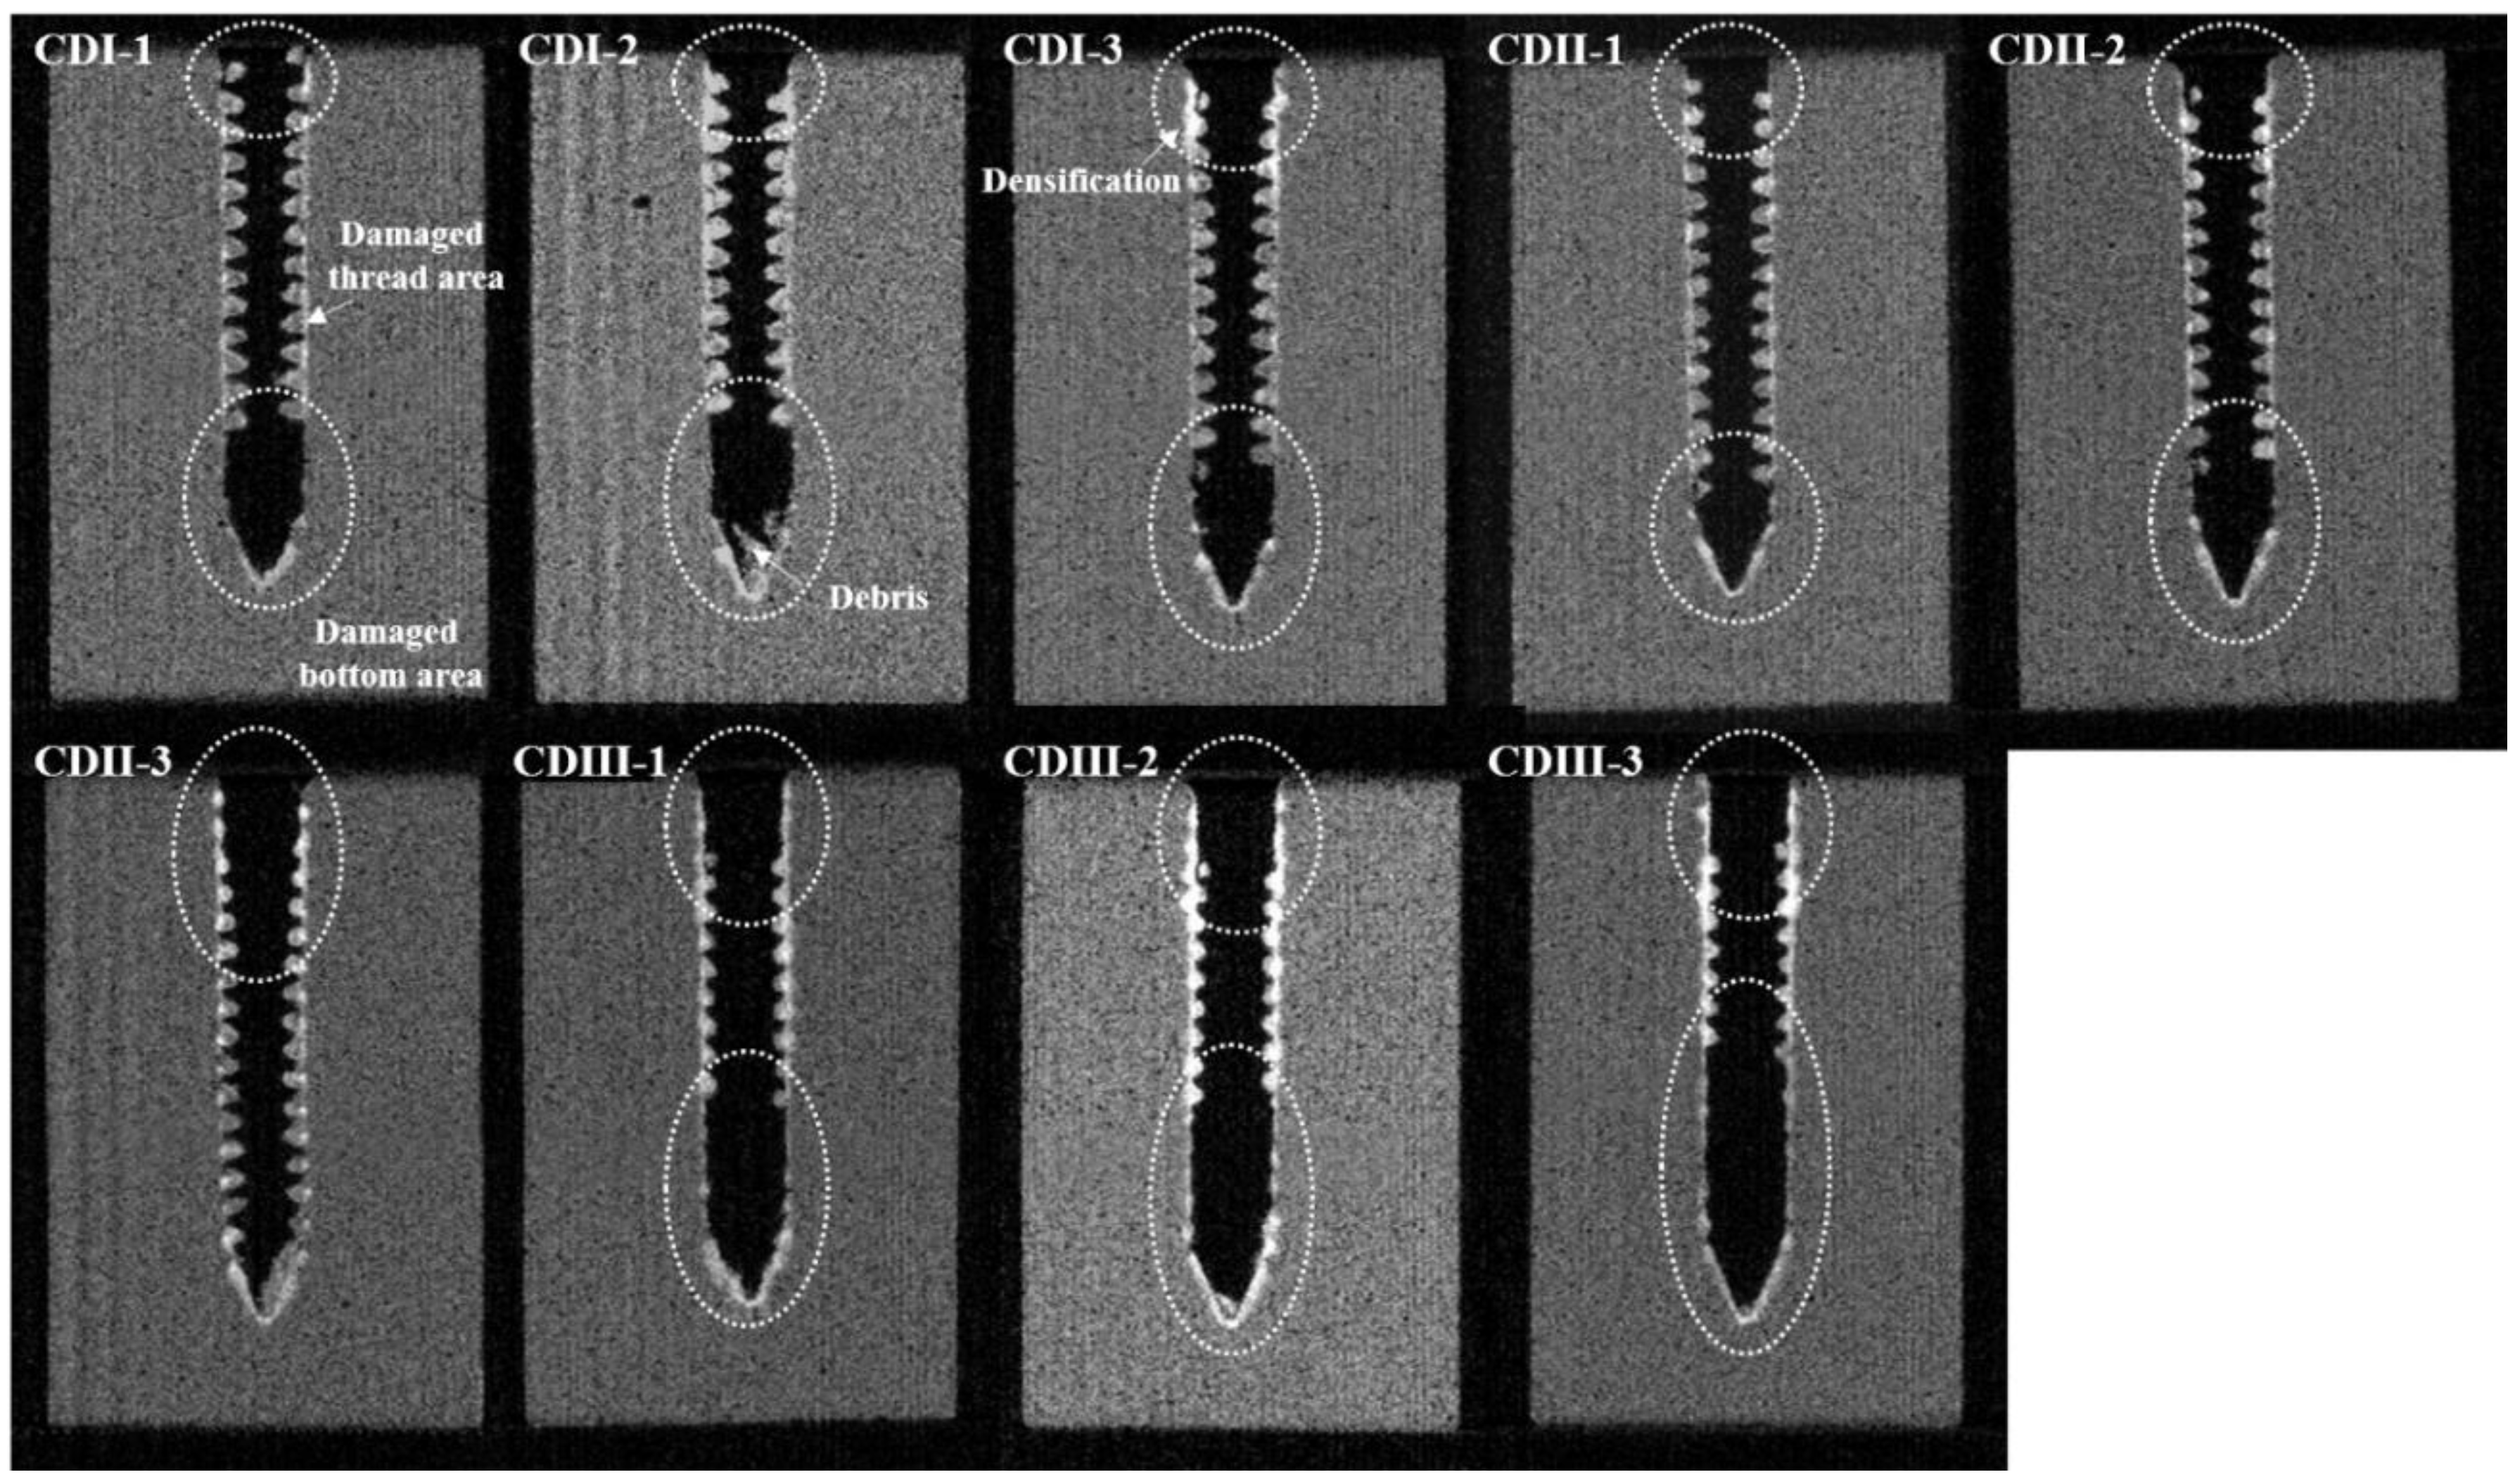
In order to more precisely analyze the pullout behavior with screw designs, a cross-section of the artificial bone after the test was analyzed by using a micro-CT.
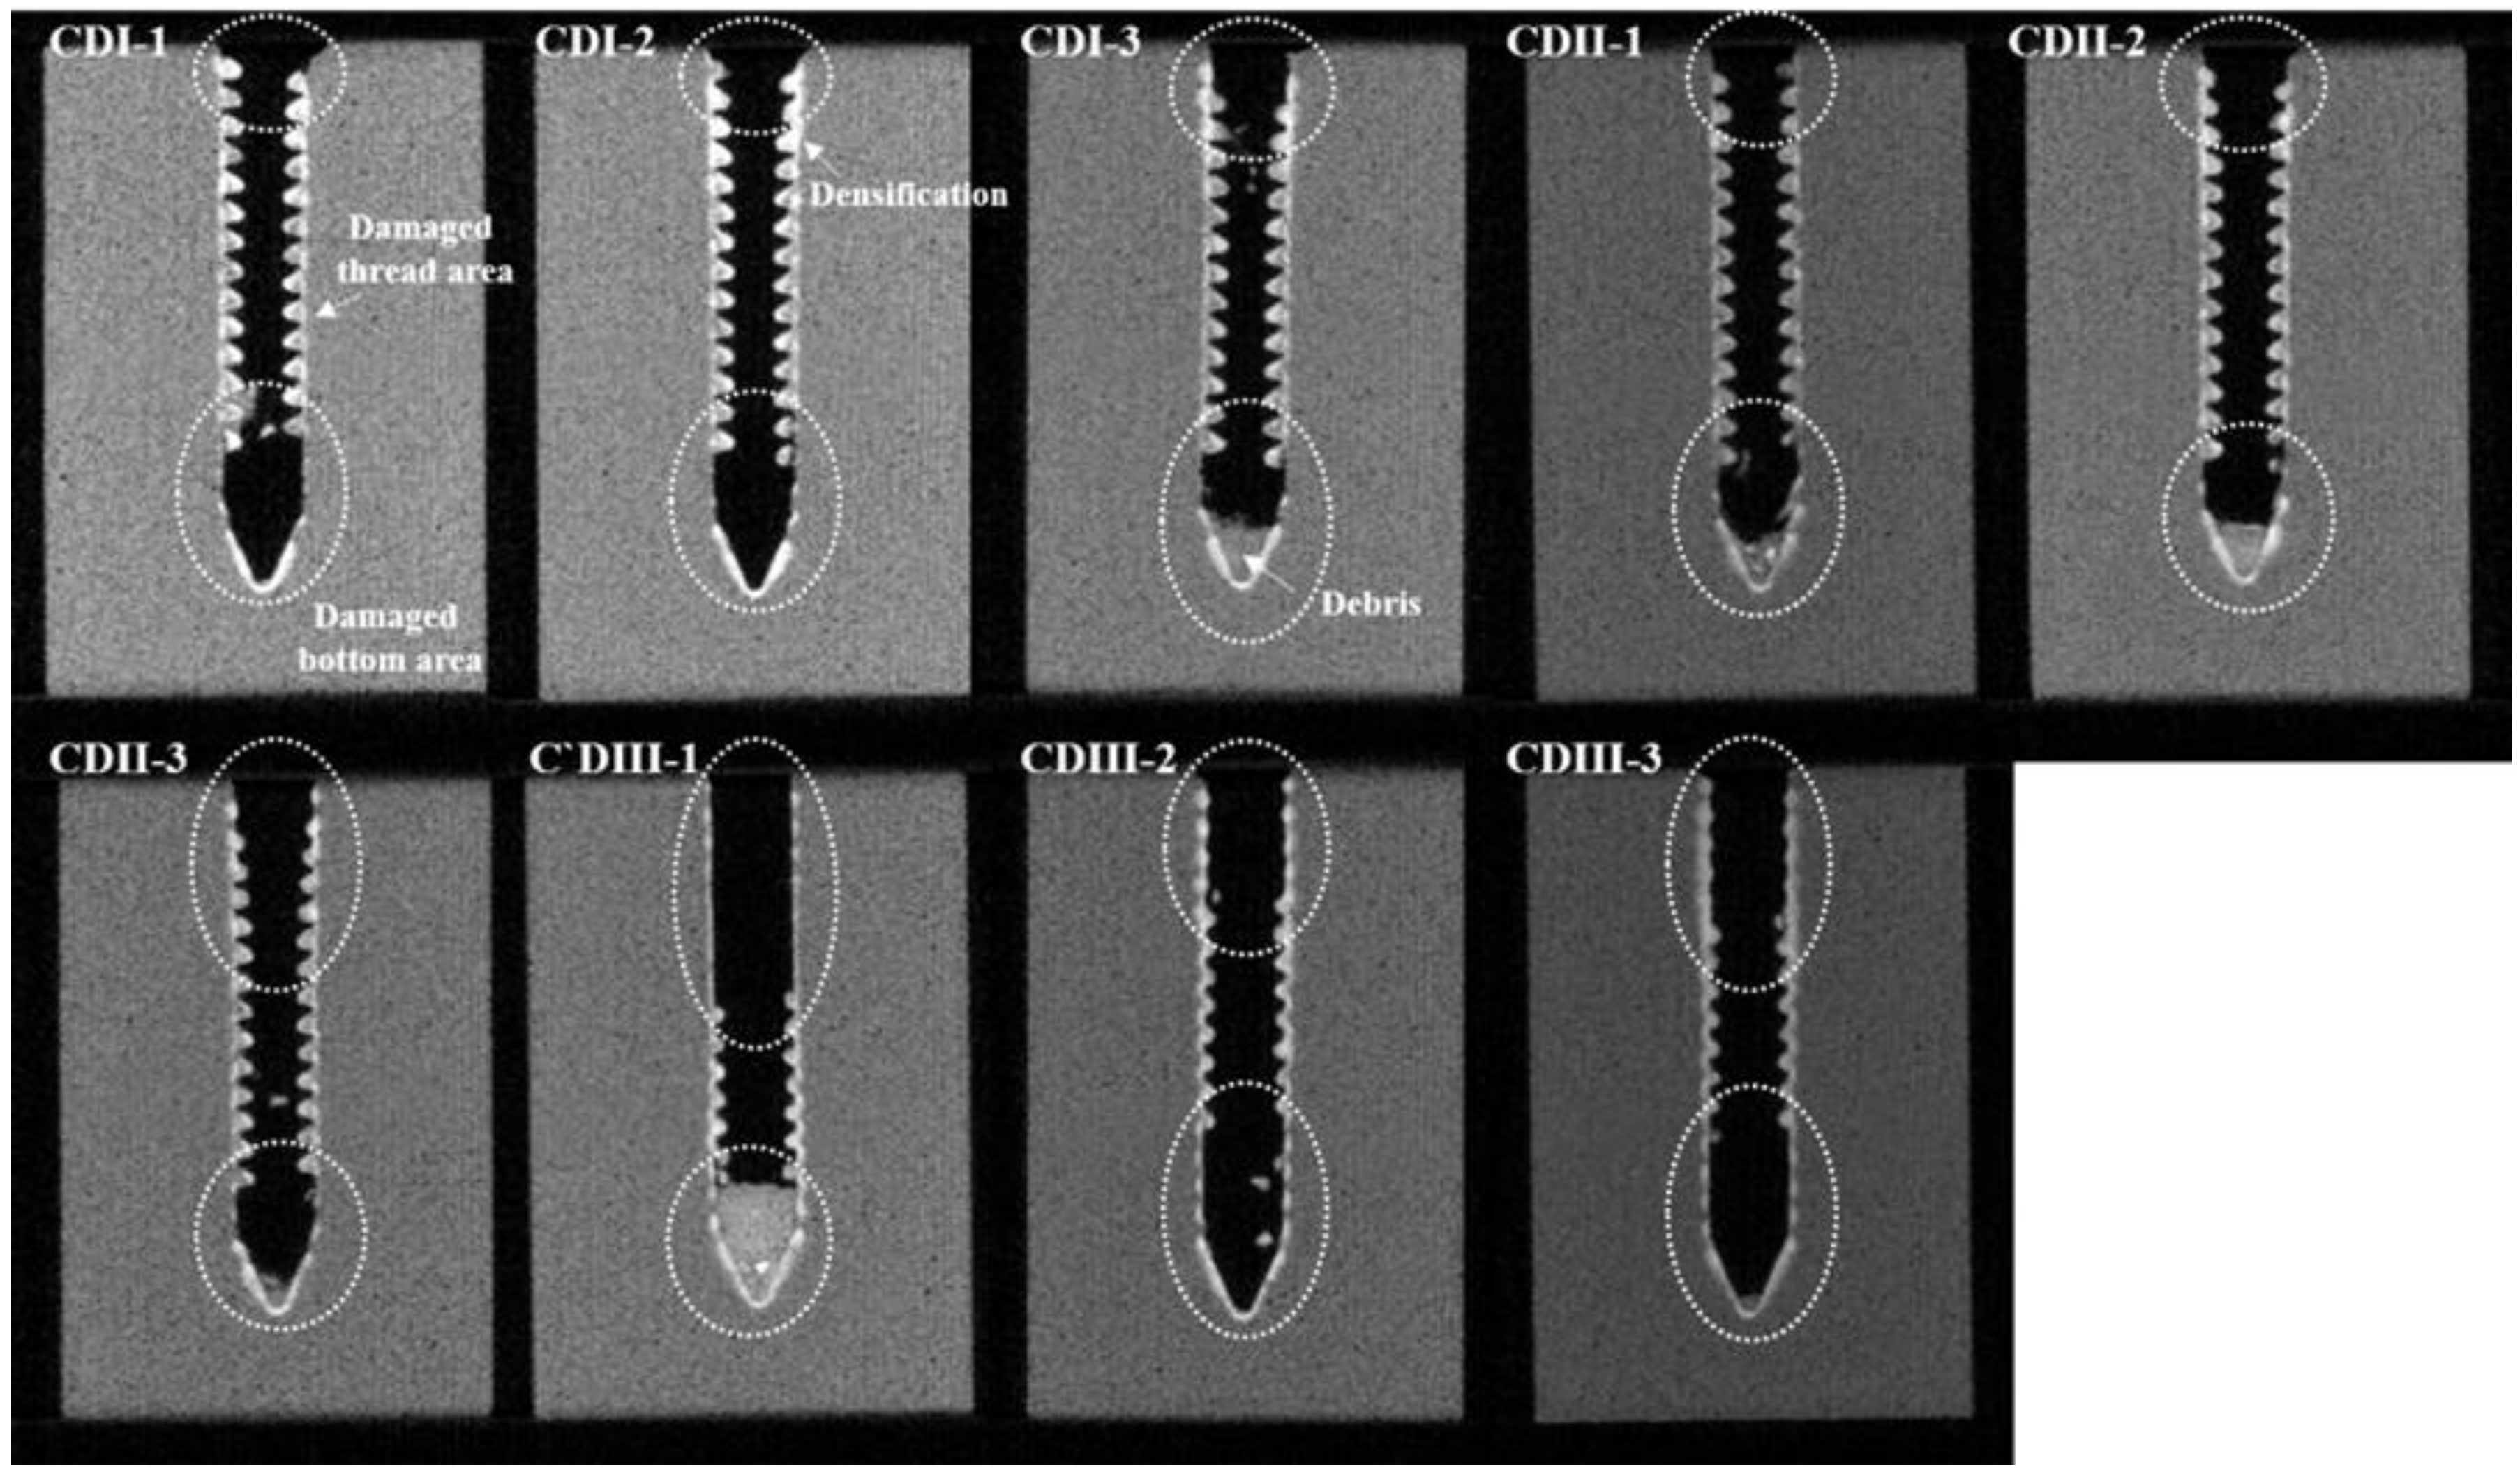
Figure 9 and
Figure 10 show the cross-sectional images of an artificial bone specimen (grade 10 and grade 20, respectively) in which the screw was removed after first debonding with each screw design.
In the grade 10 section, damage along the shape of the screw and fracture of the screw tip were commonly observed. However, when the core diameter increased (from CDI to CDIII), the fracture part of the upper region of screw increased and exhibited a distinct difference. In the CDI and CDII groups, when the conical angle increased, the length of the upper damaged area increased, and the density also increased due to damage to the artificial bone. Conversely, in the CDIII group, the degree of damage wherein length and density increased in the upper damaged area was similar irrespective of the conical angle.
Grade 20 showed a tendency similar to that of grade 10. The CDI and CDII groups exhibited an increase in the upper damage area, and density increases in the artificial bone when the conical angle increased. In the CDI region, however, the damage area of the lower part appeared smaller when compared with the damage area in grade 10. Specifically, in the CDIII group, all the threaded parts in the upper and lower parts were almost eliminated. Specifically, CDIII-1 design was mostly damaged and destroyed in the upper part.
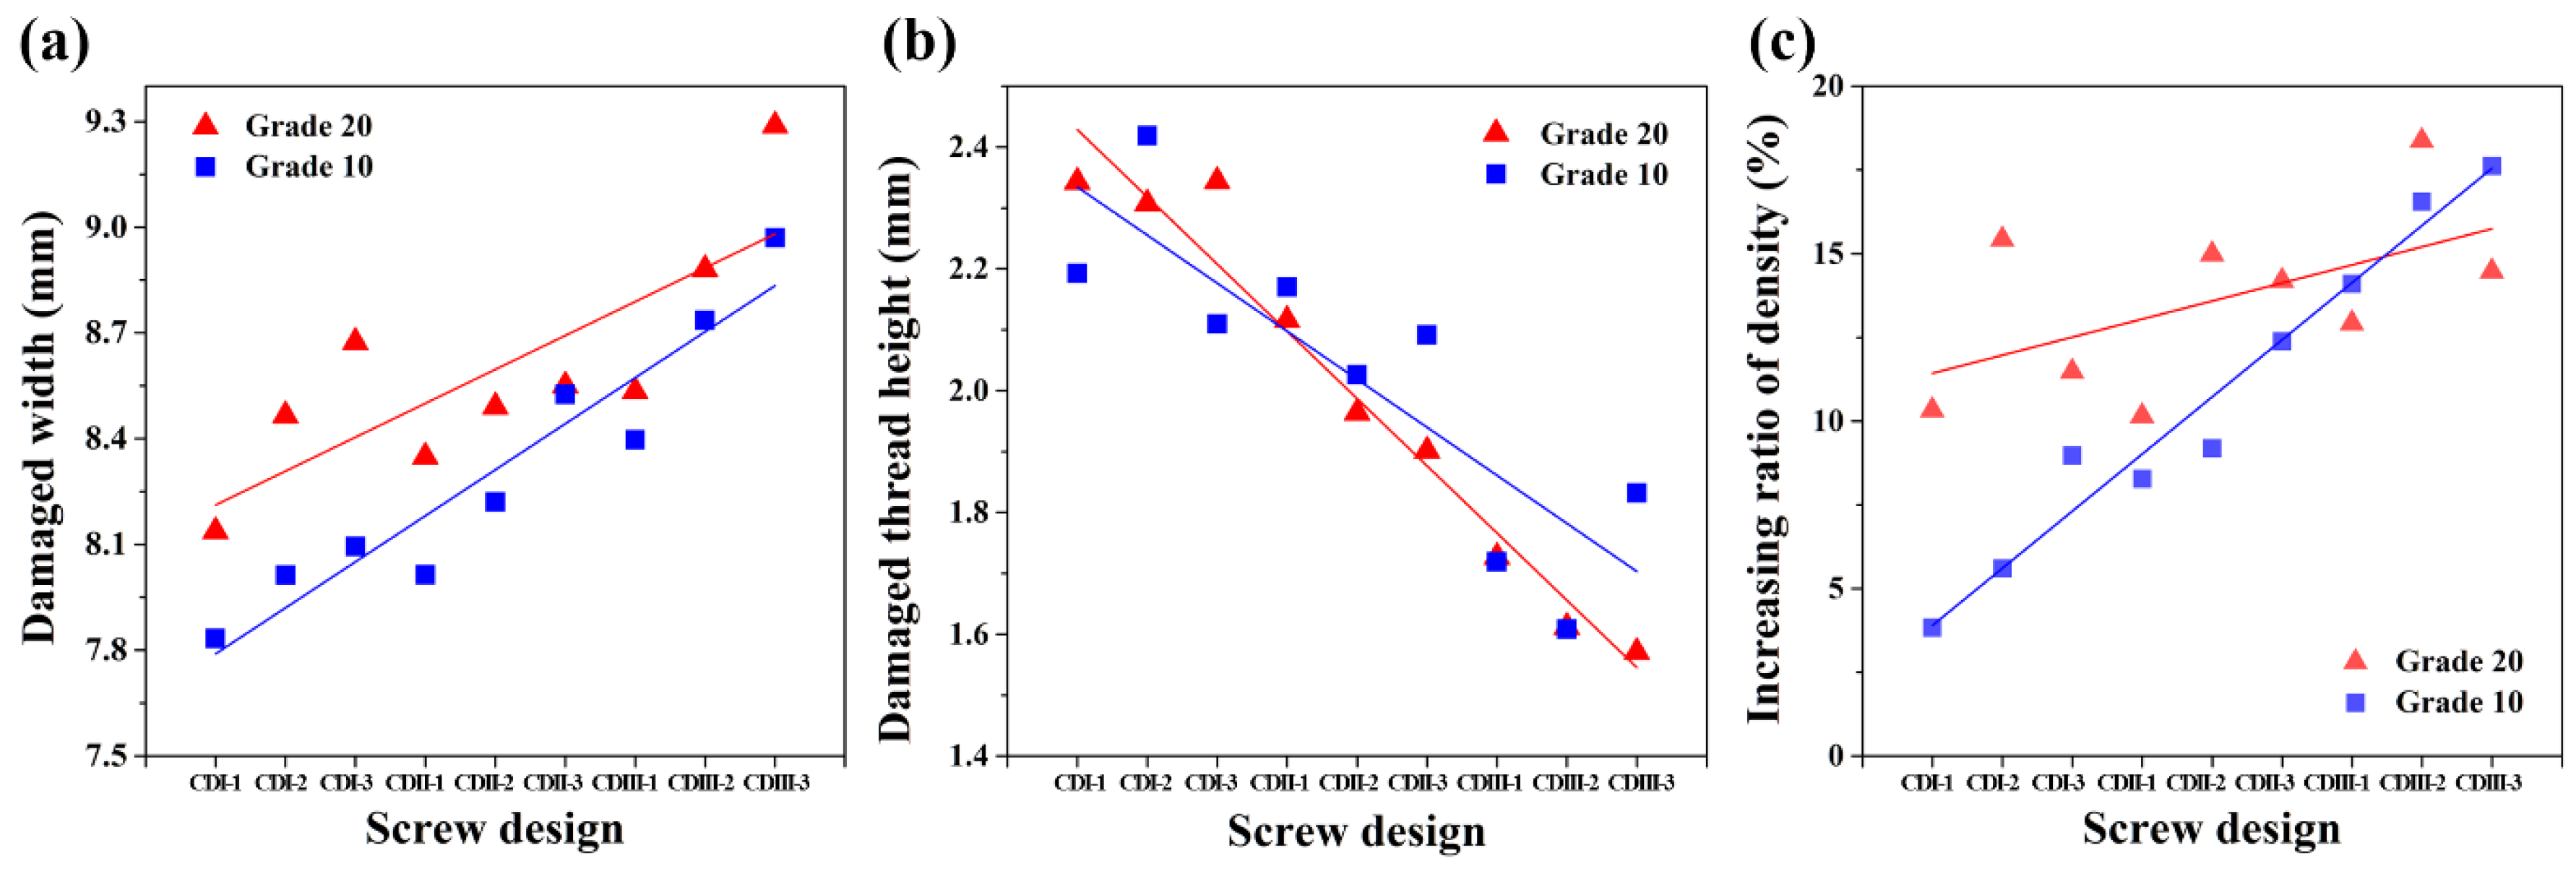
The damage width in the vertical direction of the screw insertion direction was measured in the cross-sectional image (
Figure 9 and
Figure 10) of the artificial bone that was finally removed from the screw. The results are shown in
Figure 11a. The outer diameter was constant at 7.5ø although the damaged width increased sharply when the core diameter increased. Additionally, when the conical angle increased, the damaged width also showed a tendency to increase.
The height of the remained thread measured in the cross-sectional image (
Figure 9 and
Figure 10) is shown in
Figure 11b based on each density and screw design. When the core diameter and conical angle increased, the remained thread height tended to decrease irrespective of density, and the tendency was in agreement with the thread shape of the screw design. Though, when the core diameter increased, the damaged thread height decreased when compared with the actual thread height of the manufactured screw due to increases in the deformation and fracture. Specifically, when the core diameter increased, the thread height slightly decreased when the angle increased in the CDII and CDIII groups, with the exception of the CDI group with a high thread height.
Conversely, the density of the damaged area was measured and compared with the density of the artificial bone prior to deformation and damage, and the values expressed as a percentage were termed as increasing ratio of density. The values were determined as the criterion of artificial bone damage and shown in the graph in
Figure 11c. Irrespective of the density, the degree of damage of the artificial bone exhibited an increasing tendency with increases in the core diameter. In the CDI-CDII region, the degree of damage of grade 20 exceeded that for grade 10 although the degree of damage of grade 10 reversed and exceeded that of grade 20 in the CDIII group. When the distribution of the result values was linearized, the slope of grade 10 was steeper than that of grade 20.
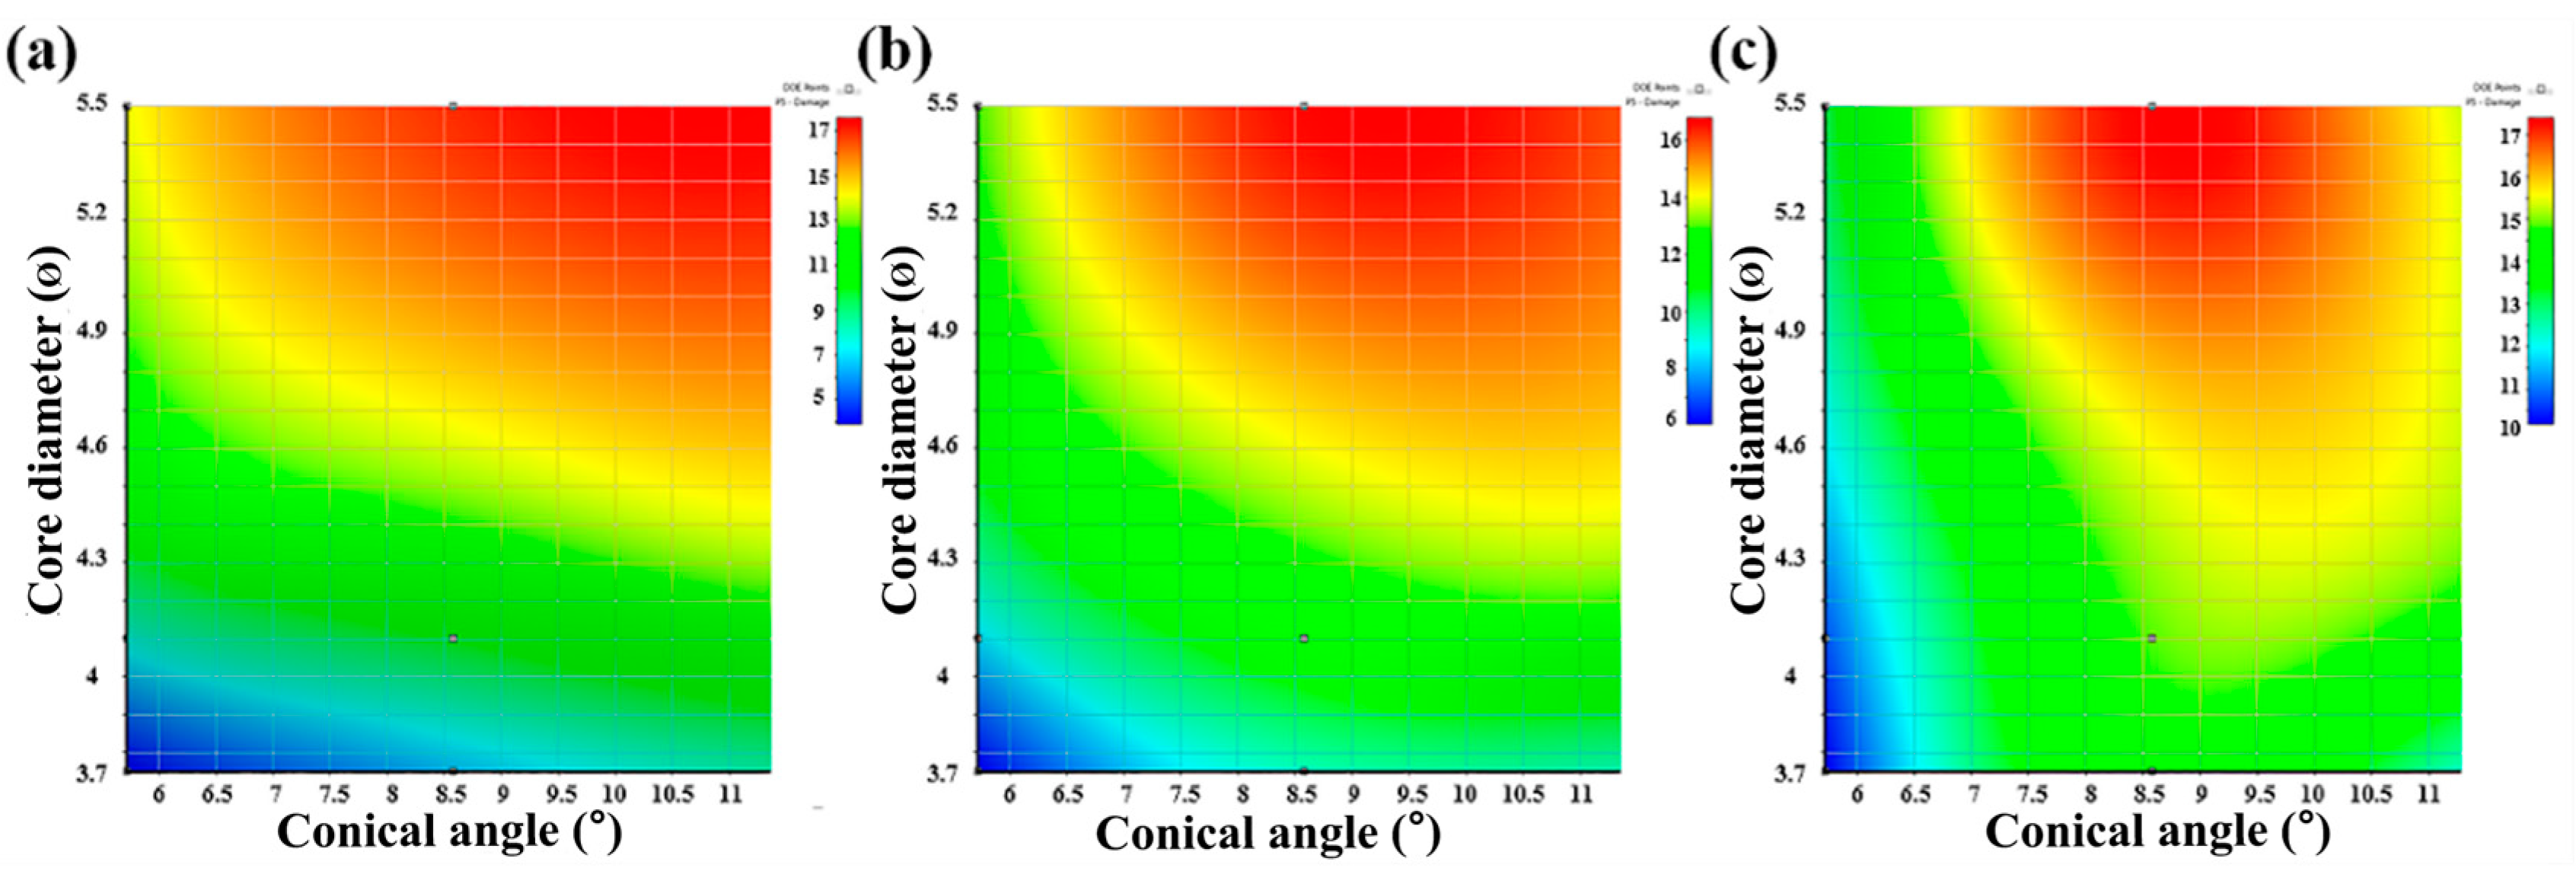
In order to more easily investigate the relationship between the core diameter and the conical angle through the 2D and 3D response surface analysis in
Figure 12,
Figure 13 and
Figure 14 are performed by ANSYS. So, the optimal screw design derived from the 2D and 3D response surface plots. In the 3D response surface plot, each x and y axes represent the conical angle and core diameter respectively, and the z axis denotes the pullout force. As shown in the image, the pullout force decreased when the core diameter and conical angle increased. Furthermore, in grade 10, the pullout force was high in the CDI group when the core diameter is 3.75ø, and the pullout force increased when the conical angle was 8.58°. At grade 10, the tendency of a gradual surface with each variable was manifested by proceeding at grade 20.
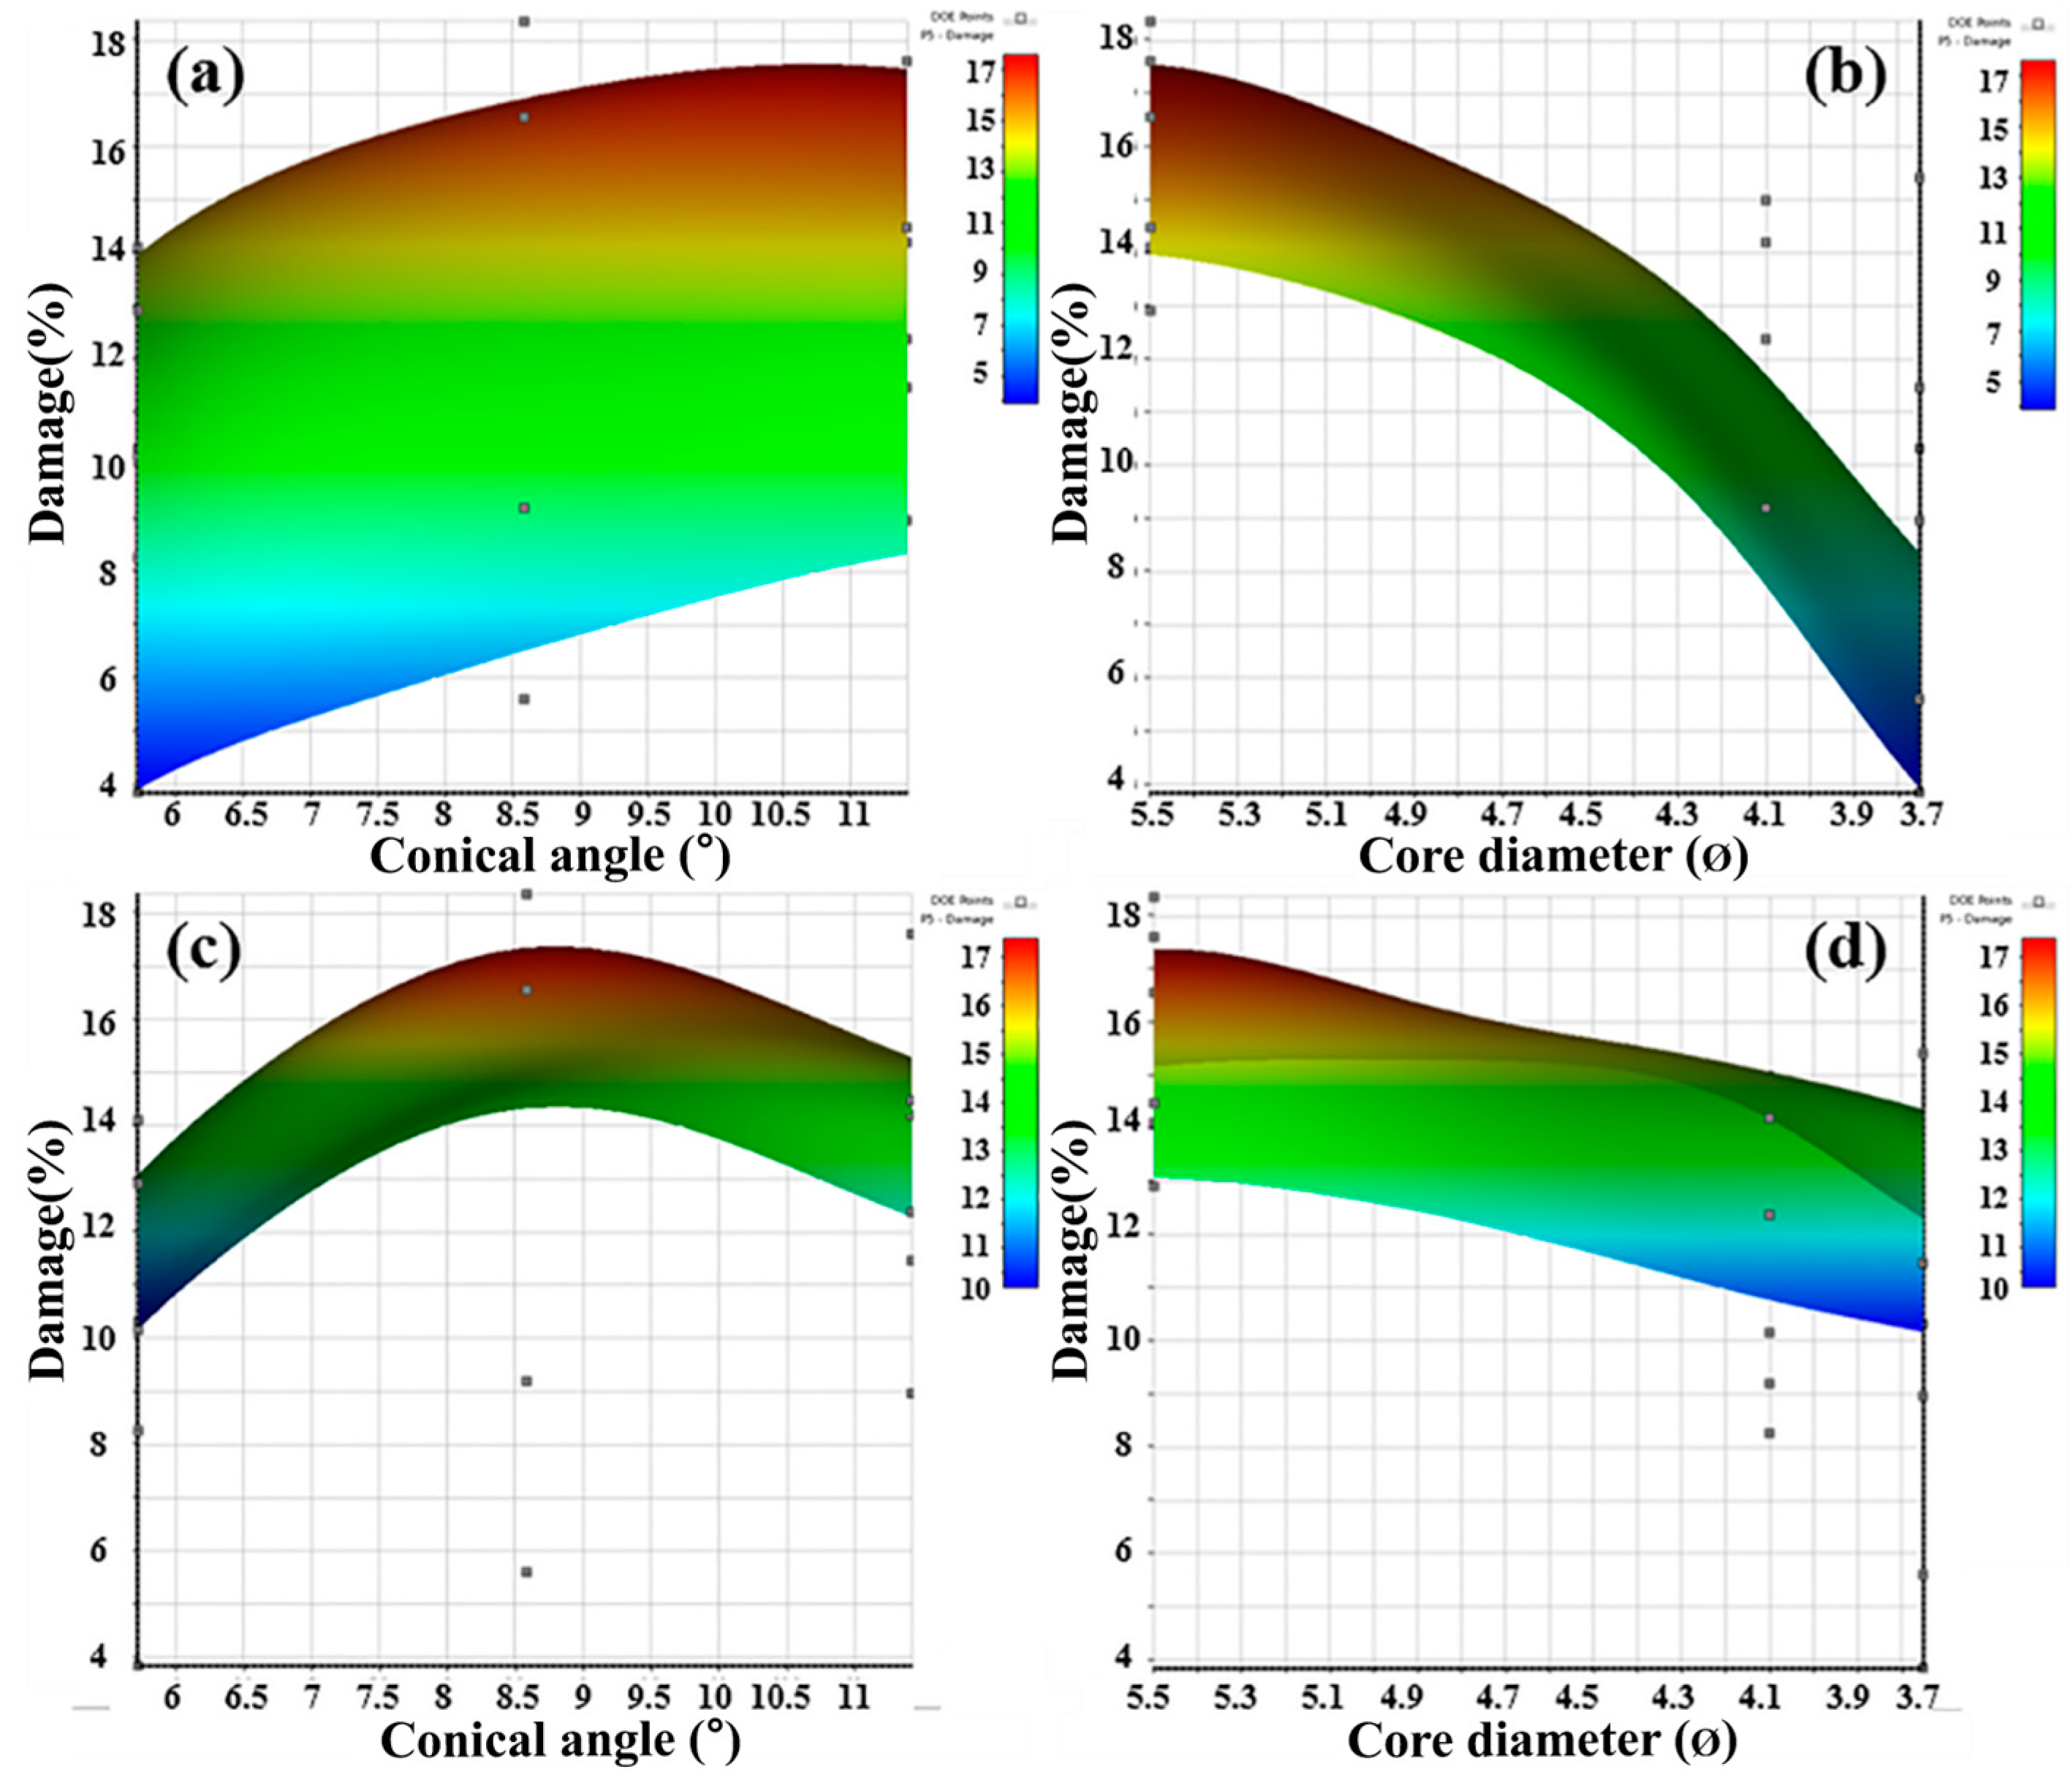
The 3D response surface plot is shown in
Figure 13 and indicates the effect of density, core diameter, and conical angle on the damage of the artificial bone. In grade 10, the damage showed an increasing tendency with increases in the conical angle although it exhibited a wide area and did not significantly affect the degree of damage. When the core diameter increased, the damage significantly increased. Conversely, the damage in grade 20 tended to decrease with a slight slope when the core diameter increased. In contrast, the damage increased at the critical point of the conical angle and decreased again when the conical angle increased. The graph is shown in
Figure 14 as the 2D response surface of core diameter and conical angle.
Based on the aforementioned results, sensitivity of density, core diameter, and conical angle with respect to the pullout force and damage are shown in
Table 2 and
Table 3. The sensitivity of core diameter on the pullout force significantly changed with increases in the densities of the CDI and CDII groups. In contrast, the density sensitivity tended to decrease when the core diameter increased. In contrast to the sensitivity of the pullout force, the sensitivity of each variable to damage exhibited a different tendency based on the density. At a low density, when the core diameter increased, the sensitivity of the density decreased and sensitivity of the conical angle decreased. Additionally, the sensitivity of the core diameter exhibited a tendency to increase and decrease with increases in the conical angle.
Conversely, when the core diameter increased at a high density (grade 20), the sensitivity of the conical angle slightly increased although the sensitivity of density decreased. Furthermore, the density sensitivity also decreased when the conical angle increased. However, the sensitivity of the core diameter did not significantly affect the conical angle.
4. Discussion
As a result of the measurement of the compressive strength according to the density shown in
Figure 1 and
Figure 2, the yield compressive stress was higher as the density increased. This was because the thickness of the wall increased due to the thickness and distribution of the cell wall and cell size in the artificial bone, and yield compressive stress increased since the distribution was uniform [
26]. Actually, due to increases in the compressive strength as the higher density of the artificial bone, energy absorption ratio in plateau region increased. As the amount of the energy absorption increased, the amount of the elastic recovery increased. Based on previous studies, the amount of elastic recovery decreased when the density of artificial bone increased under the same compression amount. This was because the internal cell volume increased and the amount of absorbed energy increased due to increases in the internal cell size when the density decreased. Therefore, the amount of recovery of the artificial bone increased when the compression load was removed. Increases in the density increased the difference in strain energy based on each change in the recovery amount because the supported stress increased due to increases in the cell wall ratio [
26]. In the case of a pedicle screw inserted into the human body based on the characteristics of an artificial bone, it was expected to exhibit different pullout strengths based on the bone density and quality of the patients. The design variable of the pedicle screw was the most common factor that affected the pullout force. In the study, a pedicle screw was designed and fabricated with variables of core diameter and conical angle among various design variables such as thread shape, thread width, and pitch. In the case of a pedicle screw inserted into the human body based on the characteristics of an artificial bone, it was expected to exhibit different pullout strengths based on the bone density and quality of the patients.
In
Figure 4, the slope of the linear section varied with density. This meant that the restoring force of the artificial bone against the stress increased in the elastic region during the pullout test when the density of artificial bone decreased. As shown in microstructure in
Figure 1, the phenomenon was potentially caused by high stress absorption capacity because the internal cell size and distribution of grade 10 exceeded that of grade 20. However, the yield strength of grade 10 was lower than grade 20 due to a thinner cell wall and lower volume ratio of the cell wall. A gradual section after the linear section in the pullout curve was termed as the debonding section. Additionally, the load in the debonding section of grade 10 was lower than that in grade 20. Thus, the bonding section was related to the stiffness, and the debonding section was related to the yield strength and fracture strength of the artificial bone.
Stiffness varied with density and screw design parameters (core diameter, conical angle). The stiffness increased with increases in the density since the stress absorption capacity of the cell and stress supporting capacity of the cell wall increased. Furthermore, a critical point angle existed with the highest stiffness among the parameters of the conical angle [
12,
27]. Based on the aforementioned results, the main variable that affected the stiffness of the pull stress corresponded to the density of the artificial bone, and the parameter for the screw design corresponded to the conical angle.
The increasing and decreasing tendency of the pullout strain energy was different according to the conical angle and core diameter as well as the density. The pullout strain energy corresponded to the stress absorbed in the artificial bone due to the stress applied to the screw [
24,
25]. During the pullout test, the pullout load direction for the screw and reaction force direction in the artificial bone were opposite. However, when the conical angle increased, the reaction force in the direction opposite to the pullout load direction was dispersed along the angle of the screw. When the conical angle increased, the strain energy decreased due to the influence of the dispersed reaction force. Thus, more stress was applied to the artificial bone that contacted the screw thread. When stresses that exceeded the yield stress of the artificial bone were applied on it, deformation occurred in the contact area between the artificial bone and screw. When the maximum stress was exceeded, the artificial bone was broken at the contact lower part and upper part of the screw, and the screw was loosened and debonded [
20]. Finally, when the conical angle increased, deformation and fracture of the artificial bone contacted screw rapidly occurred. When the load corresponded to the maximum in the pullout curve, it was termed as the pullout strength of the screw [
28].
Reasons for damage and destruction at the top were because the contact area between the screw and artificial bone decreased although the volume of the screw inserted into the artificial bone increased with increases in the core diameter. This was potentially because the density of the damaged area of the artificial bone exceeded that of the other groups. The results corresponding to the cross-sectional analysis of the damaged and fractured area of the artificial bone indicate that the bone was damaged and densified by stress and friction and subsequently fractured [
28]. In the case of CDIII-1, the damage, densification and fracture of the upper area differed from other screw designs of the same group. However, the pullout force and stiffness value were not significantly different from that of other screw designs in the CDIII group. It was considered that the residual thread area influenced the pullout force.
In the pull test, the pullout of the screw occurred preferentially in the lower part, which corresponded to the tip of the screw. During the pullout test, the screw was pulled out from the lower part of the screw, and the screw moved approximately 0.5 to 1.5 mm. Thus, the deformed and densified area of the artificial bone were brought into a frictional contact state with the screw. Continuous stress resulted in the fracture of the damaged artificial bone, and finally the pedicle screw was pulled out.
The aforementioned results indicate that the core diameter was the most influential factor for the damaged width. When the core diameter increased, the thread shape of the screw changed from a v shape to a u shape, and the applied stress difference on the artificial bone was due to the volume difference of the screw [
28].
Thus, it was considered that the results occurred because the bone damage and applied stress increased due to increases in the screw volume when the core diameter increased. Furthermore, the damaged width in grade 20 exceeded that at grade 10, and it was closely related to the pullout stiffness and yield stress of artificial bone as measured previously. The yield stress of grade 20 was three times that of grade 10. Thus, deformation and damage occurred when the screw was inserted into the artificial bone with self-tapping. An insertion stress (which is more than thrice the yield stress) was therefore applied to the artificial bone through the screw in grade 20. In the grade 20 artificial bone, more stress was applied around the contact area of the thread than that in grade 10. This result is due to the fact that the cell size of grade 20 is smaller and thickness of the cell wall of grade 20 is thicker than those of grade 10, so it more supports and disperses the stress. Thus, it is considered that the damaged area further increased. Thus, the slope of grade 20 as shown in
Figure 6a was steeper than that of grade 10. The aforementioned reason is also cited as to why the difference of pullout stiffness value in
Figure 6a was approximately thrice the density difference. The change in the height of the residual thread varied greatly depending on the design of the screw, especially as the core diameter changed. Based on the result, the core diameter had more influence on the damage when compared with the conical angle during the pullout.
Figure 11c shows a tendency that the distribution of increasing ratio of density showed steeply at low density (grade 10). The reason that the increase ratio of density in the damage area of grade 20 in CDI and CDII group exceeded that of grade 10 was that the applied stress on grade 20 was thrice that on grade 10. However, in the CDIII group, at the same density, the volume of the screw increased and stress acting on the artificial bone increased. It was considered that the increases in the density for grade 10 exceeded those for grade 20 because grade 10 exhibited lower yield strength and resistance relative to stress when compared to grade 20.
Figure 12 shows that as the density of the artificial bone increased, the contribution of the core diameter to the pullout force decreased at low density. Thus, the contribution of the core diameter to the pullout force decreased when the density of the artificial bone increased. Furthermore, when the contribution of the conical angle increased, a more complicated correlation was indicated and the optimization range of the screw design was identified. The results of
Figure 13 are consistent with the incremental trend of the pullout force at the critical point of the conical angle as observed in
Figure 12. The conical angle exhibited a critical point for pullout force and bone density, and the tendency was especially significant when the bone density increased.
The increase and decrease tendency of sensitivity was consistent with the damage tendency to increase and decrease at the critical point of the conical angle as shown in
Figure 14. The change in sensitivity corresponded to the results of damaged thread height, damaged width, and 3D surface plot as analyzed above. Based on the study, the optimal pedicle screw design could be determined in the range of the parameters of density, conical angle, and core diameter.
The first limitation of this study was use of artificial bone instead of the human vertebrae. The PUF used in this study was similar to osteoporosis and normal bone density and it was cost effective. In addition, the correlation analysis between the screw designs and the pullout force could be analyzed more accurately since it was possible to limit various variables appearing in the actual human bone. However, a limitation in that it was necessary to conduct experiments in the environment most similar to the human body and to analyze the results accordingly. The second limitation was that the torque value at the time of insertion not considering the effect on the pullout force. In the pullout test performed in this study, there was not enough analysis between the torque and the pullout force because, there was various human errors for the insertion, and the pullout test was carried out by the pullout specialist institution. The necessity of study that reveals this correlation was recognized due to the large influence of torque on the pullout force and bone damage in the previous studies [
29,
30].
Thus, a follow-up study of this study will be carried out.

 ,
, 


