Article

The Effects of Selective Laser Melting Process Parameters on Relative Density of the AlSi10Mg Parts and Suitable Procedures of the Archimedes Method

1
Department of Material Science and Engineering, Monash University, Clayton, VIC 3800, Australia
2
School of Science, Northeast Agricultural University, Harbin 150030, China
3
School of Mechanical Engineering, East University of Heilongjiang, Harbin 150080, China
4
Monash Centre for Additive Manufacturing, Notting Hill, VIC 3168, Australia
*
Author to whom correspondence should be addressed.
Appl. Sci. 2019, 9(3), 583; https://doi.org/10.3390/app9030583
Submission received: 14 December 2018 / Revised: 25 January 2019 / Accepted: 28 January 2019 / Published: 11 February 2019

Abstract

:
In view of the importance of accurately measuring the relative density of a selective laser melted (SLMed) part for optimizing the selective laser melting (SLM) processing parameters, suitable procedures of the Archimedes method considering the surface-connected cavities were proposed by comparing the results using the Archimedes method with image analysis. The effects of the SLM processing parameters on the relative density of AlSi10Mg were investigated using the proposed procedures of the Archimedes methods and image analysis. Fourteen SLMed samples were produced by different SLM processing parameters according to Doehlert Matrix. The regression models correlating relative density and three SLM processing parameters (laser power, scan speed, and hatching distance) were built and the optimum parameter combination to get a high relative density was obtained. By plotting the response surfaces and contours of the regression models, it was found that the relative densities are both higher at the combination of the higher scan speed, higher power, and lower hatching distance and at the combination of a lower scan speed, a moderate laser power, and a optional hatching distance. It was also found that the parameter of hatching distance is the crucial parameter to get a high relative density and to get high mechanical property.

1. Introduction

Selective laser melting (SLM) is of huge interest for the production of complex shaped metal parts for the gas turbine industry and some nuclear applications [1,2]. The SLM process uses a laser, which scans over and selectively melts metal powder in a powder bed to build 3D components layer by layer according to the design in a computer-aided design (CAD) file [3].
AlSi10Mg (a hypoeutectic alloy in the Al–Si–Mg system) is a widely studied material. The AlSi10Mg alloy is highly demanded for many applications in aerospace, automotive industry, and heat exchanger products [3], due to its lightweight, low thermal expansion and recycling costs, and high mechanical properties [4]. There are several studies of this alloy using SLM [5,6,7]. Furthermore, AlSi10Mg components have a wide range of mechanical properties, an extremely fine microstructure, and hence a high hardness [8,9].
Components of AlSi10Mg of nearly 100% relative density can be produced using SLM [7]. However, in addition to the advantageous results, a few papers mention that pores and other imperfections reduce the density of the components [8,9,10]. Kempen et al. [7] reported that spherical porosity is generally due to entrapped gases. Weingarten et al. [8] presented the imperfection that is caused by not completely melted powder having a statistically geometric shape. During SLM, if the non-optimized processing parameters were used, different imperfections (cracks, gaps, pores, cavities) would occur, which all reduce the relative density of the component.
Furthermore, the porosity directly affects mechanical strength [11], fatigue property [12], and elongation to rupture [13]. The selective laser melting (SLM) process parameters influence the fabrication process and must be carefully adjusted to produce parts without defects such as porosity, cracks, and altered chemical composition by selective vaporization. [14,15].
The energy density is regarded as the only factor for process optimization, which is calculated by
Ed = P/(v · h · d),
where Ed is the energy density (J/mm3), P is the laser power (W), v is the laser scan speed (mm/s), h is the hatch distance (mm), and d is the layer thickness of the powder bed (mm) [16].
The energy density and each process parameter are all significant factors affecting mechanical properties [17,18]. The SLMed sample using a lower hatching distance would have a higher ultimate tensile strength (UTS) and yield strength for AlSi10Mg [18]. Equation (1) does not consider the effect of a single factor such as hatching distance, however, which was also taken into account during the parameter optimization [9,19]. With the decrease in the laser power, the tensile properties deteriorate because of the increasing amount of keyhole porosity [20].
The most economic way to get information about the quality of a SLMed part is the measurement of relative density. The Archimedes method is widely used to measure the solid density and porosity of powder metallurgy products. The relative density of parts has a close relationship with the existence of internal pores [21]. Nataliya Perevoshchikova et al. [22] used the Archimedes method and image analysis to assess the relative density of SLM-produced samples of Ni-basedsuperalloyIN-738LCwith sets of processing parameters.
American Society for Testing Materials (ASTM) provides two standards [23,24] for measuring the density of powder metallurgy products. ASTM Standard B311-13 [23] is only suitable for the materials with a porosity of less than 2%, not taking into account the effect of the surface-connected cavities (open cavities).These defects might be porosity and/or cavities because of unmelted powder or cracks formed during SLM.
According to Archimedes’ principle, the relative density can be calculated as follows [23]:
ρ = m i n   a i r ρ l i q u i d m i n   a i r m i n   l i q u i d ,
where ρliquid is the density of the liquid generating buoyancy, min air is the mass of the sample in the air, min liquid is the mass of the sample in liquid. ASTM Standard B311-13 uses Equation (2), which does not consider the effect of open cavities.
In order to consider open cavities in the sample, Equation (2) needs to be re-written as Equation (3) [24].
ρ = m i n   a i r ρ l i q u i d m w e t m i n   l i q u i d ,
where mwet is the mass of the liquid-impregnated sample in air, min liquid is the mass of the liquid-impregnated sample in liquid. Here, the liquid impregnating of the sample can be the same or different from the liquid generating buoyancy. According to the ASTM Standard B962-13 [24], the liquid for liquid-impregnation should be the oil with a viscosity of 20 to 60 cSt.
Finally, the relative density ρrelative in the current work was calculated as follows:
ρ r e l a t i v e   ( % ) = ρ ρ t h e o r e t i c a l × 100 ,
where ρ is the actual density of the sample; for AlSi10Mg, theoretical density ρtheretical is 2.68 g/cm3.
Some papers reported the optimization of SLM parameters in terms of relative density using the Archimedes method [7,25], X-ray scanning [13], or image analysis (micrograph of a cross-section) [3,16]. A comparison of the Archimedes method and image analysis showed that for high part densities (≥98%), the significant differences are within about 1%. [13] X-ray scanning can deliver 3D information of the internal imperfections of a sample, such as distributions of porosities, but the accuracy of this method depends on the resolutions of scanning. High resolutions result in long computing time.
Compared with image analysis, the Archimedes method would deliver more reliable results, as the whole sample volume is taken into account instead of some single cross-sections. However, image analysis can reflect the effect of unmelted powder on the results of relative density, as the cavities containing unmelted powder can be detected by macrograph of a cross-section. These cavities have a significant influence on the results of relative density, especially for the sample with a low density.
Design of experiment (DOE) reduces the number of experiments to be conducted, and hence is labor and cost effective and, at the same time, provides statistically reliable results [26,27,28,29]. Many researchers use DOE to optimize powder melting processes in SLM technology [2,25,27,30]. DOE can be categorized three classes of full factorials, fractional factorials, and response surface methodology (RSM). RSM is suitable for experiments of three or less than three factors.
Doehlert design presents advantages over other DOE for response surface methodology, such as central composite designs and Box–Behnken designs [31], as it requires fewer experiments, which are easier and more efficient. Doehlert matrixes are easily expanded in both the variables space and the experimental space [26]. The combined effects were represented by means of a polynomial model [27] for each parameter. The surface methodology was then applied to represent these effects. The Doehlert design was applied to optimize the SLM processing parameters of Ni-based superalloy [22], however, it was not applied to the optimization of Al-Si-Mg alloy in past reports.
Some papers reported the optimization of SLM processing parameters in terms of relative density measured by the Archimedes method [7,25], however, detailed measuring procedures were not provided considering the difference of relative density.
In the most recent studies focusing on optimizing the SLM process parameters [17,18], the laser power reached less than 400 W because of the limitation of equipment. Therefore, a greater range of laser power will be conducive to finding the optimum combination of processing parameters.
This paper intends to find the most suitable density measurement procedures using the Archimedes methods for SLMed AlSi10Mg samples and to optimize the SLM processing parameters (laser power, hatching distance, and scan speed) in a laser power range of 1000 W using Doehlert design.

2. Materials and Experimental Procedures

2.1. Materials

The AlSi10Mg powder (gas-atomized powder) with spherical particles and a size distribution ranging between 20 and 60 µm was supplied by FalconTech Co., Ltd., Wuxi, China. The chemical composition is listed in Table 1. Fourteen test specimens with cubical dimensions of 10 × 10 × 10 mm were manufactured by SLM using various sets of processing parameters (laser power, scan speed, hatch distance). The processing parameters were generated with Doehlert design [31] and are shown in Table 2. A Concept Laser X Line 1000 machine was used to produce samples. The relative density of the samples is estimated considering the effect of three variables—laser power (P), scan speed (v), and hatch distance (h). An experimental field was defined as P = 300–950 W, v = 500–2000 mm/s and h = 0.3–0.4 mm. Layer thickness and beam diameter were kept constant at 60 µm and 0.1mm in consideration of the distribution of powder particles size to decrease the number of variables. The effect of layer thickness on relative density was not investigated. Then, the laser energy density is given by Equation (5) [32], including the three experimental variables of P, v, and h.
E = P/(v · h).
Here, E is not calculated by Equation (2). E is the energy density (J/mm2) of energy input (J) on per unit area (mm2), because the layer thickness of the powder bed (mm) was kept constant in the current study.

2.2. Doehlert Design for Optimization of Parameters

The experimental approach using Doehlert design [27,28] was applied to develop a series of experiments to investigate the influence of the three processing parameters (laser power, scan speed, and hatching distance) and arrive at a set of optimum parameters to meet the component integrity objectives pertaining to porosity and cracking.
If this is the case, the result of Doehlert design with three parameters (laser power, scanning speed, and hatching distance) will be a second order equation with one constant term, three linear terms, three interaction terms, and three square terms, as follows:
y = a 0 + a 1 x 1 + a 2 x 2 + a 3 x 3 + a 11 x 1 2 + a 22 x 2 2 + a 33 x 3 2 + a 12 x 1 x 2 + a 13 x 1 x 3 + a 23 x 2 x 3 ,
where x1, x2, and x3 are the experimental factors and y is the estimated response. Coefficients a0, a1a23 in Equation (6) were calculated from the vector of experimental response (Y) and the matrix of factors (X):
a = ( t X X ) 1 X Y ,
where tX is transpose X matrix, X is the matrix of experimental factors as follows:
X = [ 1 x 11 x 12 x 13 1 x 21 x 22 x 23 1 x n 1 x n 2 x n 3 ] ,
where n is the total observations.

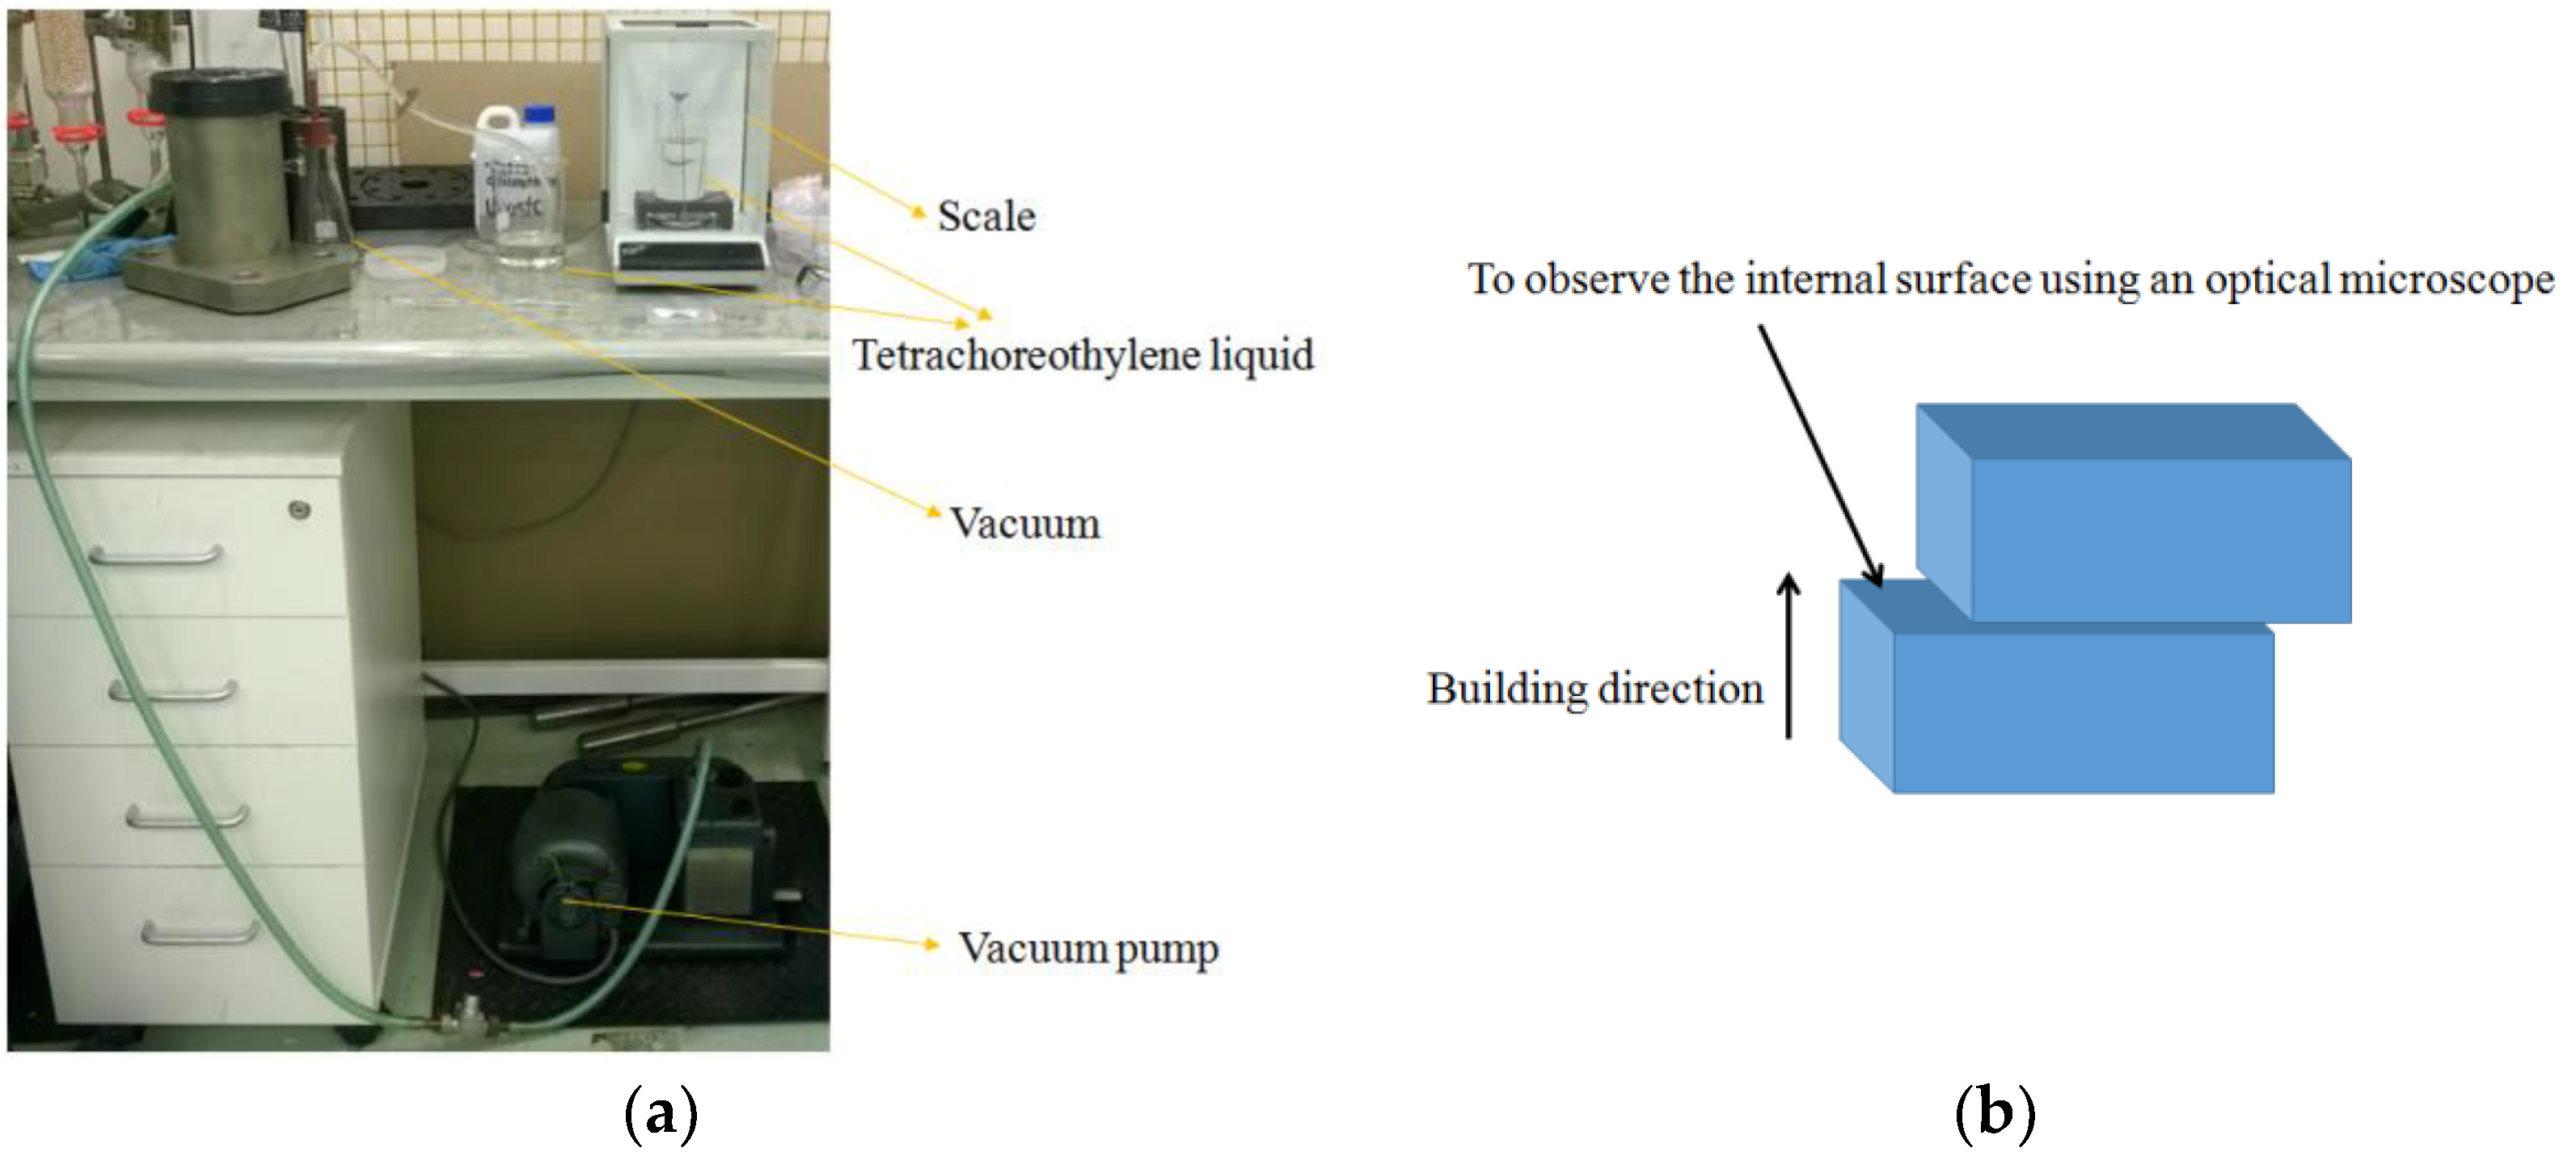
2.3. Experimental Procedures

The different procedures based on the Archimedes method were applied to measure the relative density of test samples with reference to ASTM standards [23,24]. Table 3 shows the detailed test procedures. The balance Jewel Lab FA2204B with a capacity of 220 g and an accuracy of ±0.1 mg was used for mass measurement. The vacuum pump was used to generate a vacuum environment for liquid-impregnation. The equipment is shown in Figure 1a.
All test samples were immerged in ethanol in an ultrasonic bath for 10 min to clean the surfaces, after which they were dried entirely. The measurements using the different procedures based on the Archimedes method as shown in Table 3 were repeated three times, and the average values were taken as the results.
Method 1 did not consider the effect of the open cavities on the results, it just requires measuring the mass of the sample in air and in liquid according to Equation (2). To avoid generating bubbles during measurement, the samples were immersed in ethanol for at least 30min between the measurement of mass in air and mass in liquid. All other methods considered the effect of open cavities, used Equation (3) to calculate density. Method 2-1 and method 2-2 used 96% ethanol to impregnate the sample and provide buoyancy, but did not use a vacuum pump to compare the function of surface grinding. For methods 2-2, 3-1, 3-2, and 4, the surfaces of samples were ground by a #600 grinding paper. Method 3-1 and method 3-2 used ethanol to impregnate the sample or provide buoyancy and used a vacuum pump to reduce the pressure over the samples, in order to investigate the influence of impregnation time. Method 4 used silicone fluid with a viscosity of 50 cSt for impregnation of more than 30min and used 96% ethanol to provide buoyancy for samples impregnated with silicone fluid, as silicone fluid is not insoluble in ethanol. Table 4 shows the physical property of the liquid for measurement. The relative density (%) of the sample at 20 °C and at 1 atm was calculated according to Equation (2) or Equation (3).
Besides the Archimedes methods, the image analysis was carried out to measure the relative density. All samples were cut in the middle of the cube in the direction perpendicular to the building direction, as shown in Figure 1b, and one of the cut sections was prepared for metallographic analysis. The cut section of the cut open sample was ground and polished for image analysis using an optical microscope. Samples were examined with a Nikon Eclipse Light Microscope (Nikon Instruments Inc., New York, NY, USA). Optical micrographs were taken gradually across the sample’s surface and merge into a micrograph of the whole cross-section. The volume fraction of pores and cracks from all surfaces was evaluated using ImageJ software developed by U. S. National Institutes of Health (Rockville, MD, USA). [30].
When using image analysis to measure the relative density, it is obtained by calculating volume fraction of the cavities, as follows: relative density = 1 − AC/A. Here AC/A is the ratio of the total area of cavities (AC) and the total area of cross-section.

3. Results and Discussion

3.1. Relative Density

The relative density results using different methods including the Archimedes methods and image analysis were obtained, and were plotted into the curve of relation between relative density and energy density in Figure 2. Figure 3 presents the merged microscopies of the cross-section of AlSi10Mg SLMed samples. According to the merged microscopies of the cross-section, the relative densities of the samples were calculated with ImageJ software.

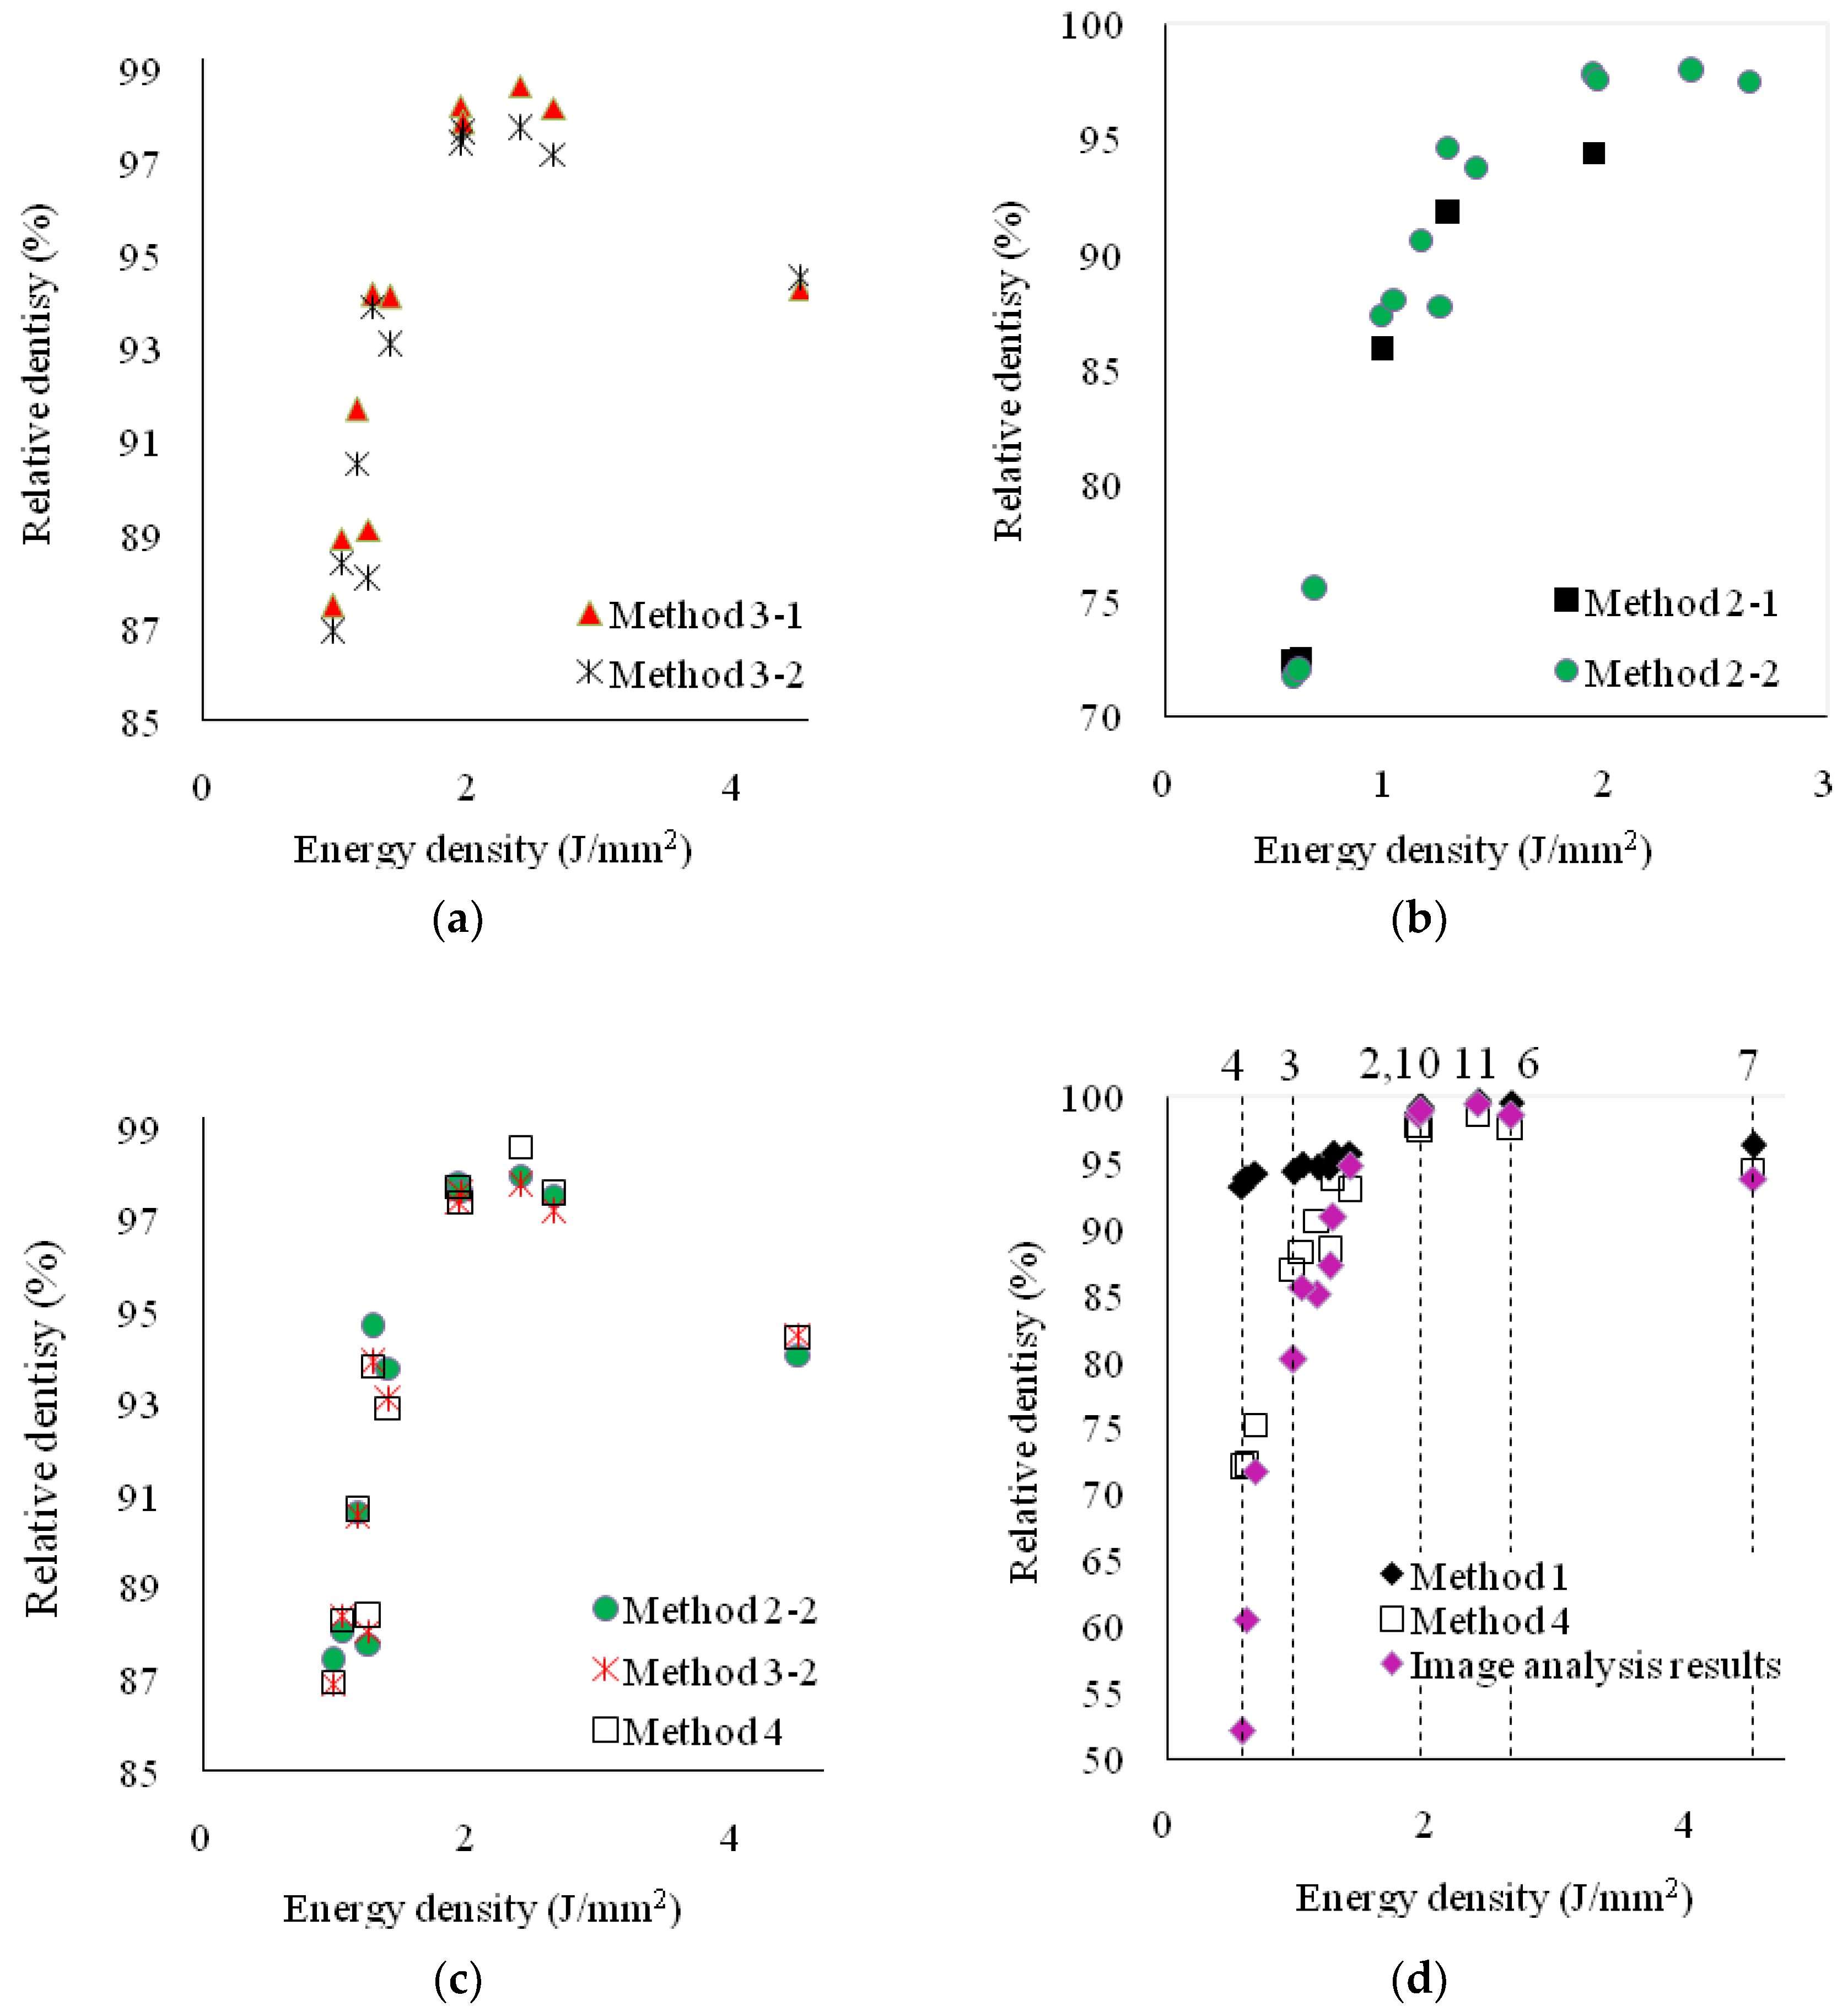
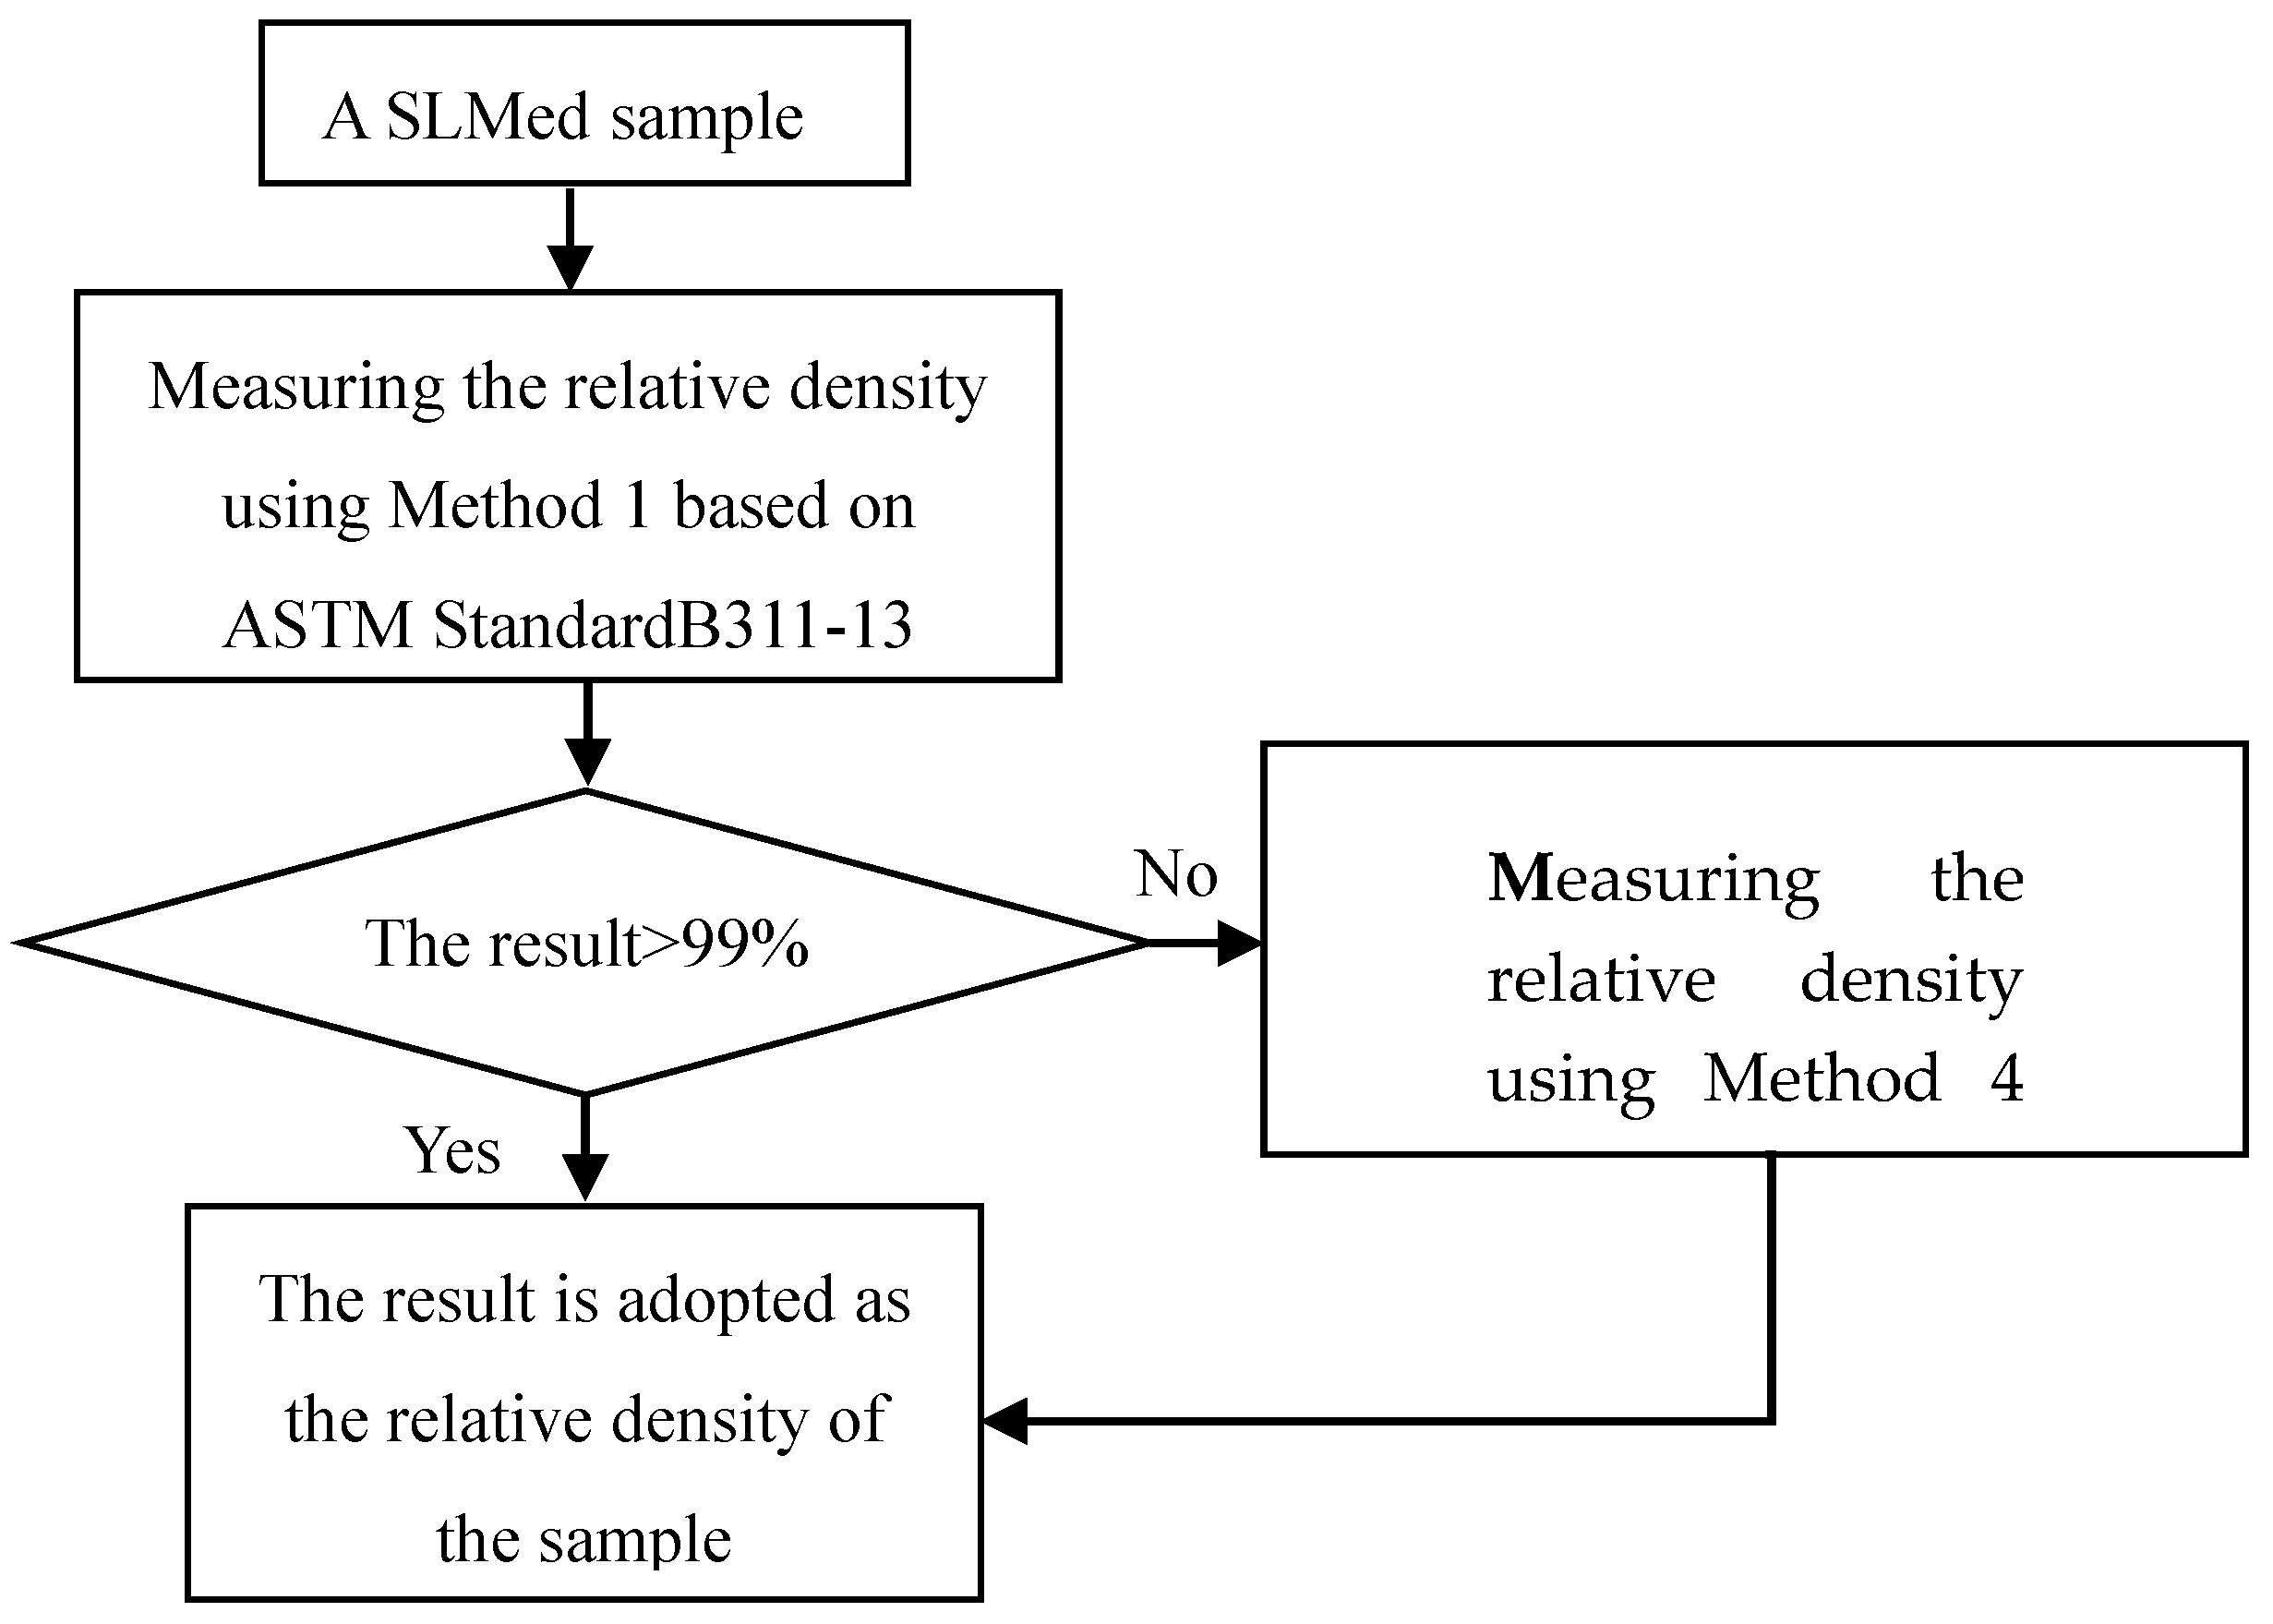
3.1.1. Archimedes Method

Figure 2a shows the comparison between results using method 2-1 and method 2-2, respectively, for the samples with SLMed surface and with ground surface. From Figure 2a, it can be seen that the ground samples have a higher density than the ones with SLMed surfaces. This is because more liquid remains on the rough surface of the SLMed AlSi10Mg samples when measuring the mass of liquid-impregnated samples. According to Equation (3), if the mass mwet is higher than the actual value, the density is lower than the actual one. Therefore, when considering the effect of the open cavities on the density measurement, it is necessary to grind the surfaces of samples to avoid excessive residual liquid left on the surface of samples.
Figure 2b gives the comparison of method 3-1 and method 3-2, which kept the test samples immersed in liquid (tetrachloroethylene) for 5 min and 30 min, respectively, for liquid-impregnation in a vacuum environment. Figure 2b shows that the density results of the liquid-impregnation of 5 min are higher than those of 30 min for almost all samples. This indicates that a sufficient amount of time is important for liquid-impregnation. Otherwise, if the time is insufficient, some open cavities would not be closed by liquid and would not be taken into account for the volume of the sample.
In Figure 2c, each method selects ethanol, tetrachloroethylene, and pure silicone fluid, respectively, for liquid-impregnation. It can be found that the results using the three different methods are very close, and there is no method significantly better than the others. Therefore, the function of the vacuum pump and the liquid with a high viscosity are not exclusive requirements for measuring the density of SLMed AlSi10Mg products if the time for liquid-impregnation is long enough.
The relative density results using method 1 and method 4 are both shown in Figure 2d. The differences between results using method 1 and method 4 reflect that some open cavities exist in some samples, especially in the sample with a lower density. This indicated that there are more open cavities in these SLMed AlSi10Mg samples using the suboptimal SLM processing parameters. So method 4, method 2-2, or method 3-2 (Archimedes method considering the open cavities effect) should be used for the AlSi10Mg SLMed samples, especially for the sample with a density lower than 99%, which is measured using the Archimedes method without considering the open cavities effect according to Table 2.

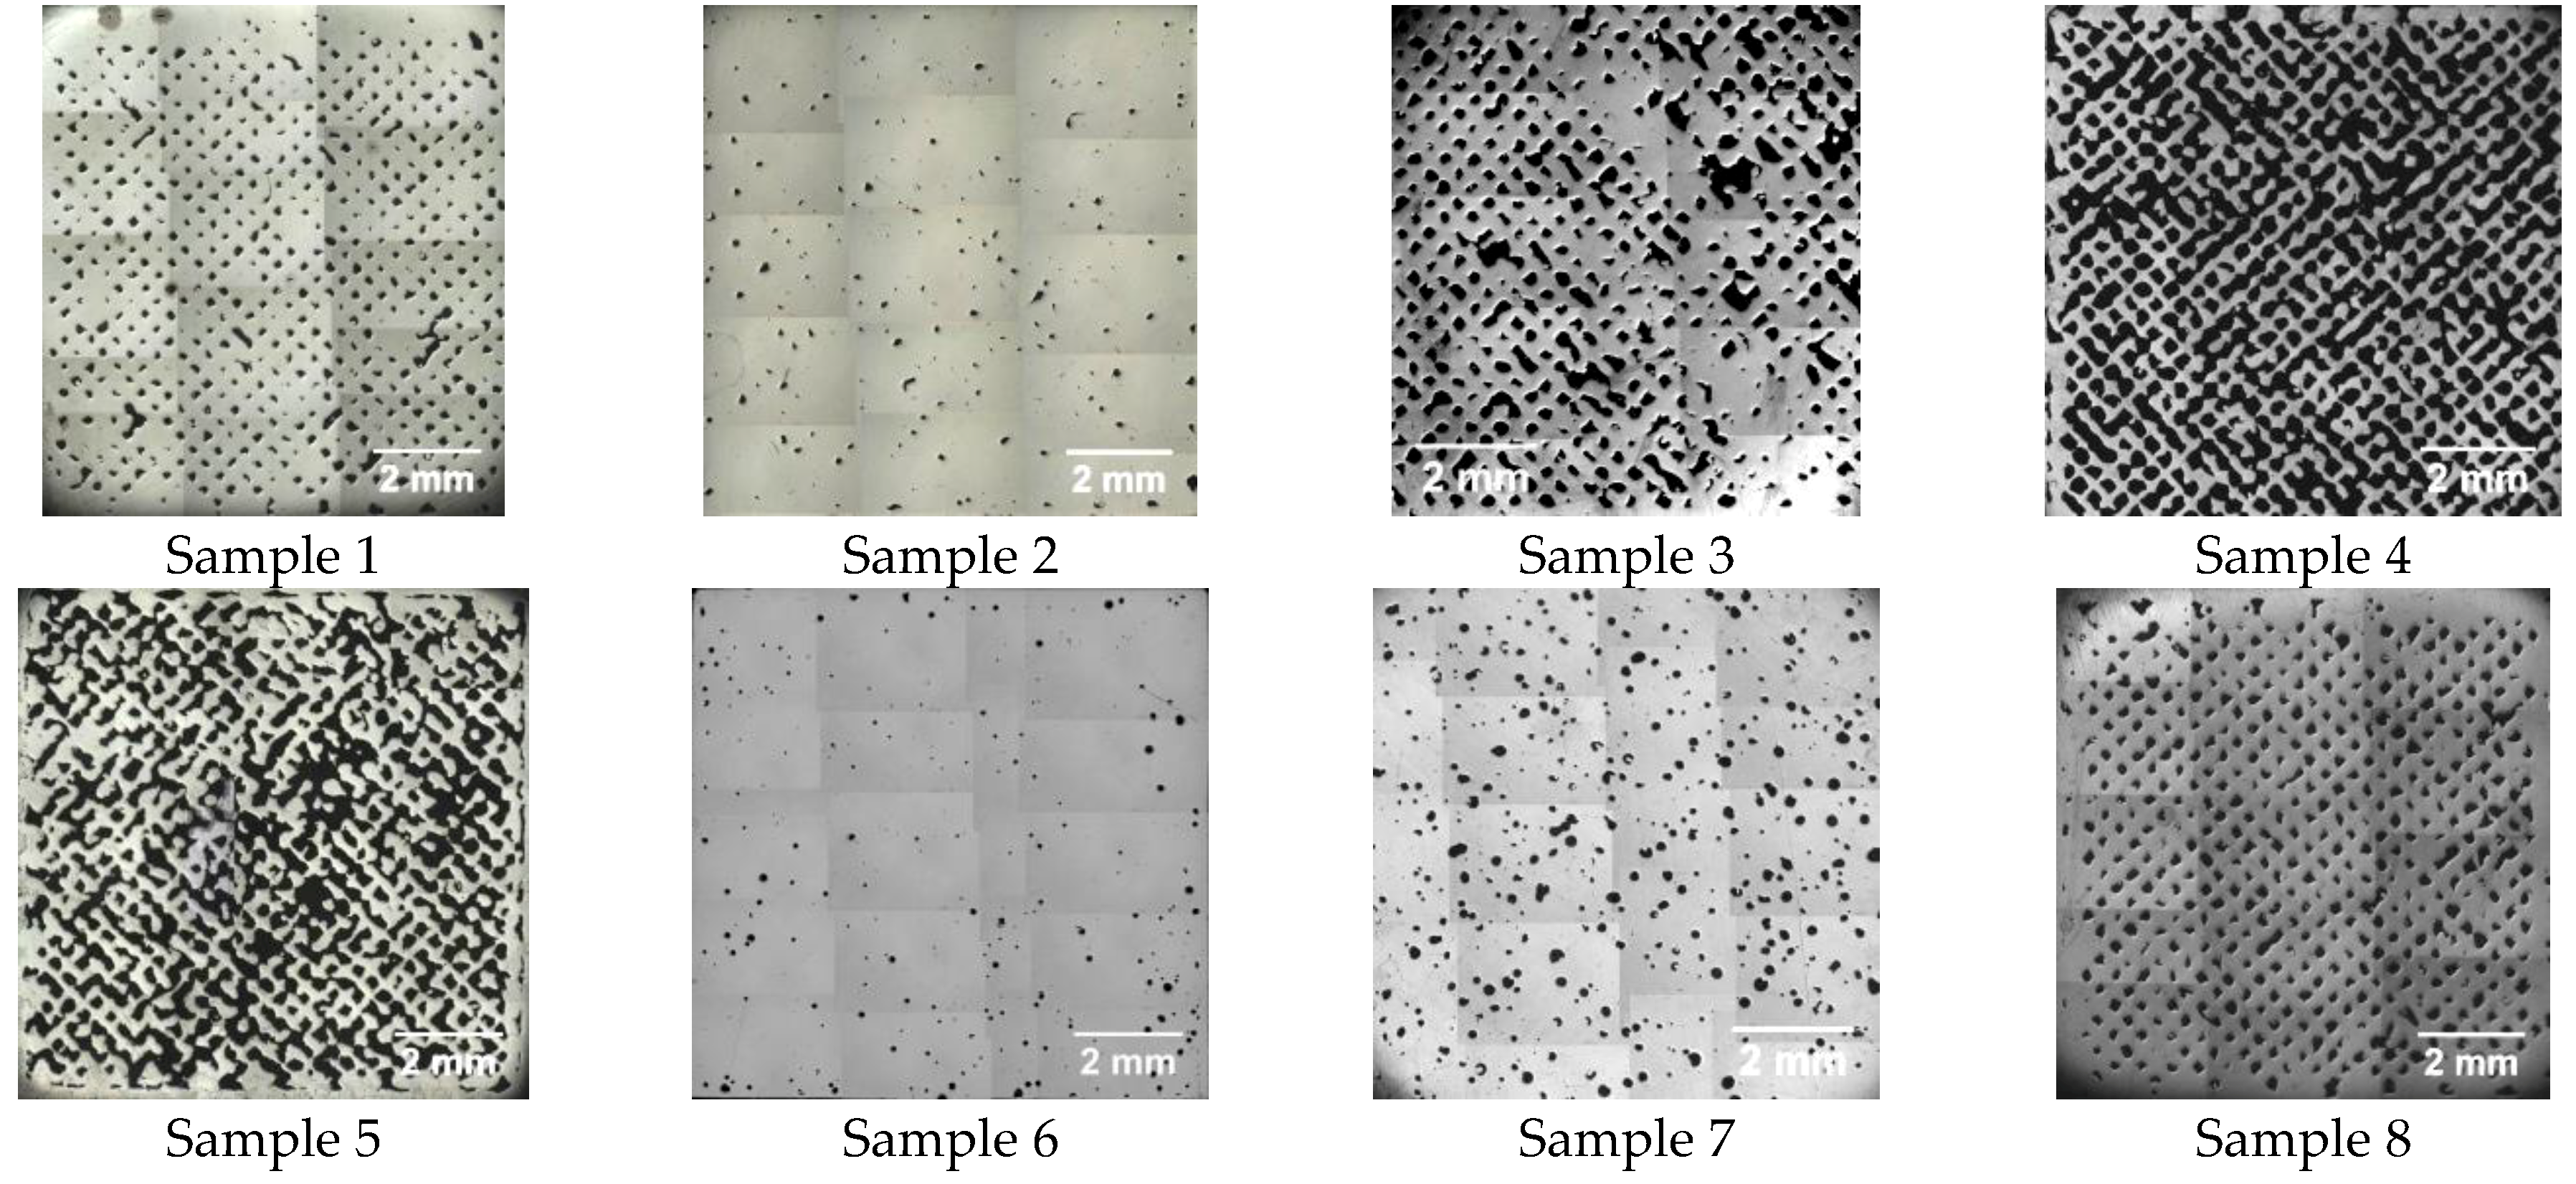
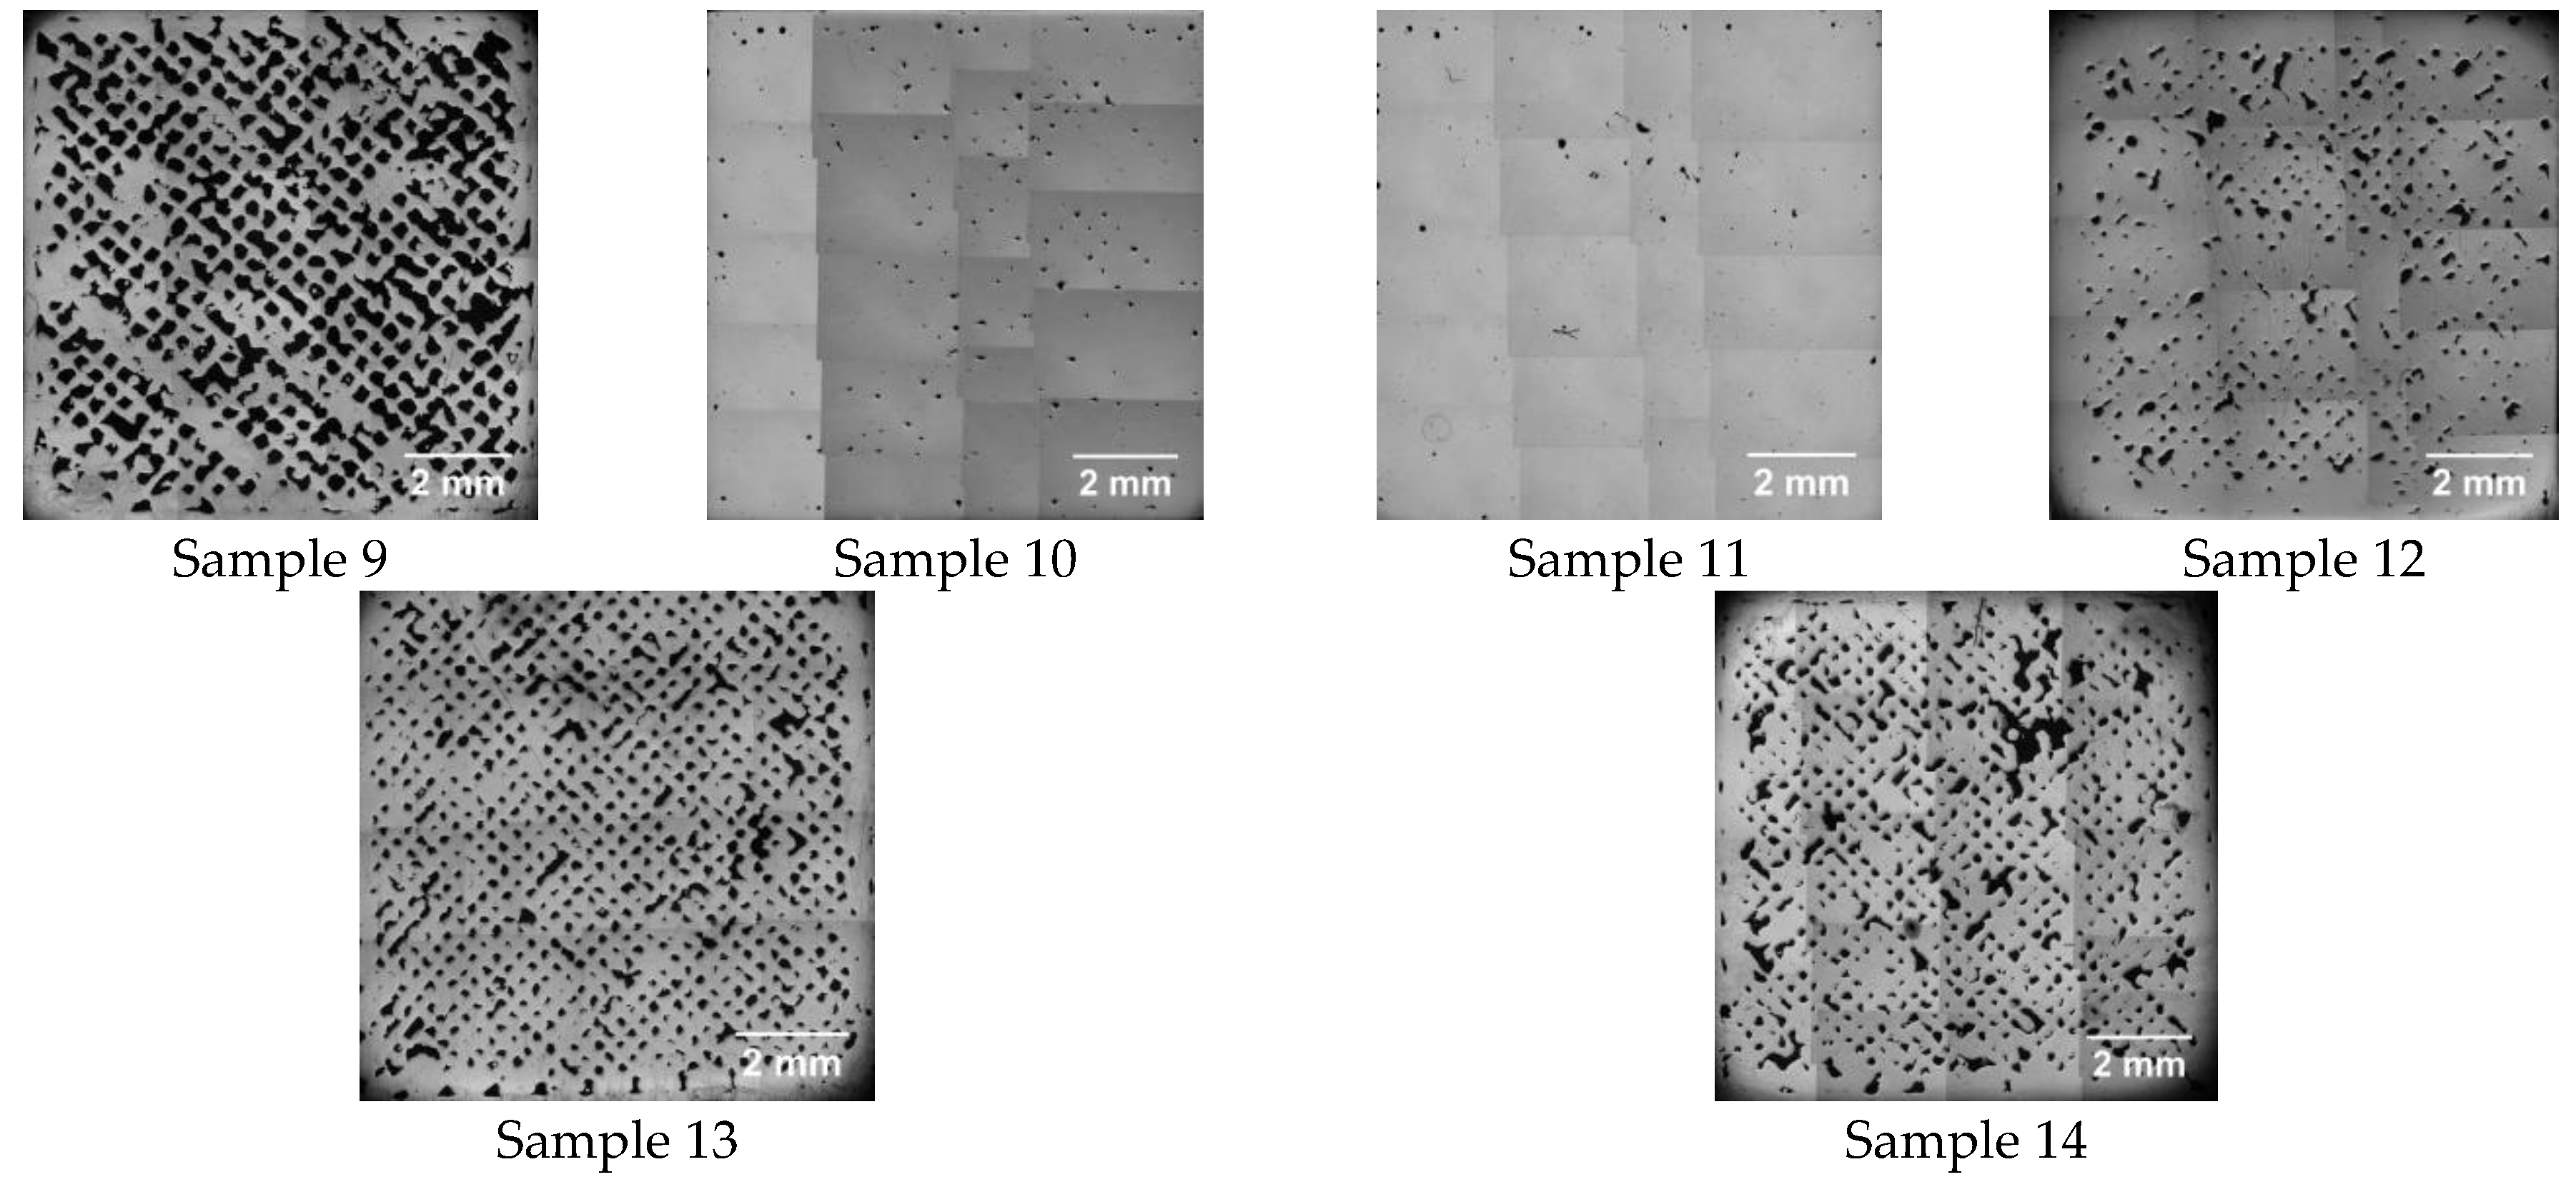
3.1.2. Image Analysis

On the basis of Figure 3, the relative densities for the samples with different SLM process parameters were measured using ImageJ software. The results using image analysis are also shown in Figure 2d. In Figure 2d, the Archimedes methods (method 1 and method 4) and image analysis obtained similar results when the relative density was near 100%. However, for the samples with a low relative density, from Figure 2d, it can be observed that the relative density results using the image analysis are obviously lower than those using the Archimedes method (Method 4). That is because some unmelted powder remained inside the sample when measuring the density using the Archimedes method. On the contrary, when measuring the density using image analysis, these unmelted powders in the cavities on the cut side were thrown out from the sample while being cut and cleaned. Figure 2d also indicates that the volume of the unmelted powder decreases with the increase of the energy density and arrived at a nearly constant level. Therefore, the relative density results using different methods are very close for samples 2, 10, 11, 6, and 7, because they are SLMed at a higher energy density(the sample numbers on the top of Figure 2d).
In addition, comparing the results of measurement using the image analysis and the Archimedes methods in Figure 2d, it can be found that the former is closer to the results using method 1 for samples 2, 6, 11, and 10 with a high density. That is because the Archimedes method considering the effect of the open cavities might cause lower results than the actual density because of the residual liquid on the surface after liquid-impregnation. The residual liquid leads to the higher mwet value, which leads to getting the lower density in terms of Equation (3). Therefore, according to Table 2 and Figure 2d, method 1 is more advisable for the sample with a high density of more than 99%, which is measured using method 1.
In the investigation of the effects of the SLM process parameters on relative density, the method named as method 4* was applied to build the regression model. Method 4* is based on method 4 and method 1. Here, method 4 can also be replaced by method 2-2 and 3-2, because they have close results in Figure 2c. The detailed procedure of method 4*is presented in Figure 4.
In Figure 4, firstly, the Archimedes method without considering the effect of open cavities according to ASTM Standard B311-13 is applied to measure the relative density of anAlSi10Mg SLMed sample. If this relative density is more than 99%, this result is adopted. Otherwise this same sample needs to be measured again using the Archimedes method considering the effect of open cavities according to ASTM Standard B962-13 (or method 2-2, method 3-2 in Table 3), and then the result is adopted as the relative density result of the sample.

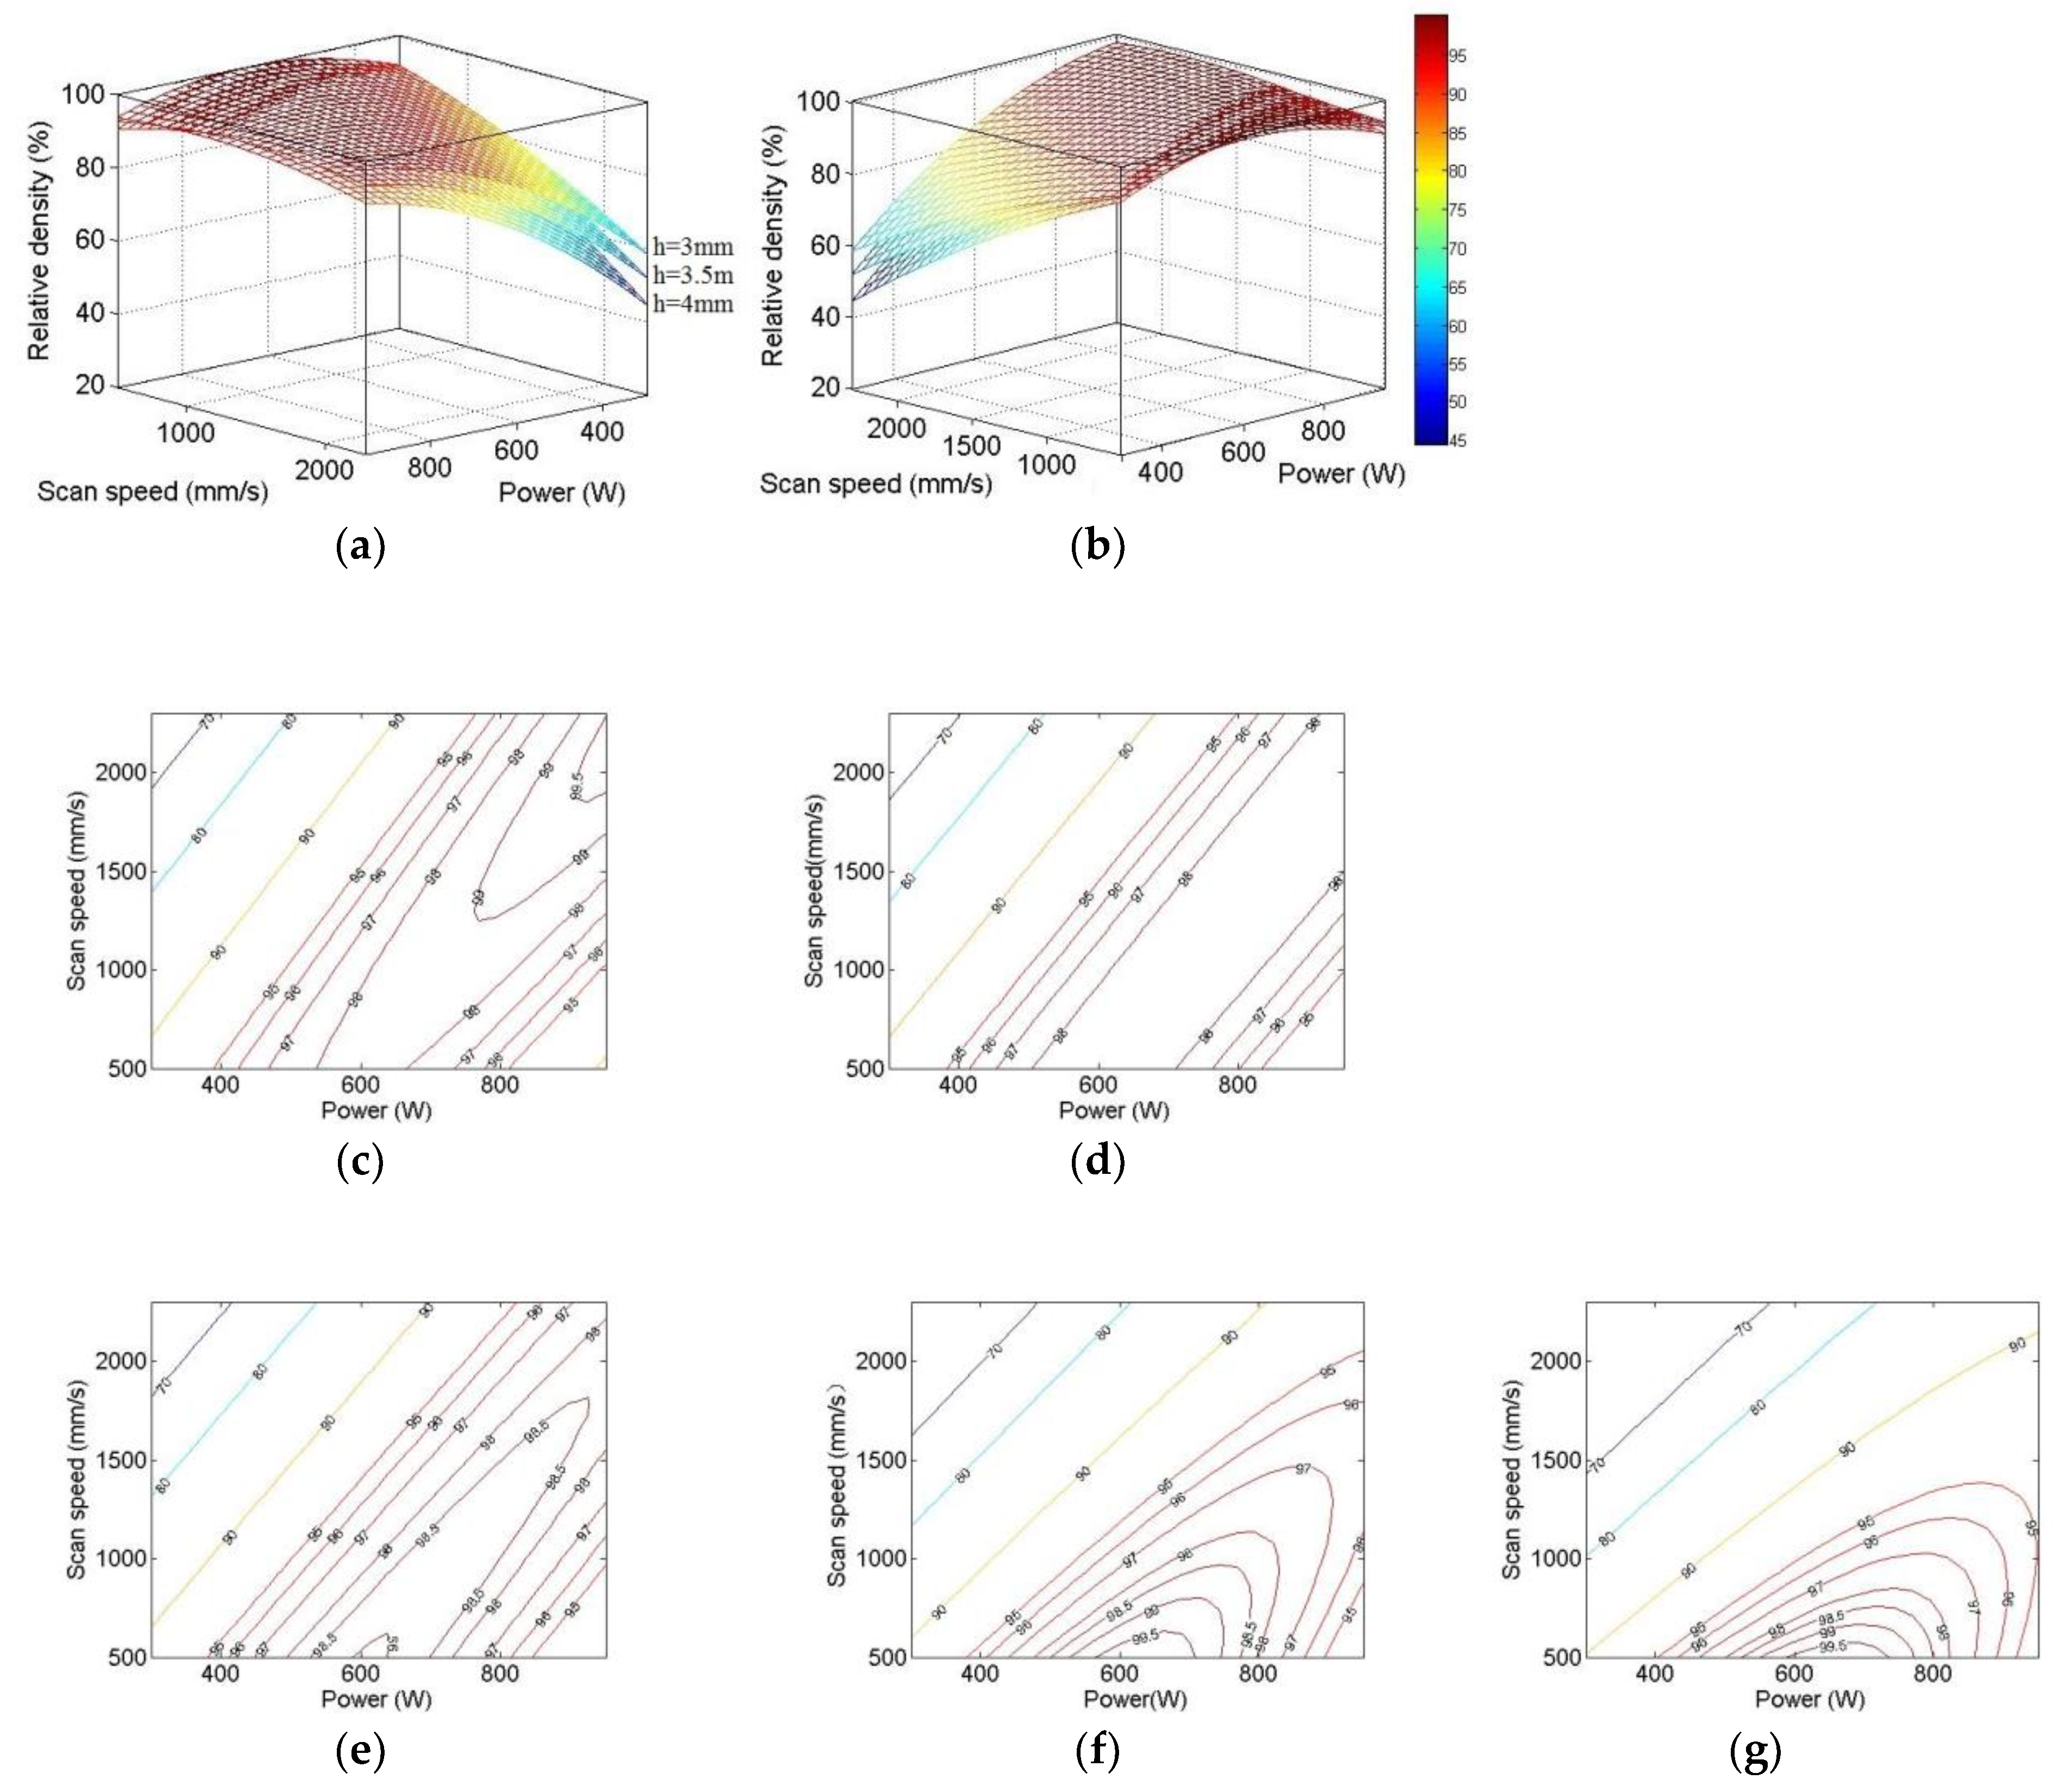
3.2. Optimization of the SLM Processing Parameters

In Table 5, the density results using different methods including the Archimedes methods and image analysis were presented.
Taking into account the influence of three variables, laser power (P), scan speed (v), and hatching distance (h), the relative density can be expressed by Equation (9).
ρ r e l a t i v e = a 0 + a 1 P + a 2 v + a 3 h + a 11 P 2 + a 22 v 2 + a 33 h 2 + a 12 P v + a 13 P h + a 23 v h
The regression constants a0, a1a23 were calculated by Equation (7). Table 6 presents the results of a0, a1a23.
Table 5 shows the measured results of relative density using the Archimedes methods. In Table 6, the value of the correlation coefficient R2 is provided as a measure of how closely the statistical model fits the data—the coefficient of determination varies between 0 and 1. F is used to perform the f test and test the regression significance of the model in Equation (9), using different combinations of the constants a0, a1a23. For this study, the threshold of F values 5.9988 at the 95% confidence level, which is determined by the freedom degree of regression and residual variation, which are 9 and 4, respectively, corresponding to the design in Table 5. According to f test theory, if the F value of regression model is larger than the threshold, the model indicates a highly significant regression. From Table 6, the F value of 8.9160 is larger than the tabled F9,4 value of 5.9988 at the 95% confidence level. Thus, the model indicates highly significant regression. Furthermore, the model has high values of R2. This indicates that the models fit the results data well and are useful for predictions and optimization of parameters. According to the relative density model, the optimum combination of SLM process parameters is Po = 651 W, vo = 500 mm/s, and ho = 0.378 mm.
Figure 5a–f show the 3d response surfaces and the 2D contours reflecting the change of relative density with power and scan speed at some specified hatching distance. According to the contour in Figure 5d–f, if the hatching distance being given out of the experimental range of 0.3 mm < h < 0.4 mm, the optimum combinations of parameters corresponding to the highest predicted value of relative density would be in the different ranges of parameters.
The relative density is higher for AlSi10Mg both at the combination of a higher scan speed, a higher laser power, and a lower hatching distance and at the combination of a lower scan speed, a moderate power, and an optional hatching distance in the range of experimental parameters. This is because the relative density does not obviously change with the hatching distance at a lower scan speed and a moderate power in the range of the parameters of this investigation. The model would have two combinations of optimum parameters if a greater range of experimental hatching distance was provided. The two combinations of parameters are both near to the energy density, which corresponds to the highest relative density in Figure 2. In Figure 3, the micro-pores can be observed in the samples built with large hatching distance and high scan speed—this phenomenon was also observed in other alloys [10,22].
The difference in the density of SLMed samples between using the better parameter combinations and the best one could just be the mathematical results, which need to be confirmed by further experiments.
However, when hatching distance is low, the optimal combinations of laser power and scan speed are in a bigger selectable range, in a wide operating window of suitable process parameters (scan speed and laser power).This is helpful to select the parameters according to the actual requirements.
When hatching distance is low, the high relative density parts are easily to obtain. This can also be found in other studies [9,19,20,22]. The SLMed AlSi10Mg alloy samples with the combination of higher laser power, higher scan speed, and lower hatching distance also have higher ultimate tensile strength (UTS) and yield strength [18].
Therefore, the hatching distance is a crucial parameter in the set of SLM parameters, as the range of a specific higher relative density reduces dramatically with the increase of hatching distance.

4. Conclusions

(1) The suggested procedure of the Archimedes method is that the Archimedes method with and without considering the effect of open cavities is used for the sample with a relative density of less than 99% and more than 99%, respectively, which was measured using the Archimedes method without considering the effect of open cavities.
(2) The Doehlert design was applied to optimize the SLM process parameters of AlSi10Mg in the laser power range of 1000W. In the range of experimental parameters, the optimum combination of SLM processing parameters is Po = 651 W, vo = 500 mm/s, and ho = 0.378 mm.
(3) The regression model would have two combinations of optimum parameters if a greater range of experimental hatching distance was provided. The relative density is higher both at the combination of the higher scan speed, higher power, and lower hatching distance and at the combination of a lower scan speed, a moderate laser power, and an optional hatching distance in the range of experimental parameters—the optimal combinations of power and scan speed is in a bigger selectable range.
(4) The hatching distance is the crucial parameter. When hatching distance is low, the combination of power and scan speed is in a wide operating window and the mechanical property of the sample is higher.

Author Contributions

Conceptualization, X.W. and N.P.; methodology, N.P.; investigation, S.B.; writing—original draft preparation, S.B.; writing—review and editing, Y.S.; supervision, X.W.

Funding

This research was funded by Natural Science Foundation of Heilongjiang Province of China, grant number LC2018025; the class General Financial Grant from the China Postdoctoral Science Foundation, grant number 2017M611342; and Special Fund Project for Scientific and Technological Innovation Talents of Harbin, China, grant number 2017RAQXJ073.

Acknowledgments

The authors would like to acknowledge the China Scholarship Council.

Conflicts of Interest

The authors declare no conflict of interest.

References

  1. Muktinutalapati, N.R. Materials for Gas Turbines—An over view. In Advance in Gas Turbine Technology; Benini, E., Ed.; IntechOpen: London, UK, 2011; pp. 293–314. [Google Scholar]
  2. Kelbassa, I.; Albus, P.; Dietrich, J.; Wilkes, J. Manufacture and repair of Aeroengine components using laser technology. In Proceedings of the 3rd Pacific International Conference on Application of Laser and Optics, Beijing, China, 16–18 April 2008; pp. 208–212. [Google Scholar]
  3. Read, N.; Wang, W.; Essa, K.; Attallah, M.M. Selective laser melting of AlSi10Mg alloy: Process optimization and mechanical properties development. Mater. Des. 2015, 65, 417–424. [Google Scholar] [CrossRef]
  4. Li, B.; Wang, H.W.; Jie, J.C.; Wei, Z.J. Effects of yttrium and heat treatment on the microstructure and tensile properties of Al-7.5Si-0.5Mg alloy. Mater. Des. 2011, 32, 1617–1622. [Google Scholar] [CrossRef]
  5. Kempen, K.; Thijs, L.; van Humbeeck, J.; Kruth, J.-P. Processing AlSi10Mg by selective laser melting: Parameter optimisation and material characterization. Mater. Sci. Technol. 2015, 31, 917–923. [Google Scholar] [CrossRef]
  6. Weingarten, C.; Buchbinder, D.; Pirch, N. Formation and reduction of hydrogen porosity during selective laser melting of AlSi10Mg. J. Mater. Process. Technol. 2015, 221, 112–120. [Google Scholar] [CrossRef]
  7. Atwood, R.C.; Sridhar, S.; Zhang, W.; Lee, P.D. Diffusion-controlled growth of hydrogen pores in aluminium-silicon castings: On situ observation and modelling. Acta Mater. 2000, 48, 405–417. [Google Scholar] [CrossRef]
  8. Buchbinder, D.; Schleifenbaum, H.; Heidrich, S.; Meiners, W.; Büttmann, J. High power selective laser melting (HPSLM) of aluminium parts. Phys. Procedia 2011, 12, 271–278. [Google Scholar] [CrossRef]
  9. Thijs, L.; Kempen, K.; Kruth, J.-P.; Van Humbeeck, J. Fine-structured aluminium products with controllable texture by selective laser melting of pre-alloyed AlSi10Mg powder. Acta Mater. 2013, 61, 1809–1819. [Google Scholar] [CrossRef] [Green Version]
  10. Yang, K.V.; Rometsch, P.; Jarvis, T.; Rao, J.; Cao, S.; Davies, C.; Wu, X. Porosity formation mechanisms and fatigue response in Al-Si-Mg alloys made by selective laser melting. Mater. Sci. Eng. A 2018, 712, 166–174. [Google Scholar] [CrossRef]
  11. Olakanmi, E.O.T.; Cochrane, R.F.; Dalgarno, K.W. A review on selective laser sintering/melting (SLS/SLM) of aluminium alloy powders: Processing, microstructure, andproperties. Prog. Mater. Sci. 2015, 74, 401–477. [Google Scholar] [CrossRef]
  12. Tang, M.; Pistorius, P.C. Oxides, porosity and fatigue performance of AlSi10Mg parts produced by selective laser melting. Int. J. Fatigue 2017, 94, 192–201. [Google Scholar] [CrossRef]
  13. Spierings, A.B.; Schneider, M. Comparison of density measurement techniques for additive manufactured metallicparts. Rapid Prototyp. J. 2011, 17, 380–386. [Google Scholar] [CrossRef]
  14. Prashanth, K.G.; Shahabi, S.H.; Attar, H.; Srivastava, V.C.; Ellendt, N.; Uhlenwinkel, V.; Eckert, J.; Scudino, S. Production of high strength Al85Gd8Ni5Co2 alloy by selective laser melting. Addit. Manuf. 2015, 6, 1–5. [Google Scholar] [CrossRef]
  15. Schwab, H.; Prashanth, K.G.; Löber, L.; Kühn, U.; Eckert, J. Selective laser melting of Ti-45Nb alloy. Metals 2015, 5, 686–694. [Google Scholar] [CrossRef]
  16. Carter, L.N.; Wang, X.; Read, N.; Khan, R.; Aristizabal, M.; Essa, K.; Attallah, M.M. Process optimization of selective laser melting using energy density model for nickel based super alloys. Mater. Sci. Technol. 2016, 32, 657–661. [Google Scholar]
  17. Maamoun, A.H.; Xue, Y.F.; Elbestawi, M.A.; Veldhuis, S.C. Effect of Selective Laser Melting Process Parameters on the Quality of Al Alloy Parts: Powder Characterization, Density, Surface Roughness, and Dimensional Accuracy. Materials 2018, 11, 2343. [Google Scholar] [CrossRef] [PubMed]
  18. Maamoun, A.H.; Xue, Y.F.; Elbestawi, M.A.; Veldhuis, S.C. The Effect of Selective Laser Melting Process Parameters on the Microstructure and Mechanical Properties of Al6061 and AlSi10Mg Alloys. Materials 2019, 12, 12. [Google Scholar] [CrossRef] [PubMed]
  19. Suryawanshi, J.; Prashanth, K.G.; Scudino, S.; Eckert, J.; Prakash, O.; Ramamurty, U. Simultaneous enhancements of strength and toughness in an Al-12Si alloy synthesized using selective laser melting. Acta Mater. 2016, 115, 285–294. [Google Scholar] [CrossRef]
  20. Prashanth, K.G.; Scudino, S.; Maity, T.; Dasd, J.; Eckert, J. Is the energy density are liable parameter for materials synthesis by selective laser melting. Mater. Res. Lett. 2017, 5, 386–390. [Google Scholar] [CrossRef]
  21. Fotovvati, B.; Wayne, S.F.; Lewis, G.; Asadi, E. A Review on Melt-Pool Characteristicsin Laser Welding of Metals. Adv. Mater. Sci. Eng. 2018, 2018, 4920718. [Google Scholar]
  22. Perevoshchikova, N.; Rigaud, J.; Sha, Y.; Heilmaier, M. Optimisation of selective laser melting parameters for the Ni-based super alloy IN-738LC using Doehlert’s design. Rapid Prototyp. J. 2017, 23, 881–892. [Google Scholar] [CrossRef]
  23. Standard Test Method for Density of Powder Metallurgy (PM) Materials Containing Less Than Two Percent Porosity; Standard B311-13; ASTM: New York, NY, USA, 2014.
  24. Standard Test Method for Density of Compacted or Sintered Powder Metallurgy (PM) Products Using Archimedes’ Principle; Standard B962-13; ASTM: New York, NY, USA, 2014.
  25. Casalino, G.; Campanelli, S.L.; Contuzzi, N.; Ludovico, A.D. Experimental investigation and statistical optimisation of the selective laser melting process of a maraging steel. Opt. Laser Technol. 2015, 65, 151–158. [Google Scholar] [CrossRef]
  26. Quignon, F.; Huyard, A.; Schwartzbrod, L.; Thomas, F. Use of Doehlert matrices for study of poliovirus-1adsorption. J. Virol. Methods 1997, 68, 33–44. [Google Scholar] [CrossRef]
  27. Taragano, V.M.; Pilosof, A.M.M. Application of Doehlert designs for water activity, pH and fermentation time optimization for Aspergillus niger pectinolytic activities production in solid-state and submerged fermentation. Enzym. Microb. Technol. 1999, 25, 411–419. [Google Scholar] [CrossRef]
  28. Doehlert, D.H. Uniform shell designs. Appl. Stat. 1970, 19, 231–239. [Google Scholar] [CrossRef]
  29. Ferreira, S.L.C.; dos Santos, W.N.L.; Quintella, C.M.; Neto, B.B.; Bosque-Sendra, J.M. Doehlert matrix: A chemometric tool for analytical chemistry—Review. Talanta 2004, 63, 1061–1067. [Google Scholar] [CrossRef] [PubMed]
  30. Laakso, P.; Riipinen, T.; Laukkanen, A.; Andersson, T.; Jokinen, A.; Revuelta, A.; Ruusuvuori, K. Optimization and Simulation of SLM Process for High Density H13 Tool Steel Parts. Phys. Procedia 2016, 83, 26–35. [Google Scholar] [CrossRef] [Green Version]
  31. Schneider, C.A.; Raband, W.S.; Eliceiri, K.W. NIH Image to ImageJ: 25 years of image analysis. Nat. Methods 2012, 9, 671–675. [Google Scholar] [CrossRef] [Green Version]
  32. Levy, G.; Herres, N.; Spierings, A.B.; Bourell, D. Influence of the particle size distribution on surface quality and mechanical properties in am steel parts. Rapid Prototyp. J. 2010, 17, 195–202. [Google Scholar]
Figure 1. Test methods and equipment. (a) The Archimedes method equipment; (b) the cutting direction and the observed cross section in the samples for image analysis.
Applsci 09 00583 g001
Figure 2. Comparison of results of relative density using different methods: (a) comparison of method 2-1and method 2-2; (b) comparison of method 3-1, method 3-2; (c) comparison of method 2-2, method 3-2 and method 4; and (d) comparison of method 1, method 4, and image analysis.
Applsci 09 00583 g002
Figure 3. Merged micrographs of the cross-section of AlSi10Mg selective laser melted (SLMed) samples.
Applsci 09 00583 g003aApplsci 09 00583 g003b
Figure 4. The procedure of method 4*using Archimedes’ Principle.
Applsci 09 00583 g004
Figure 5. The relationship of relative density with power and scan speed for the regression model using the suggested Archimedes method for measurement of relative density. (a) and (b) Response surfaces; (c) contour: h = 0.275 mm; (d) contour: h = 0.29 mm; (e) contour: h = 0.3 mm; (f) contour: h = 0.35 mm; and (g) contour: h = 0.4 mm.
Applsci 09 00583 g005
Table 1. Chemical composition of AlSi10Mg alloy by inductively coupled plasma atomic emission spectrometry (ICP-AES) [10].
SiMgCuFeZnAl
wt.%wt.%wt.%wt.%wt.%wt.%
10.60.450.020.19<0.01Bal.
Table 2. Parameters for selective laser melting (SLM) based on Doehlert design.
SampleP (W)v (mm/s)h (mm)Energy Density (J/mm2)
162514000.351.28
295014000.351.94
378823000.350.98
446323000.350.58
530014000.350.61
64635000.352.65
77885000.354.50
878817000.41.16
946317000.40.68
106258000.41.95
1178810990.32.39
1246310990.31.40
1362520000.31.04
143008000.31.25
Table 3. Different procedures based on the Archimedes method.
MethodLiquid for Liquid-ImpregnationLiquid for Providing BuoyancyUsing Vacuum Pump (Yes/No)Impregnation Time (min)Surface
1N/AEthanolNo30SLMed
2-1EthanolEthanolNo30SLMed
2-2EthanolEthanolNo30Ground
3-1TetrachloroethyleneTetrachloroethyleneYes5Ground
3-2TetrachloroethyleneTetrachloroethyleneYes30Ground
4Pure Silicone FluidEthanolYes30Ground
Table 4. Physical properties of liquid used in measurement.
LiquidDensity (g/cm3)Viscosity (10−6m2/s)Surface Tension (10−3N/m)
96% Ethanol0.80750.74022.39
Tetrachloroethylene(C2Cl4)1.6220.54931.74
Pure Silicone Fluid0.975020.8
Table 5. Relative density results.
SampleP
(W)
v
(mm/s)
h
(mm)
Energy Density
(J/mm2)
ρrelative (%)
Archimedes MethodsImage Analysis
144*
162514000.351.2895.6793.8293.8290.9
295014000.351.9499.1597.7299.1598.68
378823000.350.9894.3386.9686.9680.21
446323000.350.5893.271.9871.9852.06
530014000.350.6193.9472.1372.1360.51
64635000.352.6599.5797.5899.5798.6
77885000.354.5096.2994.4894.4893.86
878817000.41.1694.6790.6790.6785.02
946317000.40.6894.2575.2775.2771.78
106258000.41.9599.1697.4199.1698.93
1178810990.32.3999.7798.6299.7799.51
1246310990.31.4095.7892.9292.9294.72
1362520000.31.0494.8388.388.385.58
143008000.31.2594.6888.3788.3787.24
Table 6. The constants of the model, model testing, and the optimized SLM process parameters.
Regression ConstantsCoefficient aResults
a060.1737
a10.0518
a20.0032
a3123.5745
a11−7.42 × 10⁻⁵
a22−4.11 × 10⁻⁶
a33−180.9538
a123.47 × 10−5
a130.0726
a23−0.0688
f testF8.9160
Correlation CoefficientR20.95
Optimum CombinationPo (W)651
vo (mm/s)500
ho (mm)0.378
Calculated Results Using the Optimum Combinationρrelative,max (%)100.01
Energy density (J/mm2)3.44

