Article

Experimental Studies of Ethyl Acetate Saponification Using Different Reactor Systems: The Effect of Volume Flow Rate on Reactor Performance and Pressure Drop

by
Ekaterina Borovinskaya
1,2,*,
Valentin Khaydarov
1,
Nicole Strehle
1,
Alexander Musaev
2 and
Wladimir Reschetilowski
1,2
1
Technische Universität Dresden, 01062 Dresden, Germany
2
Saint-Petersburg State Institute of Technology (Technical University), 190013 St. Petersburg, Russia
*
Author to whom correspondence should be addressed.
Appl. Sci. 2019, 9(3), 532; https://doi.org/10.3390/app9030532
Submission received: 18 December 2018 / Revised: 25 January 2019 / Accepted: 29 January 2019 / Published: 4 February 2019
(This article belongs to the Section Chemical and Molecular Sciences)

Abstract

:
Microreactors intensify chemical processes due to improved flow regimes, mass and heat transfer. In the present study, the effect of the volume flow rate on reactor performance in different reactors (the T-shaped reactor, the interdigital microreactor and the chicane microreactor) was investigated. For this purpose, the saponification reaction in these reactor systems was considered. Experimental results were verified using the obtained kinetic model. The reactor system with a T-shaped reactor shows good performance only at high flow rates, while the experimental setups with the interdigital and the chicane microreactors yield good performance throughout the whole range of volume flow rates. However, microreactors exhibit a higher pressure drop, indicating higher mechanical flow energy consumption than seen using a T-shaped reactor.

Graphical Abstract

1. Introduction

Microfluidic systems constitute a modern instrument to intensify processes, both for a laboratory and on a large scale, due to their special properties [1]. Microreactors provide a drastically shorter mixing time, which can contribute to conducting chemical and biochemical reactions more effectively in comparison with conventional reactors. High surface-to-volume ratios lead to an intensification of mass transport processes, which is especially important for mass transport limited reactions [2,3,4]. As a result, conversion and yield in microreactors are both higher than in conventional reactors [2,3,4,5,6,7,8,9,10,11,12,13]. Due to low thermal inertia and high thermal-transfer efficiencies, it is possible to control optimal temperature precisely. Continuous processes in microreactors lead to a significant shortening of reaction duration [14,15].
The relationship between the reaction rate and the rate of mixing is very important for the reactor performance of a chemical reactor because the reaction rate depends not only on reaction conditions, but also on mixing efficiency [16,17,18,19]. In the case of bimolecular chemical reactions, mixing plays an important role because intimate contact between the components must occur to ensure chemical transformations [20,21]. There is a large number of microreactor systems that use different mixing principles. They can be classified in two main groups [16]: active microreactors and passive microreactors. Active microreactors use an external energy source to build time-dependent perturbations, which enhance the mixing process, i.e., in oscillatory baffled reactors a piston oscillates the flow so that around each reactor baffle eddies are created leading to turbulent mixing of solution [22,23]. Passive microreactors provide a high interfacial area between the species due to their specially designed geometry [24,25,26,27,28].
Passive microreactors can be classified into two subgroups according to the mixing process: molecular diffusion or chaotic advection [17]. Despite these different classifications, both maximize the interfacial area for molecular diffusion as the final step of the mixing process. In general, the time for diffusional transport, the so-called micromixing time, can be described in laminar flow as a quadratic function of the characteristic mixing length L [29]:
τ micro = A L 2 D
where D denotes the diffusion coefficient and A is the shape factor, which depends on the form of the channel cross section. If there are no hydrodynamic instabilities in the flow, the characteristic mixing length is typically equal to half of the microreactor channel diameter, which normally lies in the range from tens of micrometers to several millimeters. However, diffusion is rather a slow process with mixing times of up to several minutes. Special microreactor geometries (interdigital [24,30], split-and-recombine [25,31], focusing [26,32], etc.) were designed to focus, stretch or recombine the flow and, as a result, decrease the characteristic mixing length and improve the mixing process. Microreactors based on chaotic advection intensify the mixing process due to the generation of vortices. Guided flow streaming leads to hydrodynamic instabilities and can significantly improve the transverse mass transfer. Microreactors based on chaotic advection may have different geometries: T- and Y-shaped [33,34,35,36], herringbone [27], chicane or serpentine [37,38,39], with embedded obstructions [40], etc. The most important feature of these microreactors is the effect of volume flow rate on the intensity of the vortex structures which appear, [39,41,42] as well as on reactor performance [2,38,43]. Modern microreactors can provide almost instant mixing in comparison with the reaction time-scale, even in the case of fast reactions [16,38,44]. However, the mixing time, and therefore reactor performance, depends greatly on the volume flow rate. On the other hand, only about 3% of the total shear flow rate contributes to mixing [44]. The rest of the mechanical flow energy is used to deliver the components or mixed species to the reactor outlet, without mixing.
Therefore, it is very important to find the proper reactor design which has the lowest possible pressure drop, as well as the optimal flow rate, to carry out a given chemical reaction at any required reactor performance [14,17].
The present study is focused on a comparative investigation of three reactor systems:
The T-shaped reactor with circular cross sections,
The interdigital microreactor with parallel multilamination,
The chicane microreactor (the Y-micromixer coupled with the chicane mixing channel).
The influence of volume flow rate and temperature on the homogeneous saponification reaction in different reactor systems was investigated. The obtained experimental results were verified using the kinetic model. The measured pressure drop in the reactor systems was used to analyze energy consumption.

2. Materials and Methods

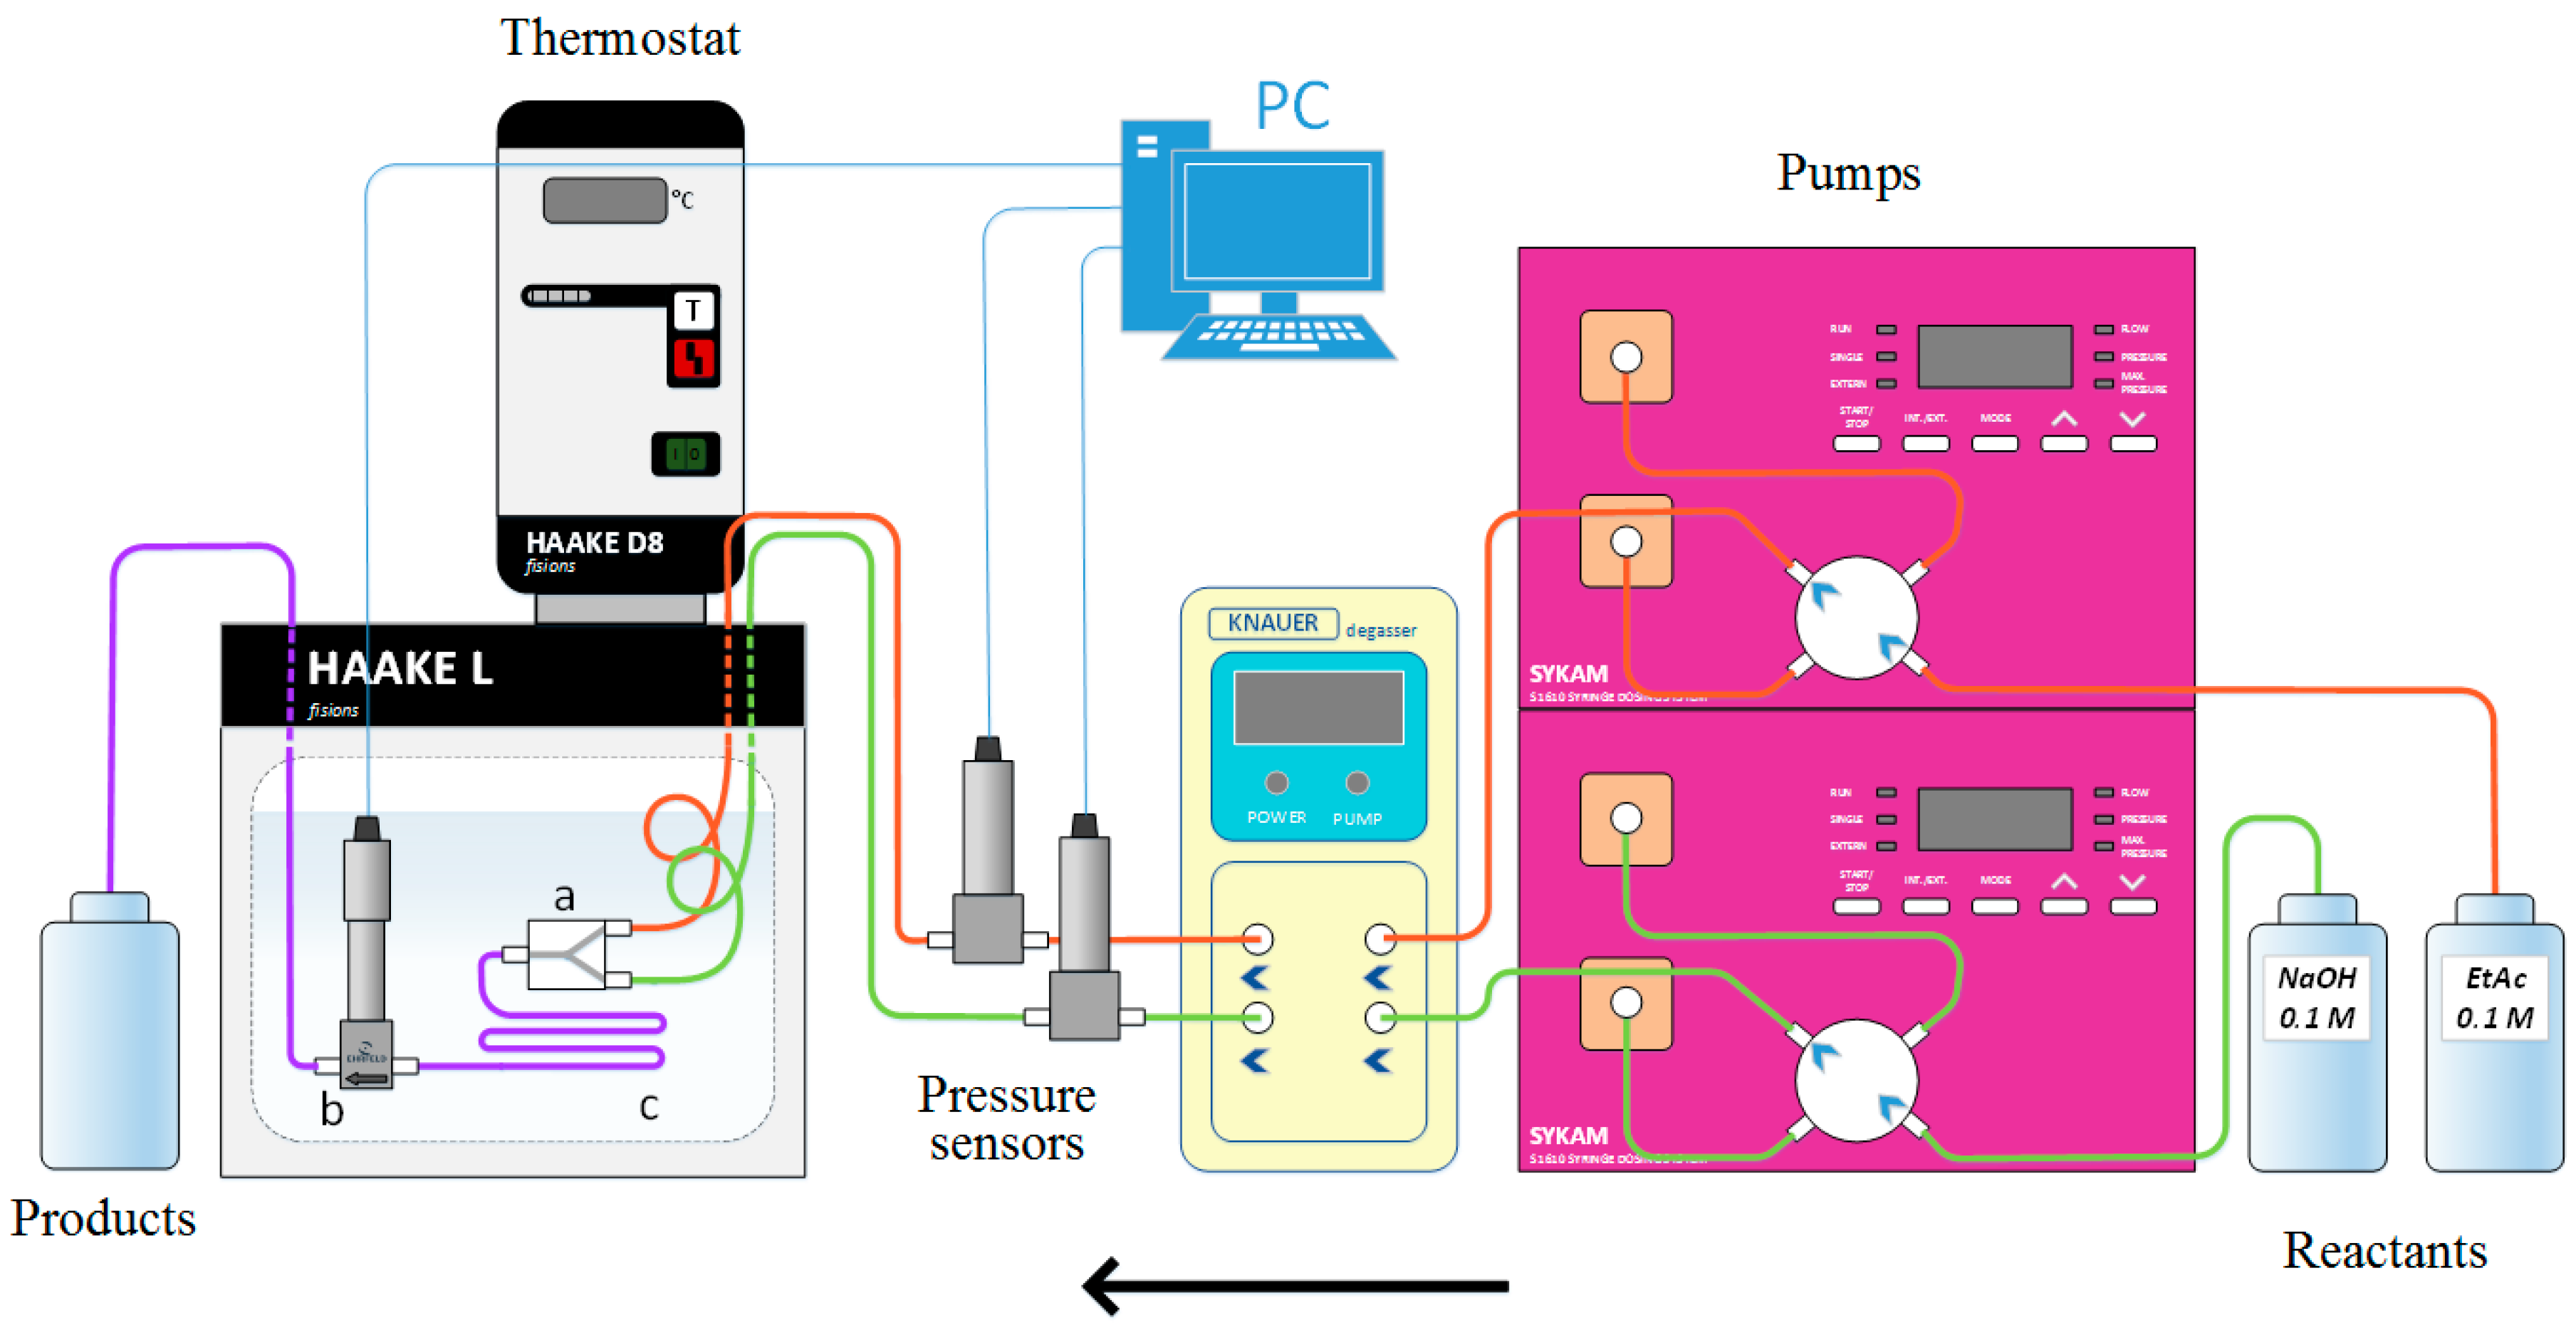
2.1. Setup Composition

The continuous saponification of ethyl acetate was carried out in reactor systems which were assembled by combining three reactors each with a tube reactor. The experimental setup is shown in Figure 1. The reactants passed through the degasser and preheating polytetrafluoroethylene (PTFE) tube into the reactor using two pumps leading from two containers filled with 0.1 M solutions of sodium hydroxide (Sigma-Aldrich Co., LLC., St. Louis, MO, USA) and ethyl acetate (Sigma-Aldrich Co., LLC., St. Louis, MO, USA). All of the reactors were connected to the residence time unit, which was a tube of 1.6-mm internal diameter. For each experimental setup, the length of the residence time unit was selected so that the summary volume of the entire setup remained almost the same, standing at 5.5 mL. The residence time units were stacked in a spiral of approximately 10 cm in diameter. The preheating tubes, the reactors with the residence time unit, and the conductivity cell were all submerged in a water bath of constant temperature. The outlet of the residence time unit was connected to the conductivity cell provided by Ehrfeld Mikrotechnik BTS, consisting of a stainless-steel body with an inlet and an outlet. The built-in conventional two-electrode conductivity cell was tightly fastened using a rubber seal inside the body. The flow moved into the measurement area from the inlet at the bottom of the body. Afterwards, the flow leaved the cell through the space between the body’s inner wall and the conductivity cell’s outer surface. The investigated reactors are listed in Table 1.
The T-shaped reactor has an inner diameter of 2.8 mm and a volume of 0.05 mL and does not belong to the category of microreactors. The interdigital microreactor is based on the parallel lamination mixing principle. Each reactant stream is split up into multiple substreams, which rejoin due to the multilayered structure with a channel dimension of 100 μm. Due to this construction, the interfacial area can be drastically increased and the striation thickness can be reduced. The chicane microreactor consists of a Y-mixer and a long chicane mixing channel. Since the Y-mixer itself intrinsically has quite a low mixing efficiency [38], the chicane channel plays the most important role regarding the mass transport process [38,39,41,43]. The inner dimension of the chicane channel varies along the mixing channel by up to 2 mm. Because of the differing cross-sectional channel shape, the flow periodically stretches, folds and breaks [38,39,42]. These effects significantly intensify the transversal mass transport, and therefore the mixing rate and the reactor performance are also intensified.
Some experiments in the reaction system using a T-shaped reactor were maintained using a micro camera. A micro digital camera (DNT DigiProfi, camera resolution 2592 × 1944, frame rate-30 frames/s, focus range-10 mm) was used for taking photographs. For this, the micro camera was placed directly behind the T-shaped reactor to observe the initial mixing area.
Pressure drop measurements were conducted within the reactor systems at a constant temperature (22 °C) using deionized water at volume flow rates from 0.5 to 20 mL/min.
For a comparative analysis of reactor performance in the different reactor systems, it was important to first define the reaction rates under ideal conditions, i.e., completely mixed reactants. For this purpose, the kinetic study of saponification of ethyl acetate was conducted in a batch reactor at 17 °C, 22 °C and 32 °C with the use of a highly accurate four-electrode conductivity cell (TetraCon 325, WTW GmbH, Weilheim, Germany). The conductivity cell was placed vertically in a closed, tempered jacketed batch reactor which had a volume of 200 mL. The reactor jacket was connected to a thermostat (HAAKE L, Thermo Electron Corp., Waltham, MA, USA). Mixing in the batch reactor was done using a magnetic stirrer at a rotation rate of 1250 rpm. Because of the small volume of batch reactor used, rapid homogeneous mixing and intense convective heat removal throughout the exothermic saponification reaction could be maintained.
The chemicals used in the experiments were of analytical grade and were labelled as follows: granulated sodium hydroxide p.a. (Sigma-Aldrich Co., LLC., St. Louis, MO, USA), ethyl acetate p.a. (Sigma-Aldrich Co., LLC., St. Louis, MO, USA).

2.2. Analytical Procedure
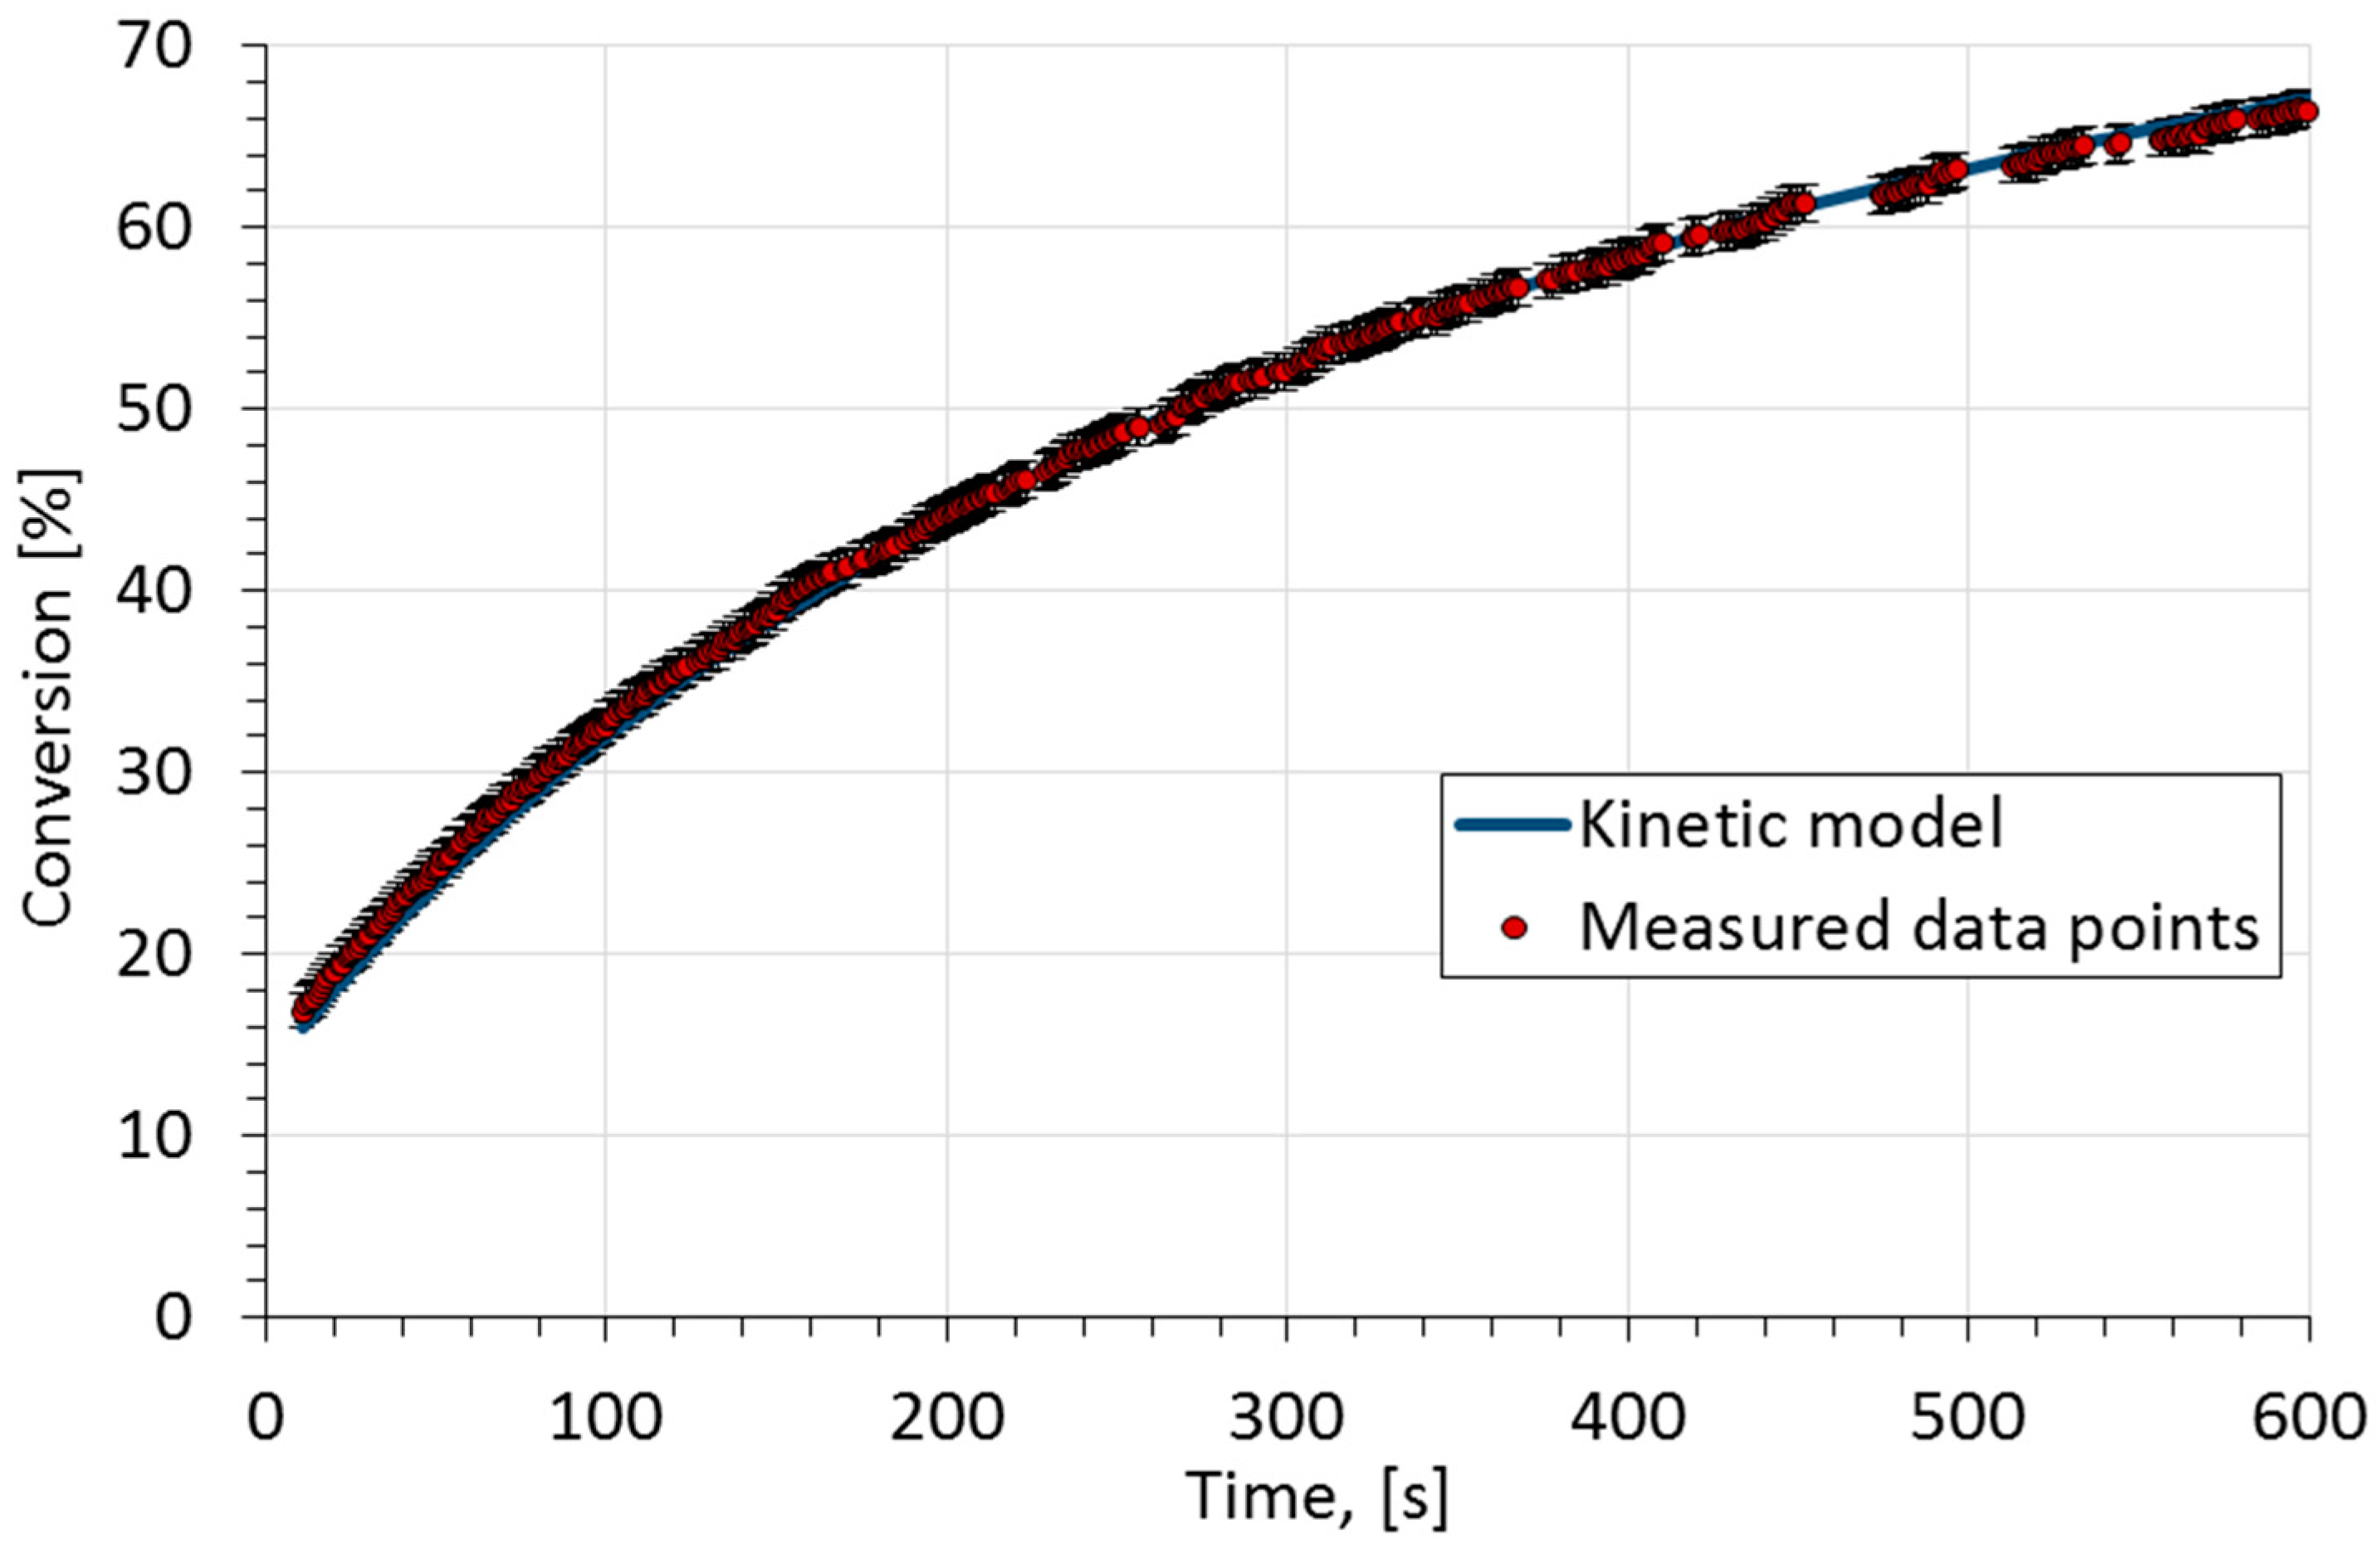
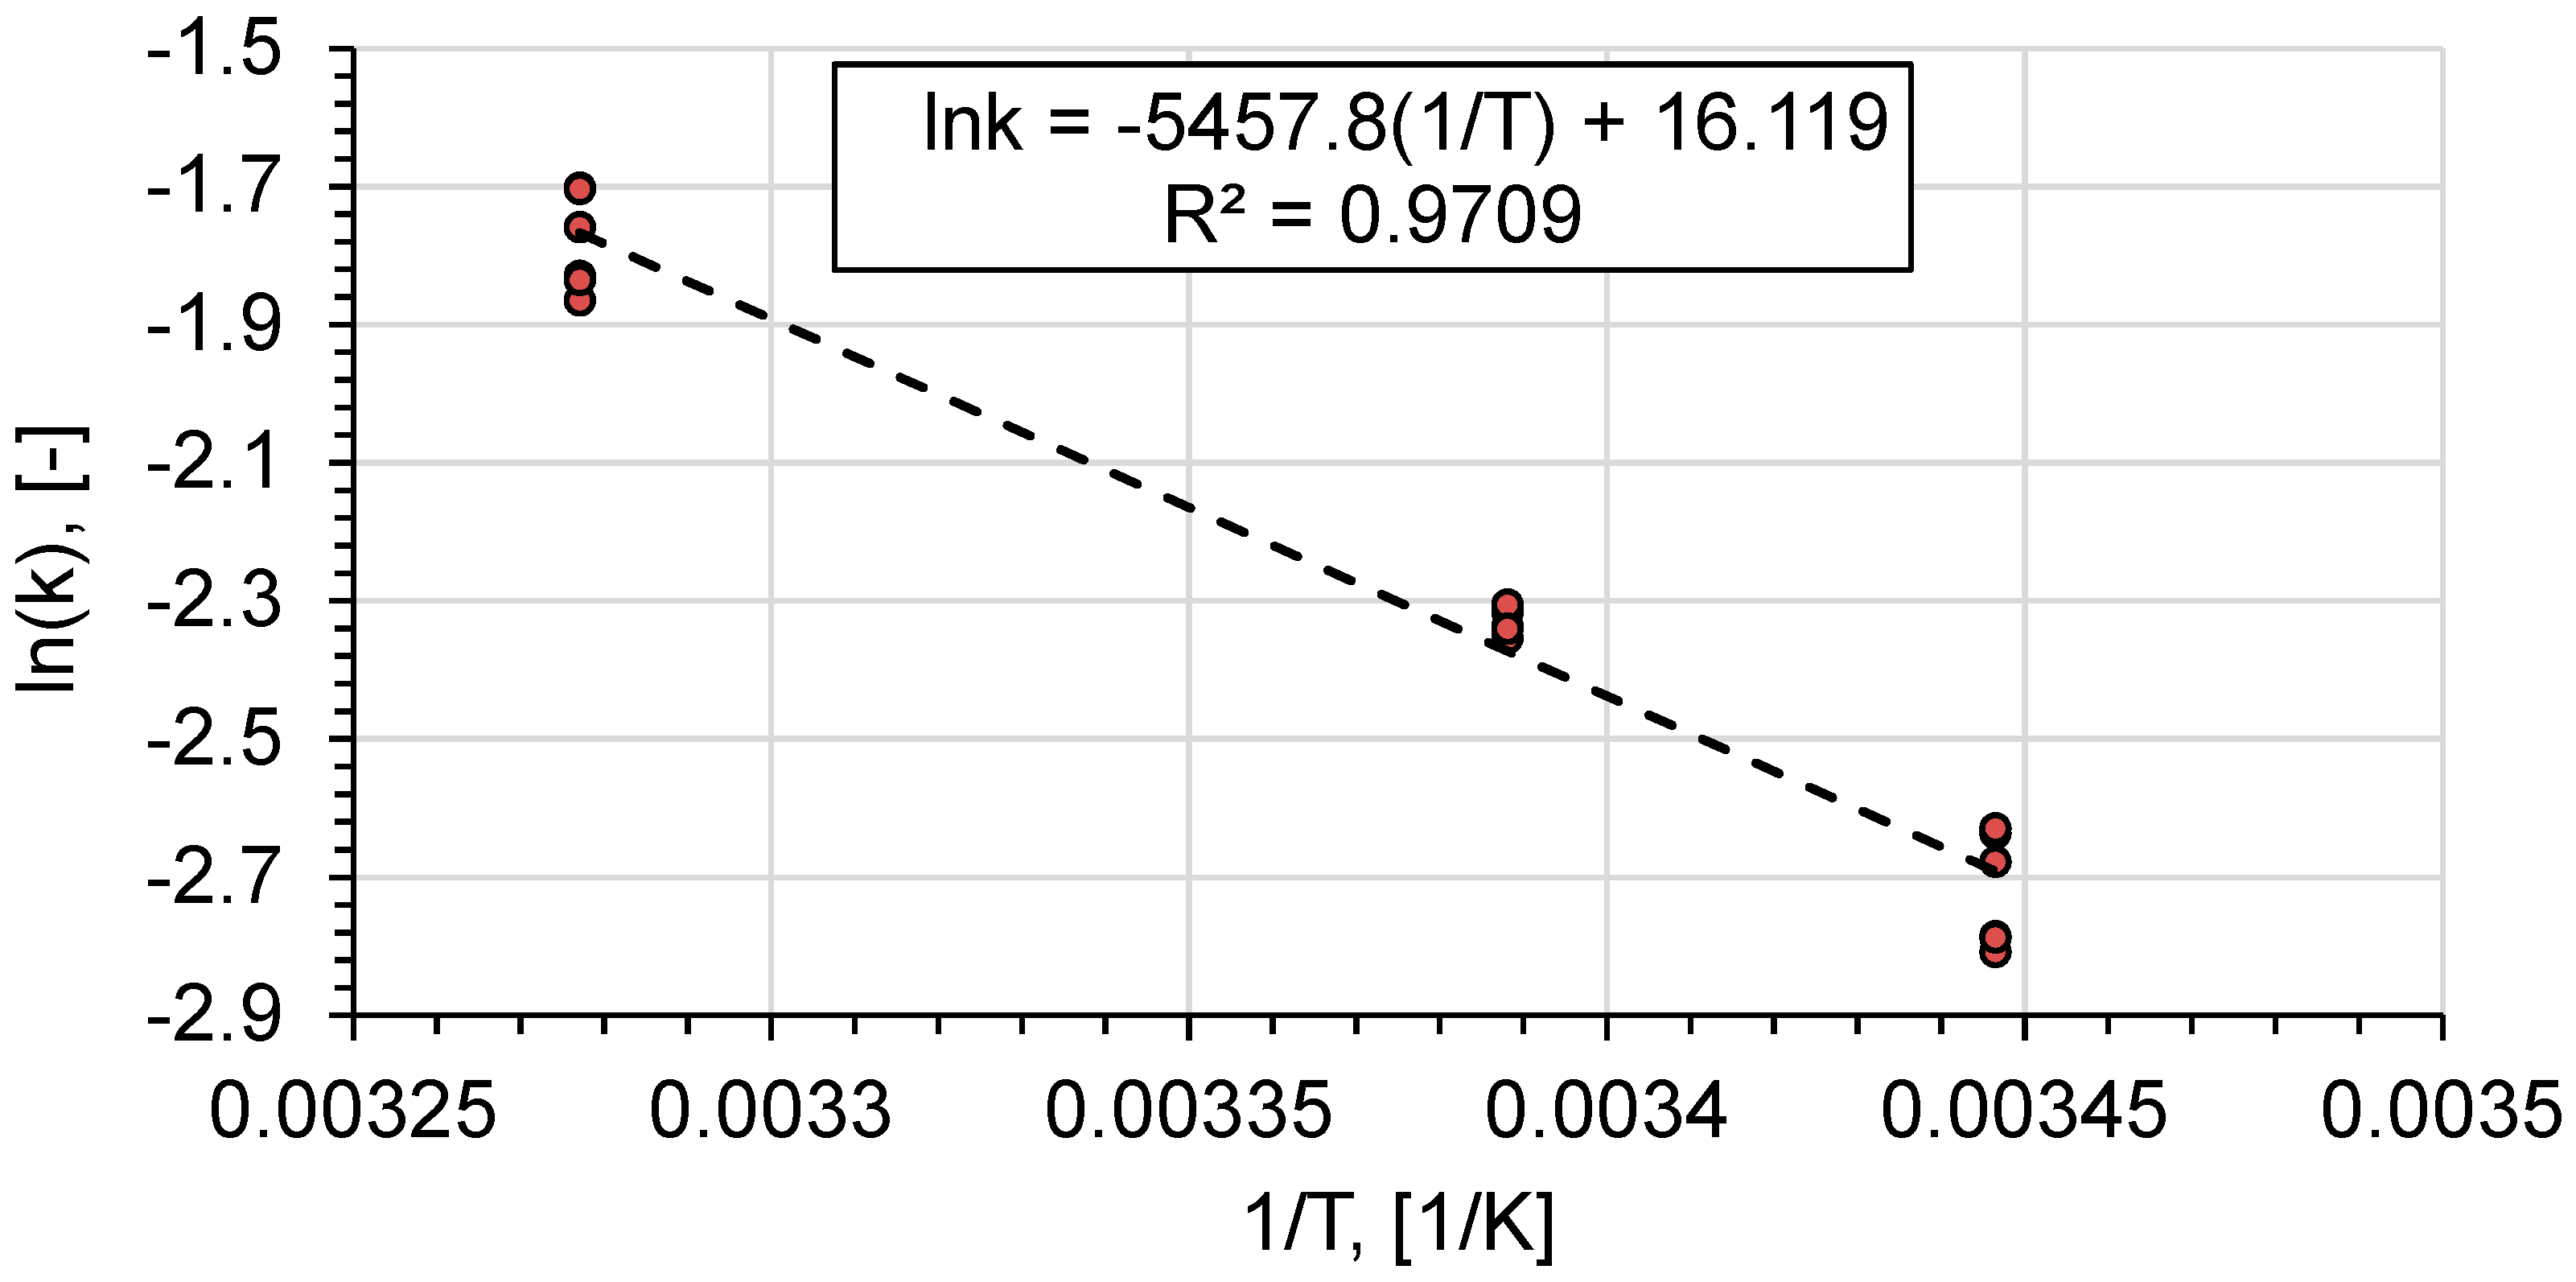
Saponification of ethyl acetate using sodium hydroxide was considered to be a model reaction. This is a well-investigated, second-order homogeneous liquid phase reaction [45,46]:
CH 3 COOC 2 H 5 + NaOH k CH 3 COONa + C 2 H 5 OH
where k denotes the reaction rate constant.
The conversion of sodium hydroxide was calculated:
X NaOH = c NaOH , 0 c NaOH c NaOH , 0 · 100 %
where c NaOH , 0 denotes the initial concentration and c NaOH is the concentration of sodium hydroxide measured at the outlet.
The changing concentration of acetate and hydroxide ions has the most significant influence on the total conductivity. As the reaction progresses, the acetate ions, with a molar conductivity of 40.9 S · cm2/mol, replace the same number of hydroxide ions, which have a much higher molar conductivity of 199.1 S·cm2/mol. As a result, the total conductivity proportionally decreases with the increasing conversion.
The calibration of solutions with 0% and 100% sodium hydroxide conversion was performed at different temperatures (Table 2).
Since the conversion depends linearly on the conductivity, a linear approximation was applied for calculations of the sodium hydroxide conversion as follows:
X NaOH = 100 % · ( 1 G G 100 G 0 G 100 )
where G denotes the measured solution conductivity, G 0 and G 100 are the calibration points at 0% and 100% sodium hydroxide conversion accordingly.

2.3. Kinetic Study

The experimental measurements for the kinetic study were conducted in the batch reactor described before.
Since saponification of ethyl acetate is an equimolar second order reaction, the concentration of sodium hydroxide was calculated as follows:
c NaOH = 1 1 c NaOH , 0 + k · t = c NaOH , 0 1 + k · t · c NaOH , 0
where c NaOH , 0 denotes the initial concentration of sodium hydroxide and t is reaction time. The conversion of sodium hydroxide was calculated:
X NaOH = 1 c NaOH c NaOH , 0 = k · t · c NaOH , 0 1 + k · t · c NaOH , 0
Based on experimental points with corresponding times, as well as taking into account the formulated model, the reaction rate constant was determined due to the minimization of the objective function:
min t ( X NaOH X NaOH , exp ) 2
Here X NaOH denotes the kinetic model of the saponification and X NaOH , exp represents the experimental points. Experimental points and the model curve at 17 °C are shown in Figure 2. The model matches the measured data well.
A separate minimization of objective function (7) was conducted for each measurement and temperature. To ensure the reliability of measurements, each measurement was repeated 6 times. The calculated reaction rate constants and the average values are listed in Table 3.
Using the reaction rate constant at different temperatures, the activation energy and the pre-exponential factor of ethyl acetate saponification were determined (Figure 3).
k 0 = e 16.119 = 10.01 × 10 6 L mol · s
E A = 5457.8 · R = 45.38   kJ mol
The obtained parameter values are consistent with literature data (Table 4).

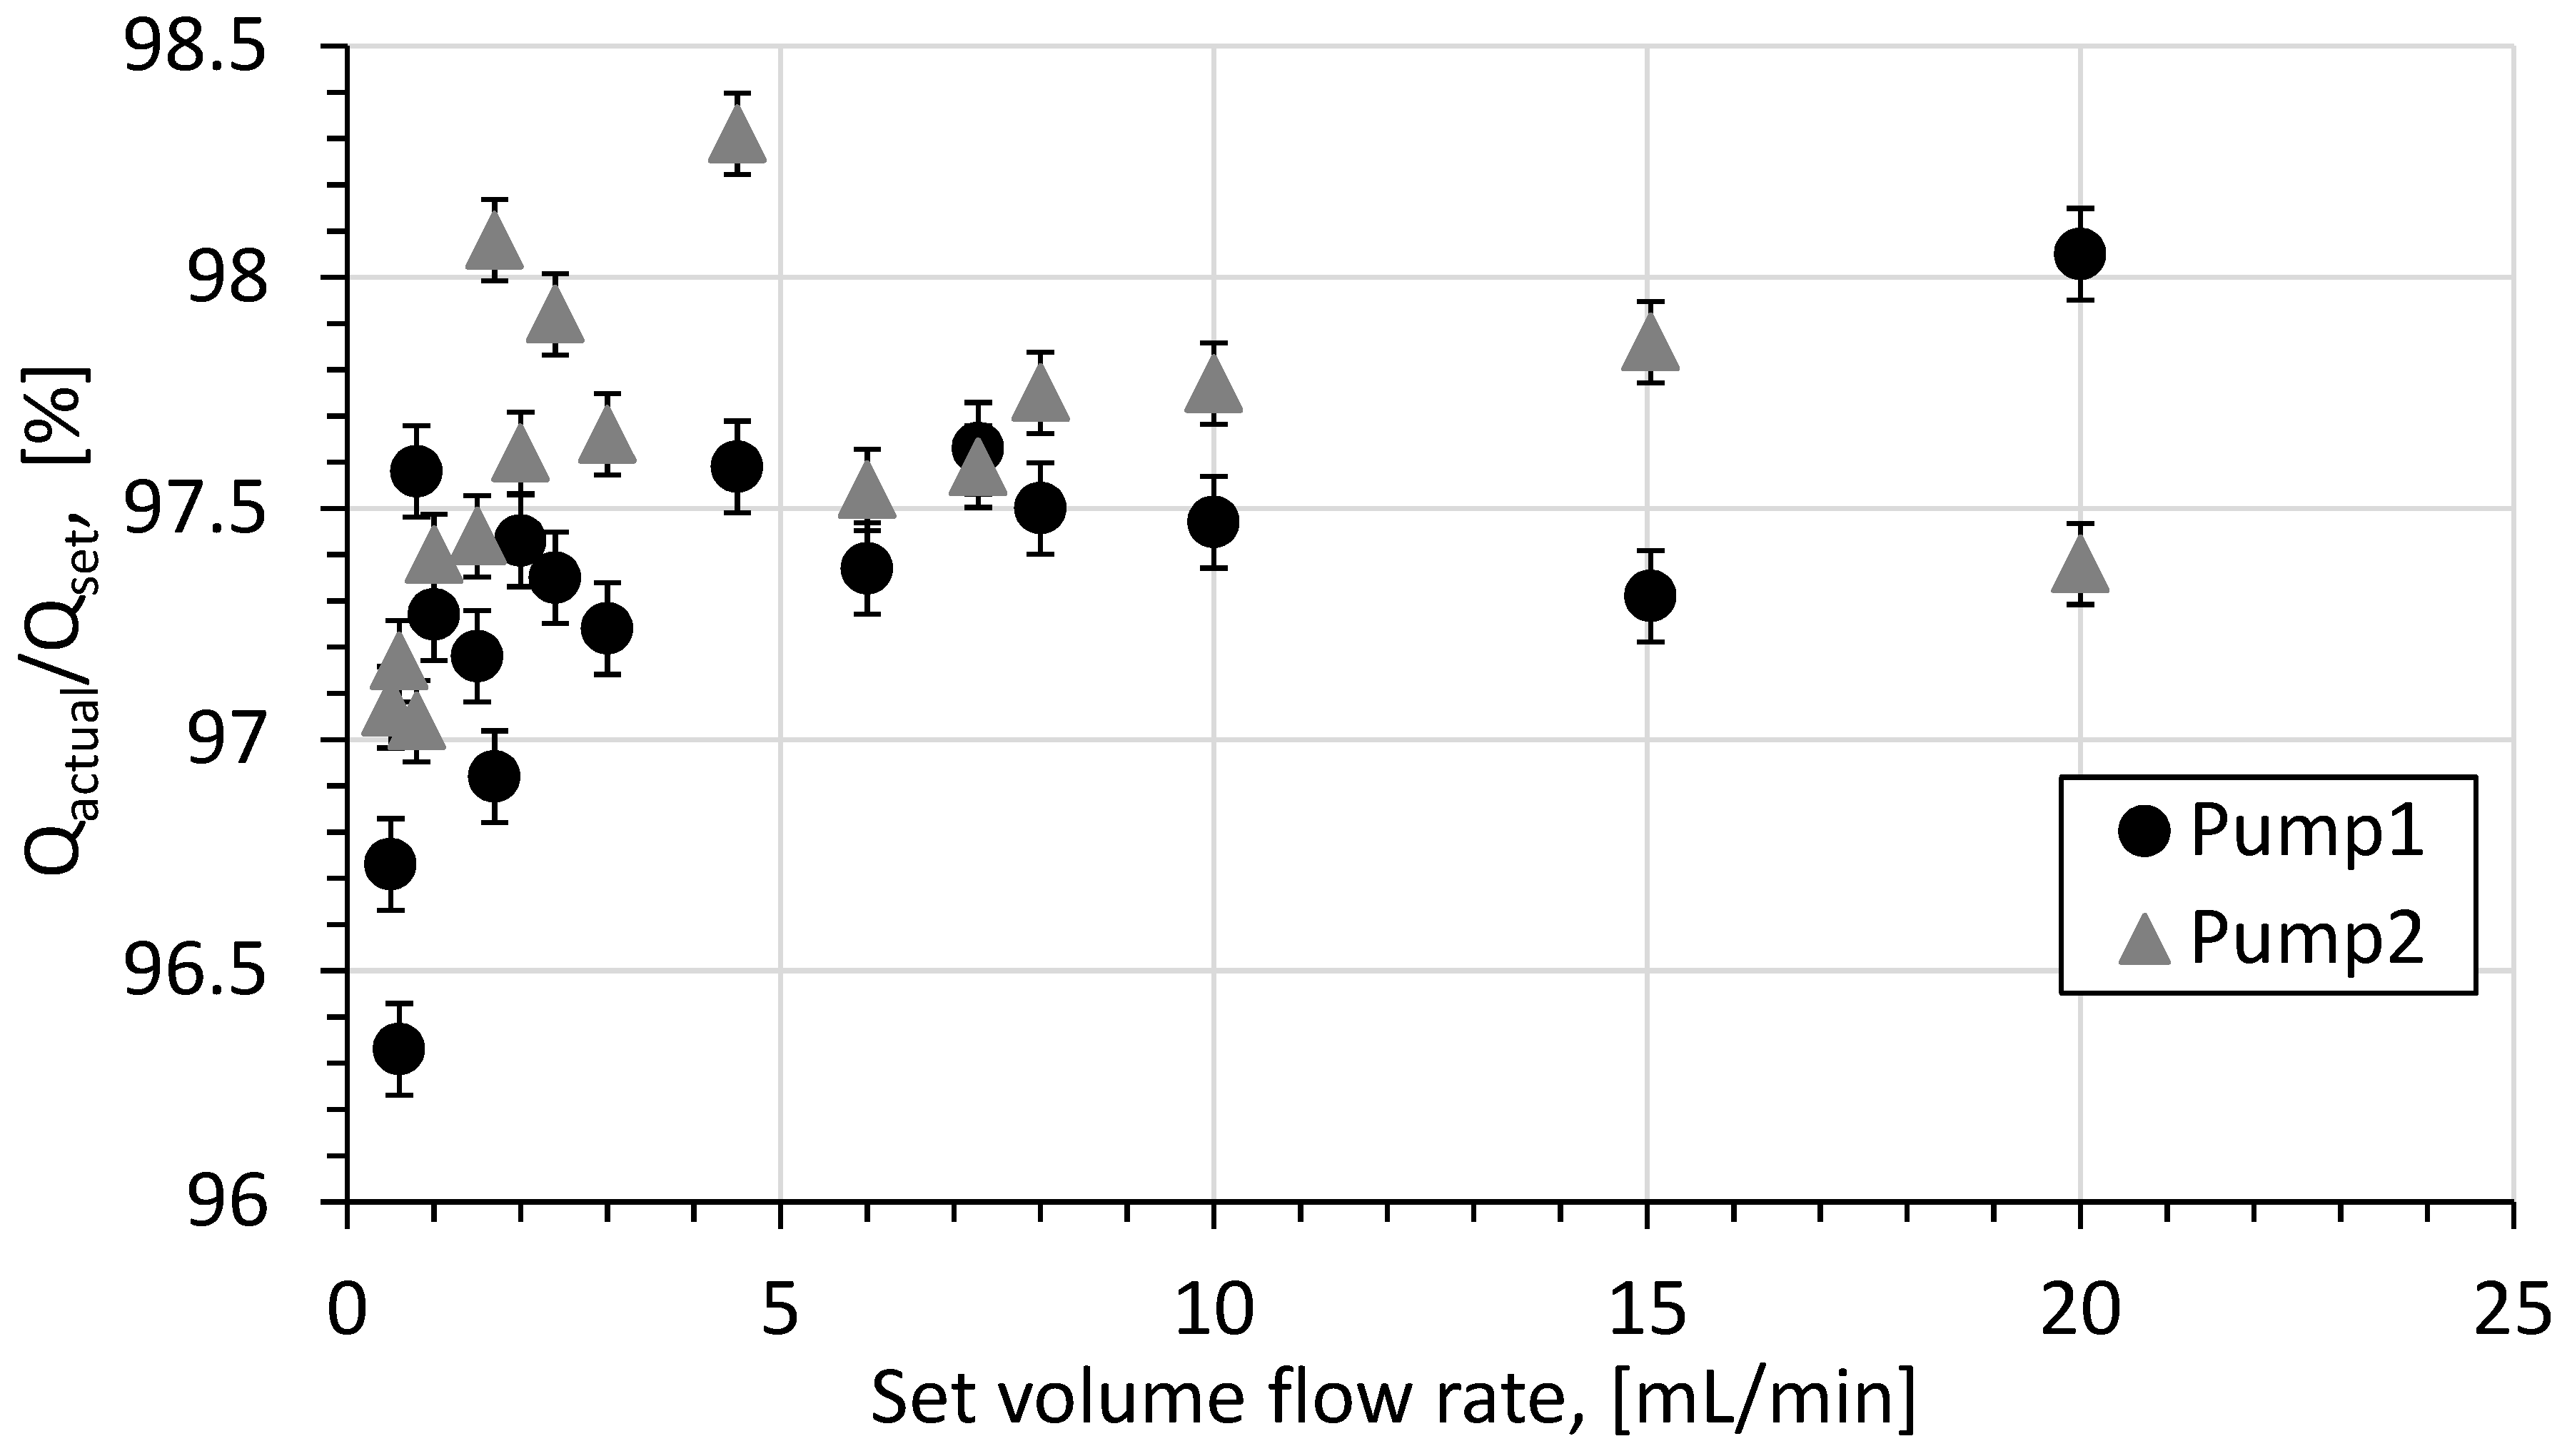
2.4. Choice and Calibration of Pumps

There are several types of pumps which are used in microfluidics, e.g., syringe, peristaltic, piston, plunger pumps, etc. Hydrodynamics plays a crucial role regarding mixing intensity [16]. For example, chaotic flow rate modulation can significantly enhance convective mixing [47]. It can dramatically shorten the mixing time, resulting in greater conversion values. However, at the same time, flow rate fluctuations can add several uncertainties to the measurement results, making them unreliable. In such a case, the mixing rate also depends on the modulation wave form, frequency and amplitude [47]. The pumps, in which the volume flow rate is constant and steady and where no pulsations appear, provide more reliable experimental results. For this purpose three different pumping systems based on distinct pumping principles were tested (Table 5).
The operating characteristics of the investigated pumps differ in the presence of pulsations, their frequency and amplitude (Figure 4).
The REGLO-CPF (Wertheim, Germany) piston pump uses “No-Valve” technology, where a ceramic piston synchronously rotates and reciprocates in a precisely mated ceramic cylinder. Whilst rotating, the piston moves up and down inside the ceramic chamber, filling the piston flat with a media (moving up) and pumping out fluid (moving down). According to the pumping principle, a piston pump, which has a piston rotation frequency of up to several tens of rounds per minute, shows a highly oscillating flow rate characteristic. Figure 5 shows the mixing process of two water solutions in the chicane microreactor at different time points. The solutions were inked with different colors and pumped using two piston pumps at volume flow rates of 1 and 6 mL/min each. The distribution of colored solutions changes over time, indicating an unsteady process. It is evident that the flow pulsations that appear essentially affect the mixing process and provide a more intensive mass transfer in comparison with cases where there are no flow rate pulsations. Moreover, the higher the set-volume flow rate, the more frequently the piston head rotates, biasing the experimental data. On the contrary, the application of an NE-300 pulsation-free syringe pump or an S 1610 two-syringe pumping system ensures that the flow pattern mainly stays steady. Because of the rapid switching valve which is inside the S 1610 pump, there is a periodic short jump of flow rate, as schematically indicated in Figure 4.
Although piston pumps may lead to a more efficient mixing grade, flow pulsations contribute to an uncontrolled effect on the mixing process, which is not easy to reproduce at a particular moment in time to get a comparison of mixing in different reactor systems. If NE-300 syringe pumps are used, the total volume of reactants is limited to a syringe volume of 50 mL each, which is not enough to collect accurate experimental data at high flow rates. Therefore, two S-1610 two-syringe pumping systems were chosen to perform the experiments.
For pump calibration, deionized water was pumped through the reactor system for one minute at flow rates starting at 0.5 to 20 mL/min, and the mass of collected water was measured.
The calibration results for two pumps are shown in Figure 6, where the percentage difference between the actual and set volumetric flow rates is mainly 2.5%. Based on these results, the flow rate Q actual was accepted as follows:
Q actual = 0.975 · Q set
where Q set denotes the nominal volume flow rate which is set up on the pump.

3. Results and Discussion

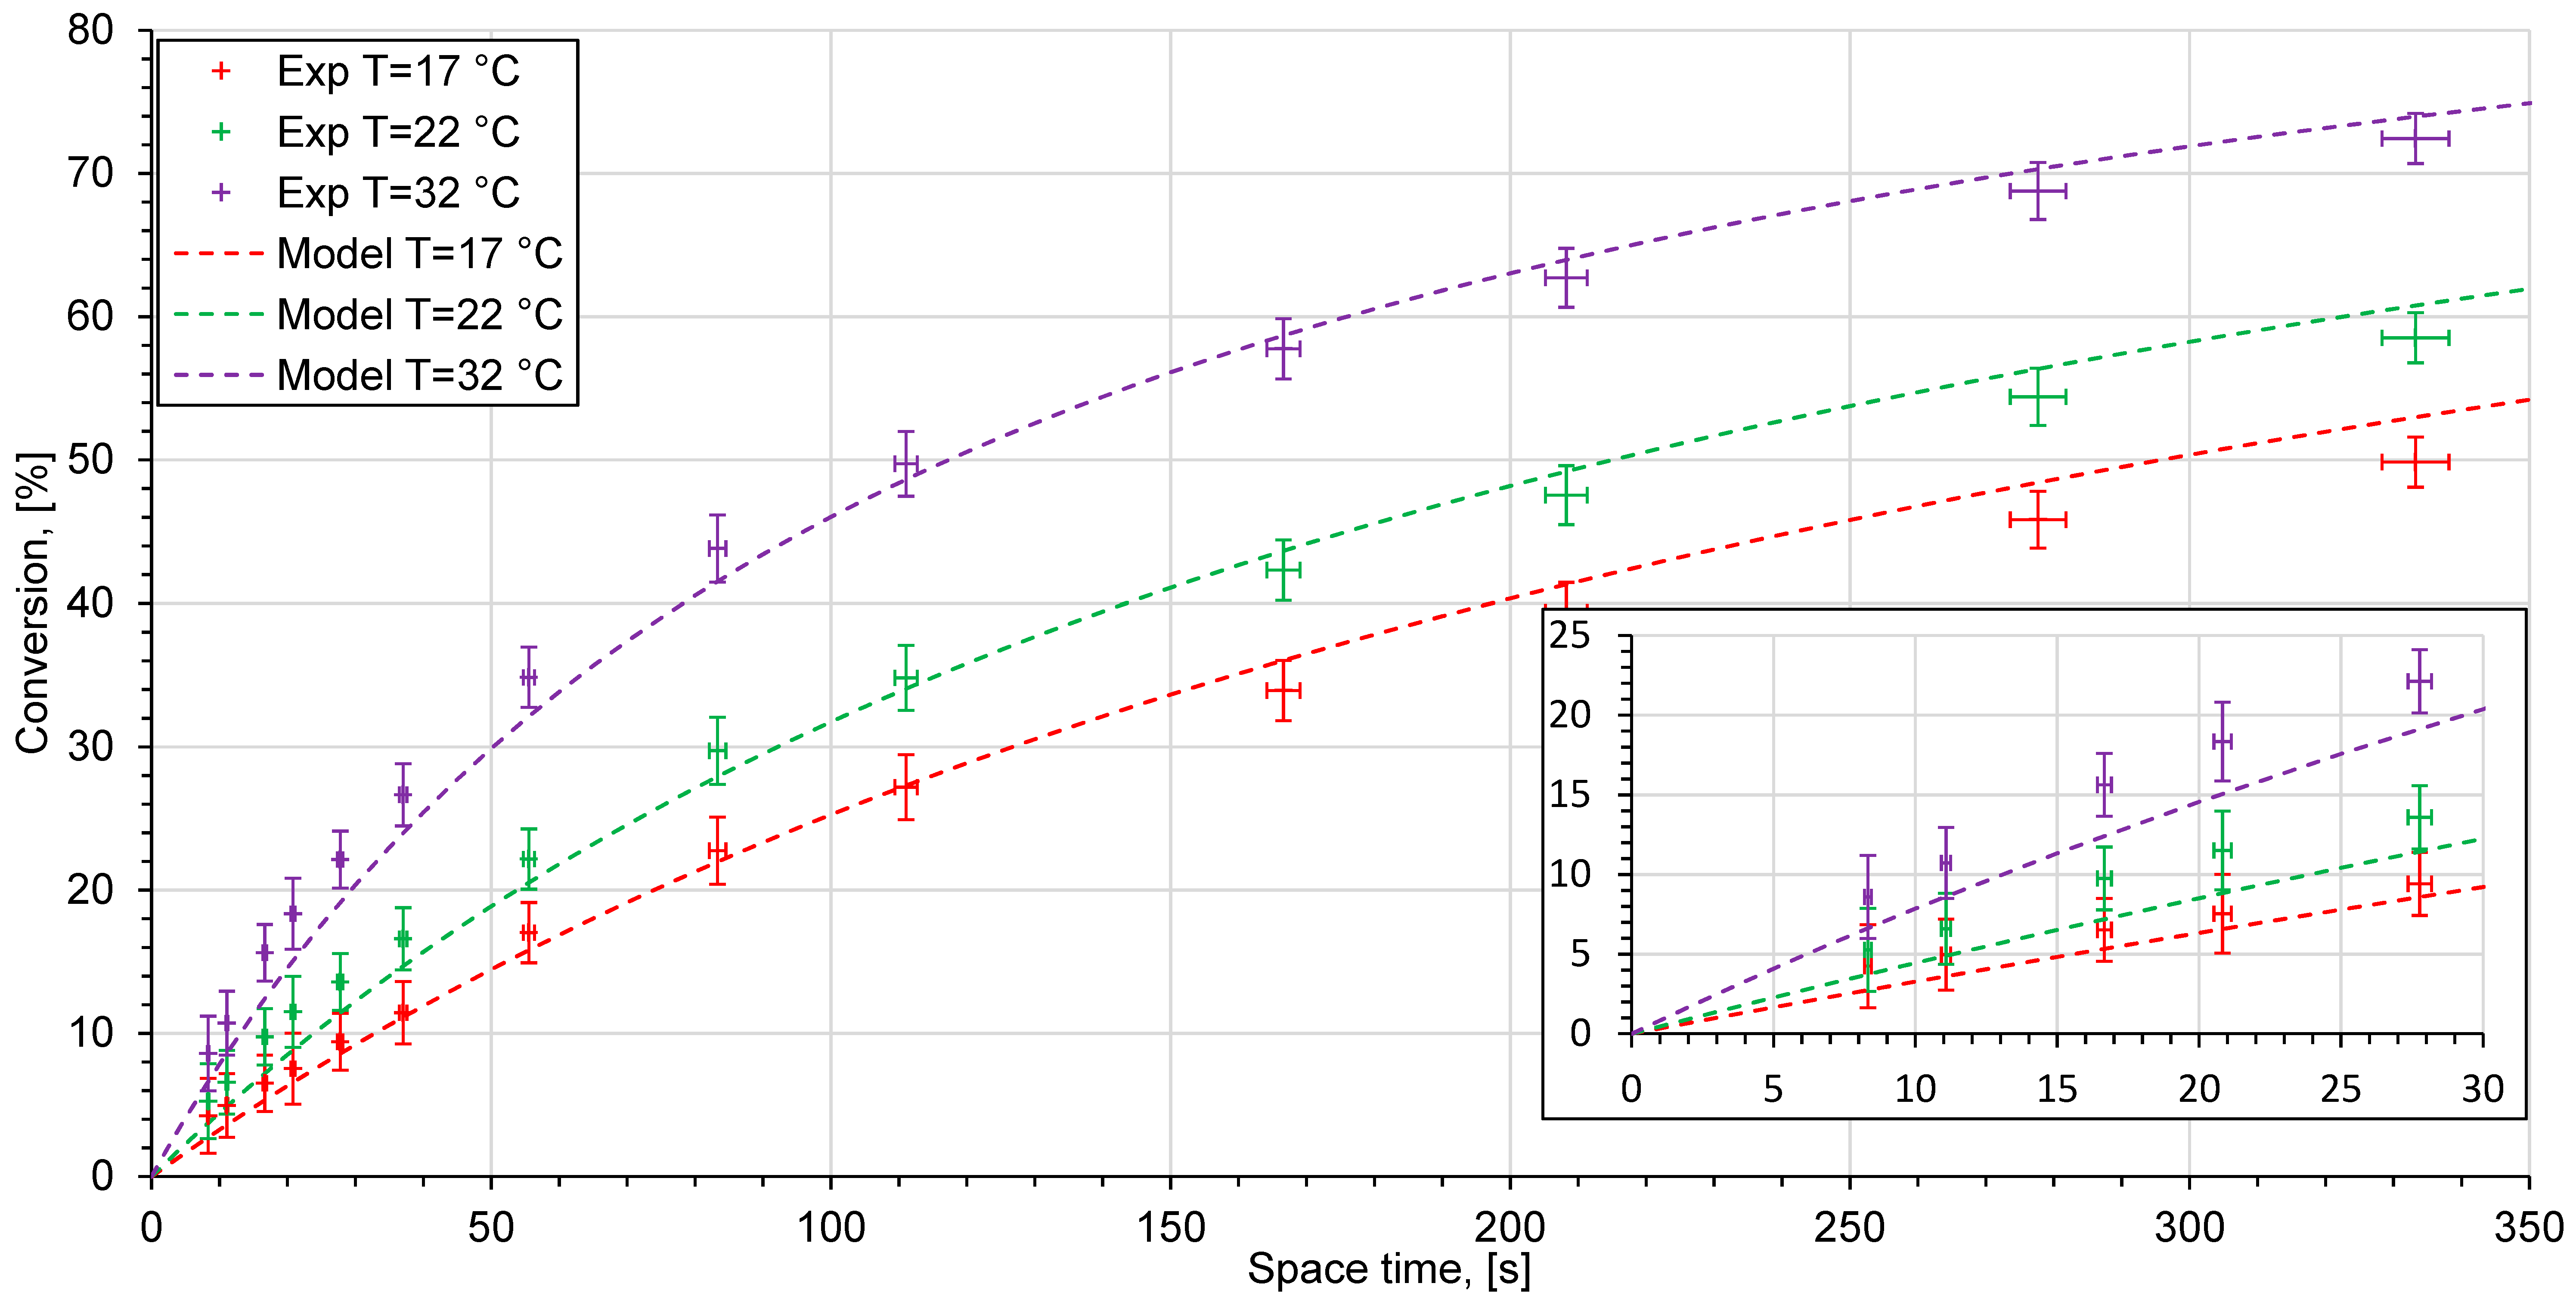
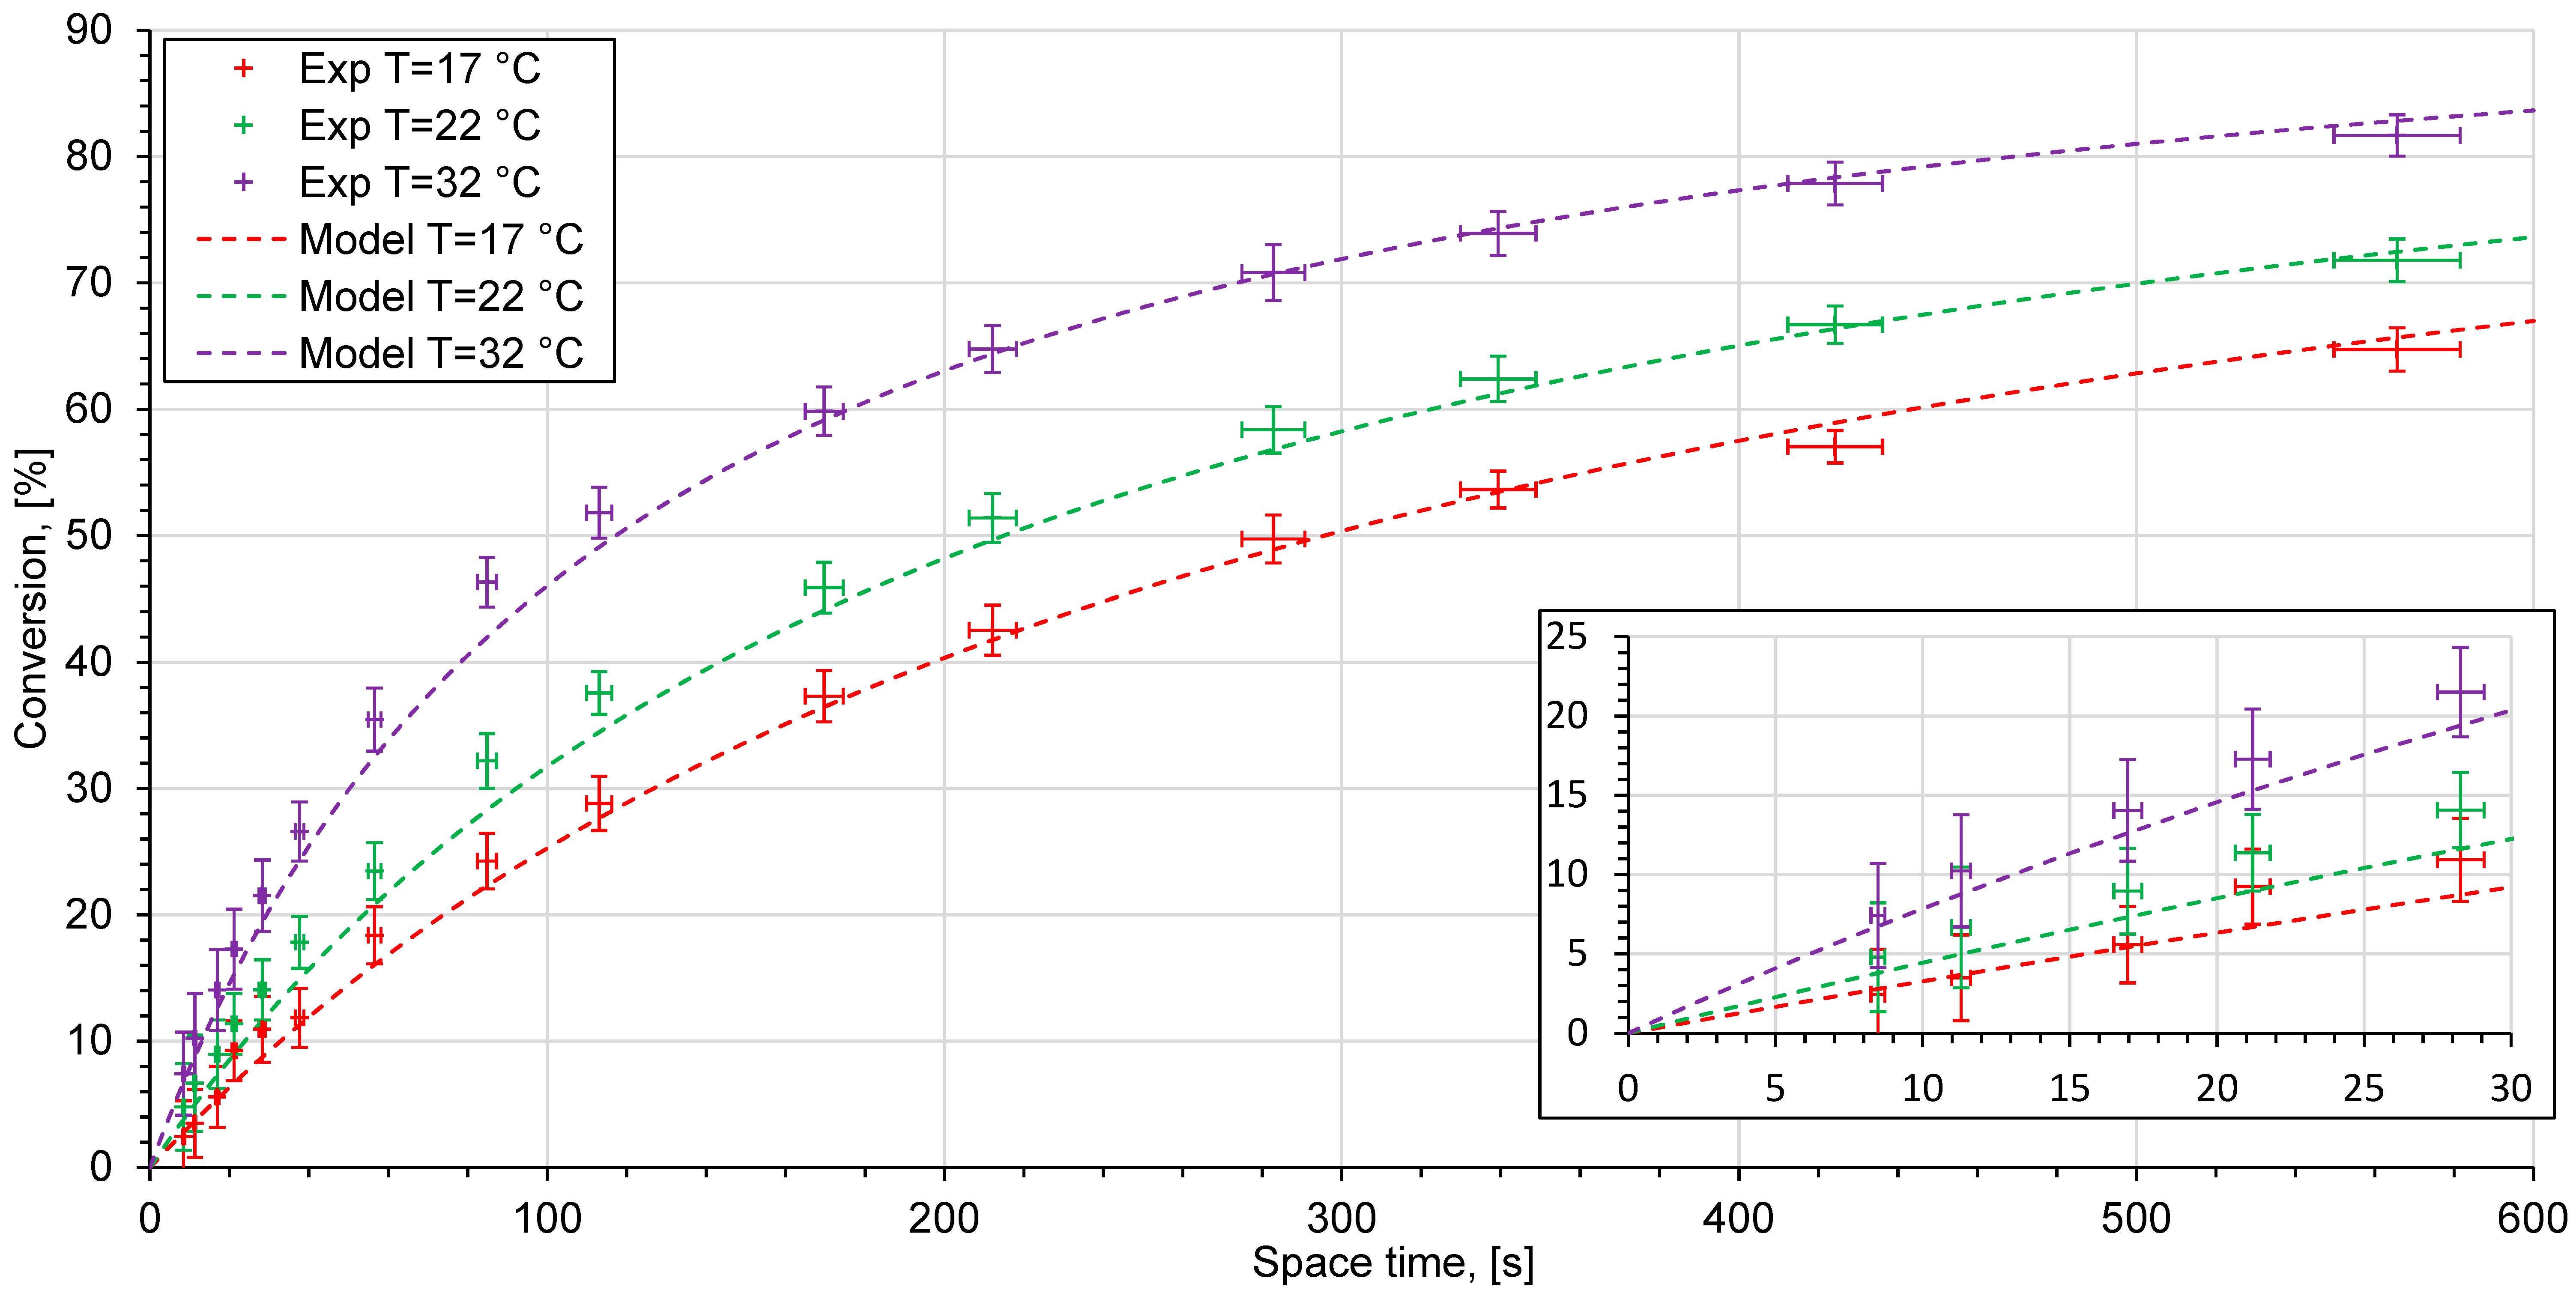
3.1. The Effect of Volume Flow Rate and Temperature on Conversion

The experimental measurements for the ethyl acetate saponification reaction were conducted in different reactor systems (Figure 7, Figure 8 and Figure 9). The experimental data are given as points with error bars. Horizontal error bars represent inaccuracies in the experimental determination of the volumes of the whole reactor system: the reactor, the residence time unit, the tube connectors, and the conductivity cell. Vertical error bars consider uncertainties of conductivity measurements and inaccuracies of conductivity measurements for 0% and 100% conversion solutions from Figure 6. The dashed lines represent the reactor model, based on the kinetic modeling using the Arrhenius parameters which were obtained from the kinetic study. Since the experimental points lie very close to each other, a zoomed in view at low space times is shown.
The measured conversion values in different reactor systems indicate the differences from the kinetic model. The reactor performance is considered as poor if the experimental points lie below the model curve. Otherwise, if the experimental points coincide, or are above the model curve the reactor system shows a good reactor performance.
The reactor system with a T-shaped reactor gives a good reactor performance only at high volume flow rates from 0.8 to 20 mL/min (space time from 8.3 to 55.5 s). At flow rates lower than 0.6 mL/min (space time longer than 278 s) and 17 °C, as well as at flow rates higher than 0.5 mL/min (space time longer than 332 s) at 22 °C, the experimental points lie below the model curve. This indicates this system’s low reactor performance. Figure 10 shows the mixing state for different volume flow rates obtained using a micro camera. At a low flow rate, a clearly distinct interface between two solutions can be observed (Figure 10a).
This corresponds to a low degree of mixing grade and indicates a strongly stratified flow, which is completely insufficient for mixing purposes [34]. Since the T-shaped reactor serves as the main mixing element in this system, further mixing can only be enhanced by molecular diffusion and weak secondary flow formations in the residence time unit. Therefore, the mixing time at low volume flow rates is relative long, thus having a negative effect on sodium hydroxide conversion. At higher flow rates, a significant intensification of the mixing process can be observed (Figure 10b). The flow consists of alternating layers of both solutions due to the formation of vortices in the cross-section. This flow is called vortex flow [34]. The interfacial area between solutions becomes significantly larger, which results in enhanced molecular diffusion which takes place in the residence time unit. Conversion at a volume flow rate of 5 mL/min or higher (space time less than 33 s) is equal to the results according to the kinetic model at the same space time because of weak vortices. Moreover, higher volume flow rates cause more intensive secondary flow vortices inside the residence time unit. At a volume flow rate of 20 mL/min, an extremely fast mixing process takes place, due to a vortex manifold of different length scales (Figure 10c). Therefore, mixing quality at 20 mL/min higher flow rate seems to be more efficient than at 5 mL/min.
There are differences between the experimental data and the model in the reactor system with a T-shaped reactor, and they can be observed at low flow rates and the highest investigated temperature (32 °C). At higher temperatures, the value of the diffusion constant increases. Since the primary mixing process occurs through molecular diffusion, the value of the diffusion constant may have a significant influence on the diffusion rate.
At high flow rates or short space times, several measurement points lie slightly above the model curve. A possible reason for this behavior is the fact that the hydrodynamics inside the conductivity cell can differ at various flow rates. A flow in a domain with a sudden contraction, a so-called back-step geometry, can cause the formation of recirculation and stagnation areas and other instabilities [48]. The intensity of secondary flow raises at higher values and depends on the Reynolds number. Furthermore, the fluid elements which have become trapped in the stagnation zone can stay inside for a long time. This may cause a significant difference between the space time and the residence time in the reactor. The chemical reaction proceeds in stagnated fluid elements and the conversion of sodium hydroxide increases. This can contribute to measurement inaccuracies in conductivity measurements, especially when the stagnation and measurement areas are located in the same place as in the present study. The impact of this may result in higher reaction rate constants in the T-shaped reactor than those obtained in the kinetic model. Both of the effects described above persist in all of the experimental setups and are likely to belong to a systematic error present in all investigated experimental setups (Figure 8, Figure 9 and Figure 10). Figure 8 shows the experimental data for a sodium hydroxide conversion over time in a microreactor system with an interdigital microreactor. Compared to the experimental data seen in the setup with a T-shaped reactor, there is no significant decrease in conversion values at low volume flow rates. The mixing process in the interdigital microreactor is based on the multilamination mixing principle and striation thickness reduction. The interdigital microreactor was developed especially for operation at low flow rates [16]. It gives a sufficient mixing rate across the entire range of the volume flow rates studied. The conversion values which have been achieved indicate good reactor performance.
The measured conversion values versus space time in the experimental setup using a chicane microreactor are shown in Figure 9. The volume flow rate could be varied over a wider range, starting at 0.3, and reaching 20 mL/min. The experimental data indicates a good match of the experimentally achieved conversion with the results of the modeling. This type of microreactor has a chicane channel structure and belongs to a reactor type which is based on chaotic advection and is designed to be utilized at high flow rates. Nevertheless, even when flow rates are small, the chicane mixing channel provides good reactor performance due to a greater mixing rate, which is much faster than the reaction rate seen in a saponification reaction. Figure 11 shows the mixing process carried out at different volume flow rates in the initial region of the chicane microreactor, after passing through two rows, each with 33 cells. When there is a strongly stratified flow at a flow rate of 0.1 mL/min, the mixing quality is clearly low. The interface between the solutions is blurred due to the long diffusion time at low flow rate (Figure 11). With a higher flow rate of 5 mL/min, a significant change in hydrodynamics is observed, starting from the first cell (Figure 11). In this case, eddy structures of chaotic advection can be observed. The desired homogeneous mixing state is achieved after passing only a few mixing elements. The remaining elements are not necessary for mixing.
In summary, the utilization of a complex microreactor system is not necessary to provide good mixing performance of slow homogeneous chemical reactions. For example, the reaction time of ethyl acetate saponification using sodium hydroxide (both solutions are 0.1 M) at a temperature of 17 °C is approximately 303 s. Even the investigated T-shaped reactor, coupled with a tube of 1.6 mm at high volume flow rates, provides a much faster mixing rate than reaction rate, resulting in good reactor performance but small conversions. In this case, the reaction is mainly limited by the reaction rate and a so-called chemical regime is provided [49]. On the other hand, there are discernible differences between the experimental data and the kinetic model at low flow rates in the reactor system with a T-shaped reactor, indicating a lack of mixing under these conditions. In this case, reactor performance depends on both chemical kinetic and mass transport in the reactor, providing higher conversions due to lower volume flow rates. Behavior such as this is called the chemical/diffusional regime [49]. In this case, several additional mixing elements, or a more complex reactor structure, are necessary to give a much faster mixing rate than the reaction rate [14,19,49,50].
The parallel multilamination mixing principle, which is utilized in the interdigital microreactor, provides fast mixing across the entire range of the investigated volume flow rates. In the microreactor system with a chicane microreactor, mixing intensification is mainly excessive. Homogeneous mixing can be achieved after the elements of the chicane channel are first mixed at all volume flow rates. The remaining elements serve as a residence time unit with complex geometry. A similar microreactor with a lower number of chicane mixing elements could be sufficient to carry out such a slow reaction.
Similar results for reactor systems based on microfluidic devices were observed in the article by Schwolow et al. [38]. The authors evaluated mixing time lower than one second at high flow rates. Comparing these mixing times with the reaction time-scale needed for the ethyl acetate saponification, it can be concluded that such a fast mixing rate is not necessary for such a slow reaction. Regardless, reaction systems with interdigital and chicane microreactors provide mixing of constant quality. This is especially important at lower volume flow rates because under these conditions, higher conversions can be achieved.

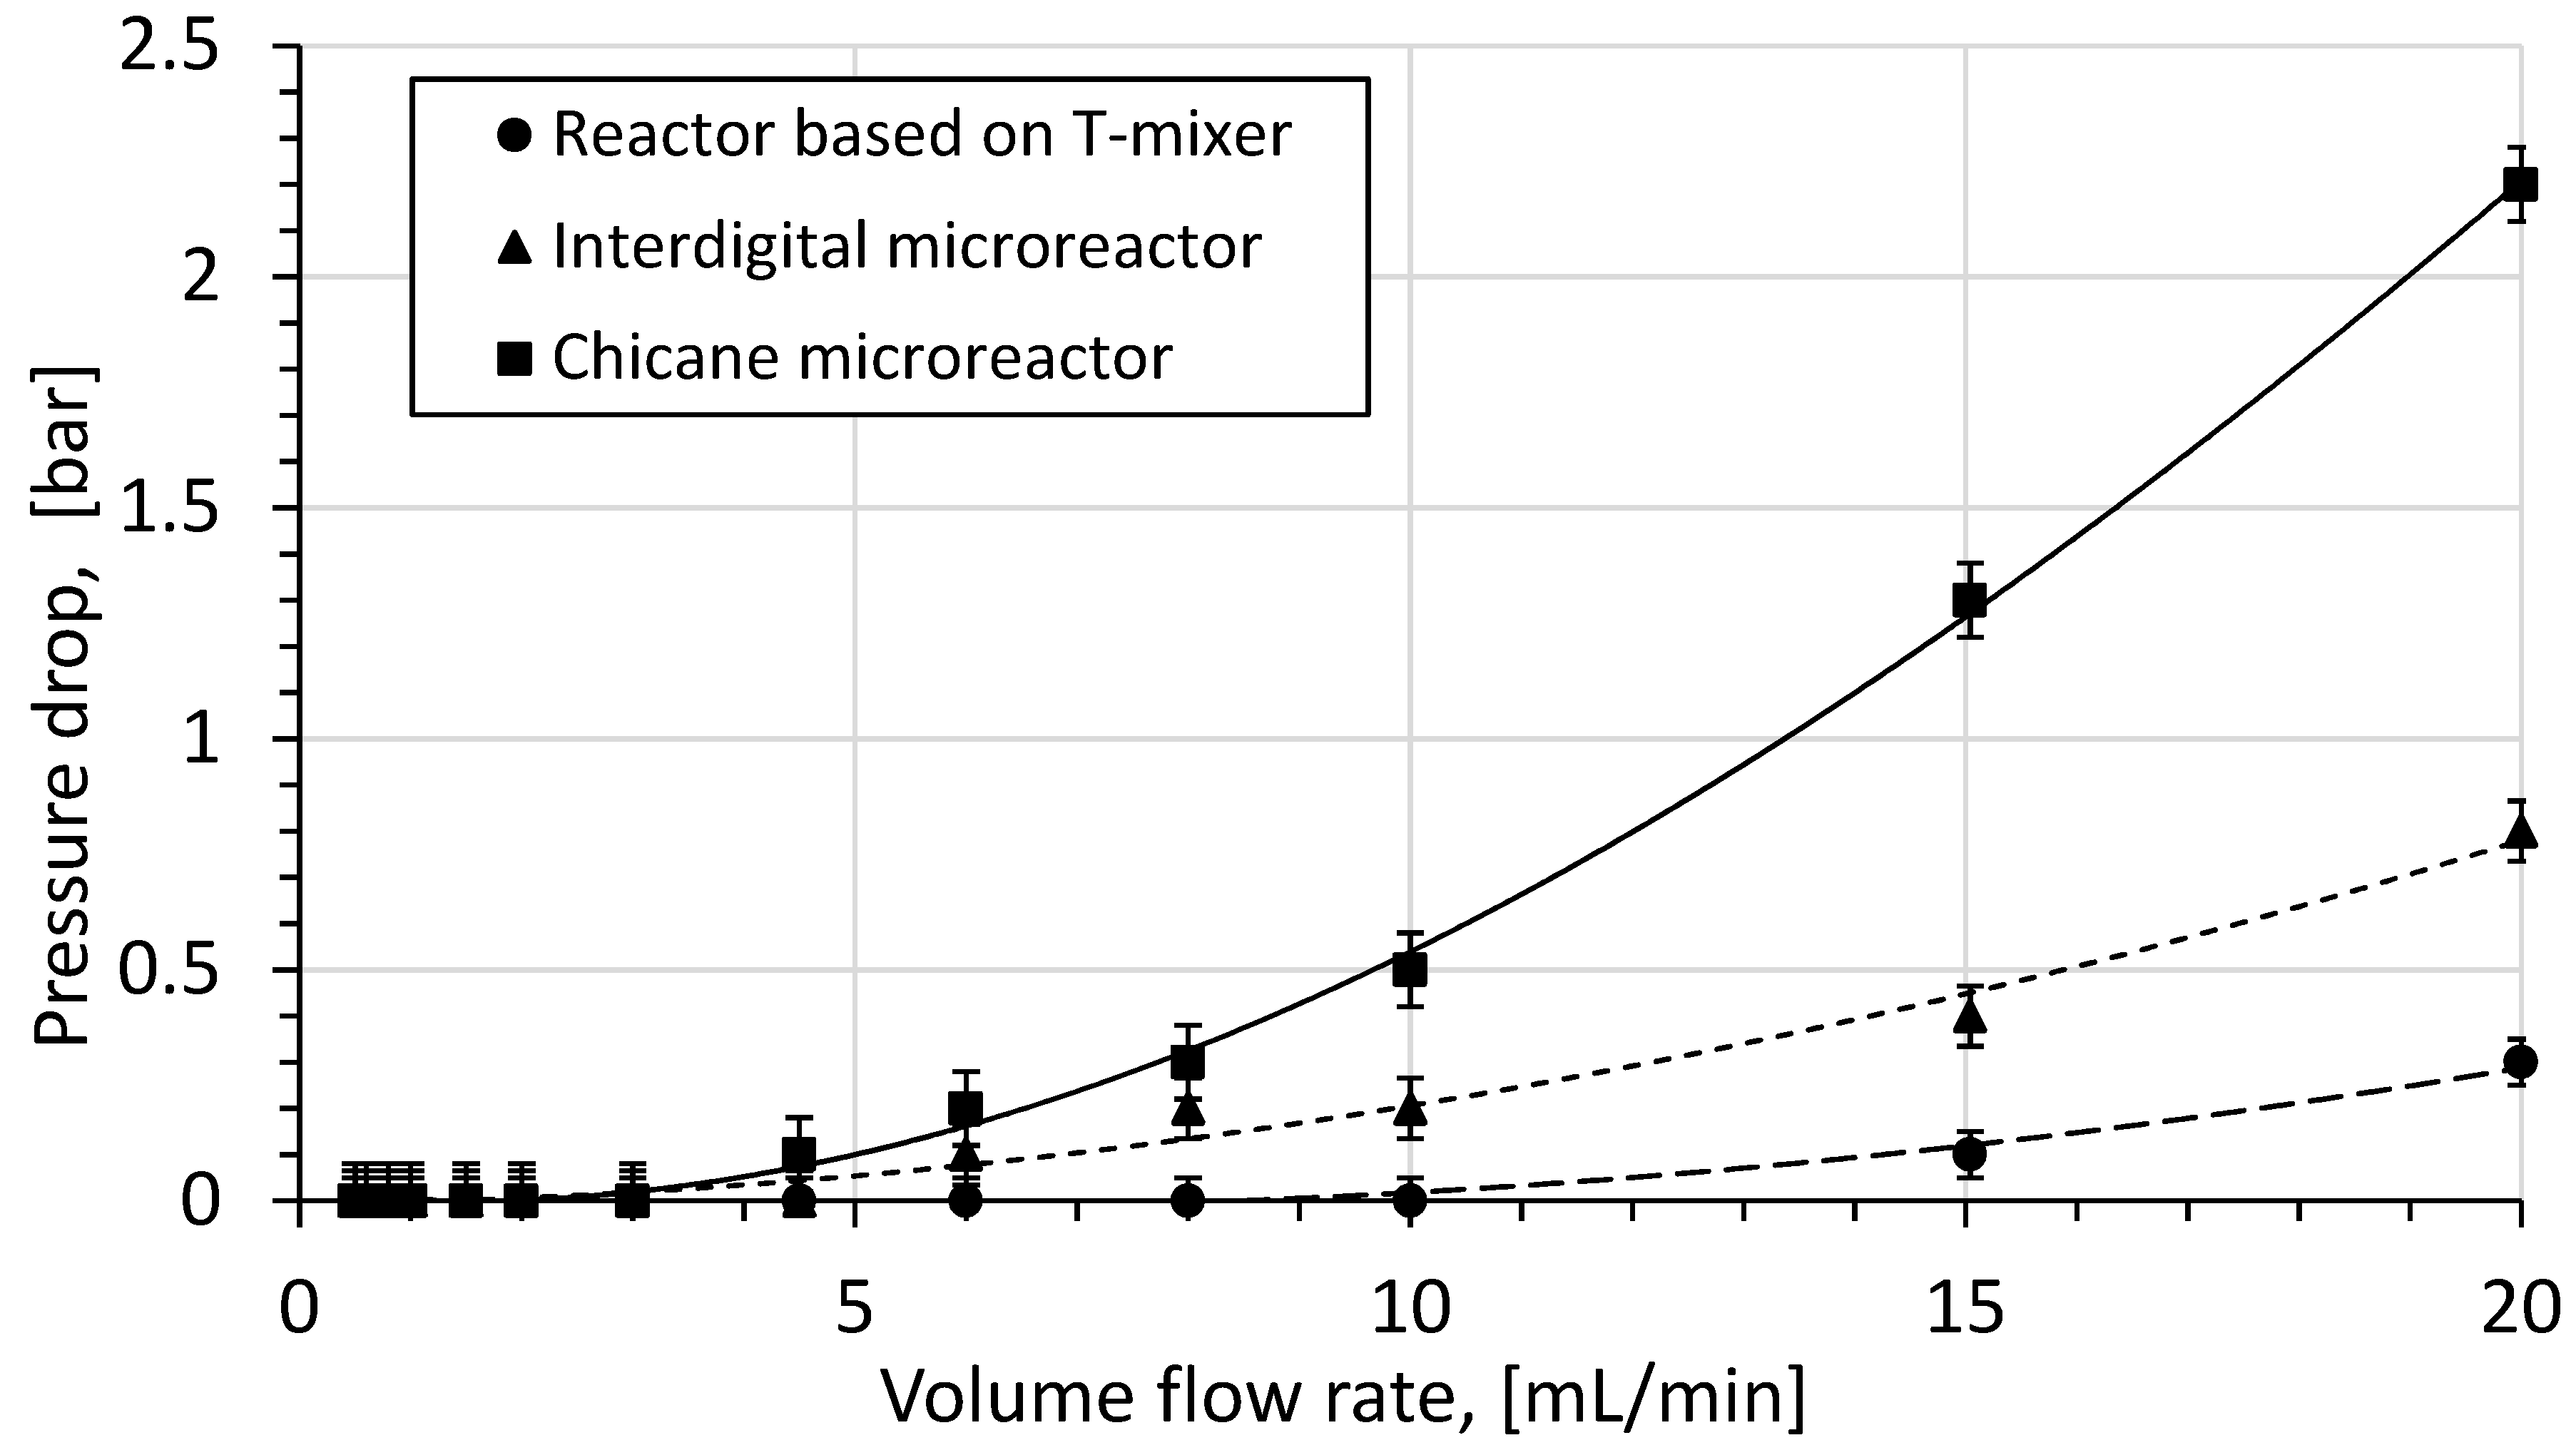
3.2. Effect of Volume Flow Rate on Pressure Drop

Pressure drop is a physical process in which flow energy dissipates due to frictional shear forces within the channel. A higher pressure drop in a reactor system requires higher pump power, tougher materials and as a result, increased financial operational and production costs [16].
Therefore, pressure drop is an important parameter which should be considered in microfluidic systems [43].
The mechanical energy in laminar flow in a reactor system dissipates mainly via two processes: the laminar flow wall friction Δ p wall   friction and the chaotic secondary flow vortex structures Δ p chaotic   advection [4]:
Δ p total = Δ p wall   friction + Δ p chaotic   advection
The first term is proportional to the volume flow rate, while the second term shows a quadratic dependency of the volume flow rate. The simplified model, which is based on the model seem in the article by Kockmann et al. [4], can be formulated as follows:
Δ p = aQ + bQ 2
where a denotes the term which relates to the wall friction, and b characterizes the secondary vortices intensity.
The experimental and calculated pressure drop values over the volume flow rate in different reactor systems are shown in Figure 12. The flow which consumes the least energy in the reactor system is based on the T-shaped reactor because it has the simplest structure and the largest characteristic lengths of 2.8 mm, compared to other microreactors. In this reactor type, pressure drop is less than 0.1 bar at flow rates of up to 10 mL/min. At higher volume flow rates, the formation of hydrodynamic vortices dramatically increases the pressure drop within this type of reactor. Therefore pressure drop dependency of the volume flow rate becomes quadratic.
In the microreactor system with an interdigital microreactor, the pressure drop is much higher since the characteristic length of the microchannels is several times smaller. The extremely small dimensions of microchannels cause higher wall friction due to their larger wall area. This leads to a higher flow of mechanical energy consumption, which is shown by the pressure drop.
The highest-pressure drop is observed in the microreactor system with a chicane microreactor. The reason for this is found in the structure of the chicane mixing channel, which is specially designed for building vortices. Increasing the volume flow rate causes a significant growth in the vortices’ intensity in flow, resulting in higher energy dissipation due to larger frictional losses via chaotic advection.
The wall friction and secondary chaotic friction factors of the model used are listed in Table 6. The reactor system with a T-shaped reactor provides the lowest values of both factors. The relatively small wall area of this reactor causes low wall friction. Due to the structure of the reaction system, an intense vortex pattern only appears in the T-shaped reactor. A slight growth in pressure drop in the system with a T-shaped reactor is observed at flow rates higher than 15 mL/min. This is because the intensity of chaotic advection greatly depends on the volume flow rate. In the interdigital microreactor, a high number of parallelly combined microchannels inside the microreactor provides a large area-to-volume ratio. Therefore it is possible to achieve a much higher value for the wall friction factor in this microreactor compared to other reactor systems. At the same time, the small channel dimensions provide a more intensive formation of vortex structures within an interdigital microreactor than seen in the setup with a T-shaped reactor. Consequently, both wall friction and chaotic advection play a similar role with regard to pressure drop in the interdigital microreactor. In the chicane microreactor, the vortex factor has a remarkably higher value, likely due to its mixing principle, which is mainly based on intensive chaotic advection in the chicane mixing channel. A rapid growth in pressure drop in this type of system over the volume flow rate begins at a flow rate of 4.5 mL/min. However, due to the geometry of the chicane channel, the area-to-volume ratio is high as well, providing a higher value of wall friction factor than in the reactor systems with a T-shaped reactor or an interdigital microreactor.

4. Conclusions

In the present study, three different reactor systems were experimentally investigated with regard to their performance: the T-shaped reactor, the interdigital microreactor, and the chicane microreactor. Experiments were carried out in a wide range of volume flow rates, varying from 0.5 to 20 mL/min, and at three different temperatures, 17 °C, 22 °C and 32 °C. The reactor performance of investigated systems was evaluated with the help of the formulated kinetic model.
At volume flow rates greater than 0.8 mL/min, the system based on a T-shaped reactor can provide reactor performance equal to that of the other two investigated systems. The reason for this is the slow reaction rate of the given reaction, which is mainly influenced by the kinetic reaction. Furthermore, the system with a T-shaped reactor indicates the lowest pressure drop. However, at lower volume flow rates, mass transport plays a significant role as well. In such cases, to achieve a greater reactor performance, the T-shaped reactor should be replaced with either an interdigital or a chicane microreactor.
The microreactor setups based on interdigital and the chicane microreactors give good reactor performance across the whole range of studied volume flow rates. However, these microreactors exhibit a higher pressure drop, indicating higher mechanical-flow energy consumption. Therefore, the interdigital and the chicane microreactor provide an experimental advantage only through faster chemical reactions or at low volume flow rates, where the reaction is controlled by mass transport and effective mixing is required.

Author Contributions

Conceptualization, methodology, validation, administration, writing—review and editing, E.B. and W.R.; methodology, validation, investigation, visualization V.K. and N.S.; conceptualization, methodology, scientific discussions, supervision, funding acquisition, A.M. and W.R.

Funding

This study was supported by the Erasmus Mundus Action 2 Programme of the European Union and by the Ministry of Education and Science of the Russian Federation, grant number 10.3444.2017/ПЧ.

Conflicts of Interest

The authors declare no conflict of interest.

References

  1. Reschetilowski, W. Microreactors in Preparative Chemistry: Practical Aspects in Bioprocessing, Nanotechnology, Catalysis and More; Wiley-VCH: Weinheim, Germany, 2013; ISBN 978-3-527-33282-3. [Google Scholar]
  2. Schwarz, S.; Borovinskaya, E.S.; Reschetilowski, W. Base catalyzed ethanolysis of soybean oil in microreactors: Experiments and kinetic modeling. Chem. Eng. Sci. 2013, 104, 610–618. [Google Scholar] [CrossRef]
  3. Sun, J.; Ju, J.; Ji, L.; Zhang, L.; Xu, N. Synthesis of Biodiesel in Capillary Microreactors. Ind. Eng. Chem. Res. 2008, 47, 1398–1403. [Google Scholar] [CrossRef]
  4. Wen, Z.; Yu, X.; Tu, S.T.; Yan, J.; Dahlquist, E. Intensification of biodiesel synthesis using zigzag micro-channel reactors. Bioresour. Technol. 2009, 100, 3054–3060. [Google Scholar] [CrossRef] [PubMed]
  5. Pennemann, H.; Watts, P.; Haswell, S.J.; Hessel, V.; Löwe, H. Benchmarking of Microreactor Applications. Organ. Process Res. Dev. 2004, 8, 422–439. [Google Scholar] [CrossRef]
  6. Jähnisch, K.; Baerns, M.; Hessel, V.; Ehrfeld, W.; Haverkamp, V.; Löwe, H.; Wille, C.; Guber, A. Direct fluorination of toluene using elemental fluorine in gas/liquid microreactors. J. Fluor. Chem. 2000, 105, 117–128. [Google Scholar] [CrossRef]
  7. Drott, J.; Lindström, K.; Rosengren, L.; Laurell, T. Porous silicon as the carrier matrix in microstructured enzyme reactors yielding high enzyme activities. J. Micromech. Microeng. 1997, 7, 14–23. [Google Scholar] [CrossRef]
  8. Ahmed-Omer, B.; Brandt, J.C.; Wirth, T. Advanced organic synthesis using microreactor technology. Org. Biomol. Chem. 2007, 5, 733–740. [Google Scholar] [CrossRef]
  9. Borovinskaya, E.S.; Reschetilowski, W. Perspectives of heterogeneous process intensification in microreactors. Russ. J. Gen. Chem. 2012, 82, 2108–2115. [Google Scholar] [CrossRef]
  10. Yoshida, J.I.; Nagaki, A.; Iwasaki, T.; Suga, S. Enhancement of Chemical Selectivity by Microreactors. Chem. Eng. Technol. 2005, 28, 259–266. [Google Scholar] [CrossRef]
  11. Wörz, O.; Jäckel, K.P.; Richter, T.; Wolf, A. Microreactors, a new efficient tool for optimum reactor design. Chem. Eng. Sci. 2001, 56, 1029–1033. [Google Scholar] [CrossRef]
  12. Murphy, E.R.; Martinelli, J.R.; Zaborenko, N.; Buchwald, S.L.; Jensen, K.F. Accelerating reactions with microreactors at elevated temperatures and pressures: Profiling aminocarbonylation reactions. Angew. Chem. Int. Ed. Engl. 2007, 46, 1734–1737. [Google Scholar] [CrossRef] [PubMed]
  13. Yoshida, J.; Nagaki, A.; Yamada, T. Flash chemistry: Fast chemical synthesis by using microreactors. Chemistry 2008, 14, 7450–7459. [Google Scholar] [CrossRef] [PubMed]
  14. Roberge, D.M.; Gottsponer, M.; Eyholzer, M.; Kockmann, N. Industrial design, scale-up, and use of microreactors. Chem. Today 2009, 27, 8–11. [Google Scholar]
  15. Kockmann, N.; Gottsponer, M.; Roberge, D.M. Scale-up concept of single-channel microreactors from process development to industrial production. Chem. Eng. J. 2011, 167, 718–726. [Google Scholar] [CrossRef]
  16. Nguyen, N. Micromixers: Fundamentals, Design and Fabrication, 2nd ed.; William Andrew: Norwich, UK, 2011; ISBN 978-1-4377-3520-8. [Google Scholar]
  17. Kockmann, N.; Kiefer, T.; Engler, M.; Woias, P. Convective mixing and chemical reactions in microchannels with high flow rates. Sens. Actuators B Chem. 2006, 117, 495–508. [Google Scholar] [CrossRef]
  18. Kockmann, N. Transport Phenomena in Micro Process Engineering; Springer: Berlin/Heidelberg, Germany, 2008; ISBN 978-3-540-74616-4. [Google Scholar]
  19. Bothe, D.; Stemich, C.; Warnecke, H.J. Computation of scales and quality of mixing in a T-shaped microreactor. Comput. Chem. Eng. 2008, 32, 108–114. [Google Scholar] [CrossRef]
  20. Levenspiel, O. Chemical Reaction Engineering, 3rd ed.; John Wiley & Sons: New York, NY, USA, 1998; ISBN 978-0471254249. [Google Scholar]
  21. Borovinskaya, E.S.; Sabaditsch, D.; Reschetilowski, W. Base-Catalyzed Ethanolysis of Waste Cooking Oil in a Micro/Millireactor System: Flow and Reaction Analysis. Chem. Eng. Technol. 2018, 42, 495–505. [Google Scholar] [CrossRef]
  22. Robertson, K. Using flow technologies to direct the synthesis and assembly of materials in solution. Chem. Cent. J. 2017, 11, 4. [Google Scholar] [CrossRef]
  23. Niu, X.Z.; Lee, Y.K. Efficient spatial-temporal chaotic mixing in microchannels. J. Micromech. Microeng. 2003, 13, 454–462. [Google Scholar] [CrossRef]
  24. Hessel, V.; Hardt, S.; Löwe, H.; Schönfeld, F. Laminar mixing in different interdigital micromixers: I. Experimental characterization. AIChE J. 2003, 49, 566–577. [Google Scholar] [CrossRef]
  25. Schwesinger, N.; Frank, T.; Wurmus, H. A modular microfluid system with an integrated micromixer. J. Micromech. Microeng. 1996, 6, 99–102. [Google Scholar] [CrossRef]
  26. Knight, J.B.; Vishwanath, A.; Brody, J.P.; Austin, R.H. Hydrodynamic Focusing on a Silicon Chip: Mixing Nanoliters in Microseconds. Phys. Rev. Lett. 1998, 80, 3863–3866. [Google Scholar] [CrossRef]
  27. Stroock, A.D.; Dertinger, S.K.; Ajdari, A.; Mezić, I.; Stone, H.A.; Whitesides, G.M. Chaotic mixer for microchannels. Science 2002, 295, 647–651. [Google Scholar] [CrossRef] [PubMed]
  28. Hessel, V.; Löwe, H.; Schönfeld, F. Micromixers—A review on passive and active mixing principles. Chem. Eng. Sci. 2005, 60, 2479–2501. [Google Scholar] [CrossRef]
  29. Villermaux, J. Micromixing phenomena in stirred reactors. In Encyclopedia Fluid Mechanics; Gulf Publishing Company: Houston, TX, USA, 1986. [Google Scholar]
  30. Löb, P.; Drese, K.S.; Hessel, V.; Hardt, S.; Hofmann, C.; Löwe, H.; Schenk, R.; Schönfeld, F.; Werner, B. Steering of Liquid Mixing Speed in Interdigital Micro Mixers—From Very Fast to Deliberately Slow Mixing. Chem. Eng. Technol. 2004, 27, 340–345. [Google Scholar] [CrossRef]
  31. Schönfeld, F.; Hessel, V.; Hofmann, C. An optimised split-and-recombine micro-mixer with uniform chaotic mixing. Lab Chip 2004, 4, 65–69. [Google Scholar] [CrossRef]
  32. Zhang, Z.; Zhao, P.; Xiao, G.; Lin, M.; Cao, X. Focusing-enhanced mixing in microfluidic channels. Biomicrofluidics 2008, 2, 14101. [Google Scholar] [CrossRef]
  33. Wong, S.H.; Ward, M.C.; Wharton, C.W. Micro T-mixer as a rapid mixing micromixer. Sens. Actuators B Chem. 2004, 100, 359–379. [Google Scholar] [CrossRef]
  34. Bothe, D.; Stemich, C.; Warnecke, H.-J. Fluid mixing in a T-shaped micro-mixer. Chem. Eng. Sci. 2006, 61, 2950–2958. [Google Scholar] [CrossRef]
  35. Gobby, D.; Angeli, P.; Gavriilidis, A. Mixing characteristics of T-type microfluidic mixers. J. Micromech. Microeng. 2001, 11, 126–132. [Google Scholar] [CrossRef]
  36. Rudyak, V.; Minakov, A. Modeling and Optimization of Y-Type Micromixers. Micromachines 2014, 5, 886–912. [Google Scholar] [CrossRef]
  37. Yang, J.; Qi, L.; Chen, Y.; Ma, H. Design and Fabrication of a Three Dimensional Spiral Micromixer. Chin. J. Chem. 2013, 31, 209–214. [Google Scholar] [CrossRef]
  38. Schwolow, S.; Hollmann, J.; Schenkel, B.; Röder, T. Application-Oriented Analysis of Mixing Performance in Microreactors. Organ. Process Res. Dev. 2012, 16, 1513–1522. [Google Scholar] [CrossRef]
  39. Mengeaud, V.; Josserand, J.; Girault, H.H. Mixing Processes of a Zigzag Microchannel: Finite Element Simulations and Optical Study. Anal. Chem. 2002, 64, 4279–4286. [Google Scholar] [CrossRef]
  40. Bhagat, A.A.; Peterson, E.T.; Papautsky, I. A passive planar micromixer with obstructions for mixing at low Reynolds numbers. J. Micromech. Microeng. 2007, 17, 1017–1024. [Google Scholar] [CrossRef]
  41. Khaydarov, V.; Borovinskaya, E.S.; Reaschetilowski, W. Numerical and Experimental Investigations of a Micromixer with Chicane Mixing Geometry. Appl. Sci. 2018, 8, 2458. [Google Scholar] [CrossRef]
  42. Hossain, S.; Ansari, M.A.; Kim, K.Y. Evaluation of the mixing performance of three passive micromixers. Chem. Eng. J. 2009, 150, 492–501. [Google Scholar] [CrossRef]
  43. Holvey, C.P.; Roberge, D.M.; Gottsponer, M.; Kockmann, N.; Macchi, A. Pressure drop and mixing in single phase microreactors: Simplified designs of micromixers. Chem. Eng. Process. 2011, 50, 1069–1075. [Google Scholar] [CrossRef]
  44. Falk, L.; Commenge, J.M. Performance comparison of micromixers. Chem. Eng. Sci. 2010, 65, 405–411. [Google Scholar] [CrossRef]
  45. Das, K.; Sahoo, P.; Sai Baba, M.; Murali, N.; Swaminathan, P. Kinetic studies on saponification of ethyl acetate using an innovative conductivity-monitoring instrument with a pulsating sensor. Int. J. Chem. Kinet. 2011, 43, 648–656. [Google Scholar] [CrossRef]
  46. Petek, A.; Krajnc, M. The enthalpy and entropy of activation for ethyl acetate saponification. Int. J. Chem. Kinet. 2012, 44, 692–698. [Google Scholar] [CrossRef]
  47. Iorio, C.S.; Perfetti, C.; Dubois, F. Fast Mixing in Microchannels by Input Modulation: A Numerical and Experimental Study. ASME Proc./Micromixers 2011, 165–169. [Google Scholar] [CrossRef]
  48. Caro, C.G. The Mechanics of the Circulation; Cambridge University Press: Cambridge, MA, USA, 2011; ISBN 0-19-263323-6. [Google Scholar]
  49. DeMello, A.J. Control and detection of chemical reactions in microfluidic systems. Nature 2006, 442, 394–402. [Google Scholar] [CrossRef] [PubMed]
  50. Bothe, D.; Lojewski, A.; Warnecke, H.-J. Computational analysis of an instantaneous chemical reaction in a T-microreactor. AIChE J. 2010, 56, 1406–1415. [Google Scholar] [CrossRef]
Figure 1. Experimental setup for the continuous saponification of ethyl acetate: (a) T-shaped reactor, interdigital microreactor or chicane microreactor; (b) conductivity cell; (c) residence time unit.
Applsci 09 00532 g001
Figure 2. Measured conversion and modeling results for sodium hydroxide conversion at 17 °C.
Applsci 09 00532 g002
Figure 3. Arrhenius plot for saponification of ethyl acetate.
Applsci 09 00532 g003
Figure 4. Schematic of operating characteristics for pumps tested.
Applsci 09 00532 g004
Figure 5. Different mixing states of two solutions in chicane microreactor using piston pumps: (a) volume flow rate of 1 mL/min; (b) volume flow rate of 6 mL/min.
Applsci 09 00532 g005
Figure 6. Calibration of the pumps.
Applsci 09 00532 g006
Figure 7. Experimental data (crosses) and kinetic model (dashed lines) at different temperatures in the reactor system with a T-shaped reactor.
Applsci 09 00532 g007
Figure 8. Experimental data (crosses) and kinetic model (dashed lines) at different temperatures in the reactor system with an interdigital microreactor.
Applsci 09 00532 g008
Figure 9. Experimental data (crosses) and kinetic model (dashed lines) at different temperatures in the reactor system with a chicane microreactor.
Applsci 09 00532 g009
Figure 10. Mixing in T-mixer at different volume flow rates: (a) 0.1 mL/min; (b) 5 mL/min; (c) 20 mL/min.
Applsci 09 00532 g010
Figure 11. Mixing in a chicanes microreactor at different volume flow rates: (a) 0.1 mL/min; (b) 5 mL/min.
Applsci 09 00532 g011
Figure 12. Pressure drop over volume flow rate.
Applsci 09 00532 g012
Table 1. Specification of investigated reactors.
Name and SupplierMixing PrincipleMaterialVolume, mL
T-shaped reactorT-mixingStainless steel0.05
Swagelok Corp
Interdigital microreactorParallel multilaminationStainless steel0.10
Ehrfeld Mikrotechnik BTS
Chicane microreactor XXL-S-01Chaotic advection within the chicane mixing channelBorosilicate glass1.80
Little Things Factory GmbH
Table 2. Calibration of conductivity values at different temperatures.
Temperature (°C)G0 (mS/cm)G100 (mS/cm)
1711.41 ± 0.053.75 ± 0.04
2211.20 ± 0.043.75 ± 0.04
3210.85 ± 0.053.75 ± 0.04
Table 3. Reaction rate constants at different temperatures.
MeasurementReaction Rate Constant, (L/(mol·s))
17 °C22 °C32 °C
10.06030.09900.1549
20.06170.09670.1605
30.06160.09500.1596
40.07160.09860.1824
50.07210.09970.1821
60.06870.09630.1722
Average value0.06600.09760.1686
Table 4. Kinetic data of ethyl acetate saponification by sodium hydroxide.
Activation Energy (kJ/mol)Pre-Exponential Factor (L/(mol·s))Reaction Rate Constant (L/(mol·s)) atSource
17 °C22 °C32 °C
41.402.18 × 10 60.0770.1030.178[45]
48.002.86 × 10 70.0650.0910.173[46]
45.381.00 × 10 60.0680.0930.171present study
Table 5. Tested pumps.
NameManufacturerType
REGLO-CPFCole-Parmer GmbHPiston pump
NE-300New Era Pump Systems Inc.Single syringe pump
S 1610SYKAM Chromatographie Vertriebs GmbHContinuous two-syringe pumping system
Table 6. Determined parameters in the pressure drop model (12) for different reaction systems.
Setup Based onabR2
T-shaped reactor0.00100.00060.89
Interdigital microreactor0.00500.00160.98
Chicanes microreactor0.00300.00551.00

