Abstract
Membrane biofouling has proved to be a major obstacle when it comes to membrane efficiency in membrane-based water treatment. Solutions to this problem remain elusive. This study presents novel polyethersulfone (PES) membranes that are fabricated using the phase inversion method at different loadings of graphene oxide (GO) and 1 wt. % arabic gum (AG) as nanofiller and pore forming agents. Synthesized GO was examined using scanning electron microscopy (SEM) and transmission electron microscopy (TEM) for morphological studies and energy-dispersive X-ray spectroscopy (EDX) for elemental analysis. The prepared GO flakes showed a high content of oxygen-containing groups (~31%). The fabricated membranes were extensively characterized, including water contact angle analysis for hydrophilicity, zeta potential measurements for surface charge, SEM, total porosity and pore size measurements. The prepared membranes underwent fouling tests using bovine serum albumin (BSA) solutions and biofouling tests using model Gram-positive (Bacillus subtilis) and Gram-negative (Escherichia coli) bacterial suspensions as well as real treated sewage effluent (TSE). The results showed that the novel PES/GO membranes possessed strong hydrophilicity and negative surface charge with an increase in porosity, pore size and water flux. The PES/GO membranes exhibited superior antibacterial action against both Gram-positive and Gram-negative bacterial species, implicating PES membranes which incorporate GO and AG as novel membranes that are capable of high antibiofouling properties with high flux.
Keywords:
Graphene oxide; Arabic gum; Polyether sulfone; Membranes; Ultrafiltration; Fouling; Biofouling; Hydrophilicity 1. Introduction
Membranes are increasingly being employed in both desalination and water treatment processes due to the advantages associated with membrane technologies [1]. It is broadly accepted that the utilization of membranes in desalination and wastewater treatment compared to the conventional processes, such as thermal desalination or activated sludge systems, offers reduced operating costs, lower carbon footprints and smaller environmental impacts on aquatic ecosystems [2]. Ultrafiltration (UF) membranes have far-reaching applications beyond the realms of water treatment. UF membranes have been widely employed in the foodstuffs industry and in the pharmaceutical industry [3].
However, membrane technology is not exempt from shortcomings. Any factor that increases membrane resistance directly affects membrane efficiency and functionality. Membrane fouling, often described as the “Achilles heel” of membrane technology, is by far and large the main problem, which arises in real applications that rely on membrane processes [4]. Fouling is caused by the settling of inorganic (usually metal salts), particulate or colloidal matter (silt and clay particles) and organic substances (such as proteins, lipids and polysaccharides) on membrane surfaces and membrane pores [5]. A fourth type of fouling, referred to as biofouling, is caused by microorganisms and the extracellular polymer substances (EPS) that they secrete [6].
Biofouling is ascribed to any form of membrane fouling that has originated from microorganisms and their associated secretions [7]. Membrane biofouling is an inherent problem that is encountered in a wide range of membrane-based water treatment processes, having a profound impact on determining the efficiency and applicability of the membrane. The process of biofouling is complex in nature, however it can be described in four basic stages. Initially, a conditioning film is formed on the membrane surface as a result of the adsorption of large organic molecules such as humic substances, lipoglycans and other products of microbial processing. This is shortly followed by the primary adhesion by rapidly adhering cells which exist as part of the microbial community in the feed water or solution. The third stage sees further colonization and growth by a wider spectrum of bacterial species. These late colonizers adhere to the membrane by exuding extracellular slime or EPS, which ultimately leads to the formation of a robust biofilm layer. The final stage in the biofouling process is the irreversible blocking of the membrane [8]. Unfortunately, the biofilm that is formed by the microorganisms acts as a protective shield from the conventional strategies that are used to combat biofouling such as chlorination or the addition of formaldehyde; this stabilizes the biofilm [9]. Other sanitizing agents including hydrochloric acid, caustic compounds and peroxides, amongst others, have been trialed with little or no success [10].
Membrane biofouling has a number of detrimental effects on membrane systems. Once the biofilm has been established on the membrane surface, the membrane flux declines [11]. This leads to increased feed pressure in order to maintain water filtration rates [12]. The increased pressure boosts operation costs and leads to a larger carbon footprint due to the additional electrical consumption [13]. The quality of the permeate may be compromised due to the increased passage of salts which is inevitable due to the buildup of aqueous ions that are embedded in the biofilm [14]. The high concentration at the membrane surface creates a strong concentration gradient.
The prevention and control of biofouling has taken many forms and strategies, none of which have succeeded in tackling the problem with rigor [15]. Biocide treatment has notoriously failed to address the problems that are associated with biofouling due to a number of reasons. Apart from the emergence of resistant strains of bacteria either by variation or via genetic interchange between species, the use of most biocides, such as chlorine, has proven incompatible with most membrane types [4]. Furthermore, any use of biocidal agents requires high-pressure flushing and cleaning, both of which are costly processes [9]. Nutrient limitation such as phosphate removal via chemical means (ion exchange, adsorption or precipitation, for instance [16]) though employed in large scale reverse osmosis (RO) modules, have proven unpopular due to the associated higher maintenance costs and disposal issues of the employed agents [17]. The inhibition of quorum sensing (QS), a small molecule signal-based system involving auto-inducers, has been investigated in several studies [18,19,20]. Despite promising results in inhibiting the formation of biofilms by specific strains of bacteria, the feasibility of such inhibition at a large scale remains to be tested [20].
The mainstream approach to dealing with biofouling is membrane surface modification [4]. Essentially this involves selecting materials that exhibit low bacterial affinity and at the same time have low maintenance attributes. Surface modification of polymeric membranes has indeed received a great deal of attention in the field of membrane technology and different modification agents were tested. Studies have involved incorporating inorganic additives such as silica [21] and nano-sized metal oxides (such as oxides of titanium [22], zirconium [23] and aluminum [24]). In other studies, so-called bacterial repellants or antiadhesive additives which include polyethylene oxide [25] and chitosan [26], respectively or bactericidal silver nanoparticles [27] and copper [28] have been blended to polymeric membrane matrices. One study in particular tested microfiltration membranes coated with carbon-based nanoparticles (fullerene C60) on Escherichia coli (E. coli) suspension [29]. Whilst their results indicated a decrease in microbial attachment, the effectiveness of their membranes in real waste waters that contain a diverse bacterial community was not tested.
The incorporation of carbon-based materials into polymeric based membranes has been reported in several studies to enhance the membrane properties [30,31,32]. Rezaee et al. [33] fabricated polysulfone-GO membranes that seemed to increase the membrane’s hydrophilicity, porosity, flux and rejection of arsenate. Some studies have explored the possibilities involving high-grade GO (graphene oxide) and unmodified graphene acting as antimicrobial agents [34,35,36,37]. Ahmed and Rodrigies [36] investigated the effect of GO on the microbial flora that is present in wastewater. Their findings implicated GO as an antimicrobial agent that is capable of disrupting the microorganisms’ metabolic activity. In another study, the antimicrobial activity of GO was increased by the addition of silver nanoparticles onto the large surface area of the reduced GO structures [37].
More recently, Manawi et al. [38] investigated the effect of adding AG (arabic gum) to polysulfone membranes at varied loadings in the casting solutions. It was found that the addition of AG encouraged the formation of porous structures, thereby increasing the porosity of the membranes. AG was seen to enhance the membranes’ surface charge, flux, rejection and importantly exhibited antimicrobial properties against E. coli bacteria.
For the purpose of this study, PES (polyethersulfone) was selected as a membrane-forming polymer due to its advantageous characteristics, namely good chemical resistance, robust mechanical strength and sound thermal stability [38]. The PES membranes were blended with AG alongside different loadings of synthesized GO. Both GO and AG were selected due to their dual effect on membrane hydrophilicity and surface charge. The fact that AG was recently shown to encourage pore formation [39] further added to the selection criteria of AG for its incorporation into the membranes.
The PES/GO membranes are expected to possess much of the hallmarks of low-biofouling membranes, namely possessing highly hydrophilic surfaces with enhanced negative charge at their surfaces, which is attributed to the GO and AG as nanofiller and surfactant, respectively. With increased pore size and total porosity, it is envisaged that the novel membranes will possess high flux relative to neat PES membranes. Importantly, the membranes are expected to exhibit stronger and more robust antibiofouling resistance when filtering bacterial suspensions and real treated sewage effluent (TSE), with higher normalized flux serving as an indicator when compared to neat PES and commercial UF membranes. Finally, it is anticipated that the novel PES membranes containing GO and AG will demonstrate strong antimicrobial properties against model Gram-positive and Gram-negative bacteria.
2. Materials and Methods
2.1. Materials
The following chemicals and analytical grade reagents were purchased: Natural graphite flake, −10 mesh, 99.9% (metals basis) from Alfa Aesar, Germany; nitric acid (HNO3) (67–69%) from ROMILSpA™, UK; hydrochloric acid (HCl) 37% from Sigma-Aldrich®, USA; sulfuric acid (H2SO4), 94.5% and 30% hydrogen peroxide (H2O2) from VWR Chemicals®, France; phosphoric acid (H3PO4) 85 wt.%, potassium permanganate (KMnO4) (≥99%) and N,N-Dimethylacetamide (DMA) from Honeywell Fluka®, India; AG (approximate molecular weight of 250 kDa) and BSA (69 KDa) from Sigma-Aldrich (USA); PES (Solvay, Belgium); m-Endo agar LES from HACH®, USA; mFC agar, Rosolic acid and sodium hydroxide (NaOH) all sourced from Fisher Scientific®, USA. The aqueous solutions were prepared in Millipore deionized water (DW).
2.2. GO Synthesis
In a typical experiment, 1 g of graphite powder was dispersed in a volumetric ratio of 90:10 acid mixtures of H2SO4 and H3PO4, respectively inside a 500 mL beaker surrounded by ice. The contents were stirred continuously for uniform dispersion. Next, 6 g of KMnO4 was added gradually whilst maintaining the temperature at below 5 °C. The content was then maintained at 45 ± 5 °C for 2 h using an oil bath. Then, 100 mL of DW was added in a drop by drop fashion whilst maintaining the temperature at below 20 °C. The beaker was then at 85 °C for 1 h. The experiment was stopped by the simultaneous addition of 120 mL of chilled DW and 15 mL H2O2. The solution was mixed with a small volume of 9:1 ratio of DW to HCl acid. The contents were centrifuged at 5000 rpm for 30 min at room temperature. The supernatant was discarded and the process was repeated several times using DW to resuspend the pellet and wash out the acid until a neutral pH was achieved. The pellet suspension was dried overnight in an oven at 85 °C.
2.3. GO Characterization
The synthesized GO was characterized by TEM (transmission electron microscopy) (FEI Talos F200X, Thermo Fisher Scientific, USA). A small sample of GO was added to a small volume of pure ethanol and was placed in an ultrasonic bath for 15 min to allow proper dispersion of the GO before imaging. Field emission scanning electron microscopy (FESEM) (FEI Versa 3D dual beam, Thermo Fisher Scientific, USA) fitted with EDX (XFlash 6130, Bruker, USA) was employed for morphological and elemental analysis of the GO samples.
Thermogravimetric analysis (TGA) for thermal stability and indirect analysis of functional group changes was conducted using a TGA 55 device from TA Instruments (USA). The samples were heated from 50 to 800 °C at a rate of 10 °C/min under nitrogen atmosphere.
2.4. Membrane Fabrication and Casting
Casting solutions were prepared using DMA solvent and 16 wt. % PES polymer. Then, 35 mL of dope solutions were aliquoted into 150 mL capacity glass beakers. Next, 1 wt. % AG and various loadings of GO were added to cast the nine membranes that are detailed in Table 1. The casting solutions were subject to a period of 1 h sonication (the ultrasonic processor with a power input of 300 W and a 20 kHz frequency was set to a 30% amplitude and a pulse of 1 s on and 2 s off program) using a Q500 sonicator probe (Thomas Scientific, USA) that was equipped with a tip diameter of 12 mm whilst being stirred using a labForce digital hotplate stirrer (Thomas Scientific, USA) to allow for efficient dispersion of the nanofiller throughout the solution. The solution was degassed for 1 h in order to eliminate air bubbles. The membranes were cast at room temperature according to standard phase inversion techniques using a Labcoat Master casting system (PHILOS, Korea). The casting speed was set at 3 m/min and a knife gap height of 200 nm. The glass was immersed into a coagulation bath containing DW where the solvent (DMA)/non-solvent (DW) exchange takes place, causing the polymeric membrane to precipitate off the glass. The cast membranes were washed and stored in DW.

Table 1.
Composition of PES (polyethersulfone) membranes synthesized. M1 is the neat membrane. All membranes were composed of 16% PES dissolved in DMA (N,N-Dimethylacetamide) solvent.
2.5. Membrane Characterization
2.5.1. Membrane Porosity, Pore Size and Surface Morphology
FESEM was employed to survey the surface and cross-section morphology of the synthesized membranes (a set vacuum condition at 3 kV was used throughout). For the cross-section imaging, liquid nitrogen was used to splinter the samples. All samples were sputtered with a 3 nm thick gold coating prior to imaging.
The gravimetric method [33] for evaluating membrane porosity was used. Briefly, this involved cutting the membranes to a set measured size before weighing the membranes wet (wiping excess DW droplets first) and then incubating them overnight at 45 °C. The membranes were re-weighed the next day. Multiple samples were weighed in order to obtain an average set of values. The total porosity was calculated using Equation (1) below:
where Ww represents wet masses and Wd represents the dry masses of the membranes, ρ represents the density of the DW at 25 °C water (998 kg/m3), A is the surface area of the membrane sample (m2) and l is the membrane thickness.
The membrane average pore size was derived according to the Guerout-Elford-Ferry equation (Equation (2) below):
where is the total porosity, Q is the volume of DW (permeate) expressed in m3/s, η is the viscosity of DW at 25 °C (8.9 × 10⁻⁴ Pa·s) and ΔP is the operating pressure which is typically one bar.
2.5.2. Membrane Surface Charge and Hydrophilicity
Water contact angle measurements were recorded in order to evaluate the hydrophilicity and wettability of the synthesized membranes. To that end, a KRÜSS DCA-25 Drop Shape Analyzer (Germany) was used. The volume of each water droplet was set at 1 µL and three readings were taken at three different randomly chosen positions on each membrane sample. An average of the nine readings was calculated as the contact angle for each membrane. Angles were measured using sessile drop orientation with a Young Laplace fitting method.
The surface charge for the membranes was calculated via the streaming potential method in a SurPASS™ 3 electrokinetic solid surface analyser (Anton Paar, Austria). The fabricated membranes were cut to fit the plated sample cell holder, whilst a 100 µm gap was maintained in between the membrane samples. An aqueous solution of 1 mM KCl was passed through the measuring cell. Zeta potential values were obtained for a range of pH values at room temperature using 0.1 M NaOH and 0.1 M HCl buffers to alter the pH of aqueous KCl.
2.5.3. Mechanical Testing of Membranes
Dynamic mechanical analysis (DMA) tests were performed using a TA Instruments model Q 800 DMA (USA) which employs a motor applied force on the sample whilst displacement sensors measure strain, force and amplitude. A uniaxial tensile load at a ramp displacement of 100.00 µm/min was configured. Dried samples of each membrane were cut rectangularly with the approximate dimensions of 22 mm × 6.5 mm. The thickness of each membrane sample was measured using a digital micrometer gauge. The Young’s modulus was calculated as the initial gradient from the generated strain (%)-stress (MPa) graphs for each membrane. Average values were recorded and used to evaluate the mechanical properties of each membrane.
2.5.4. Attenuated Total Reflectance Fourier Transform Infrared Spectroscopy (ATR-FTIR)
Multiple samples from each membrane were analyzed using a Nicolet™ iS50 FTIR Spectrometer, Thermo Fisher Scientific (USA) which was equipped with a horizontal attenuated total reflectance (ATR) device within the range of 4000–500 cm−1 in order to obtain FTIR spectra for the determination of functional groups that were present in the membranes.
2.5.5. Thermal Stability Characterization
TGA of the membranes was conducted by heating the membrane samples from 50 to 650 °C at a rate of 10 °C/min under nitrogen atmosphere using a TGA 55 device from TA Instruments (USA). The derivative (DTGA) weight percent per temperature for each graph was used to infer the relative percentage mass of water that was held in the membranes and the oxygen content in the membrane material (see Figure S1 in Supplementary Material for results).
The differential scanning calorimetry (DSC) of the membranes was conducted at a temperature range of 50–400 °C with a heating rate of 10 °C/min using a Q200 DSC from TA Instruments (USA). For this purpose, small membrane samples were crumpled up and compressed into platinum pans and pressed tightly shut with a complimentary lid (see Figure S2 in Supplementary Material for results).
2.6. Membrane Performance Testing
A Sterlitech HP4750X dead-end stirred cell (USA) which was pressurized under nitrogen gas was utilized for the filtration tests. The membranes were initially tested to determine their relative flux using DW at a set pressure (typically 1 bar). The permeate flux (J) was determined using Equation (3):
where Q is the total permeate volume collected in time (T). A represents the effective cross-sectional area of the membrane in the filtration cell in m2.
2.6.1. Antifouling Tests with BSA (Bovine Serum Albumin) Solutions
The membrane resistance to organic fouling was evaluated during filtration of 0.1 wt. % BSA solutions. The pure water flux before (J0) and after BSA filtration (Jf) were calculated. The normalized flux is simply the Jf/J0 ratio, which is indicative of the water flux recovery. The total fouling rate (Rt) and reversible (Rr) and irreversible (Rir) fouling rates were also calculated from the normalized flux data using Equations (4)–(6). The flux recovery ratio (FRR) was calculated using Equation (7).
where Jw1 is the initial flux with DW, JBSA is the flux for BSA solution and Jw2 is the recovered DW flux after BSA filtration. BSA rejection (R) was calculated using Equation (8). A Shimadzu spectrophotometer (Japan) at 258 nm was used to measure the optical density (OD) of the permeate and feed solutions.
where Cp and Cf are the concentration of BSA in the permeate and in the feed solution, respectively.
2.6.2. Antibiofouling Properties of the Developed Membranes
The antibiofouling properties of the developed membranes were studied with model suspensions both Gram-positive and Gram-negative bacteria (E. coli and Bacillus subtilis (B. subtilis) suspensions, respectively). Colonies for each species were grown on Luria-Bertani (LB) agar with overnight incubation at 37 °C. Single colonies were then selected and cultured in LB broth overnight shaking at 37 °C and 200 rpm. The next day, serial dilutions were prepared in order to obtain bacterial suspensions with 0.025 optical density (OD) at a wavelength of 600 nm. Membrane samples were placed in the bacterial suspensions for 10 min before being transferred onto agar plates for overnight incubation at 37 °C. The next day, the membranes were fixed with 4% paraformaldehyde before being washed with phosphate buffer solution. Next, the membranes were subjected to sputtering with gold before being viewed under the SEM.
Another set of experiments tested the biofouling resistance of our membranes after contact with bacterial suspensions over a duration of one, three and seven days. To that end, membranes were incubated with E. coli suspension (0.025 OD) for different time periods as stated above before the flux was measured. These experiments were repeated with TSE in place of bacterial suspension. The obtained TSE ranged in pH from 6.7 to 7.3 and had a biochemical oxygen demand of 1.6 mg/L. The measured chemical oxygen demand was 10 mg O2/L, whilst the total organic carbon was 1.5 mg/L.
In an alternative experiment, the membranes were tested for their biofouling resistance upon having E. coli suspension (0.025 OD) pipetted on the active surface of the membranes and left incubated overnight at 37 °C. The next day, the membranes’ normalized flux was determined. For comparison, two commercial membranes, namely PM UP150 (Microdyn-Nadir, Germany) and UE50 PES membrane (TriSep, USA) were used.
2.6.3. Membrane Performance during Filtration of Real TSE
The fabricated membranes were subjected to a period of prolonged filtration of real TSE using the dead-end cell. For comparison purposes, two commercial PES membranes, namely, PM UP150 and UE50 membranes were also included in the same experimental setup.
To evaluate the bacterial content in the membrane permeate, the permeate samples after TSE filtration were passed through a 0.22 µm cellulose filter disc (Whatman®). Each disc was incubated overnight in either LB agar (for total bacterial count) at 37 °C, or endo agar (selective media for total coliform bacteria) or m-Fc agar with 1% Rosolic acid (selective media for fecal coliforms in water).
3. Results and Discussion
3.1. Material Characterization
The FESEM and EDX data indicate stark differences between the synthesized GO and the graphite flakes that were used as a starting material. As can be seen from the panel of images in Figure 1, clear morphological differences are evident between the graphite flakes and the GO structures. The sharp edges that are seen in the graphite (Figure 1a) are replaced by more rounded edges as seen in Figure 1b, which is possibly due to the concentrated acid treatment. The EDX data shows the increase of oxygen in the GO material (approximately by 31%) where graphite was oxidized in the synthesis process (see Figure 1c,d).
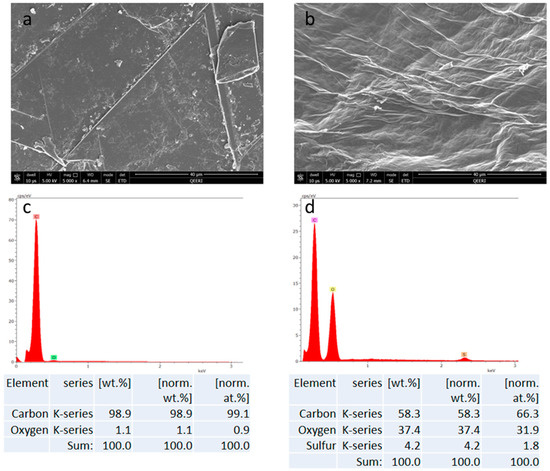
Figure 1.
SEM (scanning electron microscopy) images for graphite flakes (a), GO flakes (b), EDX (energy-dispersive X-ray spectroscopy) mapping for graphite and GO (c,d), respectively.
The characteristic GO flakes can easily be seen in the TEM images (Figure 2), which is further indication of the successful synthesis of high-grade GO. Verifying the presence of such GO flakes was important since it has been suggested that the GO sheets play a central role in its efficacy as an antimicrobial agent [40]. It has been hypothesized that larger GO flakes or sheets exhibit more superior antimicrobial activity compared to smaller flakes due to the increased surface area which can be used to cause entire warping of bacterial cells, thereby blocking their active sites and ultimately hindering their proliferation [41].
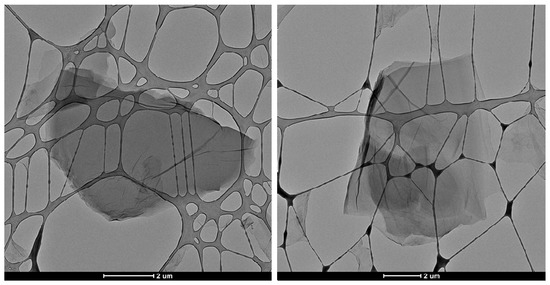
Figure 2.
TEM (transmission electron microscopy) images for synthesized GO flakes. The grid matrix seen is part of the support structure holding the GO sample.
The TGA (and DTGA) thermograms for GO samples are shown in Figure 3. As can be seen by the DTGA for GO, the adsorbed water content is close to 10% of the total weight of the sample (area 1). The oxygen containing functional groups account for an impressive 38% of the total weight (area 2), indicating an oxygen-rich GO sample. The remaining weight of the sample nearing 40% accounts for the non-combusted material or ash (area 3). The TGA thermograms overlay for both graphite and GO seen in (b) clearly demonstrates the oxidation of graphite, with the introduction of adsorbed water molecules and oxygen containing groups indirectly inferred through the less stable curve for GO compared to the stable graphite TGA readings. A staggered decomposition of the GO can be observed where an initial weight loss is observed just below 100 °C which accounts for the loss of water molecules adsorbed by the GO sheets. A further graduated weight loss continues until 400 °C which is accounted for by the formation and subsequent loss of carbon dioxide. Eigler et al. [42] found that at 130 °C, the CO2 is released as it is freed from the GO flakes. Importantly, the TGA curve for GO did not change drastically below 100 °C, which highlights the stability of GO at a vast range of membrane application processes.
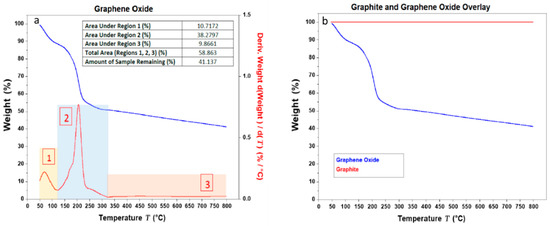
Figure 3.
(a) TGA (Thermogravimetric analysis) (in blue) and DTGA (derivative) (in red) thermograms for GO. The area under the different segments (area 1, area 2 and area 3) of the graph and the total area under the graph are indicated as % in the table (see inset of image (a). (b) Shows an overlay of the TGA results for graphite and GO.
3.2. Membrane Characterization
In agreement with previous studies [39,43], no essential change in surface morphology of the membrane was evident upon the addition of AG in the casting solutions (see Figure 4). The same can be said for the addition of GO, where the surface morphology remained unchanged when compared to the neat membrane (M1). Interestingly, an increase in surface porosity can be seen upon the incorporation of AG and GO (see M5 and M8 in Figure 4) compared to the neat membrane (M1). Importantly, no defects were observed upon surveying the surface structures of all the fabricated membranes.
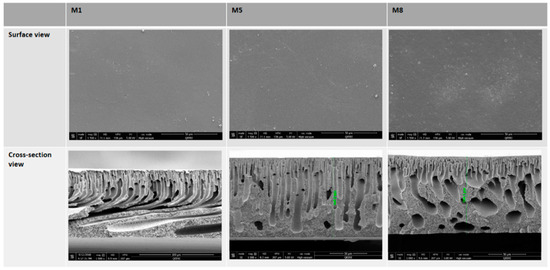
Figure 4.
FESEM images of the membrane surfaces and cross-section view of fractured membranes M1, M5 and M8.
The SEM cross-section images in Figure 4 reveal the typical asymmetrical structures that are expected as a result of the instantaneous demixing between solvent and non-solvent in the phase inversion membrane preparation method. The result of such rapid demixing are the exaggerated large macrovoid structures that are seen in all membranes imaged. The finger-like projections above the macrovoids add to the porosity of the membrane and, therefore, improve the membrane flux [44].
The introduction of hydrophilic GO to the dope solution leads to its thermodynamic instability, with a faster mixing rate between solvent and non-solvent in the coagulation bath during membrane casting [33] that appears to make obvious the asymmetric cross-sectional structure of the membrane. Specifically, a dense skin layer at the top complemented by a thick porous layer with protruding finger-like structures extending downwards within a sponge like matrix. In agreement with other studies, the increase in GO content within membranes causes an increase in the number of pores, whilst a reduction in wall thickness is observed [45]. This allows for increased water permeation. Interlocking channels are also seen in the SEM images for membranes with the highest GO loading. These features, along with the vast number of pores, work together to increase water permeability. In line with this notion, Figure 5a shows the results for the average total porosity for each membrane where we see the total porosity increasing as the loading concentration of GO increases. There is a 33% increase in porosity from M1 to M8 samples which have the highest nanofiller loading.
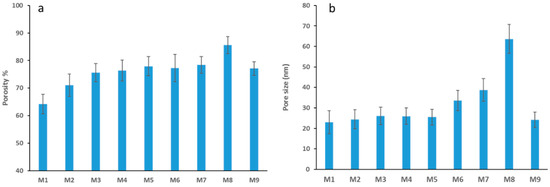
Figure 5.
Average total porosity of PES membranes M1 to M9 (a), Average pore size for PES membranes M1 to M9 (b).
As seen in Figure 5a, a marked increase in membrane porosity is found when AG is introduced into the PES membrane (see porosities for M2 and M1 samples), in accordance with previous studies [39,46]. There is also a clear trend of increased membrane porosity with the GO loading (from M2 to M8). However, when we compare the porosity values for the M2 (0.1 wt.% AG without GO) and M9 (0.3 wt.% GO without AG) samples, it is seen that the M9 sample is more porous. This finding suggests that GO plays a more influential role in terms of pore formation and, hence, total membrane porosity compared to AG.
In a similar trend to total porosity, the average pore size was observed to increase to a maximum at M8 and then decrease at M9 (see Figure 5b). The average pore size increased by 1.8 fold from 25.5 nm for M1 samples (neat membrane) to 66.4 nm for M8 membrane, which was cast at 5 wt. % GO and 1 wt. % AG in the dope solution. This increase in membrane pore size is a characteristic manifestation when nanofillers are incorporated into polymeric membranes. Previous studies have shown that at a certain loading threshold, where the casting solution becomes too viscous, a delayed demixing occurs and membranes with lower porosity and fewer interconnecting channels are formed [47]. Interestingly, this phenomenon is not observed in our membranes. This could be due to the viscosity of the casting solution not reaching the threshold value where viscosity acts to essentially slow down the demixing process (for viscosity of casting solutions see Figure S3). The decrease in both pore size and total porosity for M9 could be explained due to the fact that M9 was cast without the addition of AG and a relatively low loading of GO (0.3 wt. %).
The membrane hydrophilicity and hence, wettability was determined via contact angle measurements using the Young Laplace fitting method (see Figure 6). Figure 6a depicts the results for the average contact angle values determined for the PES/GO and neat PES membrane samples, whilst Figure 6b,c show the shapes of the water drops on different membrane samples. In general, the smaller the contact angle, the more hydrophilic the membrane surface is. The noticeable trend points to a decrease in contact angle as the GO content is increased from 0 wt. % in M1 to 5 wt. % in M8 by 36%. Interestingly, we see a 9% drop in contact angle from M1 to M2 samples and this can be attributed to the introduction of AG. This correlates well with a previous study where the authors noted a drop-in contact angle caused by the charged polysaccharide residues present in AG which act to hydrophilize the membrane surface, thereby causing a decrease in the contact angle [39]. Membranes M3 through to M8 contain both AG and GO and here we see an additive effect where both hydrophilic materials act to decrease the contact angle values. The results for the M9 sample were not as expected, with the M9 sample exhibiting a lower contact angle than the M4 sample which had the same GO loadings as M9, however with the addition of AG. The hydrophilic nature of AG leads to the expectation that the M4 sample would possess a lower contact angle value than its M9 counterpart. These paradoxical results could be due to better distribution of GO at the membrane surface for the M9 sample, which may not be the case in the M4 sample.
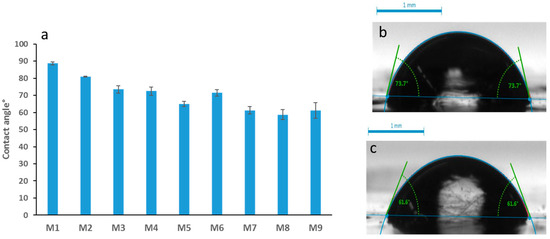
Figure 6.
Average contact angle values for synthesized membranes (a), sample photographs of contact angles for M4 (b) and M7 (c).
The zeta potential data yielded from the pH scans for selected PES/GO membranes is presented in Figure 7. As can be seen, the neat membrane (M1) possesses the smallest negative charge across all pH values. The surface negative charge of membranes with AG alone (M2) and with AG/GO (M3 and M8) is increased, with M8 having the greatest negative charge overall. At pH 7, for instance, the negative zeta potential increases by over 100% for M8 compared to M1 samples. The increase in negative zeta potentials for the PES/GO/AG membranes in comparison to the neat PES membrane can be attributed to the presence of the hydrophilic residues of the AG which contain carboxylic groups as well as the hydrophilic functional groups that are present on the GO flakes [39]. All membranes show an increase in negative charge as the pH increases. This trend is a result of the selective adsorption of the negatively charged chlorine ions on the membrane surface which leads to charge accumulation [48]. The overall negative surface charge of these membranes renders them attractive candidates in tackling fouling and biofouling issues where the fouling agents are often found to be negatively charged [49].
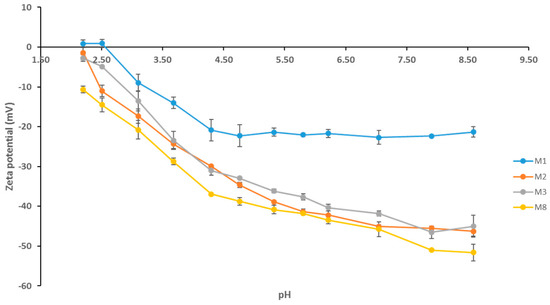
Figure 7.
pH scan of selected PES membranes with resulting zeta potential measurements.
The increase in hydrophilicity and negative surface charge seen thus far in the PES/GO membranes can further be explained in terms of the oxygen containing functional groups that were introduced upon the incorporation of GO into the PES membranes. The presence of such functional groups can be evidenced by means of ATR-FTIR analysis. Figure 8 shows the ATR-FTIR spectra for the neat membrane (M1) and M8 samples, which has the highest loading of GO. A prominent adsorption peak at 3411.94 cm−1, which is assigned to the stretching vibration of the –OH groups of GO is seen in the spectra of the PES/GO membrane. Another peak, though less pronounced, is located at 1713.6 cm−1 and corresponds to the stretching vibration of the carbonyl C=O functional groups of GO. Finally, the adsorption peak seen at 1110.6 cm−1 is attributed to the stretching vibration of the C-O bond [33]. These results, in comparison to the spectra seen for M1 further indicate a robust oxidation of graphite into GO and exposes the rich oxygen-containing functional groups that are present. These groups increase the hydrophilicity of the PES/GO membranes [45].
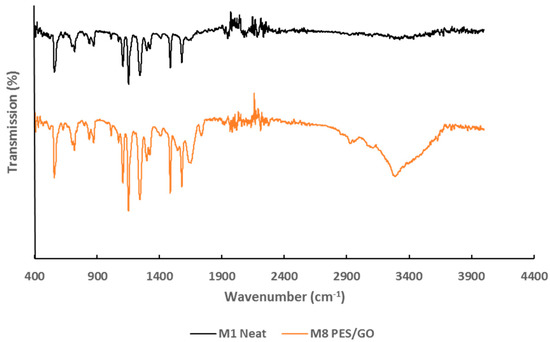
Figure 8.
ATR-FTIR (Attenuated Total Reflectance Fourier Transform Infrared Spectroscopy) spectra for synthesized PES neat and PES/GO (M8) membranes.
The mechanical strength of the synthesized membranes was tested using the DMA (Dynamic mechanical analysis) technique. Figure 9 shows a clear trend of increased stiffness of the membranes as the GO loading increased up to 3 wt. % loading. The stiffness, inferred from the Young’s modulus values, then decreases at the maximum loading concentration of 5 wt. % GO in M8. The higher the modulus, the more stress is needed to get the same amount of strain, rendering the membrane stiffer or less stretchy. The seemingly surprising result seen for M8 can be explained two-fold. Firstly, we can assume that at a higher loading concentration of GO there will be agglomeration of the GO in the matrix and, secondly, the presence of high quantities of GO may impact the integrity of the membrane’s mechanical strength due to increased porosity as a trade-off scenario [50,51].
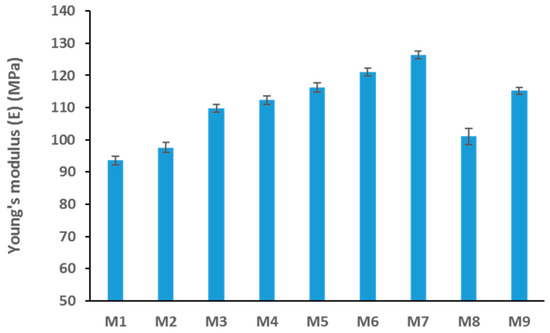
Figure 9.
Average Young’s modulus values for different PES/GO membranes.
3.3. Performance Testing of Synthesized Membranes
The fouling tests that were conducted using BSA solutions were conducted as described above in the methods section. Figure 10a indicates the membranes’ fluxes at different stages of the fouling test. The M7 sample showed a much higher initial DW flux in the order of three folds higher than the neat membrane’s initial flux with DW. This is expected as it is well documented that membranes with higher hydrophilicity, total porosity and average pore size possess higher flux [33]. All membranes show a decline in flux once BSA filtration takes place. Interestingly, the recovery flux (a DW flux after BSA filtration) varied significantly. Importantly, M7 samples showed much higher flux recovery compared to the neat membrane. The normalized flux data that is shown in Figure 10b sheds more light on the varied recovery ability across each membrane sample. For instance, M8 had a normalized flux which was more than double that of M1 (neat PES membrane). The enhanced performance in terms of flux recovery can be attributed to the increased hydrophilicity and surface charge of the PES/GO membranes.
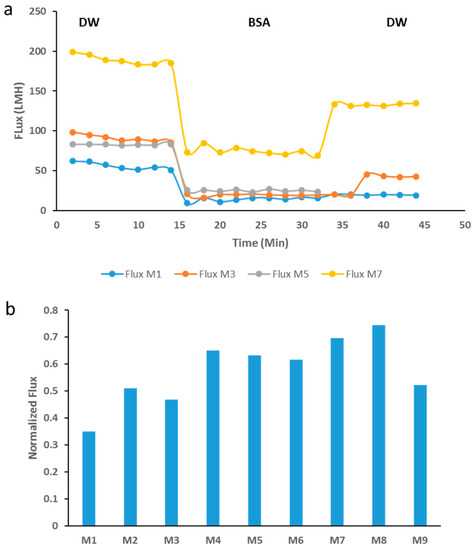
Figure 10.
BSA (bovine serum albumin) fouling test with different membrane samples (a) The DW (deionized water) flux was measured for the first 15 min of filtration, then DW was replaced with BSA solution and the flux was evaluated for the next 15 min, after which time the flux for DW filtration was measured for the last 15 min. (b) Normalized flux for different PES membranes, calculated as the Jf/J0 ratio, after filtration of BSA solution.
As can be seen in Figure 11a, BSA rejection decreases as the loading of GO increases. The observed decrease can be accounted for by the increase in pore size as the GO content increases (see Figure 5). This inverse relationship between pore size and rejection performance has been reported across many studies [39,52,53]. Conversely, the FRR values in Figure 11b show an opposite trend with a general increase in the flux recovery with an increase of GO content in PES/GO membranes. Remarkably, the FRR value more than doubles when M8 is compared with the neat PES membrane (M1) (36 and 75%, respectively). The increase in membrane surface hydrophilization, coupled with the increased negative surface charge of PES/GO membranes would naturally cause an electrostatic repulsion effect against the negatively charged BSA molecules at a neutral pH (the isoelectric point of BSA being between 4.5 and 5.0) [54]. This would result in less BSA adsorption on the membrane surface and in the pores, explaining the decrease in irreversible fouling that is seen in Figure 11c.
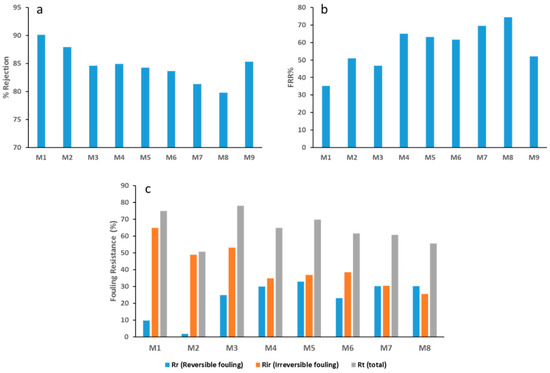
Figure 11.
Rejection and fouling data for PES/GO membranes. (a) BSA rejection values, (b) FRR (flux recovery ratio) % for different membranes and (c) the different types of fouling from the BSA solution filtration tests.
PES neat and PES/GO membranes that were incubated in E. coli suspension or B. subtilis (as a model for Gram-negative and Gram-positive bacteria, respectively) for 24 h at 37 °C on nutrient agar fared very differently in terms of bacterial colonization on the membrane surface (see Figure 12). Impressively, the FESEM images reveal a clearance of E. coli bacterial colonies on all membranes which incorporated GO for both tests. In contrast, neat M1 samples (without GO) did not show the inhibition of bacterial growth, showing a carpet-like appearance of bacterial colonies. Similar results were seen in the tests involving membranes that were incubated with Gram-positive bacteria (B. subtilis) as shown in Figure 12. A clear inhibitory effect is noticeable on all membranes bar the M1 samples which did not contain GO. The apparent inhibition of bacteria on these membranes can be explained in relation to the contact angle and zeta potential data that were obtained. The increased hydrophilicity and negative surface charge that were exhibited by the PES/GO membranes could act in an additive manner to cause repulsive forces against similar charged bacteria. It is well known that almost all bacteria, Gram-positive and Gram-negative alike, carry a net negative charge [55]. Gram-positive bacteria possess negatively charged teichoic acids (due to the abundance of phosphate groups) which are intimately associated with the peptidoglycan cell wall or, in some cases, connected to the inferior cell surface membrane [15]. The overall negative charge conferred by Gram-negative bacterial species can be attributed to their negatively charged outer covering composed mainly of phospholipids and lipopolysaccharides [56].
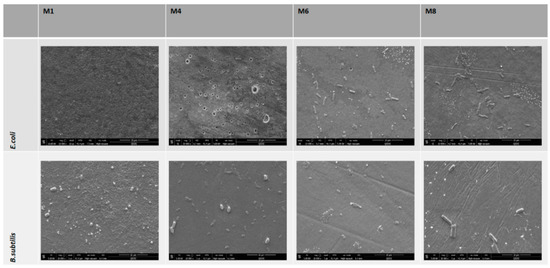
Figure 12.
FESEM images of PES/GO membrane surfaces after incubation with E. coli suspension (top panel) and incubation with B. subtilis suspension (bottom panel).
It is reasonable to assume that neat PES membranes, being inherently hydrophobic, turn water molecules away from their surface due to the absence of hydrogen bonds at the boundary layer [57]. The vacant surface allows for the settlement of bacteria and other fouling agents. Conversely, hydrophilic membrane surfaces such as PES/GO surfaces attract water molecules, rapidly forming a hydration layer which prevents the subsequent colonization of bacteria at its surface [58].
The addition of AG to PES membranes might also contribute to the enhancement of the membrane’s antibacterial properties [46]. The exact mechanisms behind AG’s antibacterial properties are as of yet unknown. Whilst some studies suggest the presence of antimicrobial enzymes such as oxidases, peroxidases and pectinases [59], other studies have hypothesized that the high salt content, particularly the divalent cations found in AG, was responsible for the antibacterial action [60].
Next, the antibiofouling properties of the fabricated membranes alongside the two commercial membranes were tested. As described in the methods section, the membranes were subjected to E. coli suspension being pipetted on the active surface of the membranes and left incubated overnight at 37 °C. Figure 13a displays the DW flux before incubation (first 20 min) and the DW flux for two filtration cycles of 20 min after the 24 h incubation with bacterial suspension. While all membranes exhibit a drop-in flux after bacterial incubation, M8 samples showed the highest flux recovery as seen in Figure 13b. The normalized flux for M8 not only outperformed the neat PES membrane, however also the commercial Nadir and TriSep membranes (2.5 fold and 3-fold increase, respectively).
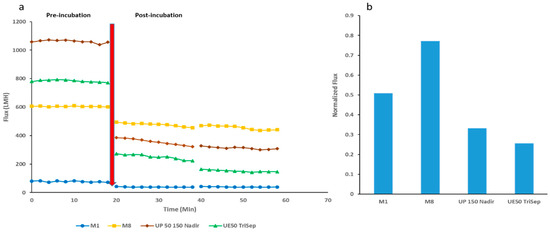
Figure 13.
Change in flux over time before and after overnight incubation (denoted as the red arrow) of different PES/GO membranes with E. coli suspension (a) and normalized flux data for each membrane (b).
When comparing the flux performance during filtration of E. coli bacterial suspensions over extended time periods, M8 membrane showed only a small decline in flux over the entire duration of the filtration test (see Figure 14a). Conversely, both M1 and the commercial TriSep membranes showed a decline in flux, especially in the latter half of the filtration period. The difference is highlighted in the normalized flux graph that is seen in Figure 14b where M8 samples had a normalized flux that is more than double that of M1 and with a 31% increase compared to its commercial counterpart. In a parallel experiment with the same set up where the bacterial suspension was replaced with real locally obtained TSE, similar results were obtained where M8 samples fared better than the other two membranes (see Figure S4). Interestingly, the normalized flux for M8 was over two folds greater than the commercial membrane’s normalized flux (see Figure S4).
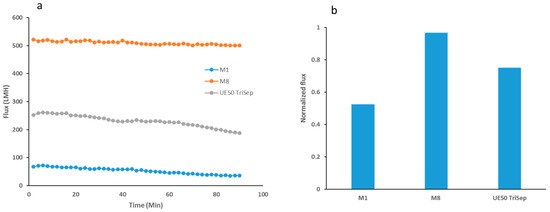
Figure 14.
Graph showing flux readings for the filtration of bacterial suspensions for selected fabricated membranes and the UF (ultrafiltration) commercial membrane (a) and the normalized flux for each of the three membranes calculated as the final reading at the end of filtration over the initial reading at the beginning of the filtration test (b).
The antibiofouling properties of the PES membranes were further tested alongside the UP 150 (Nadir) membrane after incubation in E. coli suspension at different incubation times (see Figure 15). Despite the commercial membrane having superior initial flux readings (more than double the flux of M8 samples), it experiences the most severe biofouling, as seen in the sharp decline in flux with incubation time. Interestingly, the sharpest drop in flux was in Day 1 incubation where the membrane’s flux plummeted by 68%. Contrarily PES/GO membranes (M8) maintained an almost constant flux when comparing initial flux to final flux at Day 7 of the test period. The same experiment was set up where locally obtained real TSE was used in place of the bacterial suspensions. Once again, the results showed a similar trend where M8 outperformed both the neat membrane and the commercial Nadir membrane (see Figure S5).
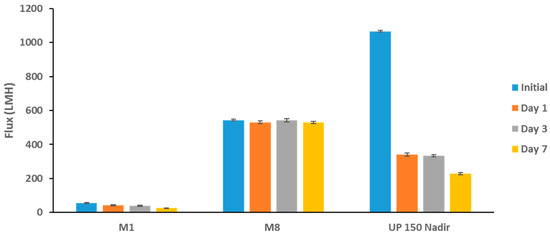
Figure 15.
Membrane fluxes before and during incubation with E. coli suspension at different time points.
The results seen in Figure 13 showing the higher flux recovery for M8 samples and the robust biofouling resistance that the membrane displayed in Figure 14, Figure 15, Figures S4 and S5 can be explained as discussed above, owing to the more hydrophilic nature and stronger negative charge of the M8 membrane surface.
It is well known that activated sludge and other sewage treatment methods employ the use of microbial cells for the biodegradation of compounds that are found in the wastewater [61]. The results for testing the bacterial content in feed TSE water and the permeates that are collected from filtering TSE using M8 and the commercial TriSep UF membranes are shown in Figure 16. As can be seen from the panel, none of the cellulose discs showed any bacterial growth for all three bacterial tests (Total Bacterial Count, Total coliform bacteria and fecal coliforms) from the permeate of both M8 PES/GO membrane and the commercial membrane, indicating that the permeates were bacteria-free. The TSE feed, however, produced an abundance of bacterial growth for all three bacterial tests.
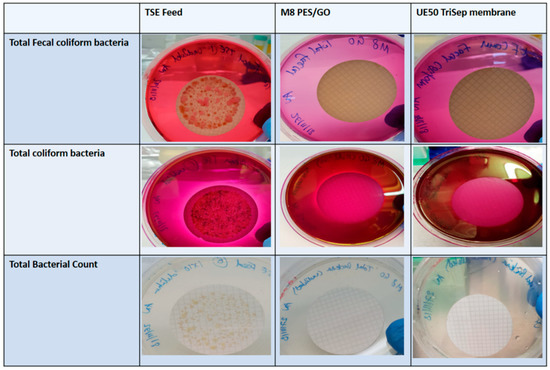
Figure 16.
Photo of images of agar plates containing cellulose discs after filtration of TSE (treated sewage effluent) Feed and TSE permeate of M8 PES/GO membrane and commercial TriSep membrane.
4. Conclusions
Novel PES membranes incorporated with the synthesized GO with a high content of oxygen containing groups were fabricated using the phase inversion method, and their properties and performance were compared against neat PES or commercial UF membranes. The data obtained showed that the prepared membranes possessed strong hydrophilicity and negative surface charge, with an increase in porosity and pore size. Importantly, PES/GO membranes exhibited remarkable improvement in water flux with over 3-fold increases for M7 and M8 samples compared to the neat PES membrane.
The PES/GO membranes indicated better resistance to organic fouling compared to the neat PES membranes, as modelled by filtration of BSA solutions, with a marked decrease in irreversible fouling seen across all PES/GO membranes. The PES/GO membranes exhibited superior inhibition of bacterial growth on the membrane surface for both Gram-positive and Gram-negative bacterial species. The composite membranes displayed more robust and stronger biofouling resistance as shown by the increase in FRR values and the higher normalized flux after filtration with both TSE and bacterial suspension. The enhanced performance can be attributed to the increase in negative surface charge, along with the increased hydrophilicity of the prepared PES/GO membranes.
Finally, the prepared PES/GO membranes were successful in abolishing the presence of any bacterial forms in the permeate that was collected from TSE filtration using the PES/GO membranes. Overall, these findings point to the synergistic action of both AG and GO additives in improving the performance and biofouling resistance of UF membranes through their anti-adhesive properties as a result of their increased negative surface charge and hydrophilicity.
Supplementary Materials
The following are available online at http://www.mdpi.com/2076-3417/9/3/513/s1; Figure S1. TGA and DTGA thermograms for M1 neat PES (a), M8 PES/GO (b) and TGA thermograms overlay for selected PES/GO and neat membranes. Figure S2. DSC curve overlay for selected PES/GO and neat membranes. Figure S3. Viscosity as a function of shear rate plotted for selected casting solutions for neat PES and selected PES/GO membranes. Figure S4. Graph showing flux readings for filtration of real TSE for selected fabricated membranes and the UF commercial membrane (a) and the normalized flux for each of the three membranes calculated as the final reading at the end of the filtration over the initial reading at the beginning of the filtration test. Figure S5. Membrane fluxes before and during incubation with real TSE at different time points.
Author Contributions
Conceptualization, V.K. and M.A.A.; Data curation, A.N., R.A.G. and S.S.; Formal analysis, A.N.; Methodology, A.N., R.A.G. and S.S.; Supervision, V.K. and M.A.A.; Writing—original draft, A.N.; Writing—review & editing, V.K.
Funding
This research received no external funding.
Acknowledgments
The authors would like to acknowledge the kind support given by Qatar Environment and Energy Institute (QEERI), in particular the following members of the Core laboratories: Omar Al Hassan, Mujaheed Pasha, Atef Zekri and Said Mansour. The publication of this article was funded by the Qatar National Library.
Conflicts of Interest
The authors declare no conflict of interest.
References
- Howell, J.; Arnot, T.; Liu, W. Membrane bioreactors for treating waste streams. Ann. N. Y. Acad. Sci. 2003, 984, 411–419. [Google Scholar] [CrossRef] [PubMed]
- Kimura, K.; Hara, H.; Watanabe, Y. Removal of pharmaceutical compounds by submerged membrane bioreactors (MBRs). Desalination 2005, 178, 135–140. [Google Scholar] [CrossRef]
- Kim, I.; Choi, J.; Tak, T. Sulfonated polyethersulfone by heterogeneous method and its membrane performances. J. Appl. Polym. Sci. 1999, 74, 2046–2055. [Google Scholar] [CrossRef]
- Nguyen, T.; Roddick, F.A.; Fan, L. Biofouling of water treatment membranes: A review of the underlying causes, monitoring techniques and control measures. Membranes 2012, 2, 804–840. [Google Scholar] [CrossRef] [PubMed]
- Kochkodan, V.; Hilal, N. A comprehensive review on surface modified polymer membranes for biofouling mitigation. Desalination 2015, 356, 187–207. [Google Scholar] [CrossRef]
- Wingender, J.; Neu, T.R.; Flemming, H.-C. What are bacterial extracellular polymeric substances? In Microbial Extracellular Polymeric Substances; Springer: Berlin, Gremany, 1999; pp. 1–19. [Google Scholar]
- Ridgway, H.; Safarik, J. Biofouling of reverse osmosis membranes. In Biofouling and Biocorrosion in Industrial Water Systems; Springer: Berlin, Gremany, 1991; pp. 81–111. [Google Scholar]
- Matin, A.; Khan, Z.; Zaidi, S.; Boyce, M. Biofouling in reverse osmosis membranes for seawater desalination: Phenomena and prevention. Desalination 2011, 281, 1–16. [Google Scholar] [CrossRef]
- Saad, M.A. Biofouling prevention in RO polymeric membrane systems. Desalination 1992, 88, 85–105. [Google Scholar] [CrossRef]
- Zondervan, E.; Roffel, B. Evaluation of different cleaning agents used for cleaning ultra filtration membranes fouled by surface water. J. Membr. Sci. 2007, 304, 40–49. [Google Scholar] [CrossRef]
- Yang, Y.-F.; Hu, H.-Q.; Li, Y.; Wan, L.-S.; Xu, Z.-K. Membrane surface with antibacterial property by grafting polycation. J. Membr. Sci. 2011, 376, 132–141. [Google Scholar] [CrossRef]
- Flemming, H.-C.; Schaule, G.; Griebe, T.; Schmitt, J.; Tamachkiarowa, A. Biofouling—The Achilles heel of membrane processes. Desalination 1997, 113, 215–225. [Google Scholar] [CrossRef]
- Wilbert, M.C. Enhancement of Membrane Fouling Resistance through Surface Modification; US Department of the Interior, Bureau of Reclamation: Washington, DC, USA, 1997.
- Murphy, A.P.; Moody, C.D.; Riley, R.L.; Lin, S.W.; Murugaverl, B.; Rusin, P. Microbiological damage of cellulose acetate RO membranes. J. Membr. Sci. 2001, 193, 111–121. [Google Scholar] [CrossRef]
- Flemming, H.-C.; Wingender, J. The biofilm matrix. Nat. Rev. Microbiol. 2010, 8, 623–633. [Google Scholar] [CrossRef]
- Morse, G.; Brett, S.; Guy, J.; Lester, J. Phosphorus removal and recovery technologies. Sci. Total Environ. 1998, 212, 69–81. [Google Scholar] [CrossRef]
- Fytianos, K.; Voudrias, E.; Raikos, N. Modelling of phosphorus removal from aqueous and wastewater samples using ferric iron. Environ. Pollut. 1998, 101, 123–130. [Google Scholar] [CrossRef]
- Ponnusamy, K.; Paul, D.; Kim, Y.S.; Kweon, J.H. 2 (5H)-Furanone: A prospective strategy for biofouling-control in membrane biofilm bacteria by quorum sensing inhibition. Braz. J. Microbiol. 2010, 41, 227–234. [Google Scholar] [CrossRef]
- Richards, J.J.; Melander, C. Controlling bacterial biofilms. ChemBioChem 2009, 10, 2287–2294. [Google Scholar] [CrossRef] [PubMed]
- Kim, S.; Lee, S.; Hong, S.; Oh, Y.; Kweon, J.; Kim, T. Biofouling of reverse osmosis membranes: Microbial quorum sensing and fouling propensity. Desalination 2009, 247, 303–315. [Google Scholar] [CrossRef]
- Khayet, M.; Villaluenga, J.; Valentin, J.; López-Manchado, M.; Mengual, J.; Seoane, B. Filled poly (2,6-dimethyl-1,4-phenylene oxide) dense membranes by silica and silane modified silica nanoparticles: Characterization and application in pervaporation. Polymer 2005, 46, 9881–9891. [Google Scholar] [CrossRef]
- Bae, T.-H.; Tak, T.-M. Effect of TiO2 nanoparticles on fouling mitigation of ultrafiltration membranes for activated sludge filtration. J. Membr. Sci. 2005, 249, 1–8. [Google Scholar] [CrossRef]
- Bottino, A.; Capannelli, G.; Comite, A. Preparation and characterization of novel porous PVDF-ZrO2 composite membranes. Desalination 2002, 146, 35–40. [Google Scholar] [CrossRef]
- Yan, L.; Li, Y.S.; Xiang, C.B. Preparation of poly (vinylidene fluoride)(pvdf) ultrafiltration membrane modified by nano-sized alumina (Al2O3) and its antifouling research. Polymer 2005, 46, 7701–7706. [Google Scholar] [CrossRef]
- Desai, N.P.; Hossainy, S.F.; Hubbell, J.A. Surface-immobilized polyethylene oxide for bacterial repellence. Biomaterials 1992, 13, 417–420. [Google Scholar] [CrossRef]
- Liu, C.; Zhang, D.; He, Y.; Zhao, X.; Bai, R. Modification of membrane surface for anti-biofouling performance: Effect of anti-adhesion and anti-bacteria approaches. J. Membr. Sci. 2010, 346, 121–130. [Google Scholar] [CrossRef]
- Dror-Ehre, A.; Mamane, H.; Belenkova, T.; Markovich, G.; Adin, A. Silver nanoparticle–E. coli colloidal interaction in water and effect on E. coli survival. J. Colloid Interface Sci. 2009, 339, 521–526. [Google Scholar] [CrossRef] [PubMed]
- Borkow, G.; Gabbay, J. Copper as a biocidal tool. Curr. Med. Chem. 2005, 12, 2163–2175. [Google Scholar] [CrossRef] [PubMed]
- Chae, S.-R.; Wang, S.; Hendren, Z.D.; Wiesner, M.R.; Watanabe, Y.; Gunsch, C.K. Effects of fullerene nanoparticles on Escherichia coli K12 respiratory activity in aqueous suspension and potential use for membrane biofouling control. J. Membr. Sci. 2009, 329, 68–74. [Google Scholar] [CrossRef]
- Vecitis, C.D.; Schnoor, M.A.A.; Rahaman, M.S.; Schiffman, J.D.; Elimelech, M. Electrochemical multiwalled carbon nanotube filter for viral and bacterial removal and inactivation. Environ. Sci. Technol. 2011, 45, 3672–3679. [Google Scholar] [CrossRef]
- Kim, E.-S.; Hwang, G.; El-Din, M.G.; Liu, Y. Development of nanosilver and multi-walled carbon nanotubes thin-film nanocomposite membrane for enhanced water treatment. J. Membr. Sci. 2012, 394, 37–48. [Google Scholar] [CrossRef]
- Kang, S.; Herzberg, M.; Rodrigues, D.F.; Elimelech, M. Antibacterial effects of carbon nanotubes: Size does matter! Langmuir 2008, 24, 6409–6413. [Google Scholar] [CrossRef]
- Rezaee, R.; Nasseri, S.; Mahvi, A.H.; Nabizadeh, R.; Mousavi, S.A.; Rashidi, A.; Jafari, A.; Nazmara, S. Fabrication and characterization of a polysulfone-graphene oxide nanocomposite membrane for arsenate rejection from water. J. Environ. Health Sci. Eng. 2015, 13, 61. [Google Scholar] [CrossRef]
- Some, S.; Kim, Y.; Yoon, Y.; Yoo, H.; Lee, S.; Park, Y.; Lee, H. High-quality reduced graphene oxide by a dual-function chemical reduction and healing process. Sci. Rep. 2013, 3, 1929. [Google Scholar] [CrossRef]
- Sanchez, V.C.; Jachak, A.; Hurt, R.H.; Kane, A.B. Biological interactions of graphene-family nanomaterials: An interdisciplinary review. Chem. Res. Toxicol. 2011, 25, 15–34. [Google Scholar] [CrossRef] [PubMed]
- Ahmed, F.; Rodrigues, D.F. Investigation of acute effects of graphene oxide on wastewater microbial community: A case study. J. Hazard. Mater. 2013, 256, 33–39. [Google Scholar] [CrossRef] [PubMed]
- Nam, J.A.; Nahain, A.-A.; Kim, S.M.; In, I.; Park, S.Y. Successful stabilization of functionalized hybrid graphene for high-performance antimicrobial activity. Acta Biomater. 2013, 9, 7996–8003. [Google Scholar] [CrossRef] [PubMed]
- Li, J.F.; Xu, Z.L.; Yang, H. Microporous polyethersulfone membranes prepared under the combined precipitation conditions with non-solvent additives. Polym. Adv. Technol. 2008, 19, 251–257. [Google Scholar] [CrossRef]
- Manawi, Y.; Kochkodan, V.; Mohammad, A.; Atieh, M.A. Arabic gum as a novel pore-forming and hydrophilic agent in polysulfone membranes. J. Membr. Sci. 2017, 529, 95–104. [Google Scholar] [CrossRef]
- Upadhyay, R.K.; Soin, N.; Roy, S.S. Role of graphene/metal oxide composites as photocatalysts, adsorbents and disinfectants in water treatment: A review. RSC Adv. 2014, 4, 3823–3851. [Google Scholar] [CrossRef]
- Liu, S.; Hu, M.; Zeng, T.H.; Wu, R.; Jiang, R.; Wei, J.; Wang, L.; Kong, J.; Chen, Y. Lateral dimension-dependent antibacterial activity of graphene oxide sheets. Langmuir 2012, 28, 12364–12372. [Google Scholar] [CrossRef] [PubMed]
- Eigler, S.; Dotzer, C.; Hirsch, A.; Enzelberger, M.; Müller, P. Formation and decomposition of CO2 intercalated graphene oxide. Chem. Mater. 2012, 24, 1276–1282. [Google Scholar] [CrossRef]
- Zhao, C.; Xue, J.; Ran, F.; Sun, S. Modification of polyethersulfone membranes—A review of methods. Prog. Mater. Sci. 2013, 58, 76–150. [Google Scholar] [CrossRef]
- Wienk, I.; Boom, R.; Beerlage, M.; Bulte, A.; Smolders, C.; Strathmann, H. Recent advances in the formation of phase inversion membranes made from amorphous or semi-crystalline polymers. J. Membr. Sci. 1996, 113, 361–371. [Google Scholar] [CrossRef]
- Wang, Z.; Yu, H.; Xia, J.; Zhang, F.; Li, F.; Xia, Y.; Li, Y. Novel GO-blended PVDF ultrafiltration membranes. Desalination 2012, 299, 50–54. [Google Scholar] [CrossRef]
- Manawi, Y.; Kochkodan, V.; Mahmoudi, E.; Johnson, D.J.; Mohammad, A.W.; Atieh, M.A. Characterization and Separation Performance of a Novel Polyethersulfone Membrane Blended with Acacia Gum. Sci. Rep. 2017, 7, 15831. [Google Scholar] [CrossRef] [PubMed]
- Van de Witte, P.; Dijkstra, P.J.; Van den Berg, J.; Feijen, J. Phase separation processes in polymer solutions in relation to membrane formation. J. Membr. Sci. 1996, 117, 1–31. [Google Scholar] [CrossRef]
- Ariza, M.; Benavente, J. Streaming potential along the surface of polysulfone membranes: A comparative study between two different experimental systems and determination of electrokinetic and adsorption parameters. J. Membr. Sci. 2001, 190, 119–132. [Google Scholar] [CrossRef]
- Flemming, H.-C.; Schaule, G. Biofouling on membranes-a microbiological approach. Desalination 1988, 70, 95–119. [Google Scholar] [CrossRef]
- Ma, Y.; Shi, F.; Wang, Z.; Wu, M.; Ma, J.; Gao, C. Preparation and characterization of PSf/clay nanocomposite membranes with PEG 400 as a pore forming additive. Desalination 2012, 286, 131–137. [Google Scholar] [CrossRef]
- Han, R.; Zhang, S.; Jian, X. Effect of additives on the performance and morphology of copoly (phthalazinone ether sulfone) UF membrane. Desalination 2012, 290, 67–73. [Google Scholar] [CrossRef]
- Duan, L.; Huang, W.; Zhang, Y. High-flux, antibacterial ultrafiltration membranes by facile blending with N-halamine grafted halloysite nanotubes. RSC Adv. 2015, 5, 6666–6674. [Google Scholar] [CrossRef]
- Sotto, A.; Boromand, A.; Zhang, R.; Luis, P.; Arsuaga, J.M.; Kim, J.; Van der Bruggen, B. Effect of nanoparticle aggregation at low concentrations of TiO2 on the hydrophilicity, morphology, and fouling resistance of PES–TiO2 membranes. J. Colloid Interface Sci. 2011, 363, 540–550. [Google Scholar] [CrossRef]
- Phan, H.T.; Bartelt-Hunt, S.; Rodenhausen, K.B.; Schubert, M.; Bartz, J.C. Investigation of bovine serum albumin (BSA) attachment onto self-assembled monolayers (SAMs) using combinatorial quartz crystal microbalance with dissipation (QCM-D) and spectroscopic ellipsometry (SE). PLoS ONE 2015, 10, e0141282. [Google Scholar] [CrossRef]
- Ridgway, H.F.; Rigby, M.G.; Argo, D.G. Bacterial adhesion and fouling of reverse osmosis membranes. J.-Am. Water Works Assoc. 1985, 77, 97–106. [Google Scholar] [CrossRef]
- Blenkinsopp, S.; Costerton, J. Understanding bacterial biofilms. Trends Biotechnol. 1991, 9, 138–143. [Google Scholar] [CrossRef]
- Kang, G.-D.; Cao, Y.-M. Development of antifouling reverse osmosis membranes for water treatment: A review. Water Res. 2012, 46, 584–600. [Google Scholar] [CrossRef] [PubMed]
- Venault, A.; Liu, Y.-H.; Wu, J.-R.; Yang, H.-S.; Chang, Y.; Lai, J.-Y.; Aimar, P. Low-biofouling membranes prepared by liquid-induced phase separation of the PVDF/polystyrene-b-poly (ethylene glycol) methacrylate blend. J. Membr. Sci. 2014, 450, 340–350. [Google Scholar] [CrossRef]
- Kirtikar, K.R.; Basu, B.D. Indian Medicinal Plants; CAB: Allahabad, India, 1918. [Google Scholar]
- Montenegro, M.A.; Boiero, M.L.; Valle, L.; Borsarelli, C.D. Gum Arabic: More than an edible emulsifier. In Products and Applications of Biopolymers; InTech: London, UK, 2012. [Google Scholar]
- Zhao, G.; Chen, W.N. Biofouling formation and structure on original and modified PVDF membranes: Role of microbial species and membrane properties. RSC Adv. 2017, 7, 37990–38000. [Google Scholar] [CrossRef]
© 2019 by the authors. Licensee MDPI, Basel, Switzerland. This article is an open access article distributed under the terms and conditions of the Creative Commons Attribution (CC BY) license (http://creativecommons.org/licenses/by/4.0/).