Article

Simulation of Coal Gasification in a Low-Temperature, High-Pressure Entrained-Bed Reactor with a Volatiles Condensation and Re-Evaporation Model †

1
Mechanical and System Engineering Program, Institute of Nuclear Energy Research, Atomic Energy Council, Longtan, Taoyuan 32546, Taiwan
2
Chemistry Division, Institute of Nuclear Energy Research, Atomic Energy Council, Longtan, Taoyuan 32546, Taiwan
3
Energy Conversion & Conservation Center, University of New Orleans, New Orleans, LA 70148, USA
*
Author to whom correspondence should be addressed.
This work is an extended version of paper published in the International Pittsburgh Coal Conference (PCC), Beijing, China, 15–18 September 2013.
Appl. Sci. 2019, 9(3), 510; https://doi.org/10.3390/app9030510
Submission received: 30 November 2018 / Revised: 22 January 2019 / Accepted: 28 January 2019 / Published: 1 February 2019
(This article belongs to the Special Issue Clean Coal Combustion)

Abstract

:

Featured Application

A tar condensation and re-vaporization sub-model is successfully developed and implemented in a CFD model for high-pressure, low-temperature gasification process. Feeding high pressure and less oxygen feedstock produces syngas with increased syngas heating values and a higher H2/CO ratio, which is favorable for synthetic natural gas production.

Abstract

The objective of this study is to implement a tar condensation and re-vaporization sub-model in a previously established Computational Fluid Dynamics (CFD) model for the Entrained Slagging Transport Reactor (E-STR) gasifier, modified from the existing E-Gasifier simulation models in previous studies. The major modifications in E-STR, compared to the existing E-GasTM design, include higher operating pressure and lower temperature, with the aim of achieving a higher H2/CO ratio of syngas, which is more favorable for synthetic natural gas (SNG) production. In this study, the aforementioned sub-model is described by the UDF (User-Defined Function) and incorporated in a previously developed computational model for entrained-flow gasification process, to study the syngas composition without implementing a tars-cracking catalyst in the E-STR gasifier. The results show that incorporating the tar condensation model leads to a formation of approximately 6.47% liquid volatiles and an exit temperature increase about 135 K, due to the release of latent heat. These sub-models have been successfully implemented and will be useful in the condition that the gasifier temperature is intentionally kept low, just as the E-STR gasifier. The results indicate that high pressure and less oxygen feed produce a higher H2/CO ratio, more favorable for SNG production.

1. Introduction

Since industrial revolution, the massive utilization of fossil fuel has led to a significant increase of carbon dioxide in atmosphere and expedited climate change. Therefore, controlling and suppressing the emission of greenhouse gas are crucial issues for the development of a sustainable environment. Coal is still the most abundant source in traditional fossil fuels, and it is expected to be utilized for more than 110 years [1]. Due to its low cost and stable supply, the USA and other industrial countries have proposed the concept of Clean Coal Technology (CCT). Coal gasification is an important means of CCT that can not only convert clean energy from conventional coal resources, but also produce various fuels and chemicals. Popular coal-derived fuels include gaseous fuels such as CO, H2, synthetic (or substitute) natural gas (SNG), etc., and liquid fuels such as diesel, jet fuels, and methanol. The coal-derived chemicals, in turn, are as broad as petroleum-derived chemicals. The most popular chemicals are ammonia, urea, dimethyl ether, ethylene, and propylene.
Among various options of CCT, Integrated Gasification Combined-Cycle (IGCC) is an environmentally friendly coal utilization technology for power generation, which has been gradually commercialized, and more advanced developments continue globally. With a multi-fuel feeding feature, IGCC can be employed to produce power more efficiently with less pollution than traditional coal-fired power plants. Combining with carbon capture and storage (CCS) technology, it will also be an essential option for base-loaded power and sustainable development. If integrated with hydrogen technologies, i.e., hydrogen turbine and fuel cell, the said combination can achieve the vision of zero emission.
There have been five major IGCC demo plants globally since mid-1990s, i.e., Wabash River and Tampa in USA, Buggenum (Nuon) in Netherlands, Puertollano (Elcogas) in Spain, and CCP in Japan. Abundant operating experience has been accumulated from these five demo plants. All the gasifiers used in these demo plants are entrained-bed gasifiers, and each has its individual pros and cons. Besides the air-blown methods used by MHI, Japan, the oxygen-blown method is employed for the rest of the four plants. The gasifiers of Wabash River (E-GasTM gasifier) and Tampa (GE gasifier) employed coal-slurry feeding, while those of Buggenum (Shell gasifier), Puertollano (Prenflo gasifier) and CCP (MHI gasifier) all used dry-fed option. The downdraft flow condition is only employed in the GE gasifier in Tampa. The E-GasTM and MHI gasifiers feed coal in two-stages, while the Shell, GE, and Prenflo use only one-stage feed.
Coal gasification is an extremely complex process. It will take many years of continuous efforts to achieve meaningful and practical results, and for continuous improvements afterwards. The Institute of Nuclear Energy Research (INER) in Taiwan has developed Computational Fluid Dynamics (CFD) models for years to simulate gasification process. Previous studies have successfully established the CFD capability to analyze the gasification process in an E-GasTM type entrained-flow gasifier to produce syngas for power generation [2]. To further investigate the different products that can be produced by coal gasification, the gasification model needs to be continuously expanded and improved by incorporating more complex and detailed sub-models.
It has been reported that a newly introduced Entrained Slagging Transport Reactor (E-STR) gasifier can reduce capital and operating costs, while improve operability [3]. E-STR is a product modified from the existing E-Gasifier design, and the configuration can be seen in Slide 6 of Ref. [3]. The major modifications include increased operating pressure and reduced temperature, with the aim of achieving a higher H
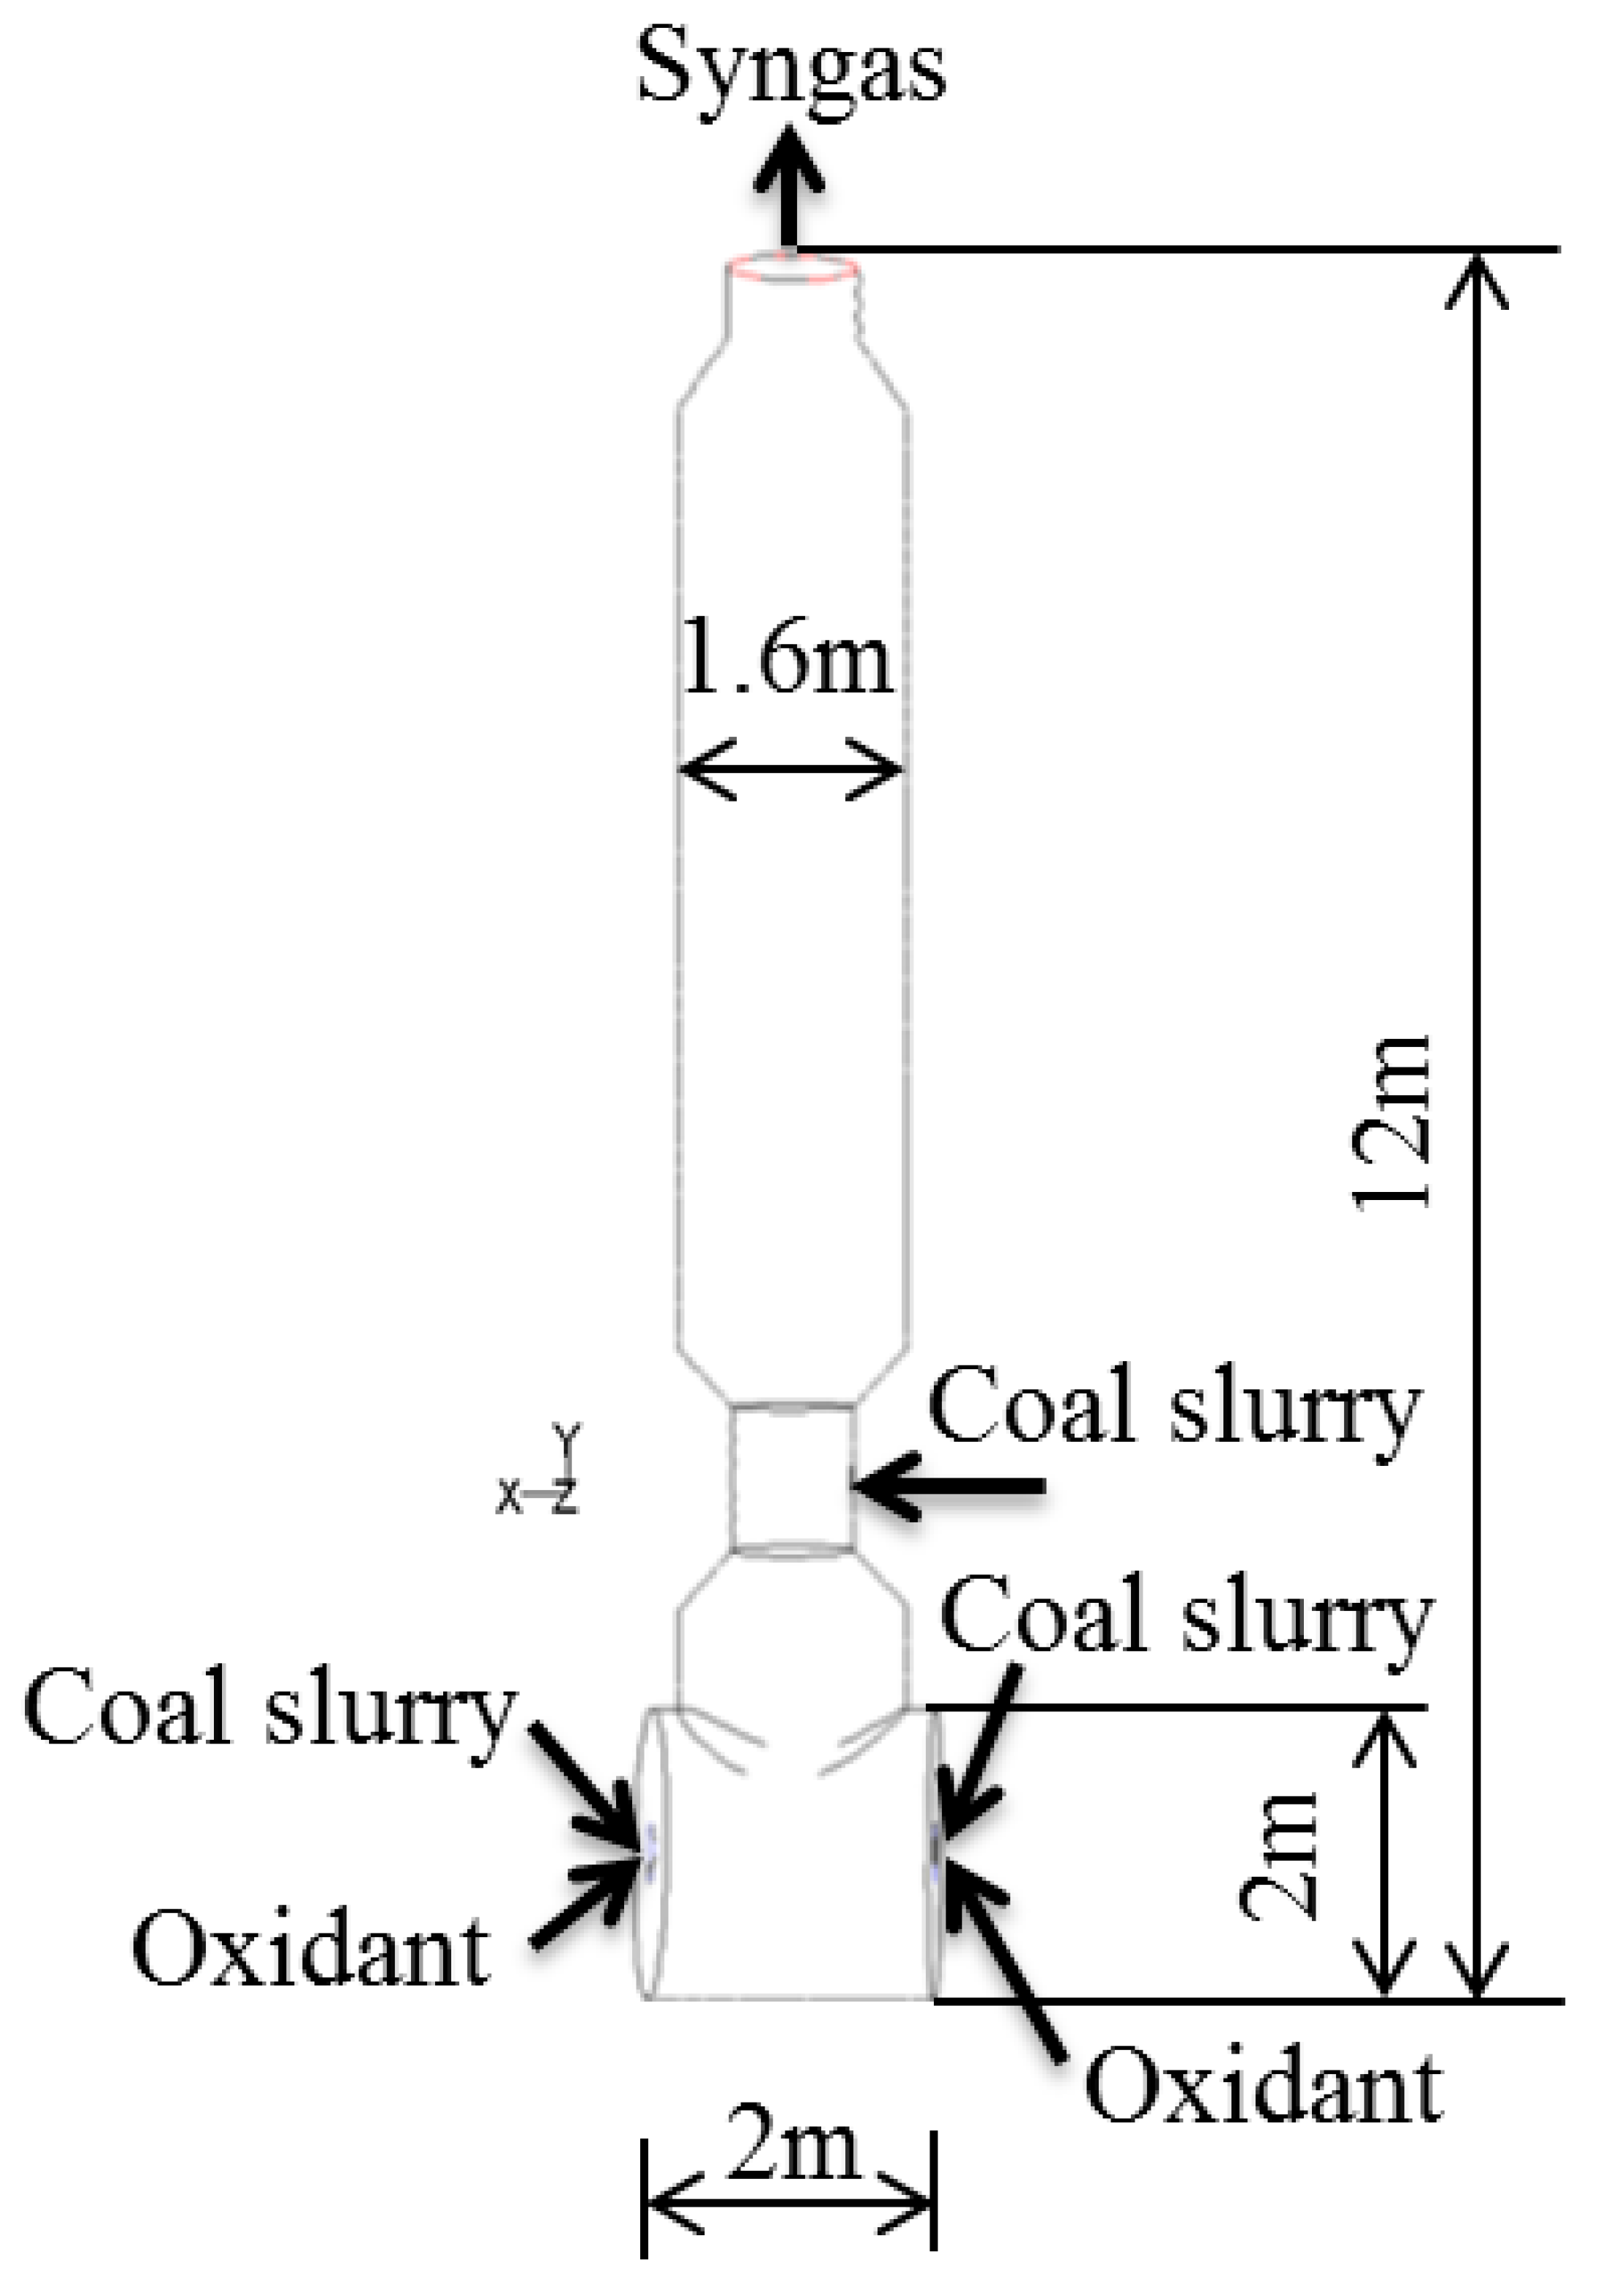
2/CO ratio of syngas for SNG production. Due to the reduced operating temperature, catalyst is utilized to convert tar or heavy volatiles to lighter gases. The major modifications of E-STR include the following features: (a) the horizontal cylinder in the E-GasTM gasifier is removed, (b) the oxidant is entirely fed with only the recycled char at the 1st stage (thus no coal slurry), (c) the coal/slurry mixture is fed at the 2nd stage entirely, (d) the operating pressure is much higher, while temperature is lower than the counterparts in E-GasTM gasifier, and (e) catalytic material is needed for tar/volatiles cracking (since the second-stage temperature is not high enough to sufficiently crack the tar or heavy volatiles). The main goal of E-STR is to produce syngas with a higher H2/CO ratio suitable for SNG production. Compared to the cross-type configuration of E-GasTM, the design of E-STR excludes the first-stage cylinder. Therefore, several critical issues under high-pressure operation can be simplified, such as welding, sealing, maintenance and operation cost. The savings can be employed to compensate the cost of the catalyst for the low-temperature tar cracking process.
Choosing the E-STR gasifier in this study is beneficial in many folds. In our previous studies [2,4], the E-GasTM gasifier has been investigated and results have been compared with the reports issued by the Department of Energy/National Energy Technology Laboratory (DOE/NETL). After the model validation, the effects of the 2nd stage injection mode as well as the feedstock type were investigated comprehensively [4]. It is more productive to continue follow-up studies of the new product derived from E-GasTM gasifier. E-STR is a new concept that is still in the development stage. Investigating this new concept is strategically important to keep INER in a lead position when it comes to understanding and applying E-STR. Both E- GasTM gasifier and E-STR gasifier have certain advantages in producing SNG over other commercial gasifiers.
The objective of this study is to develop a numerical model and simulate the low-temperature and high-pressure E-STR introduced by the E-Gas group [3]. The CFD gasification model developed in the previous study [2] will be modified to incorporated a new tar condensation and re-vaporization sub-model to simulate the E-STR gasifier under high-pressure and relatively low-temperature conditions without implementing a tar-cracking catalyst. The result of this study will pave the road for developing once-through SNG production in the gasifier for the future.

2. Literature Review

A mathematical model was developed by Wen et al. in 1979 [5], to investigate the influence of input operating parameters for the Texaco (Now, GE) down-draft entrainment pilot plant gasifier. Furthermore, the gasification process and its performance have been studied comprehensively by CFD modeling for several years [4,6,7,8,9,10,11,12,13,14,15,16,17]. Chen et al. [18] developed a numerical model to investigate a 200-ton, two-stage air-blown entrained type gasifier for an IGCC process. Results showed that the turbulent fluctuations influenced the interim reactions during gasification process, and significantly affected the temperature and outlet gas composition. It was also found that the effect of coal particle size is not significant on the carbon conversion; rather, the reaction kinetics turn out to be more sensitive [19].
The research team of the Energy Conversion and Conservation Center (ECCC) at the University of New Orleans [20,21,22,23,24,25] has developed numerical models for the investigation of gasification process since 2005. In their work, the geometry and input data were adopted from literature data, e.g., Bockelie et al. [26] and Chen et al. [18]; furthermore, various operating conditions were studied, and the results were documented systematically. The water-gas-shift (WGS) reaction tunes the ratio of H2 to CO, and thus plays an important role in predicting syngas composition. It is confirmed [20] that the WGS rate proposed by Jones and Lindstedt [27] is too fast, since the proposed rate was evaluated with catalyst. Another attempt to calibrate the WGS rate by Lu and Wang [28,29] showed that all of the proposed WGS reaction rates published in the literature were too fast for commercial entrained-flow gasifiers, because no catalyst is added in a typical gasification reactor.
Chyou et al. [4] studied the effect of the 2nd stage design and coal type on the performance of E-Gasifier. Results showed that dual-injector design can minimize the circulation zone and improve the gasification performance; moreover, gasification of Lignite leads to lower performance than the counterpart of Illinois #6 coal. More comprehensive literature surveys have been conducted in previous works [2,4], from which further information can be cited.

3. Materials and Methods

The numerical model is developed via the commercial code ANSYS FLUENT V.12.0, which is a finite-volume based solver for fluid flow, chemical reaction, and heat transfer. The function of the unstructured meshes is also supported for complex geometry. The employed discretization scheme is second-order. The pressure-velocity coupling is iteratively solved by the SIMPLE algorithm. Under the Eulerian–Lagrangian frame of reference, the three-dimensional, steady-state Navier–Stokes equations are solved. Injected coal particles are considered as discrete and secondary phase. The Discrete Phase Model (DPM) is included for the interaction of coal with the continuous phase. Calculated results of the discrete phase are updated into the continuous phase every fifty iterations. The effect of radiation is considered by the P1 model, and the gravitational force is included in the calculation. The turbulence flow is described by the standard k-ε model. The Finite-Rate/Eddy-Dissipation Model is implemented for solving chemical reactions, for which the slower rate is selected by comparing the finite rate and the eddy-dissipation rate.

3.1. Governing Equations

The mass conservation equation is:
· ( ρ υ ) = S m ,
The added mass due to the devolatilization of coal particle and vaporization of water droplet from secondary phase into the continuous phase is considered as the source term Sm.
The momentum conservation equation is:
· ( ρ υ υ ) = p + · ( τ ¯ ¯ ) + ρ g + F ,
where p is the static pressure, τ ¯ ¯ is the stress tensor, and ρ g and F are the gravitational body force and external body forces (e.g., that arise from interaction with the dispersed phase), respectively. The stress tensor τ ¯ ¯ is given by
τ ¯ ¯ = μ [ ( υ + υ T ) 2 3 · υ I ] ,
where µ is the molecular viscosity, I is the unit tensor. The effect of volume dilation is considered in the second term on the RHS.
The energy conservation equation is:
x i ( ρ u ¯ i h ) = x i ( K T x i ) + S p h ,
where Sph is the source term for particle-gas heat transfer, evaporation energy (latent heat), the radiation energy, and reaction heat.

3.2. Turbulence Model

The standard k-ε transport equations for the turbulence kinetic energy, k, and its rate of dissipation, ε, are:
x i ( ρ k u i ) = x j [ ( μ + μ t σ k ) k x j ] + G k ρ ε ,
and
x i ( ρ ε u i ) = x j [ ( μ + μ t σ ε ) ε x j ] + C 1 ε ε k G k C 2 ε ρ ε 2 k ,
where Gk is the generation of turbulence kinetic energy due to the mean velocity gradients. σk and σε are the turbulent Prandtl numbers for k and ε. The turbulent (or eddy) viscosity, μt, is evaluated as:
μ t = ρ C μ k 2 ε ,
where the empirical model constants are C1ε = 1.44, C2ε = 1.92, Cμ = 0.09, σk = 1.0, σε = 1.3 [30].

3.3. Discrete Phase

In the discrete phase, each particle is tracked by the Lagrangian approach. The force balance on the particles is described as:
d u p d t = F D ( u u p ) + g x ( ρ p ρ ) ρ p ,
where FD(u − up) is the drag force per unit particle mass:
F D = 18 μ ρ p d p 2 C D R e 24 ,
R e = ρ d p | u p u | μ ,
where u is the fluid phase velocity, up is the particle velocity, μ is the molecular viscosity of the fluid, ρ is the fluid density, ρp is the particle density, and dp is the diameter of the particle. Re is the relative Reynolds number calculated from the slip velocity between the fluid phase velocity and the particle velocity.
The particles are tracked by the mean and fluctuating velocity as:
u * = u ¯ + u ,
where the fluctuating velocity in Equation (11) is defined by the stochastic discrete random walk model.
The burning rate of the char particles is adopted from the study of Smith [31]. The particle surface reaction rate is calculated as:
R ¯ = A p η Y R ,
R = R k i n ( p n R D ) N ,
where Ap is the particle surface area (m2), Y is the mass fraction of surface species in the particle, η is the effectiveness factor (dimensionless), R is the rate of particle surface species reaction per unit area (kg/m2/s), pn is the bulk concentration of the gas phase species (kg/m3), D is the diffusion rate coefficient for the reaction, Rkin is the kinetic rate of reaction (units vary), and N is the apparent order of reaction. In this study, D is 5E-12 and N is 0.5. The kinetic rate of reaction r is defined as:
R k i n = A T n e ( E / R T ) ,
where the n (temperature exponent) is 1. The Rosin–Rammler distribution [32] is employed for the simulation.
The water within the coal slurry is assumed to atomized and evaporated when injecting into the gasifier. The rate of vaporization is of the droplet is calculated as:
d m p d t = π d 2 k c ( C s C ) ,
where kc is the mass transfer coefficient and Cs is the concentration of the vapor at the particle’s surface. C is the vapor concentration of the bulk flow. The empirical correlation by [33,34] is employed to evaluated the value of kc as:
S h d = k c d D = 2.0 + 0.6 R e d 0.5 S c 0.33 ,
where Sh is the Sherwood number, Sc is the Schmidt number (defined as ν/D), D is the diffusion coefficient of vapor in the bulk flow. Red is the Reynolds number, D is the droplet diameter.
When the droplet temperature reaches the boiling point, the evaporation rate [35] is evaluated as:
d m d d t = π d 2 ( λ d ) ( 2.0 + 0.46 Re d 0.5 ) ln ( 1 + C p ( T T ) / h f g ) / C p ,
The convection, radiation, devolatilization, and surface reactions are included in the energy equation as:
m p c p d T p d t = h A p ( T T P ) + ε p A p σ ( θ R 4 T p 4 ) + d m p d t h f g f h d m p d t H r e a c ,
where mp and Tp are the particle mass and particle temperature, respectively. hfg is the latent heat, Hreac is the heat release due to surface reaction, and fh is the fraction of due to the heat absorption of particle. θR is the radiating temperature, defined as:
θ R = ( G / 4 σ ) 1 / 4 ,
and G is the incident radiation, which is related to the radiative intensity as:
G = 0 4 π I d Ω ,
The Pi model [36] is employed for the radiation in the gasifier. The empirical relation by Ranz and Marshall [33] is introduced to evaluate the convection coefficient as:
N u = h d p k = 2.0 + 0.6 Re d 1 / 2 Pr 1 / 3 ,

3.4. Devolatilization

The two-competing-rates model by Kobayashi [37] is employed for the devolatilization reaction as:
R 1 = A 1 e ( E 1 / R T p ) ,
R 2 = A 2 e ( E 2 / R T p ) ,
These two kinetic rates are used as a weight function as:
m v ( t ) ( 1 f ω , 0 ) m p , 0 m a = 0 t ( α 1 R 1 + α 2 R 2 ) exp ( 0 t ( R 1 + R 2 ) d t ) d t ,
where α1 and α2 are yield factors, fω is the mass fraction of moisture, mp is the mass of particle, and ma is the mass of ash. The value of the constants are A1 = 2 × 10⁵, A2 = 1.3 × 10⁷, E1 = 1.046 × 10⁸ J/kg mol, and E2 = 1.67 × 10⁸ J/kg mol.
The heterogeneous reactions on the particle surface occur when the volatiles diffuse out of the coal particle. Those particle surface reactions are described by the implicit relations of Smith et al. [31] as:
R ¯ k , r = A p η r Y k R k , r ,
R k , r = R k i n , r ( p n R k , r D 0 , r ) N r ,
R k i n , r = A r T n , r e ( E r / R T ) ,
where ηr is the effectiveness factor, Yk is the mass fraction, D0,r is the bulk diffusion coefficient, Nr is the apparent reaction order, Ar is the pre exponential factor.

3.5. Chemical Reaction

The general form for the species conservation equations is:
· ( ρ υ Y i ) = · J i + R i + S i ,
where Ri is the net rate of production of species i by chemical reaction and Si is the rate of mass creation by addition from the dispersed phase sources. In addition, J i is the diffusion flux of species i, which arises due to the gradients in concentration and temperature. The source term for species i due to all reactions is computed as the sum of the Arrhenius reaction sources over the NR reactions that the species participate in:
R i = M w , i r = 1 N R R ^ i , r ,
where Mw,i is the molecular weight of species i and R ^ i , r is the Arrhenius molar rate of production/consumption of species i in reaction r. For the homogeneous reaction, the slower one between the finite-rate and eddy-dissipation-rate is selected, while only the finite-rate is used for the heterogeneous reactions.

3.6. Condensation and Re-Vaporization of Tar

As mentioned above, the second-stage temperature of E-STR reactor will not be sufficiently high enough to crack the tar, and a catalytic material is needed for tar cracking. Without including the actual catalytic kinetics, this study intends to implement sub-models of liquid tar (condensation) and its re-vaporization into the existing gasification simulation model. Specifically, it considers low-temperature operating conditions and a success of implementation of these models can pave the road for future incorporation of catalytic kinetics, if the information of the proprietary catalyst is released.
In the tar condensing sub-model, a threshold condensation temperature is specified. When the local temperature is lower than the designated condensation temperature (assumed as 780 K), the gaseous volatiles will condense to liquid form (liquid tar) and release the energy of latent heat. On the other hand, when the temperature of liquid tar is higher than the specified re-vaporization temperature (assumed as 810 K), it will crack into three species (CO, H2, C2H2) and absorb energy for cracking reaction.
The tar condensation and re-vaporization sub-models are described by the UDF (User-Defined Function), and interpreted into the E-STR model during the iteration.

3.7. Finite-Rate/Eddy-Dissipation-Rate Model

3.7.1. Arrhenius rate

R ^ i , r = ( ν i , r ν i , r ) ( k f , r j = 1 N [ C j ] η j , r ) k f , r = A r T n exp ( E r / R T ) ,
where ν i , r , ν i , r are the reactant and product stoichiometric coefficients, respectively, η j , r are the rate exponents for reactant j, in reaction r, n is the temperature exponent of reaction r, Er is the activation energy, R is the universal gas constant, Ar is the pre-exponential factor, and Cj is the molar concentration of species j.

3.7.2. Eddy-Dissipation Rate

R i , r = m i n ( R i , r ( R ) , R i , r ( P ) ) R i , r ( R ) = ν i , r M i A ρ ε k ( Y R ν R , r M R ) R i , r ( P ) = ν i , r M i A B ρ ε k P Y P j N ν j , r M j ,
where YR and YP are the mass fractions of reactant and produce species, respectively. A is the Magnussen constant for reactants (4.0), B is the Magnussen constant for products (0.5), M is the molecular weight, and the R and P subscripts are the reactants and products. The global gasification reaction rates used in this study are listed in Table 1 [22].

4. Model Description

4.1. Computational Model

As mentioned before, E-STR is a product modified from the existing E-GasTM gasifier design. The model in this study adopts the major geometry and dimension of the previously developed E-Gas model [2,4], of which the height (H) and length (L) is 12 m and 8 m, respectively. For the E-Gas model, 80% of coal/slurry and all oxidant are fed on both sides of the 1st stage, while the remaining 20% of coal/slurry is fed at the 2nd stage. In the E-STR model, the length is shortened from 8 m to 2 m by literally removing the horizontal cylindrical section, as the schematic diagram shown in Figure 1. The fuel feeding configuration is also modified by feeding all coal/slurry at the 2nd stage and all oxidant at the 1st stage. The unreacted char leaves the reactor and recycles back to the 1st stage fed port. A reasonable recycling rate will be deduced in the following section.
The grid sensitivity study was conducted with three grids (94,683, 186,200, and 379,573). The difference of the species between the cases of 94,683 and 186,200 is about 3.5%, and it reduces to 1.9% at the case of 379,573. The difference of outlet temperature between the two cases is less than 1%. To save computational time, the grid containing 186,200 tetrahedral meshes is used.

4.2. Boundary Condition

The properties of the employed Illinois #6 coal are shown in Table 2 and Table 3, respectively. It is assumed that small amount elements (N, Cl and S) shown in Table 3 are lumped as nitrogen into the oxidant for simplification. The ash is assumed as the species of SiO2 to exclude the formation and discharge of slag at the bottom of the gasifier.
Two operating pressures (28 and 70 atm) are considered. The wall is assumed to be adiabatic. The feedstock and operating conditions of the base case are listed in Table 4. In the base case, no unreacted char is recycled, and the operating pressure 28 atm is considered. The properties of the employed coal particles are listed in Table 5.

5. Results and Discussion

5.1. The Validation Case

The core of the computational model was developed previously for E-gasifier [4]. As indicated in Table 6, the comparison has been made with the NETL’s modeling results [38]. The difference for H2O is 5.85 percentage points, while the differences of other species are less than one percentage point. Syngas composition consists mainly of CO and H2, for which the comparison in Table 6 confirms that the preliminary CFD model is appropriate for predicting gasification behavior.
There is no data available in Ref. [38] for direct comparison in terms of outlet syngas temperature; nevertheless, the predicted exit temperature seems, from empirical judgment, somewhat higher than practical value in entrained-bed gasifier. Further examining the system process in the literature reveals that there is a cooling design by partially recycled clean syngas downstream from the gasifier exit, which moderates the raw syngas temperature to a value, complied with the operating specification of syngas cooler. Such kind of cooling design is not implemented in the present CFD model, due to the fact that iterative scheme and more CPU time would be needed; moreover, the more complicated computational model might cause additional artificial error. It is estimated that the exit temperature in the NETL’s report is around 1600 K.

5.1.1. Benchmark Case of E-STR without Char Recycling

As the first step, a benchmark case with preliminarily modified E-STR model, which decreases length and changes fed configuration without char recycling, is analyzed in this section. The operating pressure of the base E-STR case is still the same as E-Gas at 28 atm. The purpose of making this benchmark process is to find out the difference between the two models by only changing the geometry of the gasifier.
In E-STR, all the fuel is fed at the 2nd stage; hence, concentrated injection generates stronger momentum, racing coal particles impinging on the opposite wall from the injector. This phenomenon can be observed from the distribution of particle resident times shown in Figure 2a. Compared with a transverse jet with lower momentum, the impinging jet induces more complex flow patterns, which affect subsequent chemical reactions and temperature distribution accordingly.
The temperature contours in E-STR without char recycling and operating at 28 atm are shown in Figure 3a. There is a combustion zone upstream the impingement location on the opposite wall from the injector, where the stagnation and recirculation caused by the impinging jet provide the flame stabilization mechanism. Therefore, a “hot spot” exists in the vicinity of the impingement. It is observed that combustion reactions of the injected fuel mainly take place downstream the injection port, where the expansion of vessel diameter following the throat region serves as a flame holder and results in higher interior temperatures near the 2nd stage injector. Further downstream, gasification surpasses combustion as the dominant reactions; hence, different temperature distribution prevails, so its temperature level is lower.

5.1.2. Comparison between E-Gas and E-STR

The result, shown in Table 7, indicates that similar syngas compositions and outlet temperature are observed between E-Gas and E-STR without char recycling. This implies that the lengths of both gasifiers are sufficiently long to achieve almost equilibrium status at the exit of the gasification process. When the E-STR is operated at higher pressure (70 atm), the difference between these two cases becomes obvious.
Comparisons of particle resident times are shown in Figure 2. The fuel feeding configuration is different in the E-Gas and E-STR gasifiers. In the former, the fuel is separately fed at the both injection ports, particles with 20% mass flow rate at the 2nd stage are push upward by the flow coming from 1st stage without reaching the opposite wall, as shown in Figure 2b. Longer particle resident time is observed in E-STR due to concentrated injection at 2nd stage (Figure 2a), while it is separately injected in E-Gas. Therefore, the particles in the E-STR reactor require a longer time to be fully consumed.
The comparison of temperature contours is presented in Figure 3. It is found that the benchmark case E-STR results in higher interior temperatures near the 2nd stage injector than those of E-Gas, as shown in Figure 3b. In the E-Gas gasifier, the main combustion reactions of the injected fuel take place in the horizontal cylinder, where 80% of coal/slurry and all oxidant are fed on both side of the 1st stage injection ports; while further downstream to the 2nd stage injector, gasification mechanisms dominate the reaction regimes, so its temperature is lower. In contrast, all the fuel is fed at the 2nd stage in E-STR and intensive combustion reactions occur downstream the throat, where the vessel diameter expands to accommodate the gasification region, so its temperature in the vicinity is higher.
In the present results, no unreacted char is seen leaving the benchmark E-STR reactor. Since in a real operation, a certain percentage of char is unreacted at the gasifier exit, modification should be considered to reduce the char reaction rate to match the operation data.

5.2. Operating Characteristics of E-STR Gasifier

As mentioned, different injection schemes are employed for the E-STR gasifier, in which the oxidant is entirely fed at the 1st stage, while the coal/slurry mixture is entirely fed at the 2nd stage. One of the major operating features is that char is recycled back to the 1st stage at the bottom region of the gasifier. In addition, the cracking of tar or heavy volatiles becomes an issue, due to lower second-stage temperature. Hence, the recycling of char as well as the behavior of tar or heavy volatiles are crucial to the thermal and chemical characteristics in the E-STR gasifier. After several iterations during preliminary screening studies it was found that the case of the 15% char recycling rate led to reasonable CGE and outlet temperature. Therefore, the condition of 15% recycling rate will be employed in the following investigation

Condensation and Re-Vaporization Sub-Models

As explained earlier, the sub-models of condensation and re-vaporization of volatiles are developed and implemented through the user-defined functions.
  • Condensation:
  • Volatiles (gaseous) → Volatiles (liquid) + Heat
  • Re-Vaporization:
  • Volatiles (liquid) + Heat → CO + H2 + C2H2
The volatiles are first released according to the two-competing-rates devolatilization model proposed by Kobayashi [37] as shown in Equations (22)–(24). Typically, the devolatilization and the subsequent thermal cracking of volatiles occur and complete under high temperature near the combustion region in the gasifier. In a low-temperature operation condition, such as in the E-STR, the heavy volatiles or tar vapors have not been thermally cracked to lighter gases. Therefore, they would condense if the local temperature becomes lower than the corresponding condensation temperature of some species, due to the endothermic gasification process.
The goals of this study are focused on the development and implementation of these sub-models to envisage the phenomena, which are influenced by the temperatures as well as rates of condensation and re-vaporization. Since the latter is not known at present and finding their rates is beyond the scope of this study, the former is thus selected as the main controlling parameter for facilitating the development of models. A range of ±15 K between condensation and re-vaporization is chosen to consider the resistance involved in vapor diffusion and convective process during the condensation and re-vaporization (including the subsequent thermal cracking) processes. The accuracy of the assigned condensation and re-vaporization temperatures is not the focus of this study; rather, functional demonstration of these sub-models is more eminent at present.
Although the condensation temperature varies among different compositions of volatiles and tars, for simplicity, one single condensation temperature (780 K) is assigned. Condensation is assumed to occur instantaneously as the local temperature is lower than 780 K and thermal energy due to phase change will be released. On the other hand, a single re-vaporization temperature (810 K) is also assigned, and the re-vaporization is also assumed instantaneously. The 30 K difference between the condensation and re-vaporization temperatures is to serve the following two purposes: (a) to avoid spatially sharp changes from condensation to re-vaporization in a very short distance, and (b) to simulate the resistance and finite time needed to condense and re-vaporize. The second reason is further explained below.
Assuming the actual saturation temperature of the volatiles is 795 K, it means that the condensation and evaporation temperatures are the same at 795 K. Thus, the assigned condensation (780 K) and re-vaporization (810 K) temperatures are 15 K lower and higher than 795 K, respectively. This implies that the volatiles need to be sub-cooled 15 K to effectively condense, as well as superheated 15 K to re-vaporize. Typically, condensation will not occur in free space, rather a solid surface is required for condensation to occur and grab onto. A solid surface can be the gasifier wall, duct/pipe surface, or a tiny solid (i.e., a nucleate) surface. Since there are abundant particles in a gasifier, including char dust, ashes, and soot, to serve as numerous nucleate sites for condensation to occur, it is reasonable to assume that condensation can occur at any computational cell once the temperature of that cell drops below the assigned condensation temperature.
The volatiles condensation sub-model is first developed and implemented in E-STR without including the re-vaporization model. To investigate if the condensation is adequately modeled, the result of the case with condensation-only is compared in Table 8 with the counterpart of a base case (referring to the reaction described in above) without including condensation and recycling of the unreacted char. The comparison shows that incorporating the volatiles condensation sub-model results in a formation of about 6.47% condensed liquid volatiles and an increase of about 135 K in exit temperature, due to the release of latent heat. The above comparison indicates that the proposed sub-model successfully captures the phenomenon of the volatiles’ condensation.
Moreover, the result of the subsequent implementation of the re-vaporization sub-model is also shown in Table 8. The liquid volatiles from previous condensation are reduced to zero due to re-vaporization mechanism. The exit temperature also drops to the level closer to the base case (without char recycle and both sub-models), due to energy supply for the evaporation latent heat. When both the condensation and re-vaporization sub-models are included, the result returns to the status similar to that of the base case (without char recycle and both sub-models). These two sub-models are considered to be successfully developed and implemented. Both sub-models can also be improved to incorporate more complex physics or be calibrated and fine-tuned to benchmark experimental data, when the data become available in the future.

5.3. Parametric Studies

To investigate other potential operating conditions, parametric studies are performed by varying the fuel distribution between the first and second stages, the operating pressure, and the amount of oxygen supply (O2/Coal ratio).

5.3.1. Fuel Re-Distribution between the First and Second Stages

In this case, the fuel distribution is changed by shifting 20% coal-slurry to the first stage (originally 100% at the second stage) and feeding recycled char at the second stage (originally at the first stage). The entire oxygen is still injected at the first stage like the base case. Two alternate fuel redistribution cases are studied, either with or without the condensation and re-vaporization sub-models. Results of syngas composition and exit temperature are compared in Table 9.
As shown in Table 9, the effect of fuel re-distribution on syngas composition is noticeable but not large. The exit temperature increases for the fuel re-redistribution cases. To further examine the temperature distributions, the centerline temperature distributions along the height of reactor are compared in Figure 4.
The exit temperatures and the interior temperature distributions are quite different. In the base case, the average temperature in the first stage (with recycled char) is about 2200 K. In the case of fuel re-distribution, there is a low temperature region in the first stage since the recycled char is injected at the second stage. With 80% coal-slurry and recycled char, the temperature at the second stage is higher than that of base case. Therefore, using fuel re-distribution leads to lower first stage temperature and higher second stage temperature. Fuel-redistribution also results in higher outlet temperature. The temperature distribution of the base case is more preferable because the wall temperature is relatively low and the hot spot region is less noticeable, as illustrated in Figure 5; hence, the refractory can last longer.

5.3.2. Operating Pressure

The design operating pressure for E-STR reactor is 70 atm, while previous calculations were performed under 28 atm. In this section, the operating pressure is raised to 70 atm. The result is compared with that of the base case in Table 10.
Under the higher operating pressure at 70 atm, there is no unreacted char at the exit of the gasifier, and the mole fractions of H2 and CO increase about 4 percentage points; moreover, the HHV level is also higher. Temperature distributions along the centerline of the reactor are compared in Figure 6. The maximum temperature after the second stage increases from 3400 K to about 4000 K (Figure 6), and the exit temperature from 1463 K to 1532 K (Table 10), indicating the effect of significantly increased pressure. For reference, the adiabatic temperature of solid carbon can reach about 4667 K under atmospheric condition [39].

5.3.3. O2/Coal Ratio

To further reduce temperature to match the value (750 °C or 1023 K) shown in Ref. [3] for high-pressure E-STR operating condition, the amount of oxygen is reduced by decreasing the oxygen/coal ratio from 0.92 in the base case to one half the value (0.46), which is noted as 50% O2. It is understood that a significant reduction of oxygen will lead to poor carbon conversion rate and unsatisfactory gasification process. However, as an exploration study, it is interesting to see how a significantly reduced O2/Coal ratio would affect the gasification process under a high operating pressure condition. The results are compared in Table 10. It is shown that a reduction of 50% oxygen supply effectively reduces temperature to 1100 K, which is close to the level of design value at 1023 K. However, the unreacted char increases to 80%, and the CO yield decreases to 20%. The centerline temperature distribution is compared with the base case in Figure 6.
The case with 50% O2 leads to a higher temperature at the 1st stage due to less gaseous mass flow rate introduced. After the 2nd stage injector, lower oxygen supply results in reduced combustion and lower temperature all the way to the gasifier exit, as shown in Figure 6. The distribution of CO and H2 are compared in Figure 7. For the case of 50% O2, the mole fractions of CO and H2 increase faster in the beginning, but remain constant at 20% in the rest of the gasifier after the injection zone. In the base case, both CO and H2 continuously increase to the position about 70% height of the E-STR reactor.
Among the conducted parametric studies, the reduction of oxygen supply is the most effective way to lower the gasifier temperature. When the interior temperature is low enough, the effect of liquid volatiles/tar would be significant. The molar ratio of H2/CO is 0.663, 0.716, and 0.912 for the base case, the case of 70 atm, and the case of reduced oxygen, respectively. The results indicate that high pressure and low oxygen supply leads to a higher, more favorable H2/CO ratio for synthetic natural gas (SNG) production.
However, the amount of condensed liquid volatiles/tar seems lower under current simulation without using catalysts. This may be due to the significantly reduced oxygen supply or the incorrect values being assigned to the condensation/re-vaporization temperatures. Further study will examine more closely these two parameters.

6. Summary and Conclusions

As mentioned before, the newly introduced E-STR gasifier [3] features low-temperature and high-pressure operating conditions, aiming to realize a higher H2/CO ratio of syngas for SNG production. However, information about the design characteristics or operation data has been barely available in public domain at present; hence, establishing a computational model for revealing the flow/thermal/chemical insights of the new gasifier can be a useful tool. Due to its high-pressure and low-temperature operation condition, tars will form inside the E-STR gasifier. Thus, the objective of this study is to modify the previously developed CFD model of E-GasTM gasifier, and implement additional mechanisms to systematically mimic related design characteristics, and further implement volatiles condensation and re-vaporization sub models into the modified CFD model to properly address the phenomena inside E-STR. For high operating pressure condition, different fuel and oxidant feeding distributions are compared. The results are summarized below.
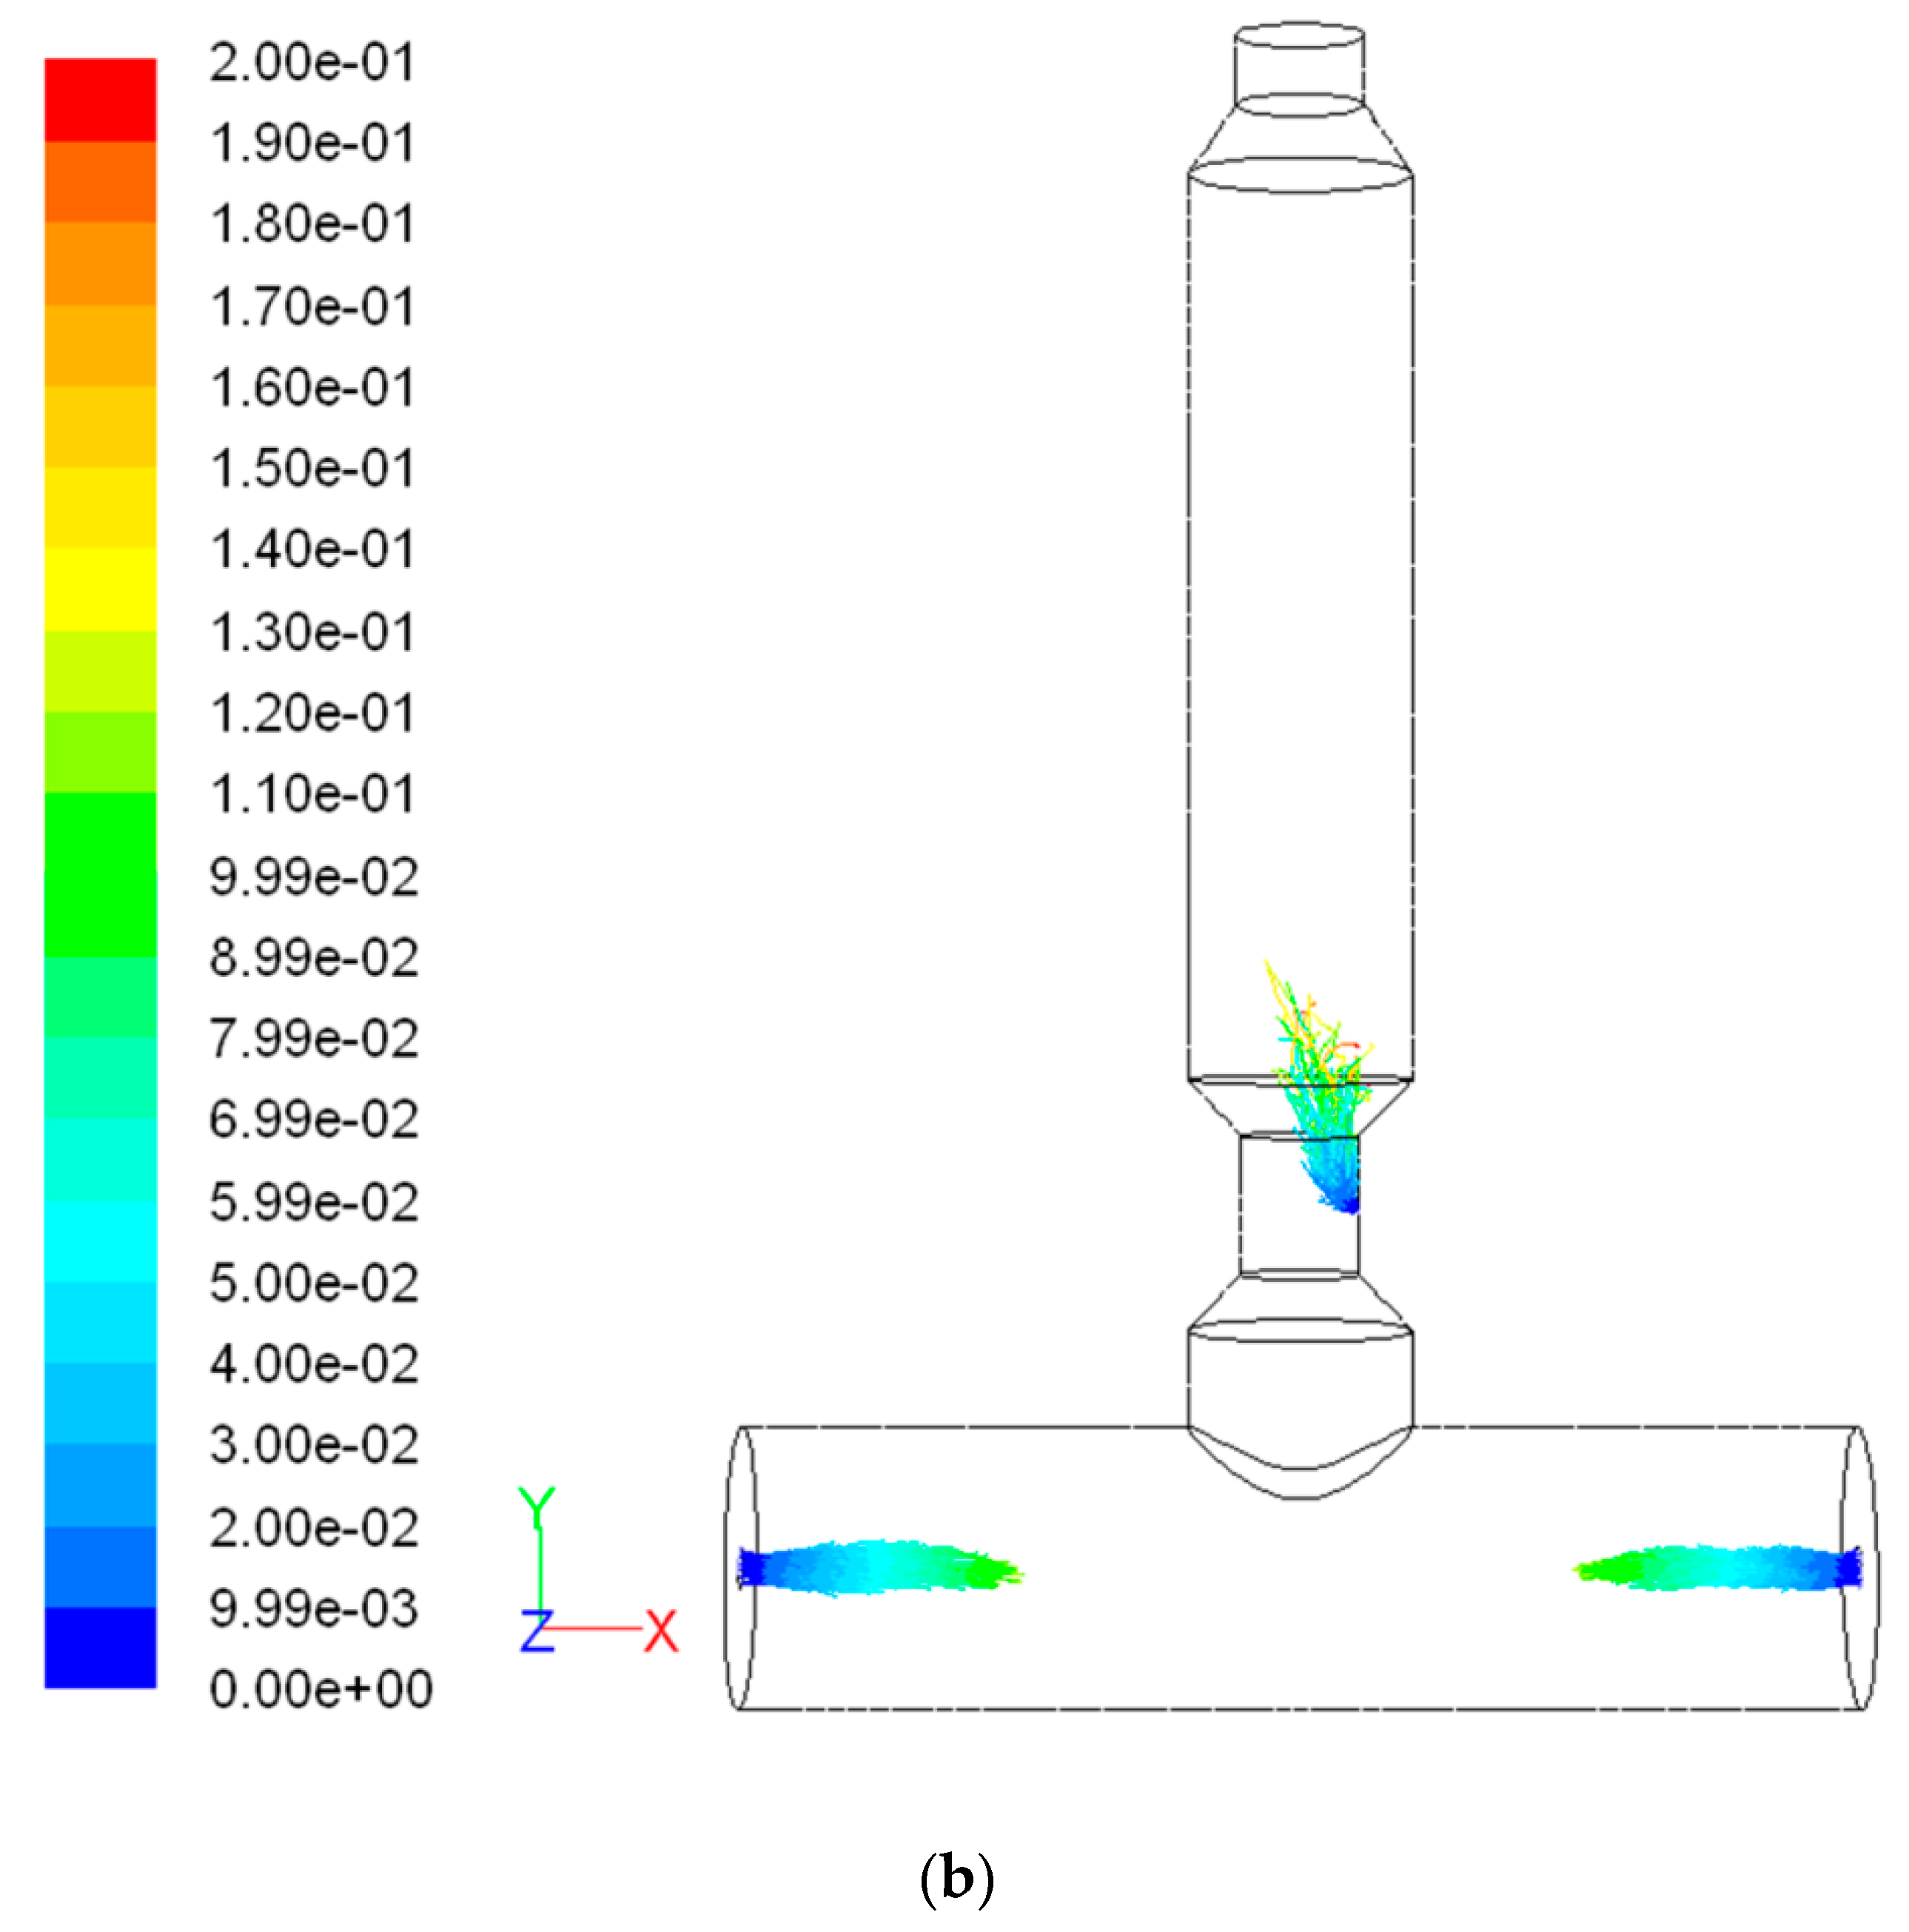
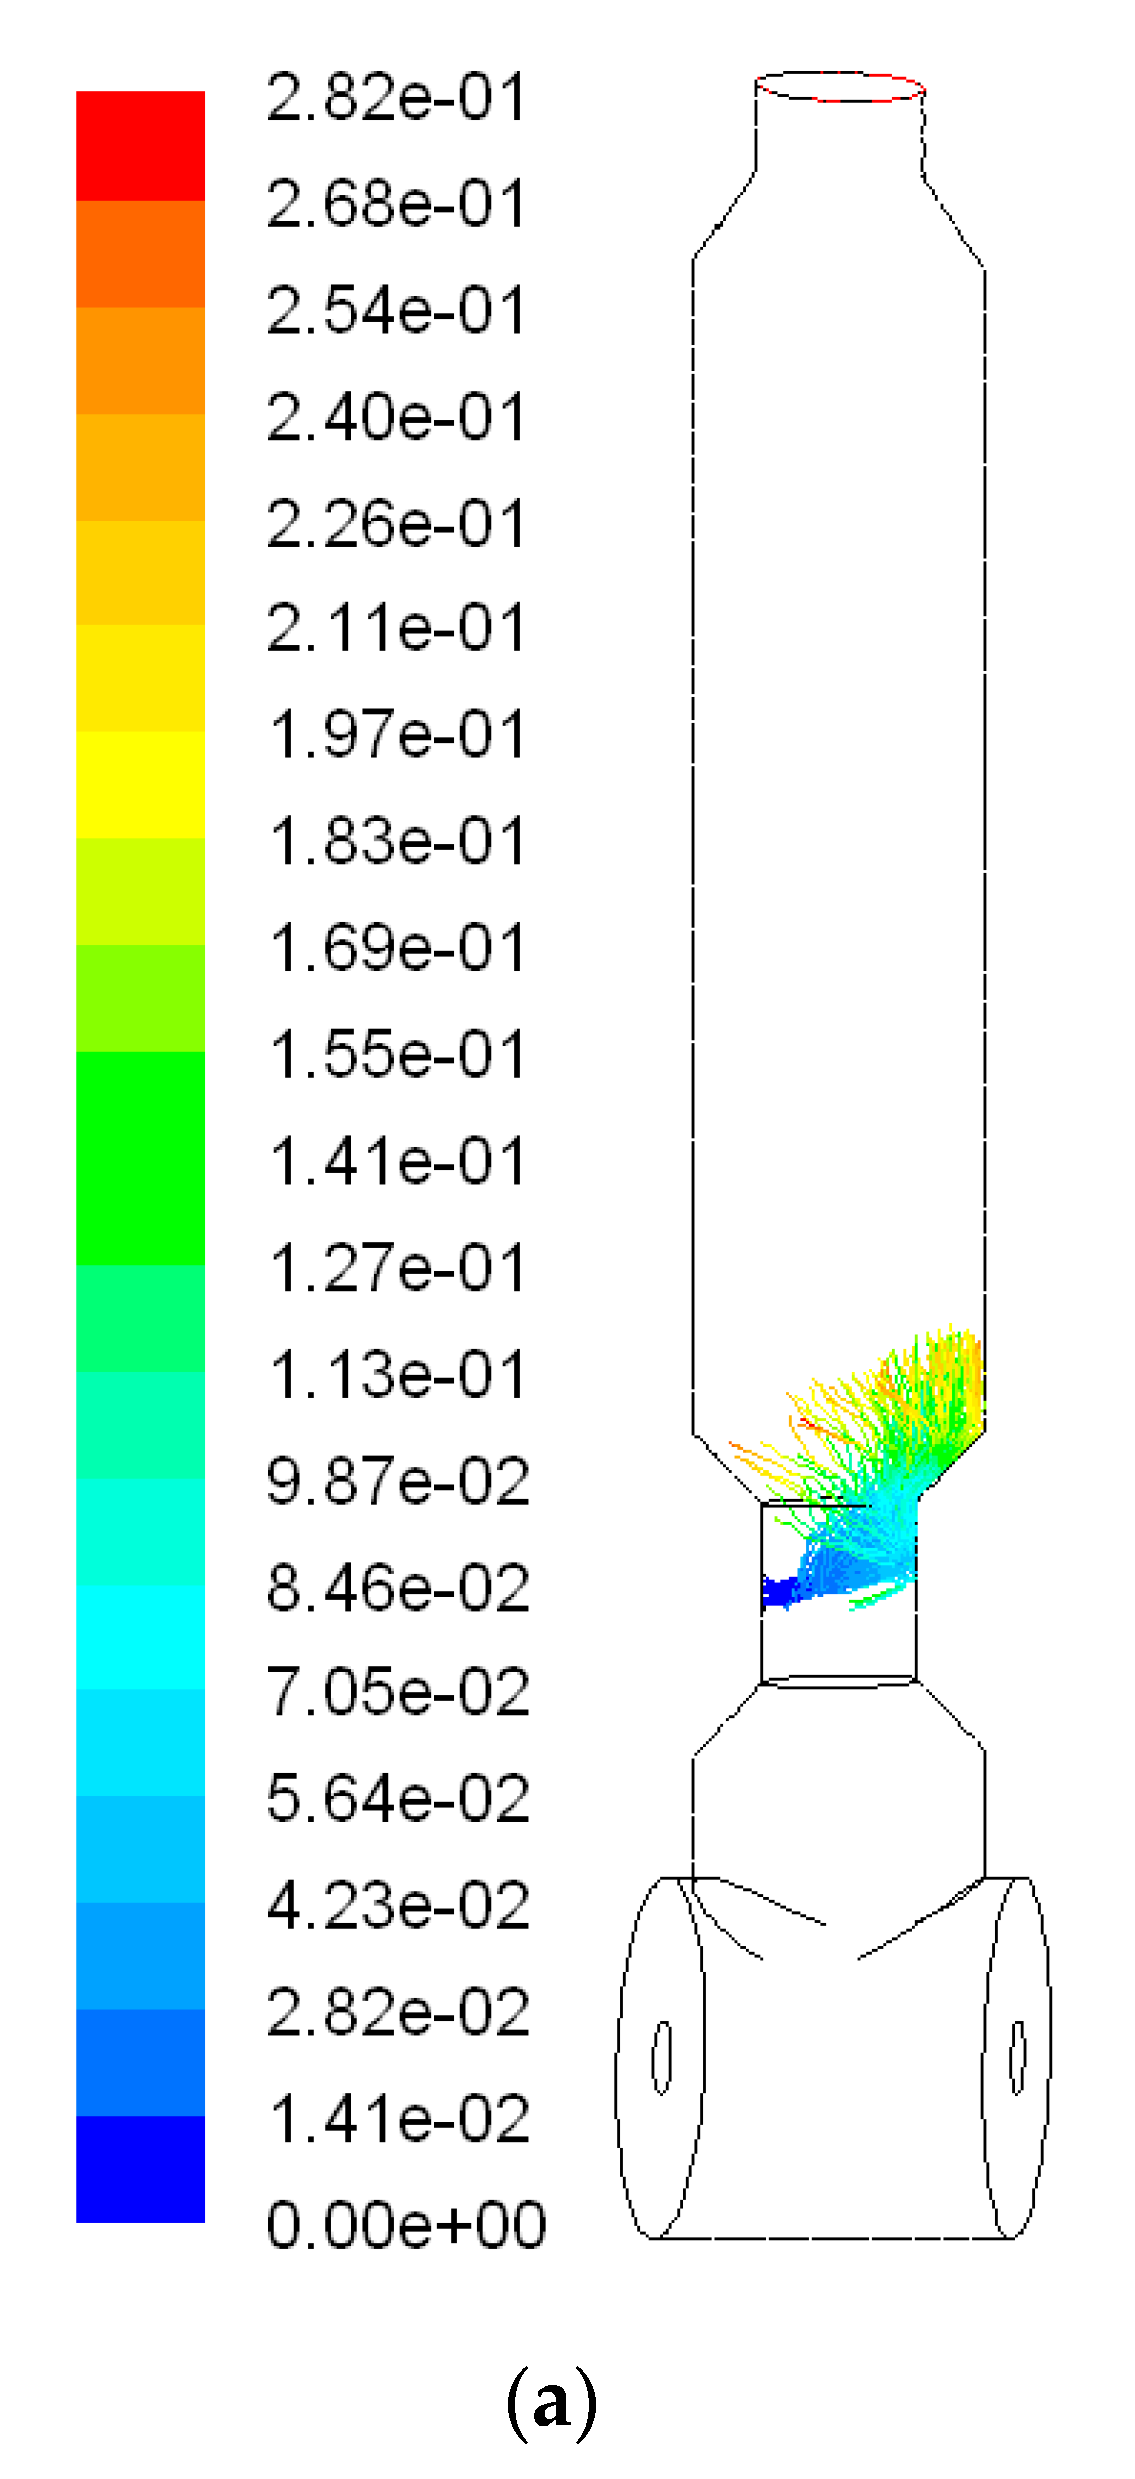
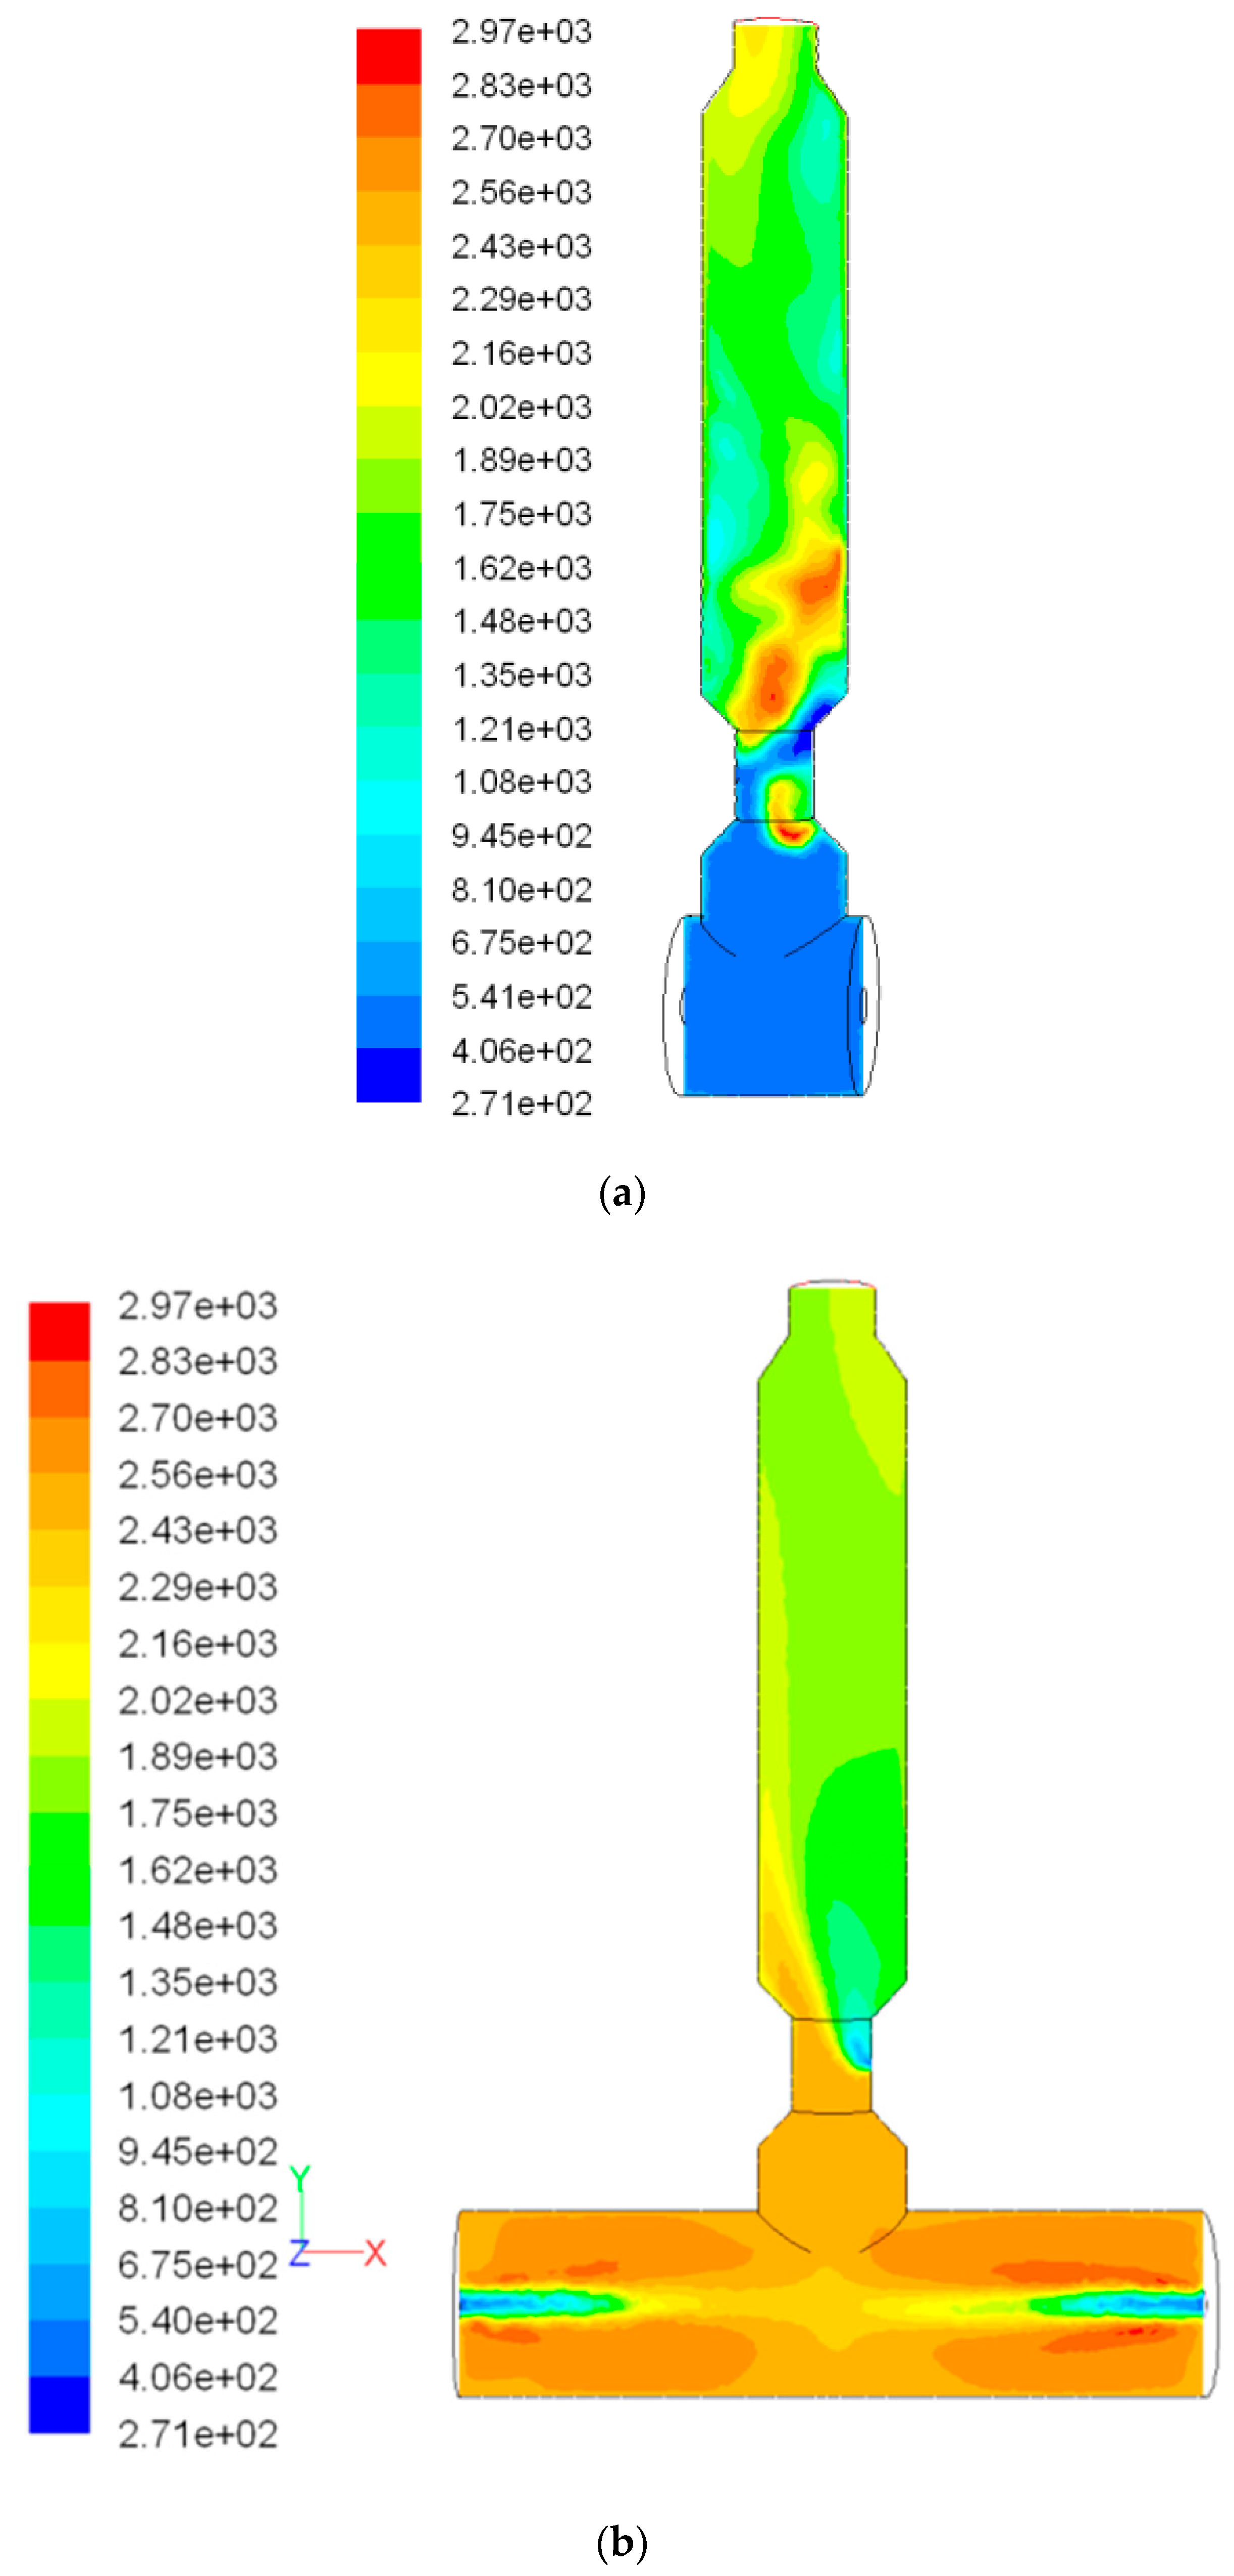
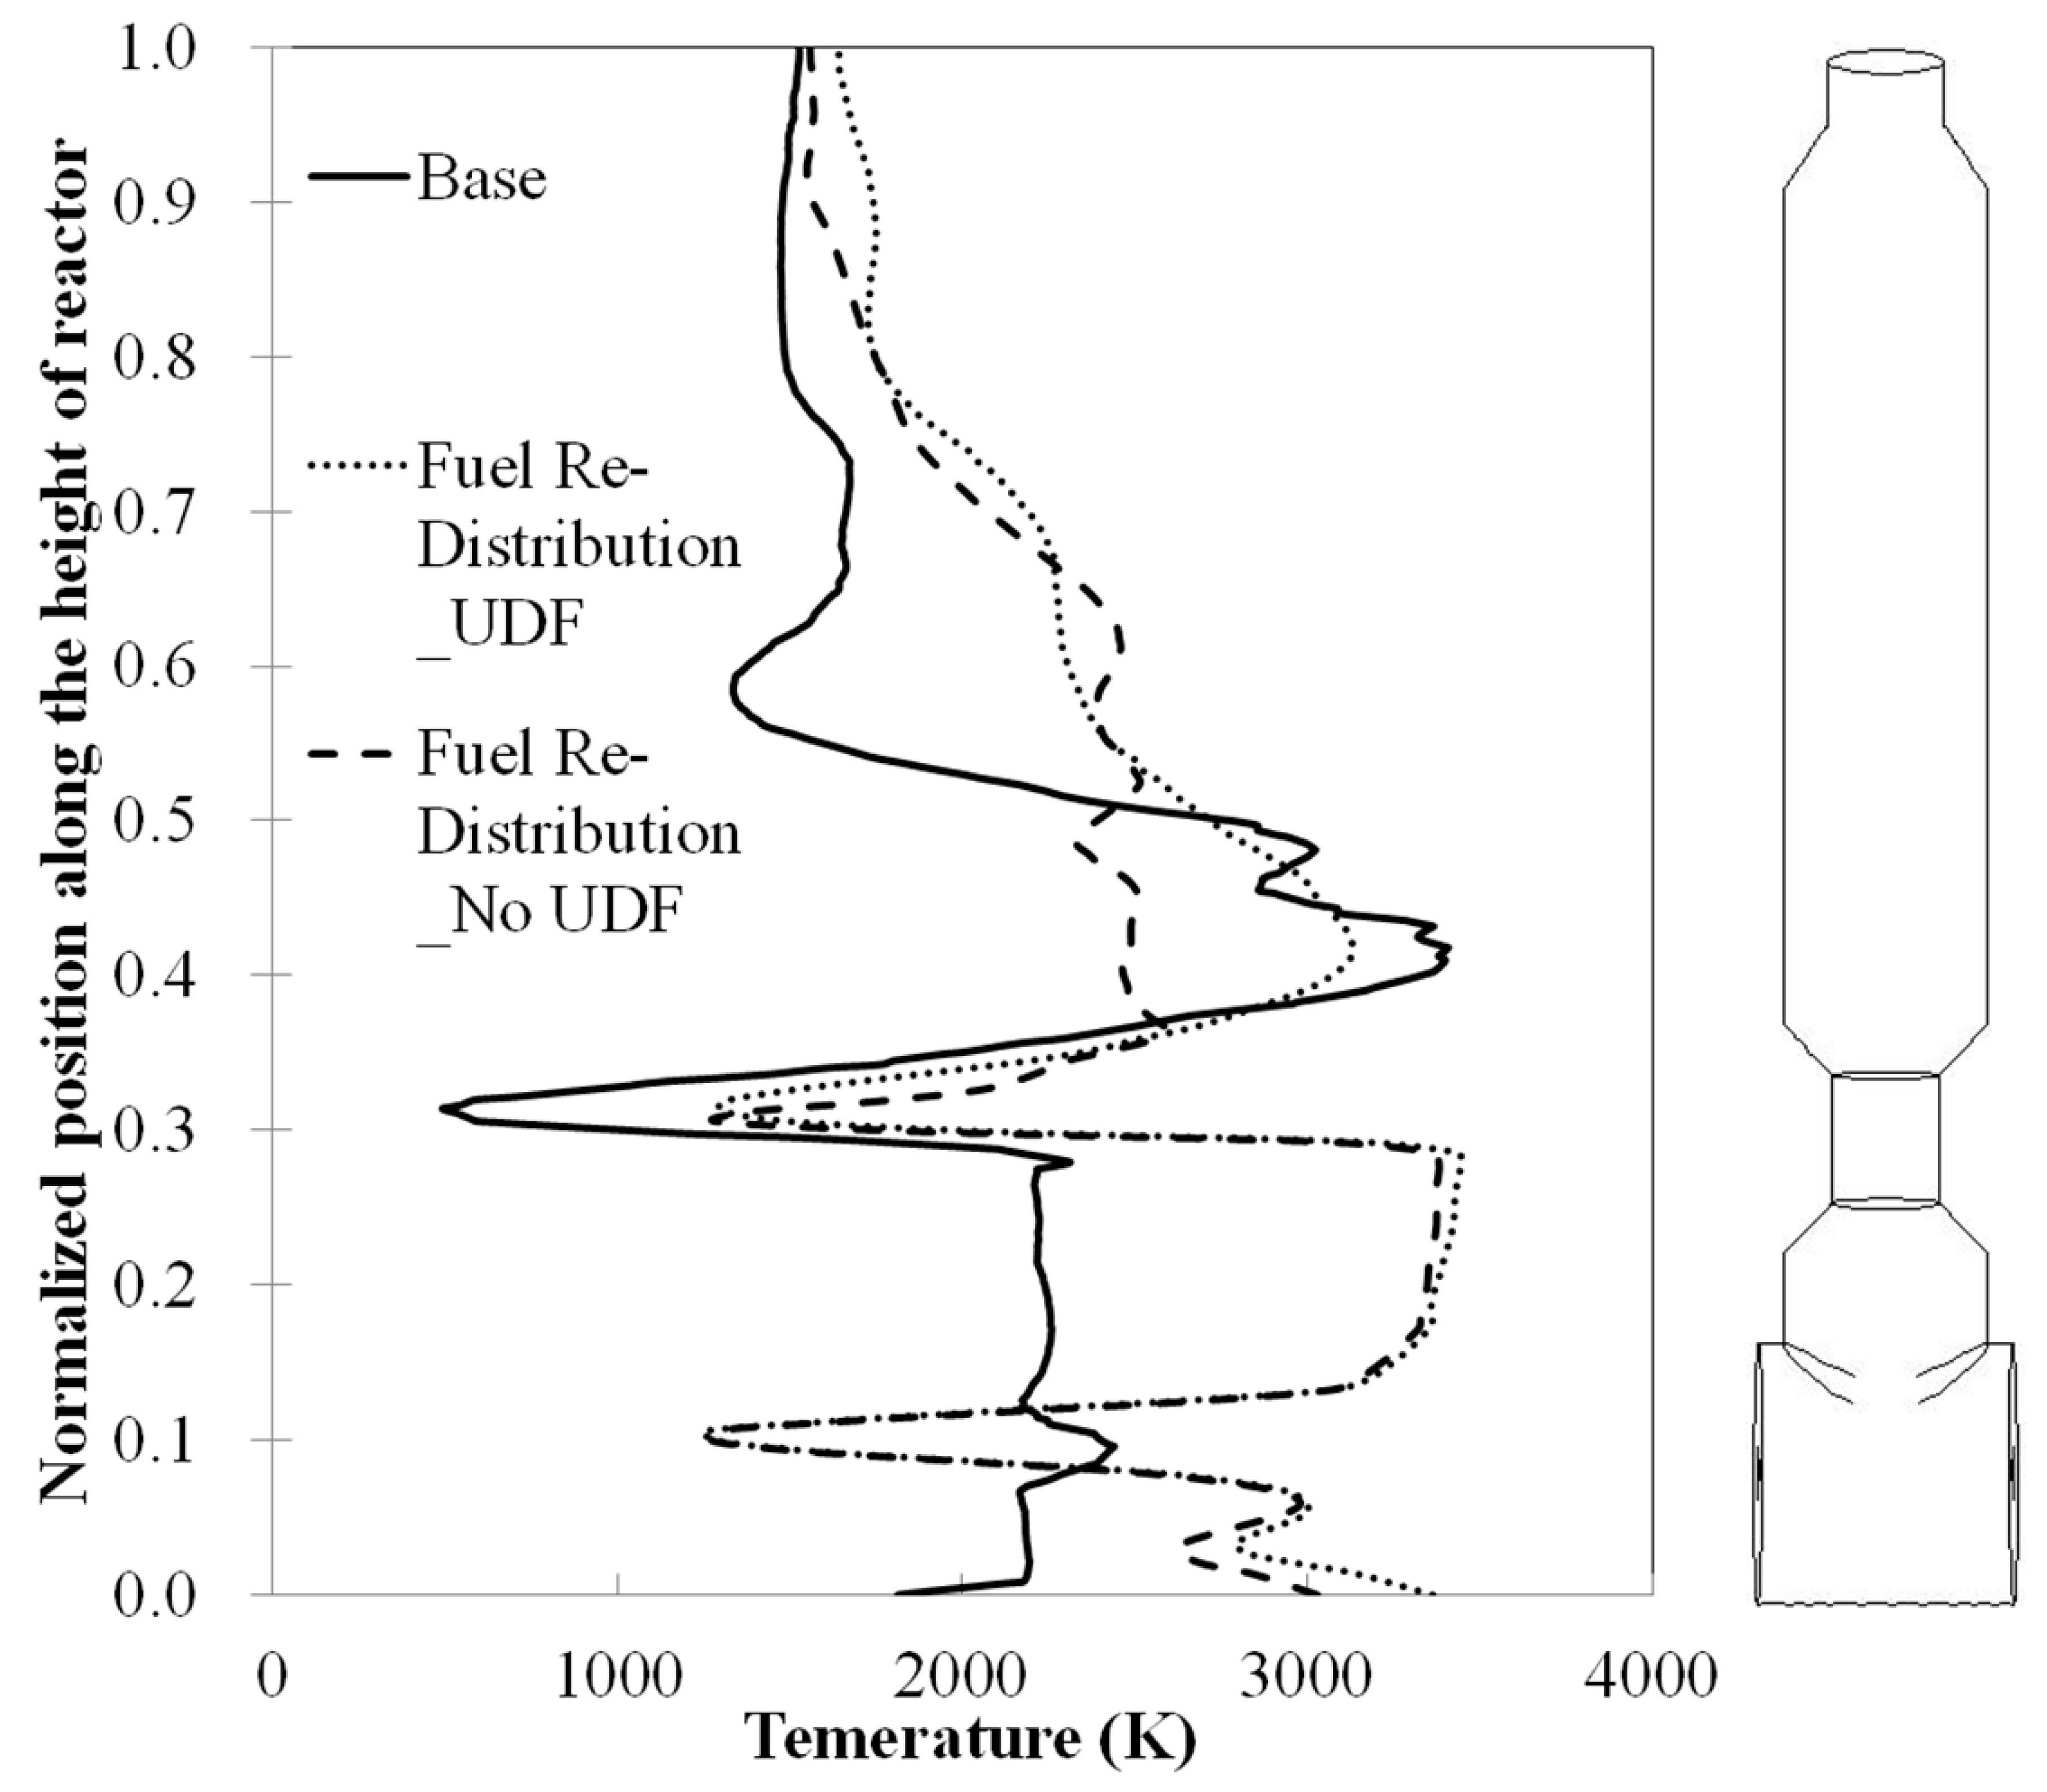
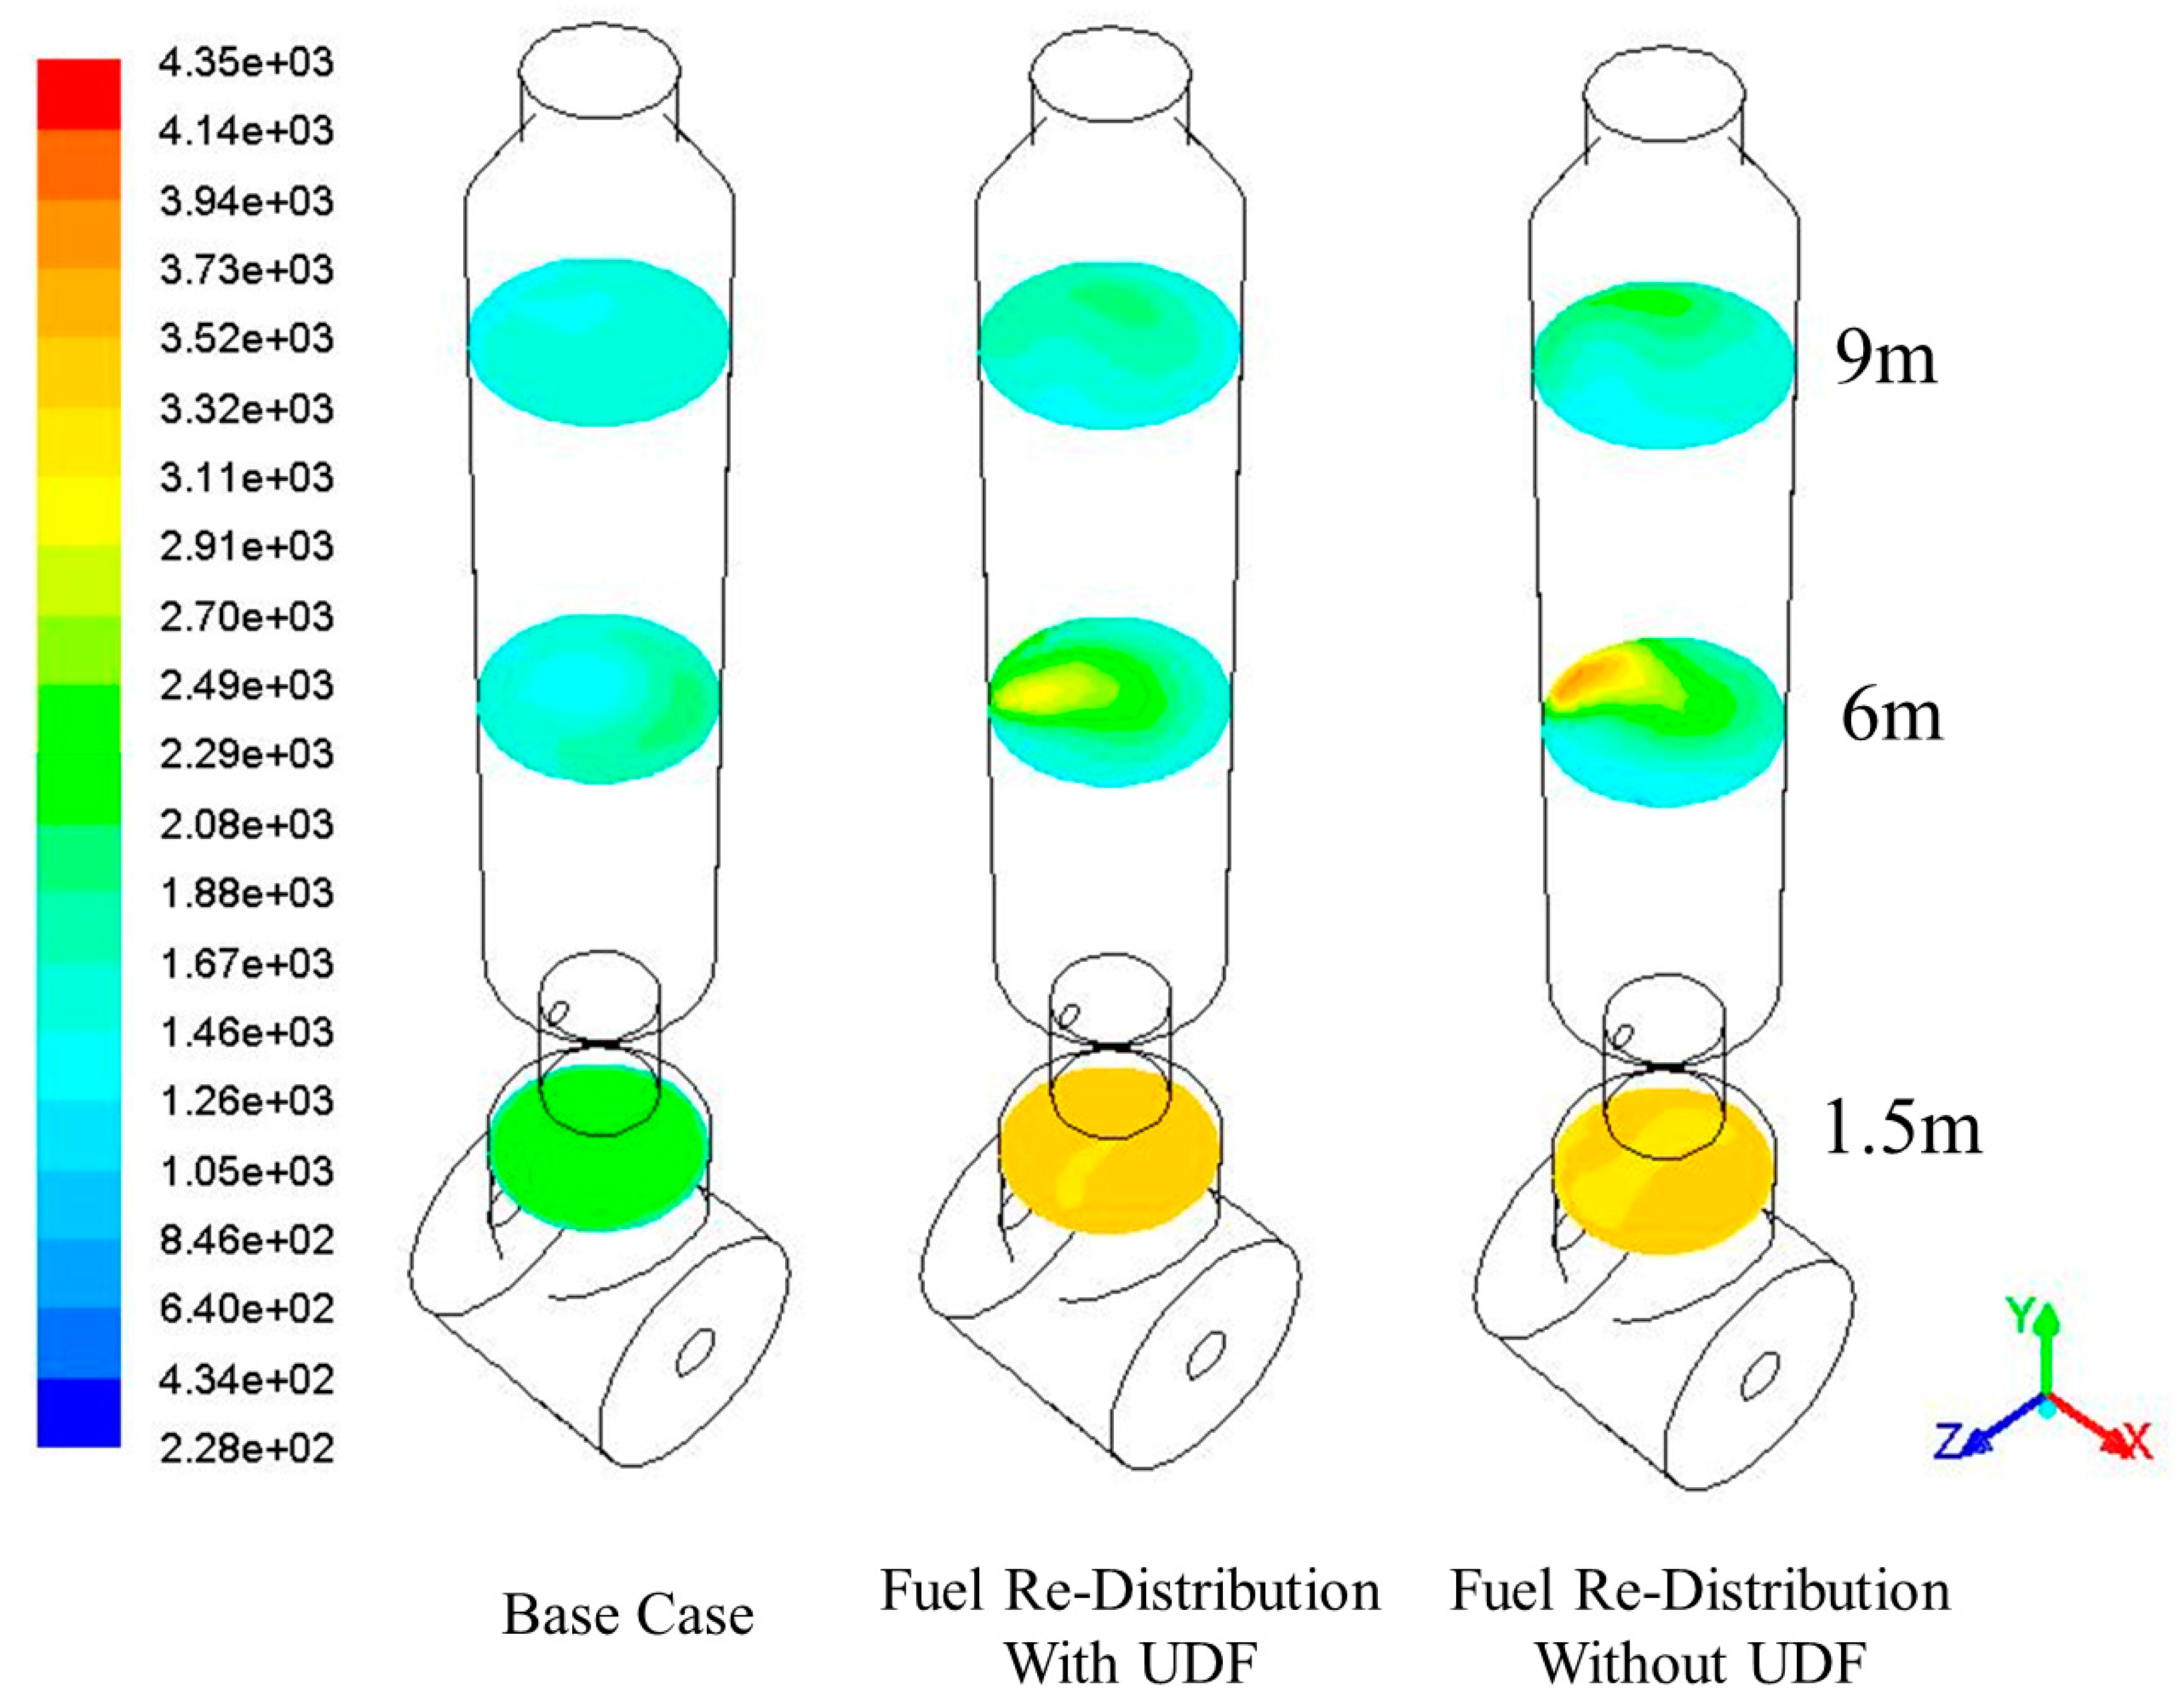
There are different flow and thermal patterns that are observed in the vicinity of the second-stage injector, due to unlike injection arrangements; however, with sufficiently large volume of the gasifiers and resident times, similar syngas compositions and outlet temperatures are achieved between E-Gas and E-STR without char recycling. Higher interior temperature is obtained in E-STR because all coal slurry is fed at the 2nd stage rather than being separately injected as in an E-Gas gasifier. This also leads to longer particle residence time at the second stage for E-STR.
Since detailed operation data have not yet been available, the recycling and reaction rates of char were investigated to search for reasonable operating characteristics, based on the chemical reactions built in the present CFD model. It seems that reasonable performance characteristics can be achieved in the case of 15% char recycle, which was then selected for subsequent studies.
Incorporating the volatiles condensation-only sub-model results in the formation of about 6.47% liquid volatiles and an increase of outlet temperature about 135 K, due to the release of latent heat. When the re-vaporization model is incorporated together with the condensation model, under the test condition, the liquid volatiles re-vaporize with an amount depending on the set point of evaporation temperature. It is thus concluded that the volatiles condensation and re-vaporization sub-models have been successfully developed and implemented. These sub-models will be useful under the condition that the gasifier temperature is intentionally kept low, like in the E-STR gasifer.
Attempts have been made to reduce the reactor temperature by changing the fuel feeding mass distribution between the first and second stages, as well as changing the oxygen/coal ratio. By introducing 20% coal-slurry at the 1st stage and feeding the recycled char at the 2nd stage, the temperature is reduced near the 1st injector but is increased at the 2nd stage. Under the studied condition, the present model can’t predict reduced temperature inside the E-STR gasifier as claimed by the manufacturer [
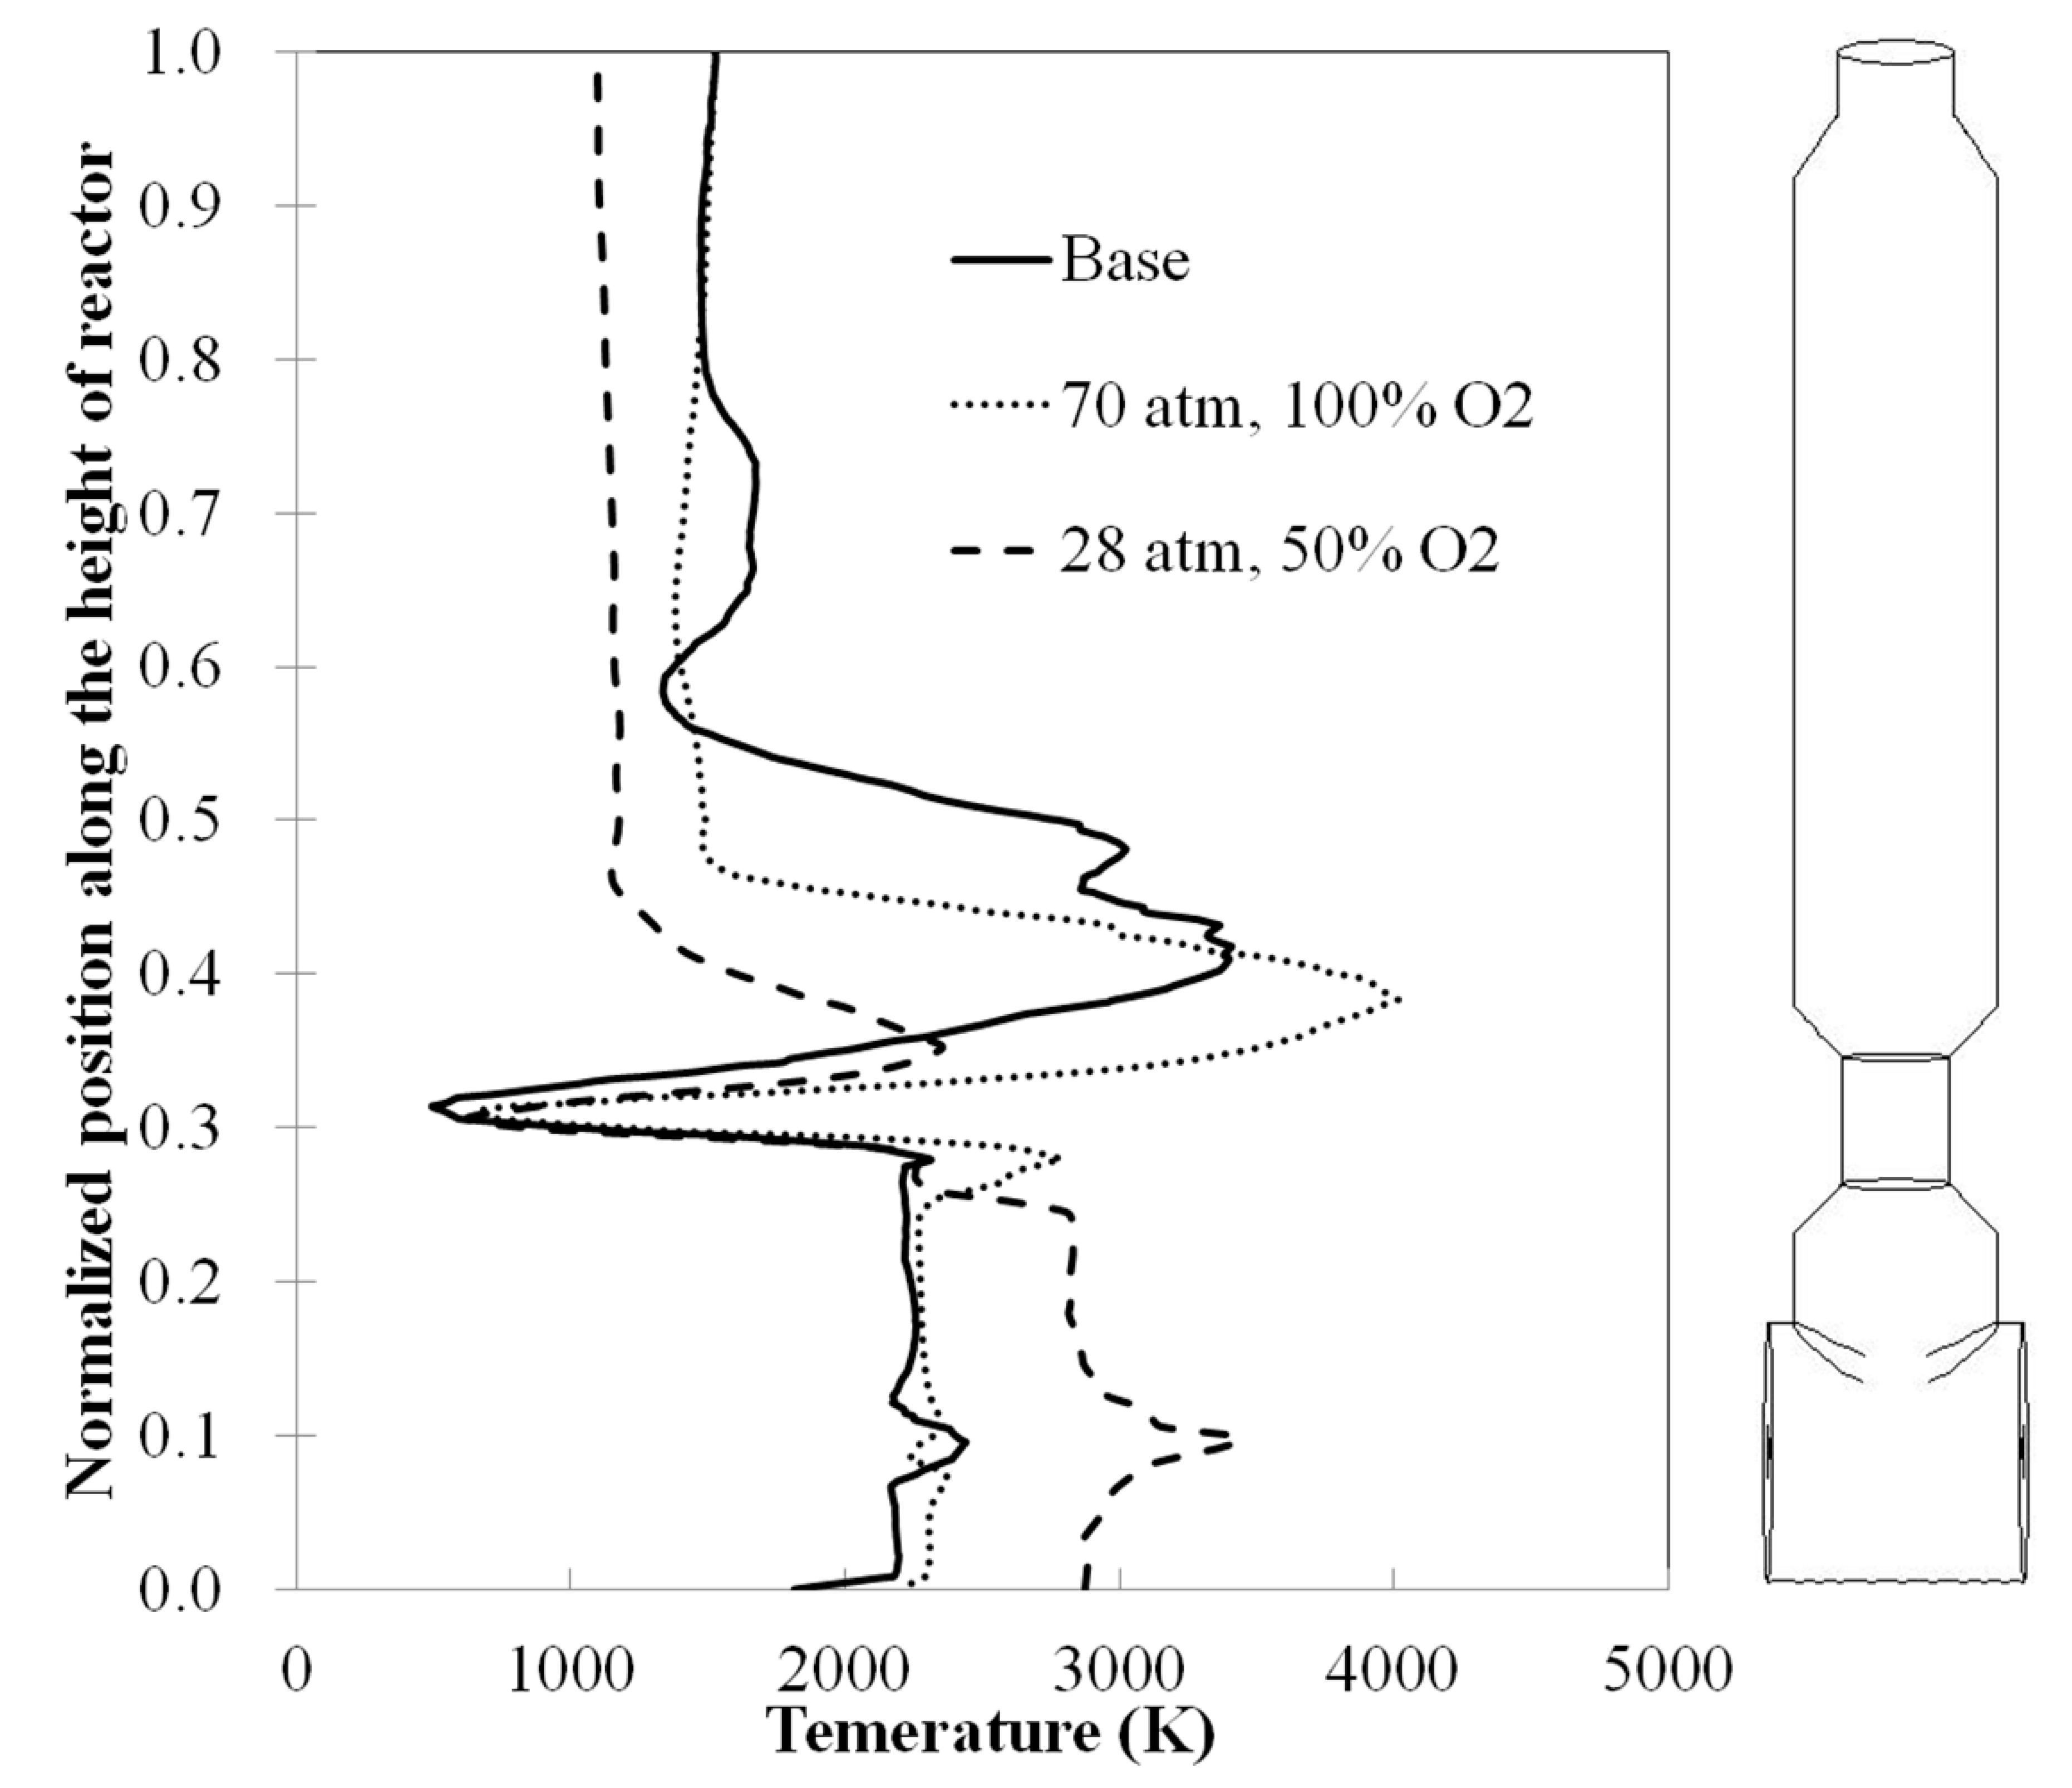
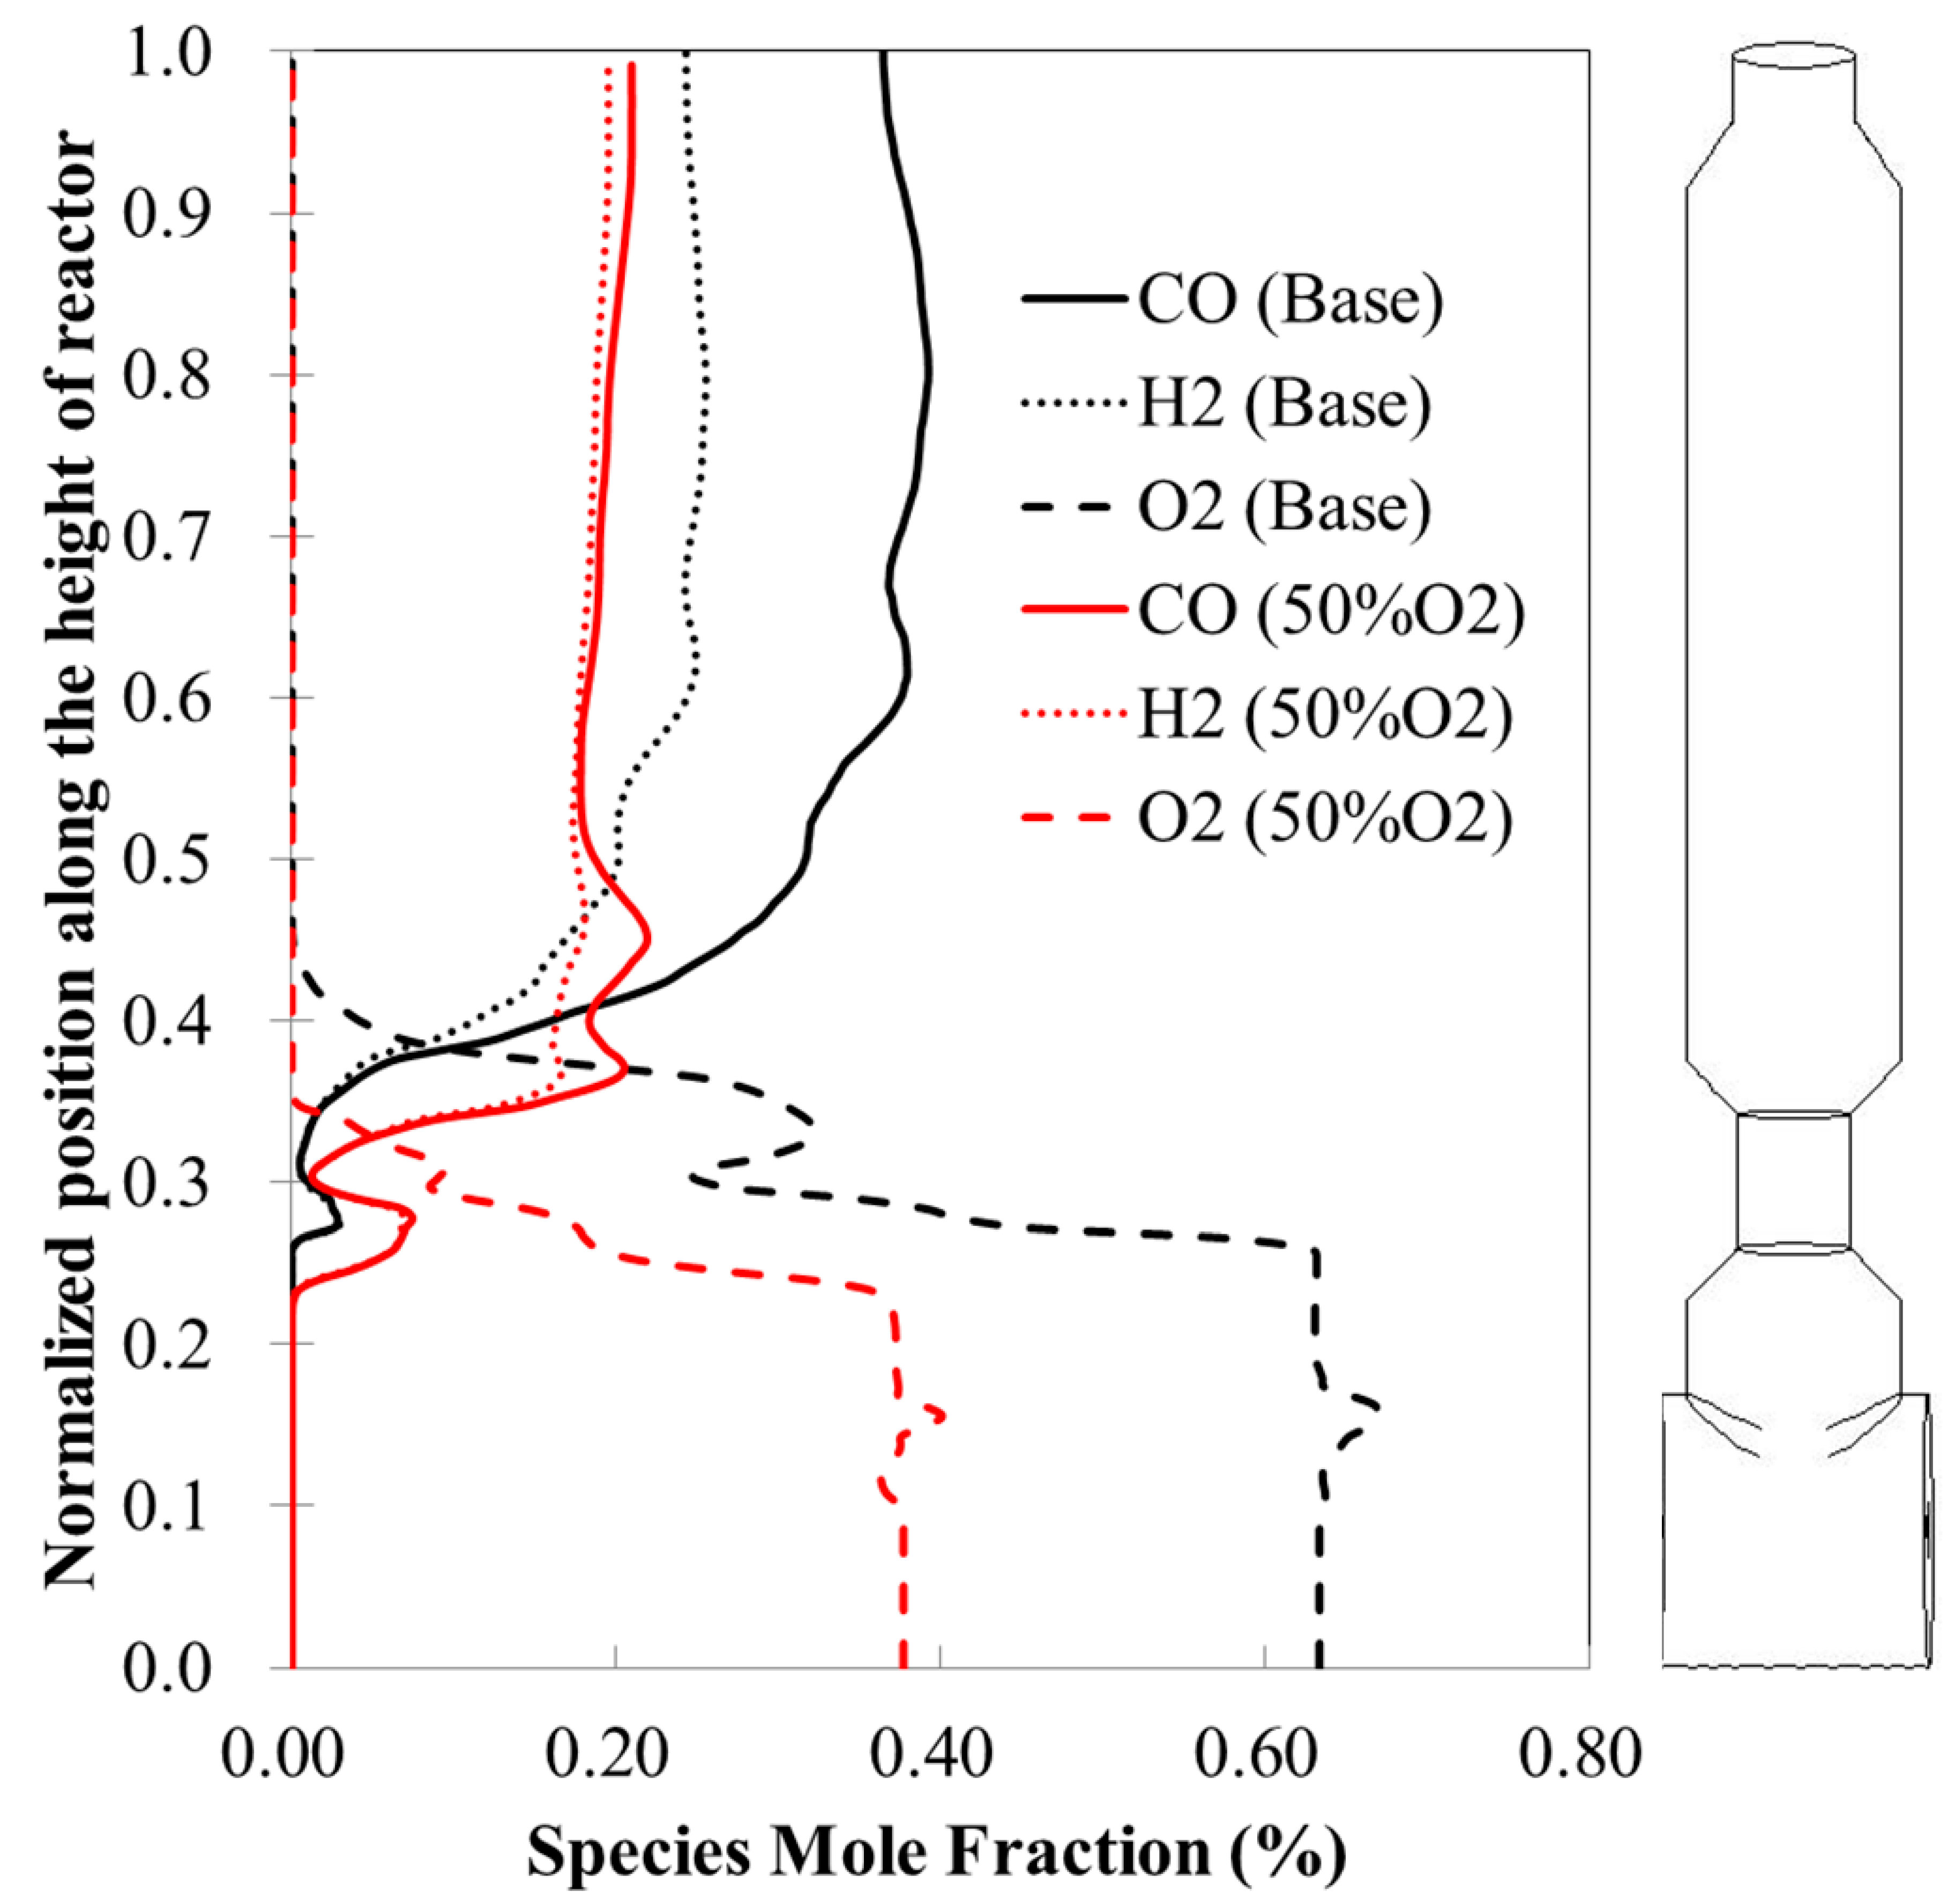
3]. By reducing the oxygen/coal ratio from 0.92 to 0.46 (i.e., with a 50% reduction), the temperature inside the gasifier increases near the 1st stage but reduces to a lower temperature level for the rest of the gasifier, with a reduction of exit temperature from 1463 K to 1100 K.
When the higher operational pressure is employed (70 atm), the temperature increases at the 2nd stage. The mole fractions of both H2 and CO in the exit syngas as well as HHV increase, but the outlet temperature maintains about the same.
In summary, it is shown that a CFD model has been modified from its precedent and implemented with the volatiles’ condensation and re-vaporization sub-models to study the gasification process in the newly developed E-STR gasifiers. The overall result indicates that operations with high pressure at 70 atm and low stoichiometric ratio lead to favorable higher H2/CO ratios suitable for producing synthetic natural gas (SNG). It is perceived that high char recycling rate and reduced O2/Coal ratio are effective to reduce the temperature at the 2nd stage of the gasifier, but this could compromise the gasification performance. Hence, more efforts should be devoted to optimizing the char recycling rate.

Author Contributions

Conceptualization, T.W.; Methodology, M.-H.C. and Y.-P.C.; Software, M.-H.C.; Validation, M.-H.C.; Formal Analysis, M.-H.C.; Investigation, M.-H.C.; Resources, Y.-P.C.; Data Curation, M.-H.C.; Writing—Original Draft Preparation, M.-H.C.; Writing—Review and Editing, Y.-P.C., and T.W.; Visualization, M.-H.C.; Supervision, T.W.; Project Administration, Y.-P.C.; Funding Acquisition, Y.-P.C.

Acknowledgments

This research is supported by the governmental grant allocated to the INER (Institute of Nuclear Energy Research) R&D program, “Clean Carbon as Sustainable Energy (CaSE)”, under the framework of National Energy Program (NEP) of Taiwan, ROC.

Conflicts of Interest

The authors declare no conflict of interest.

References

  1. BP. Statistical Review of World Energy 2014; BP: London, UK, 2014. [Google Scholar]
  2. Luan, Y.-T.; Chyou, Y.-P.; Wang, T. Numerical analysis of gasification performance via finite-rate model in a cross-type two-stage gasifier. Int. J. Heat Mass Transf. 2013, 57, 558–566. [Google Scholar] [CrossRef]
  3. Tsang, A.; Keeler, C. E-STRTM Technology Development for Lignite Gasification. In Proceedings of the Gasification Technologies Conference, Washington, DC, USA, 3 November 2010. [Google Scholar]
  4. Chyou, Y.-P.; Chen, M.-H.; Luan, Y.-T.; Wang, T. Investigation of the Gasification Performance of Lignite Feedstock and the Injection Design of a Cross-Type Two-Stage Gasifier. Energy Fuels 2013, 27, 3110–3121. [Google Scholar] [CrossRef]
  5. Wen, C.Y.; Chaung, T.Z. Entrainment Coal Gasification Modeling. Ind. Eng. Chem. Process Des. Dev. 1979, 18, 684–695. [Google Scholar] [CrossRef]
  6. Fletcher, D.F.; Haynes, B.S.; Christo, F.C.; Joseph, S.D. A CFD based combustion model of an entrained flow biomass gasifier. Appl. Math. Model. 2000, 24, 165–182. [Google Scholar] [CrossRef]
  7. Hernandez, J.J.; Aranda-Almansa, G.; Bula, A. Gasification of biomass wastes in an entrained flow gasifier: Effect of the particle size and the residence time. Fuel Process. Technol. 2010, 91, 681–692. [Google Scholar] [CrossRef]
  8. Slezak, A.; Kuhlman, J.M.; Shadle, L.J.; Spenik, J.; Shi, S. CFD simulation of entrained-flow coal gasification: Coal particle density/size fraction effects. Powder Technol. 2010, 203, 98–108. [Google Scholar] [CrossRef]
  9. Ni, J.; Yu, G.; Guo, Q.; Dai, Z.; Wang, F. Modeling and comparison of different syngas cooling types for entrained-flow gasifier. Chem. Eng. Sci. 2011, 66, 448–459. [Google Scholar] [CrossRef]
  10. Chen, C.; Horio, M.; Kojima, T. Use of numerical modeling in the design and scale-up of entrained flow coal gasifiers. Fuel 2001, 80, 1513–1523. [Google Scholar] [CrossRef]
  11. Choi, Y.C.; Li, X.Y.; Park, T.J.; Kim, J.H.; Lee, J.G. Numerical study on the coal gasification characteristics in an entrained flow coal gasifier. Fuel 2001, 80, 2193–2201. [Google Scholar] [CrossRef]
  12. Vicente, W.; Ochoa, S.; Aguillón, J.; Barrios, E. An Eulerian model for the simulation of an entrained flow coal gasifier. Appl. Therm. Eng. 2003, 23, 1993–2008. [Google Scholar] [CrossRef]
  13. Stephen, E.Z.; Guenther, C. Gasification CFD Modeling for Advanced Power Plant Simulations; National Energy Technology Laboratory: Morgantown, WV, USA, 2005. [Google Scholar]
  14. Shi, S.P.; Zitney, S.E.; Shahnam, M.; Syamlal, M.; Rogers, W.A. Modelling coal gasification with CFD and discrete phase method. J. Energy Inst. 2006, 79, 217–221. [Google Scholar] [CrossRef]
  15. Watanabe, H.; Otaka, M. Numerical simulation of coal gasification in entrained flow coal gasifier. Fuel 2006, 85, 1935–1943. [Google Scholar] [CrossRef]
  16. Slezak, A.A.J. Modeling of particle trajectories of coal size and density fractions in a gasifier. Master’s Thesis, West Virginia, Morgantown, WV, USA, 2008. [Google Scholar]
  17. Ajilkumar, A.; Sundararajan, T.; Shet, U.S.P. Numerical modeling of a steam-assisted tubular coal gasifier. Int. J. Therm. Sci. 2009, 48, 308–321. [Google Scholar] [CrossRef]
  18. Chen, C.; Horio, M.; Kojima, T. Numerical simulation of entrained flow coal gasifiers. Part I: modeling of coal gasification in an entrained flow gasifier. Chem. Eng. Sci. 2000, 55, 3861–3874. [Google Scholar] [CrossRef]
  19. Chen, C.; Horio, M.; Kojima, T. Numerical simulation of entrained flow coal gasifiers. Part II: effects of operating conditions on gasifier performance. Chem. Eng. Sci. 2000, 55, 3875–3883. [Google Scholar] [CrossRef]
  20. Silaen, A.; Wang, T. Effect of turbulence and devolatilization models on coal gasification simulation in an entrained-flow gasifier. Int. J. Heat Mass Transf. 2010, 53, 2074–2091. [Google Scholar] [CrossRef]
  21. Silaen, A.; Wang, T. Investigation of the coal gasification process under various operating conditions inside a two-stage entrained flow gasifier. In Proceedings of the 27th International Pittsburgh Coal Conference, Istanbul, Turkey, 11–14 October 2010. Paper 51-1. [Google Scholar]
  22. Silaen, A.; Wang, T. Comparison of instantaneous, equilibrium, and finite-rate gasification models in an entrained-flow coal gasifier. In Proceedings of the 26th International Pittsburgh Coal Conference, Pittsburgh, PA, USA, 20–23 September 2009. Paper 14-3. [Google Scholar]
  23. Silaen, A.; Wang, T.; Hsu, H.W.; Lo, M.C. Part-load simulations and experiments of a small coal gasifier. In Proceedings of the 23rd International Pittsburgh Coal Conference, 25–28 September 2006. Paper 20-3. [Google Scholar]
  24. Silaen, A.; Wang, T. Effects of fuel injection angles on performance of a two-stage coal gasifier. In Proceedings of the 23rd International Pittsburgh Coal Conference, 25–28 September 2006. Paper 20-4. [Google Scholar]
  25. Silaen, A. Simulation of Coal Gasification Process Inside a Two-Stage Gasifier. Master’s Thesis, University of New Orleans, New Orleans, LA, USA, 2004. Paper 198. [Google Scholar]
  26. Bockelie, M.J.; Denison, M.K.; Chen, Z.; Linjewile, T.; Senior, C.L.; Sarofim, A.F.; Holt, N. CFD Modeling for Entrained Flow Gasifiers. In Proceedings of the Gasification Technologies Conference, San Francisco, CA, USA, 28 October 2002. [Google Scholar]
  27. Jones, W.P.; Lindstedt, R.P. Global reaction schemes for hydrocarbon combustion. Combust. Flame 1988, 73, 233–249. [Google Scholar] [CrossRef]
  28. Lu, X.; Wang, T. Water–gas shift modeling in coal gasification in an entrained-flow gasifier. Part 1: Development of methodology and model calibration. Fuel 2013, 108, 629–638. [Google Scholar] [CrossRef]
  29. Lu, X.; Wang, T. Water–gas shift modeling in coal gasification in an entrained-flow gasifier. Part 2: Gasification application. Fuel 2013, 108, 620–628. [Google Scholar] [CrossRef]
  30. Launder, B.E.; Spalding, D.B. Lectures in Mathematical Models of Turbulence; Academic Press: London, UK, 1972. [Google Scholar]
  31. Smith, I.W. The combustion rates of coal chars: A review. Ninet. Symp. Combust. 1982, 19, 1045–1065. [Google Scholar] [CrossRef]
  32. Lefebvre, A.H. Atomization and Sprays; Hemisphere Publishing Corporation: Washington, DC, USA, 1989. [Google Scholar]
  33. Ranz, W.E.; Marshall, W.R. Evaporation from drops. Part 1. Chem. Eng. Prog. 1952, 48, 141–146. [Google Scholar]
  34. Ranz, W.E.; Marshall, W.R. Evaporation from drops. Part 2. Chem. Eng. Prog. 1952, 48, 173–180. [Google Scholar]
  35. Kuo, K.K. Principles of Combustion; John Wiley and Sons: New York, NY, USA, 1986. [Google Scholar]
  36. Cheng, P. Two dimensional radiating gas flow by a moment method. AIAA 1964, 2, 1662–1664. [Google Scholar] [CrossRef]
  37. Kobayashi, H.; Howard, J.B.; Sarofim, A.F. Coal devolatilization at high temperatures. Symp. Combust. 1977, 16, 411–425. [Google Scholar] [CrossRef]
  38. Zitney, S.E. CAPE-OPEN Integration for Advanced Process Engineering Co-Simulation; National Energy Technology Laboratory: Morgantown, WV, USA, 2005. [Google Scholar]
  39. Adiabatic Flame Temperature Calculator. Available online: http://elearning.cerfacs.fr/combustion/tools/adiabaticflametemperature/index.php (accessed on 31 January 2019).
Figure 1. Schematic of the computational model of E-STR.
Applsci 09 00510 g001
Figure 2. Comparison of particle resident time (seconds) for (a) E-STR model and (b) E-Gas model.
Applsci 09 00510 g002aApplsci 09 00510 g002b
Figure 3. Comparison of mid-plane temperature distributions for (a) E-STR model and (b) E-Gas model.
Applsci 09 00510 g003
Figure 4. Effect of fuel re-distribution on temperature distributions with and without condensation and re-vaporization sub-models.
Applsci 09 00510 g004
Figure 5. Comparison of temperature distribution on selected height for the case of fuel re-distribution with and without condensation and re-vaporization sub-models.
Applsci 09 00510 g005
Figure 6. Comparison of temperature distributions under two pressures and two oxygen supply conditions.
Applsci 09 00510 g006
Figure 7. Comparison of CO, H2 and O2 distributions with half oxygen-fed condition at 28 atm.
Applsci 09 00510 g007
Table 1. Global reaction rate constants in this study.
ReactionArEr (J/kmol)
C(s) + 1/2O2 → CO0.0526.1E+07
C(s) + CO2 → 2CO0.07321.125E+08
C(s) + H2O → CO + H2 0.07821.15E+08
CO + 1/2O2 → CO2 2.2E+121.67E+08
H2 + 1/2O2 → H2O6.8E+151.68E+08
CH2.761O0.264 → 0.479H2 + 0.264CO + 0.356CH4 + 0.19C2H2 Eddy-dissipation rate only
C2H2 + O2 → 2CO + H2
CH4 + 1/2O2 → CO + 2H2
CO + H2O → CO2 + H22.75E+028.38E+07
Table 2. Proximate analysis of feedstock coal.
Proximate Analysis (wt. %)Illinois #6 Coal
wet
Moisture11.12
Ash9.7
Volatiles34.99
Fixed Carbon44.19
sum100
HHV (MJ/kg)27.1
Table 3. Ultimate analysis of feedstock coal.
Ultimate Analysis (wt. %)Illinois #6 Coal
wet
Moisture11.12
C63.75
H4.5
N1.25
Cl0.29
O6.88
S2.51
Ash9.7
sum100
Table 4. Feedstock and operating conditions of the base case.
Flow rate (tons/day)
- Coal (as received):2545
- Slurry water:831
- Coal slurry:3376
First Stage Flow rate (tons/day)
- Oxidant:1947
Second Stage Flow rate (tons/day)
- Oxidant:3376
Operating Condition:
- Pressure (atm):28/70
- Inlet Oxidant Temp. (K):411
- Inlet Feedstock Temp. (K):450
Operating Parameters:
- O2/Coal (DAF):0.92
- Coal (MF)/Coal Slurry:0.67
- O2/C:1.14
- H2O/C:0.69
Table 5. Properties of coal particles.
Particle diameter (μm)Minimum10
Maximum50
Mean30
Particle distributionRosin–Rammler
Density (kg/m3)1400
Specific heat (J/kg-K)1680
Thermal Conductivity (W/m-K)0.33
Emissivity0.9
Scattering Factor0.6
Table 6. Exit syngas temperature and major species of base case.
ParametersValidation CaseReference [38]
Mole fraction (%)CO36.2435.90
H222.2322.90
CO212.6912.20
H2O18.0523.90
Exit temperature (K)1803- *
* It is estimated that the value is around ~1600 K.
Table 7. Exit syngas compositions and temperature of benchmark E-STR case and E-Gas.
ParametersE-GasE-STR Base
Mole fraction (%)CO40.144.1
H218.416.5
CO29.75.9
H2O21.424.4
Exit temperature (K)18911894
Table 8. Effect of condensation and re-vaporization sub-model.
PropertySpeciesBase Case *Condensation OnlyBoth Sub-Models
Mole fraction (%) #CO36.9135.4238.8
H224.4821.4626.7
CO210.0710.438.11
H2O20.6119.9818.33
CH42.271.292.45
Volatiles (G)1.05 × 10−63.68 × 10−64.25 × 10⁻⁷
Volatiles (L)-6.470
Unreacted Char (%)201118
Temperature (K)146315981505
# Some species with small fractions (e.g., N2, C2H2, SiO2) are not listed here. * Condensation and recycling of the unreacted char are not included in this base case.
Table 9. Effect of fuel-redistribution on syngas composition and exit temperature with and without condensation and re-vaporization sub-models.
PropertySpeciesBase2-Stage Fuel with Sub-Models2-Stage Fuel without Sub-Models
Mole fraction (%)CO36.9136.4234.41
H224.4824.1622.63
CO210.0711.5612.74
H2O20.6118.5820.24
CH42.273.043.65
Volatiles (G)1.05 × 10−64.47 × 10−74.76 × 10⁻⁷
Volatiles (L)-0-
Unreacted Char (%)201512
Exit Temperature (K)146316151558
HHV (MJ/kg)8.157.917.33
Table 10. Effect of operating pressure and oxygen amount on syngas composition and exit temperature.
PropertySpeciesBase70 atm
100% O2
28 atm
50% O2
Mole fraction (%)CO36.9140.8121.89
H224.4829.2119.97
CO210.0710.829.15
H2O20.6110.5234.13
CH42.272.845.35
Volatiles (G)1.05 × 10−61.3 × 10−96.1 × 10⁻⁵
Volatiles (L)-00
Unreacted Char (%)20082
Temperature (K)146315321100
HHV (MJ/kg)8.159.385.73

