Effect of In-Shoe Foot Orthosis Contours on Heel Pain Due to Calcaneal Spurs


Abstract
:Featured Application
Abstract
1. Introduction
2. Materials and Methods
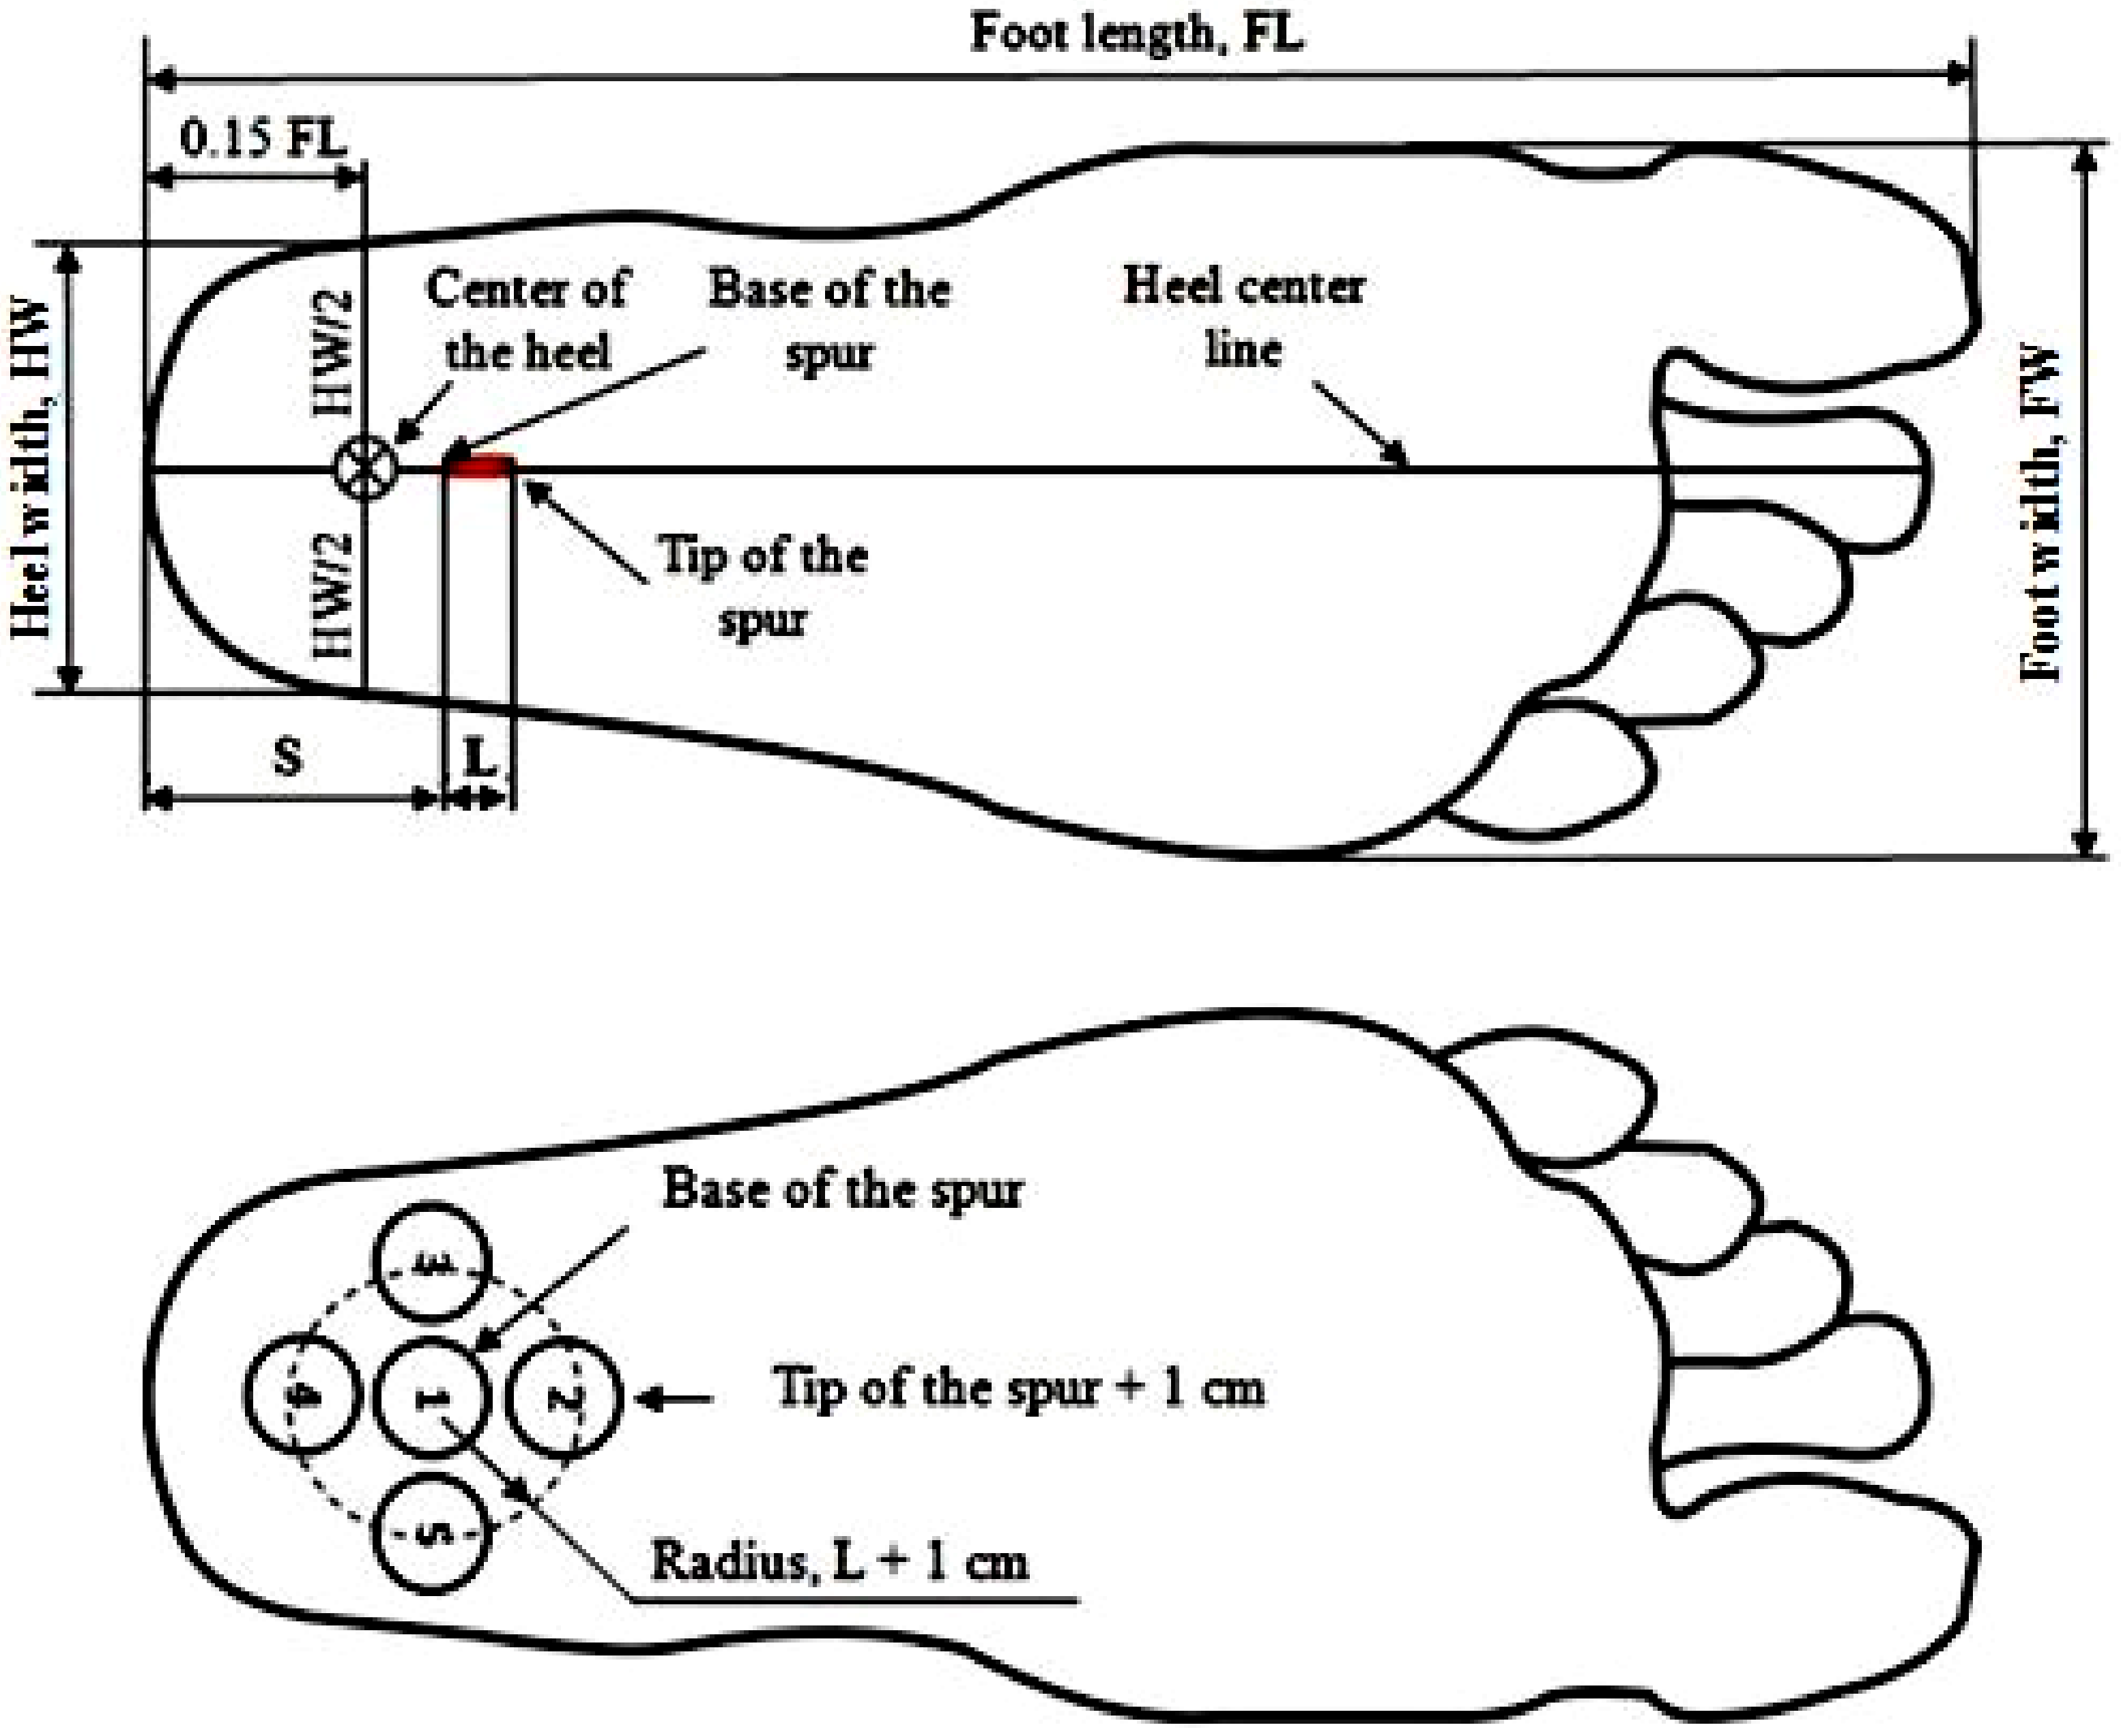
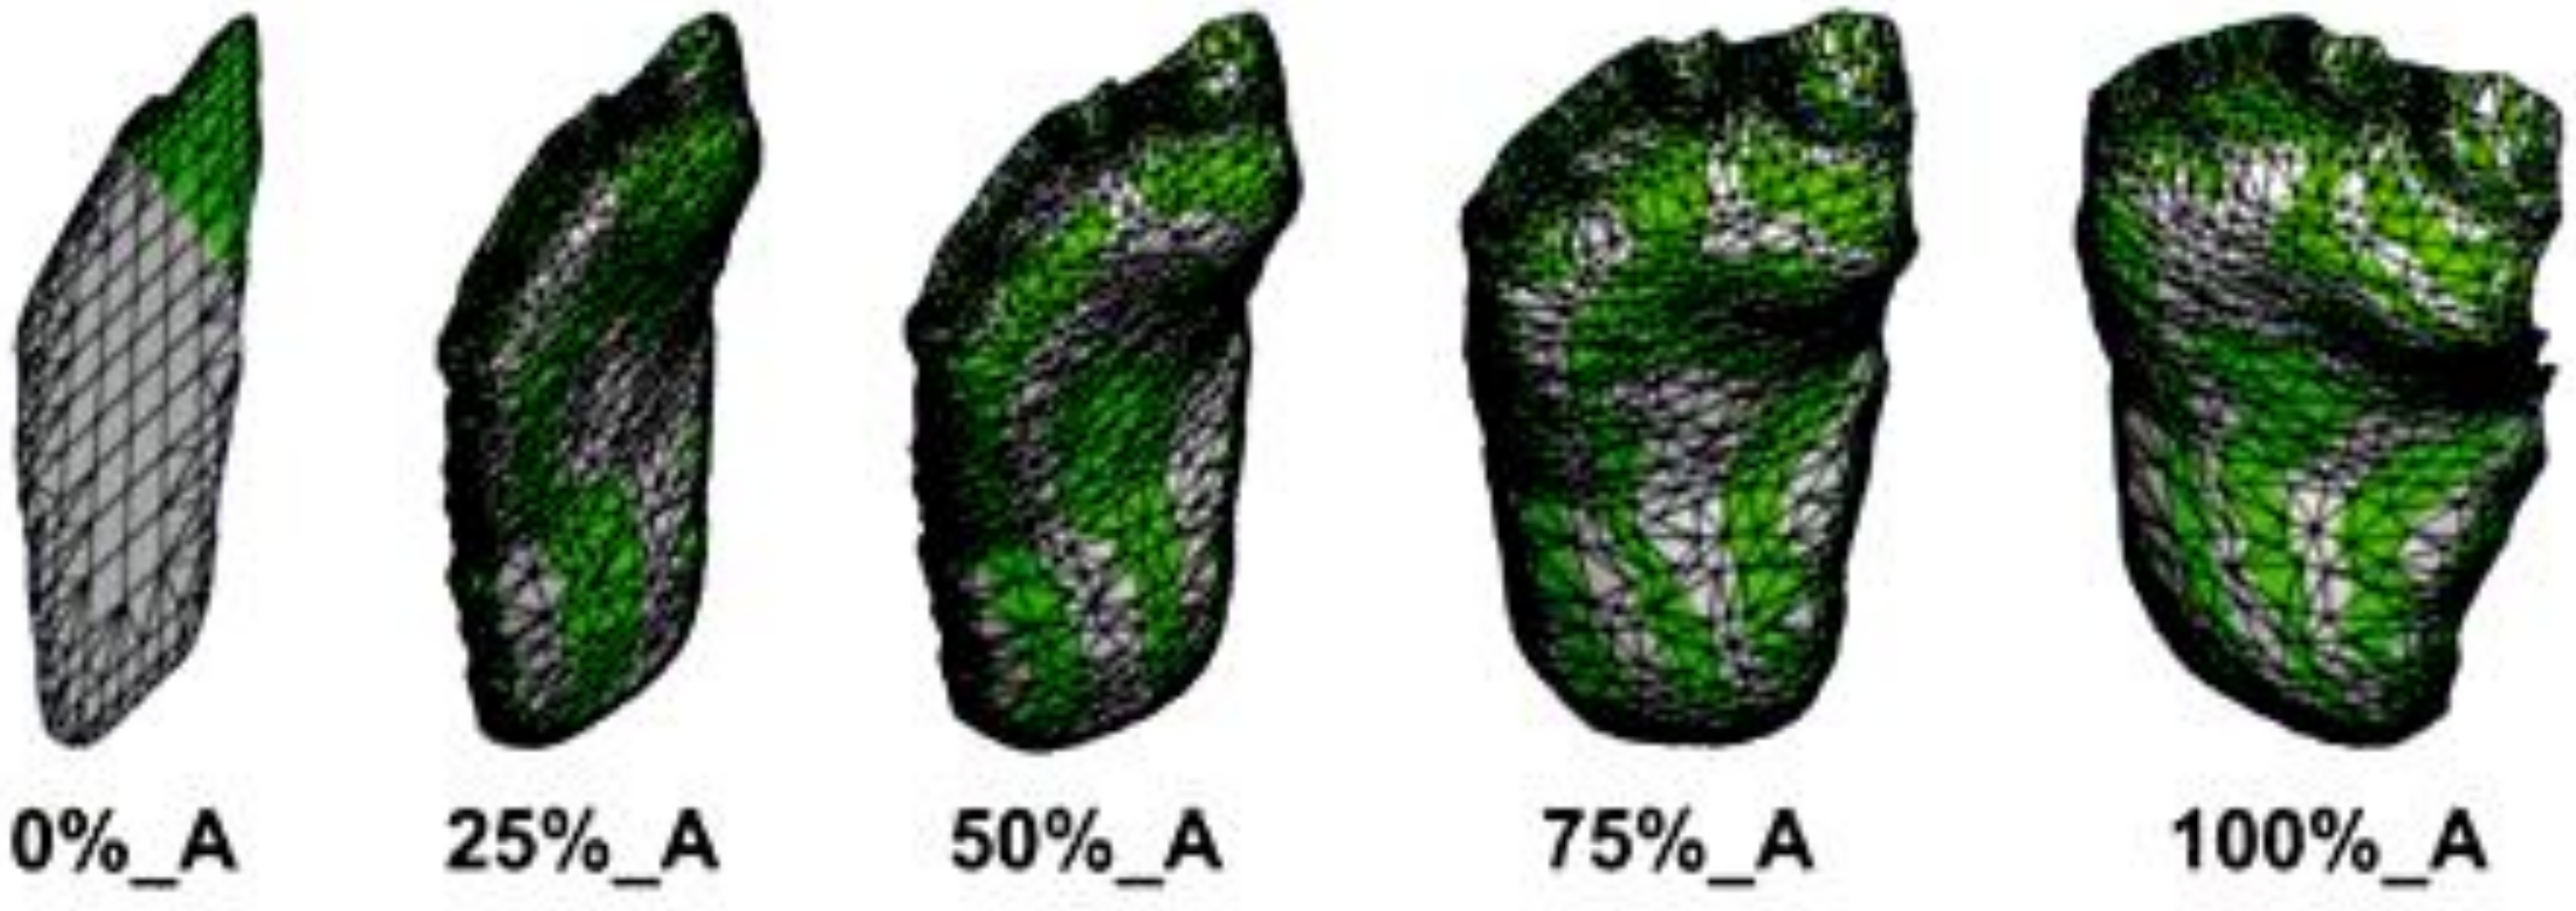
2.1. Determining the Contour of the Shoe Insole
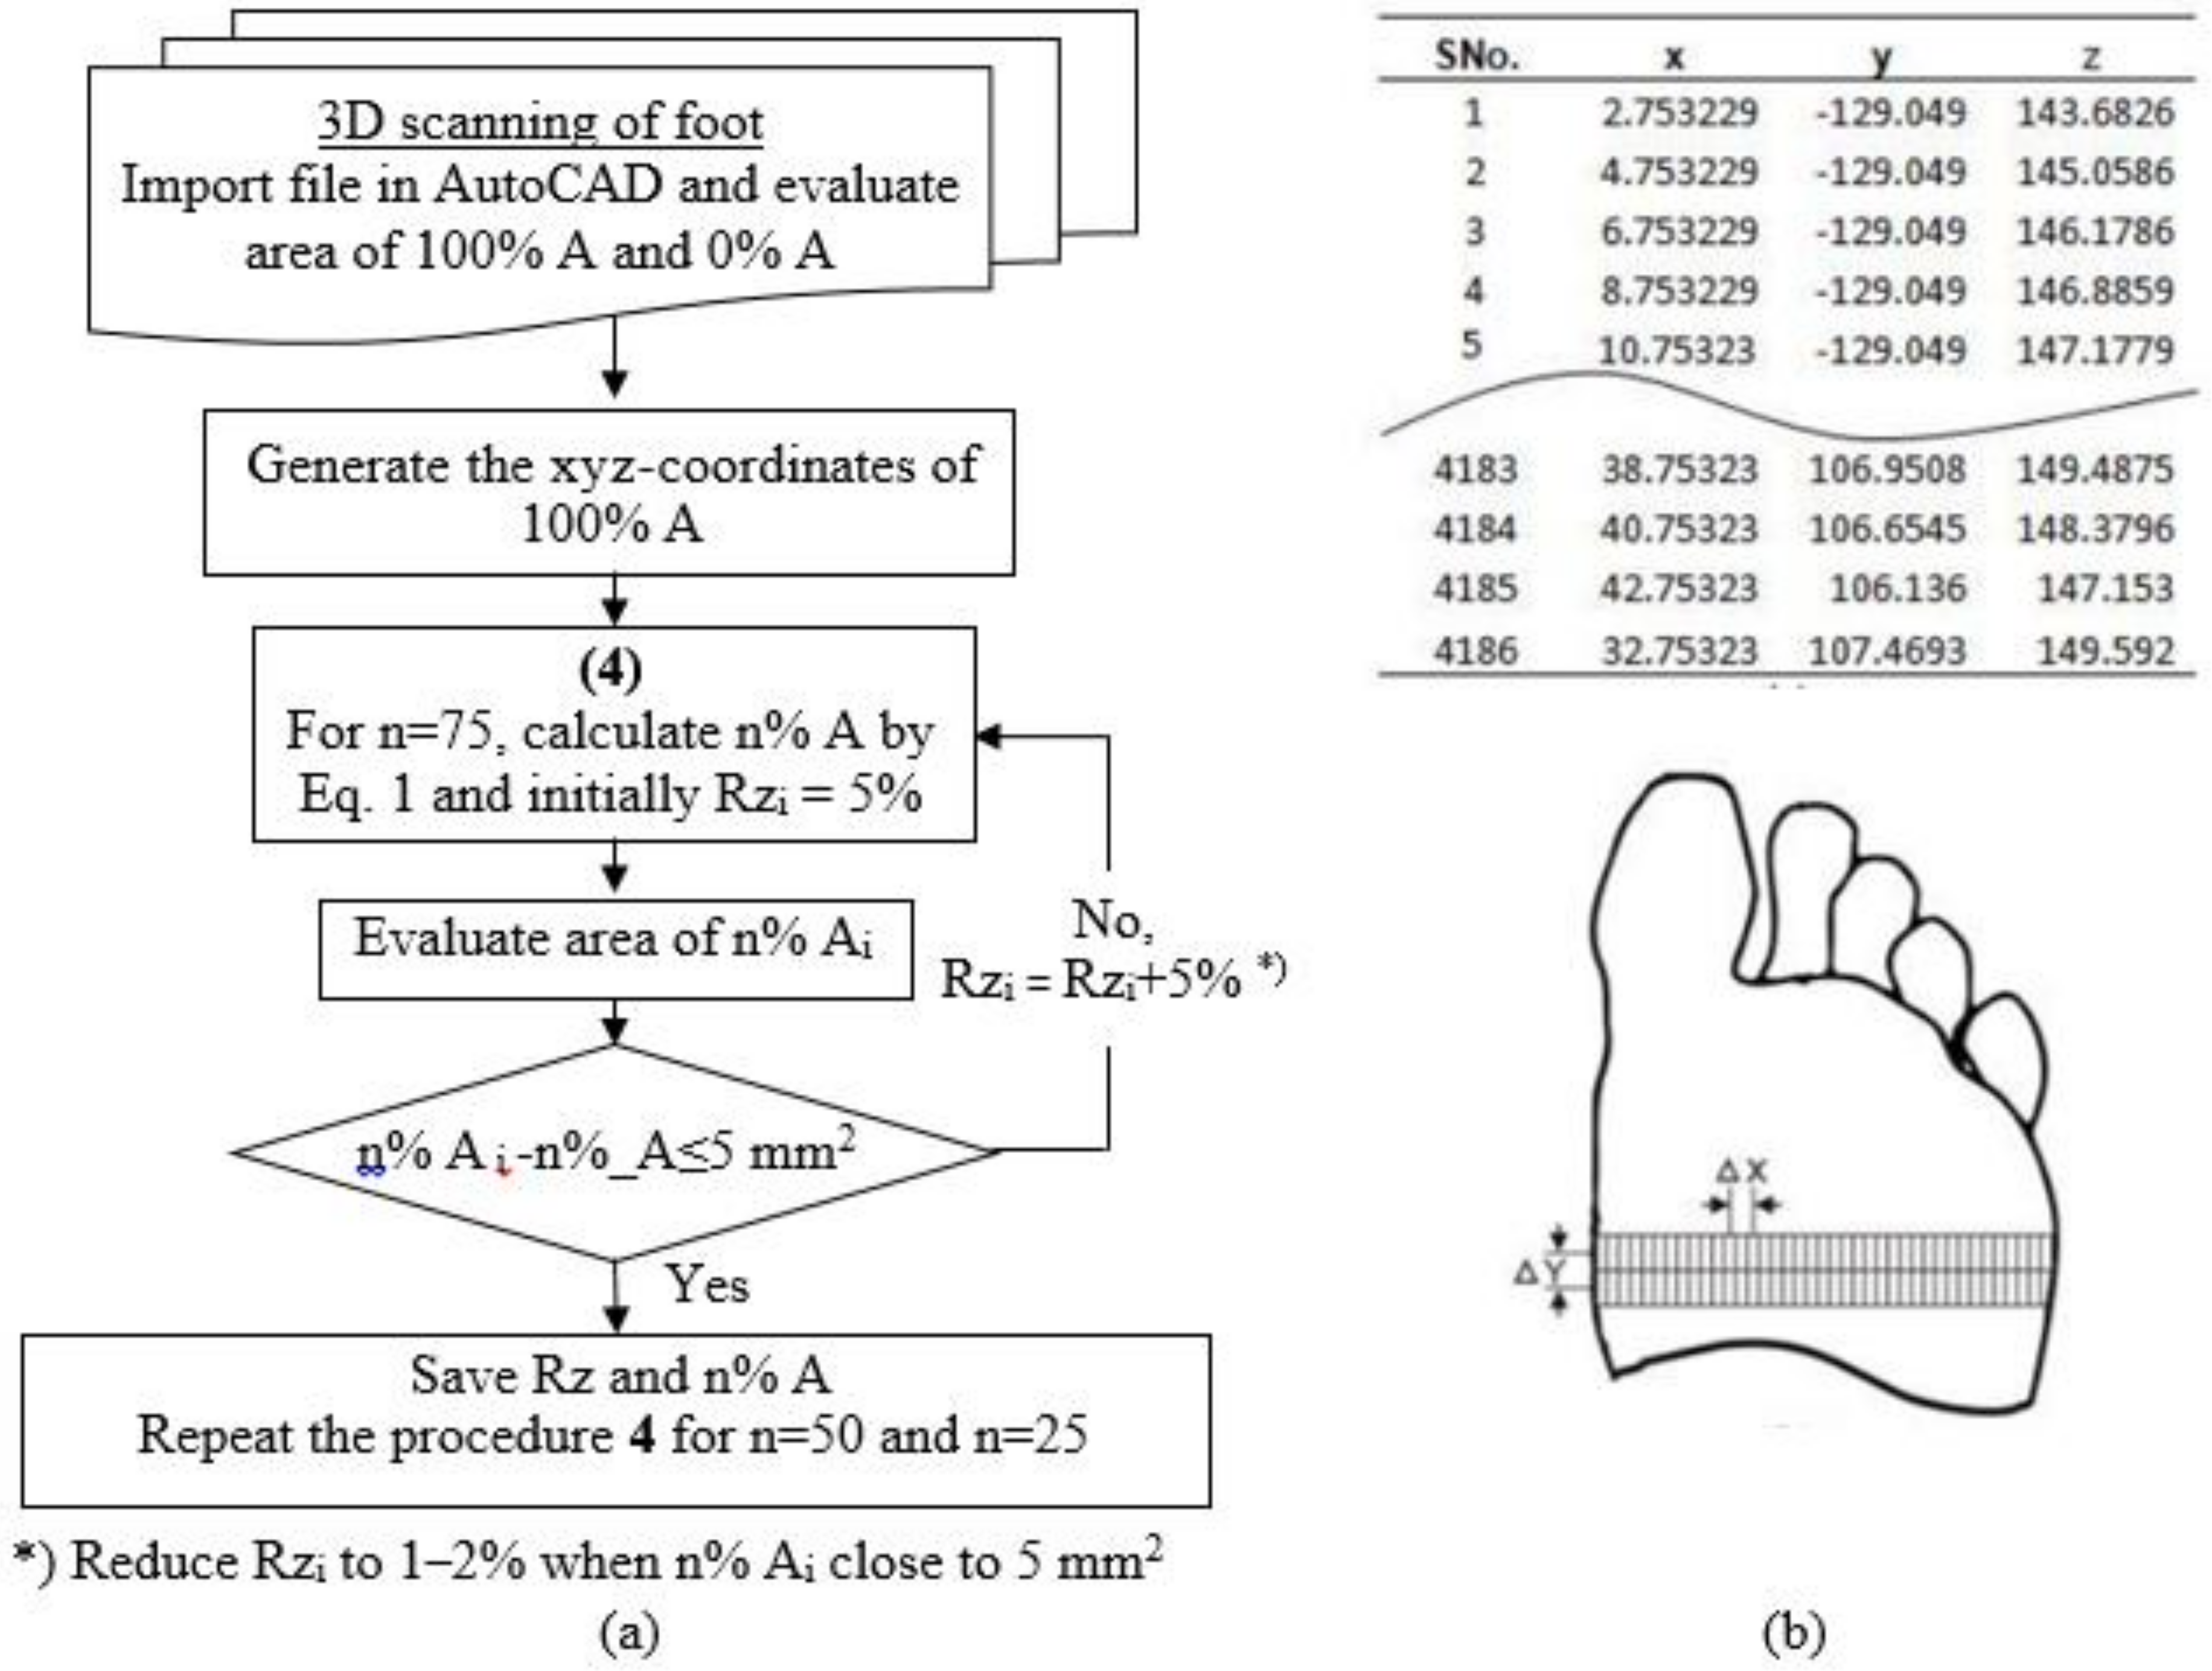
- (1)
- Evaluate the area 100% A and 0% A using Rhinoceros software.
- (2)
- Generate the xyz-coordinates of 100%_A by using Microsoft Excel which integrated with AutoCAD software as presented in Figure 3b.
- (3)
- Adjust the z-coordinates of 100% A to 75% A; initially specify a reduced percentage of 5% (reduced percentage z-coordinates of 100% A and 0% A are 0% and 100%, respectively) and display the coordinates in AutoCAD to evaluate its area using Rhinoceros software.
- (4)
- If the area is still much greater than 5 mm2 [28] compared with Equation (1), repeat the procedure four times by increasing the percentage of 5% reduction.
- (5)
- If the difference of area approaches 5 mm2, increase the percentage reduction to 1–2%.
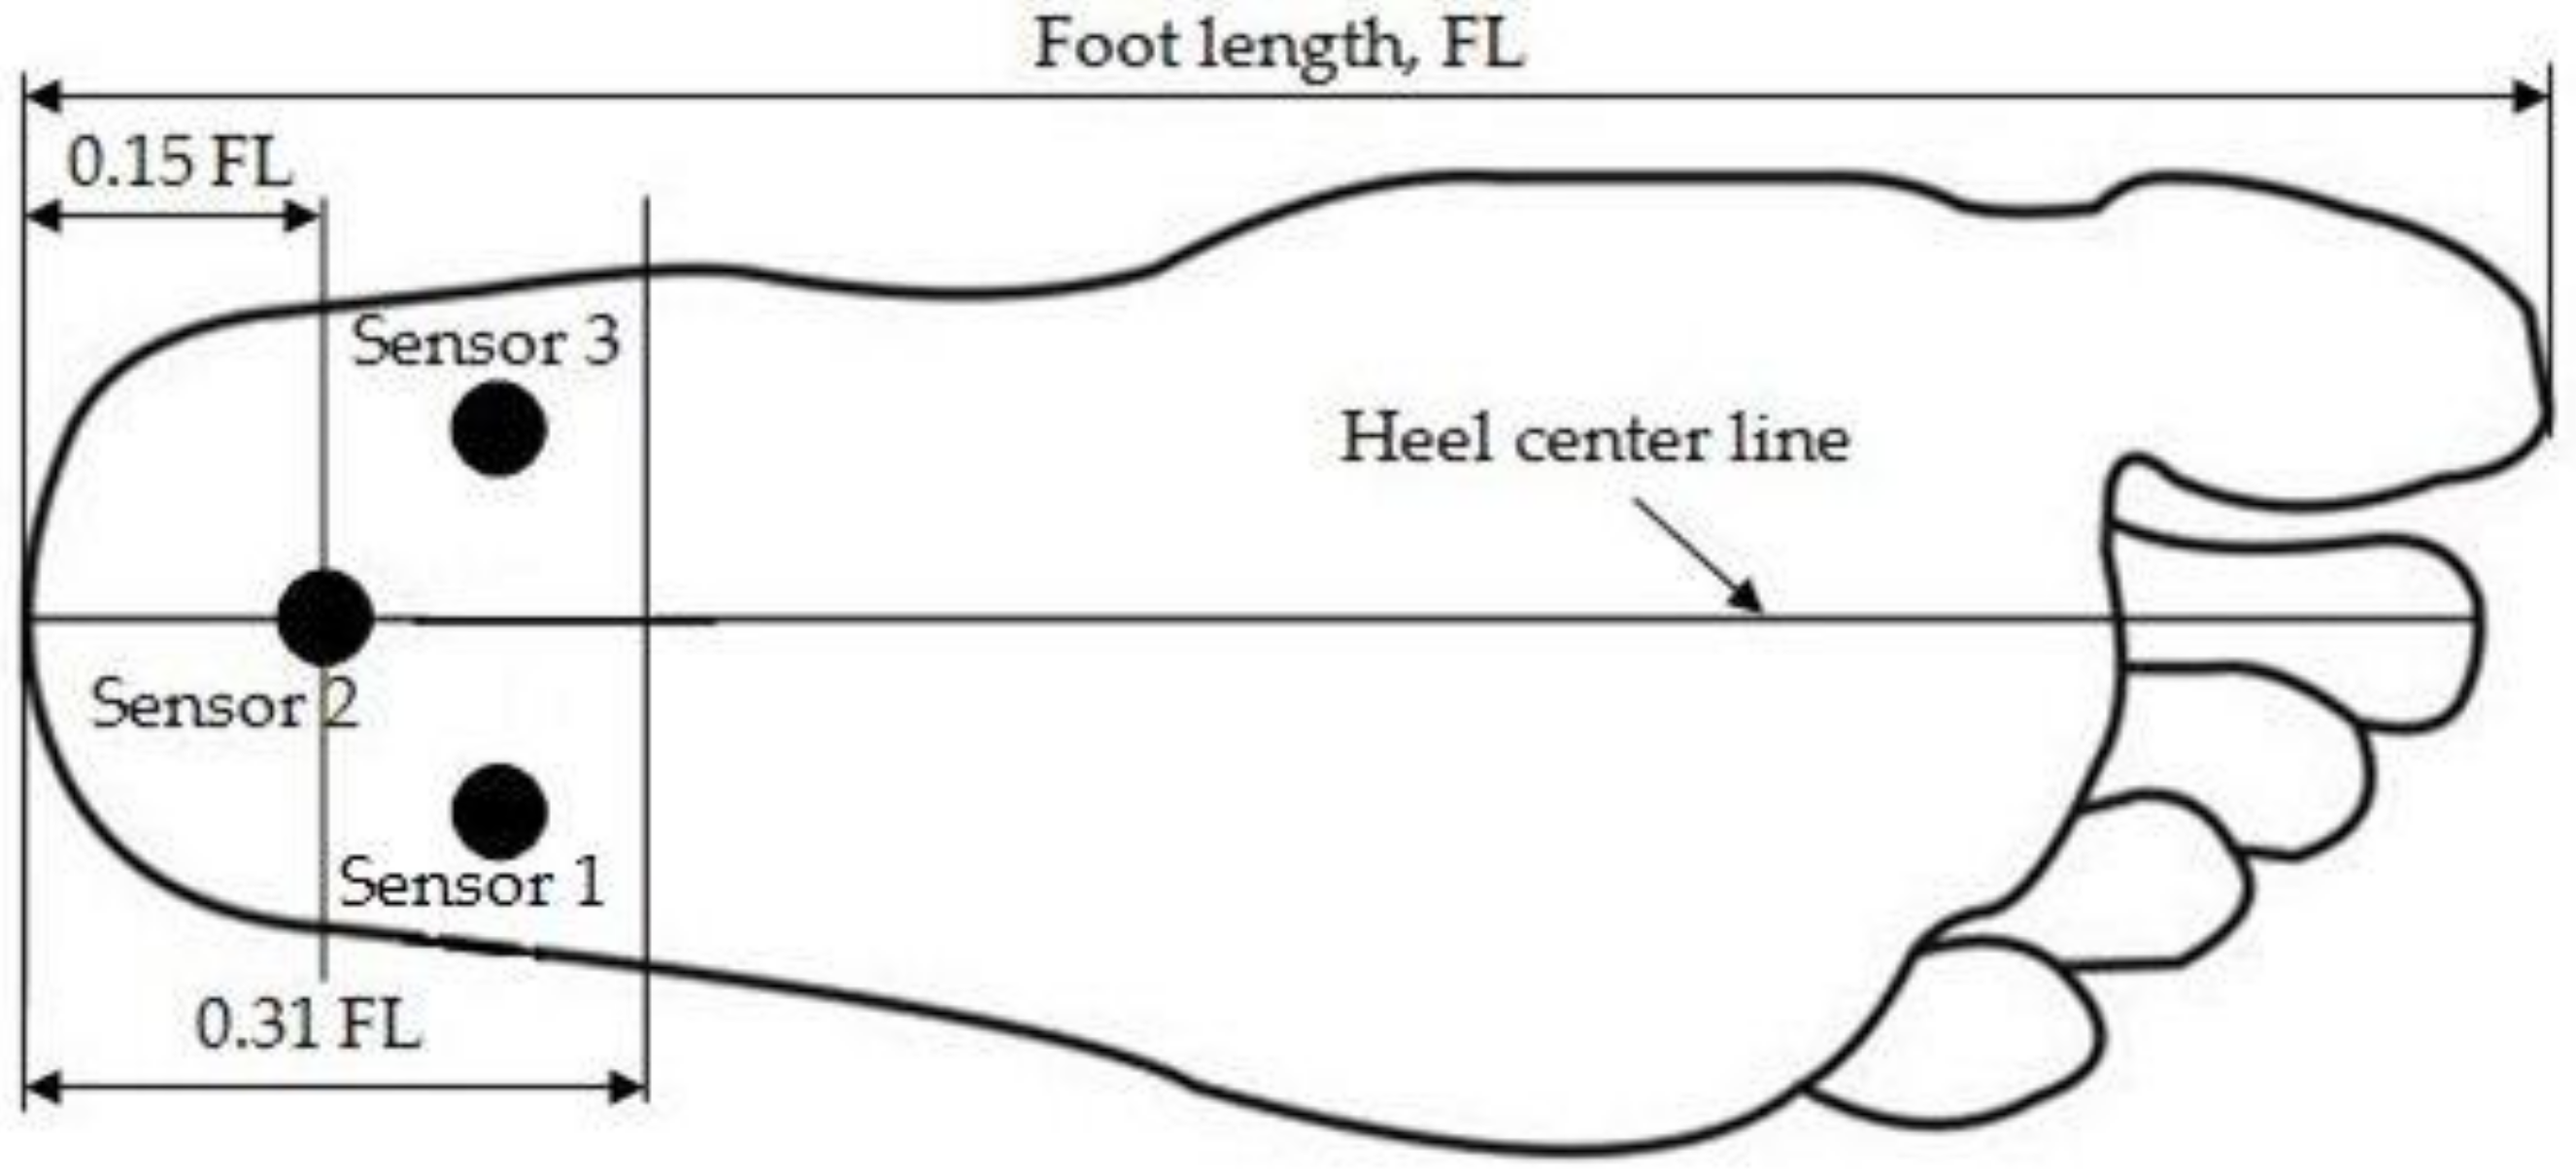
2.2. Measuring Pressure in Heel Area
3. Results
4. Discussion
5. Conclusions
Author Contributions
Acknowledgments
Conflicts of Interest
References
- Buchbinder, R. Clinical practice: Plantar fasciitis. N. Engl. J. Med. 2004, 350, 2159–2166. [Google Scholar] [CrossRef] [PubMed]
- McCarthy, D.J.; Gorecki, G.E. The anatomical basis of inferior calcaneal lesions: A cryomicrotomy study. J. Am. Podiatry Assoc. 1979, 69, 527–536. [Google Scholar] [CrossRef] [PubMed]
- Bartold, S.J. The Plantar Fascia as a Source of Pain – Biomechanics, Presentation and Treatment. J. Bodyw. Mov. Ther. 2004, 8, 214–226. [Google Scholar] [CrossRef]
- Barrett, S.L.; O’Malley, R. Plantar Fasciitis and Other Causes of Heel Pain. Am. Fam. Physician 1999, 59, 2200–2206. [Google Scholar] [PubMed]
- Smith, S.; Tinley, P.; Gilheany, M.; Grills, B. The inferior calcaneal spur-anatomical and histological considerations. Foot 2007, 17, 25–31. [Google Scholar] [CrossRef]
- Goff, J.D.; Crawford, R. Diagnosis and treatment of plantar fasciitis. Am. Fam. 2011, 84, 676–682. [Google Scholar]
- Zhou, B.; Zhou, Y.; Tao, X.; Yuan, C.; Tang, K. Classification of calcaneal spurs and their relationship with plantar fasciitis. J. Foot Ankle Surg. 2015, 54, 594–600. [Google Scholar] [CrossRef] [PubMed]
- Roberts, S. Scott’s Book on Plantar Fasciitis, Heel Spurs, and Heel Pain. Available online: http://heelspurs.com/_intro.html.
- Hyland, M.R.; Gaffney, A.; Cohen, L.; Lichtman, S.W. Randomized control trial of calcaneal taping, sham taping, and plantar fascia stretching for short-term management of plantar heel pain. J. Orthop. Sports Phys. Ther. 2006, 36, 364–371. [Google Scholar] [CrossRef]
- Thomas, J.L.; Christensen, J.C.; Kravitz, S.R.; Mendicino, R.W.; Schuberth, J.M.; Vanore, J.V.; Weil, L.S., Sr.; Zlotoff, H.J.; Bouché, R.; Baker, J. The Diagnosis and Treatment of Heel Pain: A Clinical Practice Guideline—Revision 2010. J. Foot Ankle Surg. 2010, 49, S1–S19. [Google Scholar] [CrossRef]
- Kogler, G.; Solomonidis, S.E.; Paul, P.J. Biomechanics of longitudinal arch support mechanics in foot orthoses and their effect on plantar aponeurosis strain. Clin. Biomech. 1998, 11, 243–252. [Google Scholar] [CrossRef]
- Kogler, G.; Veer, F.; Solomonidis, S.E.; Paul, PJ. The influence of medial and lateral placement of orthotic wedges on loading of the plantar aponeurosis. J. Bone Jt. Surg. Am. 1999, 81, 1403–1413. [Google Scholar] [CrossRef]
- Ozdemir, H.; Soyuncu, Y.; Ozgorgen, M.; Dabak, K. Effects of changes in heel fat pad thickness and elasticity on heel pain. J. Am. Podiatr. Med. Assoc. 2004, 94, 47–52. [Google Scholar] [CrossRef] [PubMed]
- Saban, B.; Masharawi, Y. Pain threshold tests in patients with heel pain syndrome. Foot Ankle Int. 2016, 37, 730–736. [Google Scholar] [CrossRef] [PubMed]
- Cheung, J.; Zhang, M. A 3-dimensional finite element model of the human foot and ankle insole design. Arch. Phys. Med. Rehabil. 2005, 86, 353–358. [Google Scholar] [CrossRef]
- Chia, J.K.; Suresh, S.; Kuah, A.; Ong, J.L.; Phua, J.M.; Seah, A.L. Comparative trial of the foot pressure patterns between corrective orthotics, formthotics, bone spur and flat insoles in patients with chronic plantar fasciitis. Ann. Acad. Med. Sing. 2009, 38, 869–875. [Google Scholar]
- Wibowo, D.B.; Harahap, R.; Widodo, A.; Haryadi, G.D.; Ariyanto, M. The effectiveness of raising the heel height of shoes to reduce heel pain in patients with calcaneal spurs. J. Phys. Ther. Sci. 2017, 29, 2068–2074. [Google Scholar] [CrossRef] [PubMed]
- Tsung, B.Y.S.; Zhang, M.; Fan, Y.B.; Boone, D.A. Quantitative comparison of plantar foot shapes under different weight-bearing conditions. J. Rehabil. Res. Dev. 2003, 40, 517–526. [Google Scholar] [CrossRef] [PubMed]
- Tsung, B.Y.S.; Zhang, M.; Mak, A.F.T.; Wong, M.W.N. Effectiveness of insoles on plantar pressure redistribution. JRRD 2004, 41, 6A. [Google Scholar] [CrossRef]
- Bousie, J.A.; Blanch, P.; McPoil, T.G.; Vicenzino, B. Contoured in-shoe foot orthoses increase mid-foot plantar contact area when compared with a flat insert during cycling. J. Sci. Med. Sport 2013, 16, 60–64. [Google Scholar] [CrossRef]
- Losito, J.M. Impression casting techniques. In Clinical Biomechanics of the Lower Extremity; Valmassy, R., Ed.; Mosby: St. Louis, MO, USA, 1996. [Google Scholar]
- Telfer, S.; Woodburn, J. The use of 3D surface scanning for the measurement and assessment of the human foot. J. Foot Ankle Res. 2010, 3, 19. [Google Scholar] [CrossRef]
- Stanković, K.; Booth, B.G.; Danckaers, F.; Burg, F.; Vermaelen, P.; Duerinck, S.; Sijbers, J.; Huysmans, T. Three-dimensional quantitative analysis of healthy foot shape: A proof of concept study. J. Foot Ankle Res. 2018, 11, 8. [Google Scholar] [CrossRef] [PubMed]
- Lee, Y.C.; Lin, G.; Wang, M.J. Comparing 3D foot scanning with conventional measurement methods. J. Foot Ankle Res. 2014, 7, 44. [Google Scholar] [CrossRef]
- Cavanagh, P.R.; Rodgers, M. The Arch index: A useful measure from footprints. J. Biomech. 1987, 20, 547–551. [Google Scholar] [CrossRef]
- Wagner Instruments. Wagner FPTX Series Economy Manual Pain Threshold Testers; PAIN TEST™ ALGOMETER: Greenwich, CT, USA; Available online: http://www.wagnerinstruments.com/products/pain-test-algometer/fpk-fpn (accessed on 1 February 2019).
- Wibowo, D.B.; Haryadi, G.D.; Priambodo, A. Estimation of foot pressure from human footprint depths using 3D scanner. AIP Conf. Proc. 2016, 1717, 040008. [Google Scholar] [CrossRef]
- Robinette, K.; Daanen, H. Precision of the CAESAR scan-extracted measurements. ApplErgon 2006, 37, 259–265. [Google Scholar] [CrossRef]
- Wibowo, D.B.; Haryadi, G.D.; Widodo, A.; Rahayu, S.P. Estimation of calcaneal loading during standing from human footprint depths using 3D scanner. AIP Conf. Proc. 2017, 1788, 030063. [Google Scholar] [CrossRef]
- Yung-Hui, L.; Wei-Hsein, H. Effects of shoe inserts and heel height on foot pressure, impact force, and perceived comfort during walking. Appl. Ergon. 2005, 36, 335–362. [Google Scholar] [CrossRef] [PubMed]
- Druga, C.; Serban, I. Study of foot pressure-sole pressure sensor. In Proceedings of the 7th International Conference on Computational Mechanics and Virtual Engineering (COMEC) 2017, Brasov, Rumania, 16–17 November 2017. [Google Scholar]
- Goske, S.; Erdemir, A.; Petre, M.; Budhabhatti, S. Reduction of plantar heel pressure: Insole design using finite element analysis. J. Biomech. 2006, 39, 2363–2370. [Google Scholar] [CrossRef] [PubMed]
- Boehm, R. The Foot & the Shoe: Measurement & Size; DARCO (Europe) GmbH: Raisting, Germany, 2015. [Google Scholar]
- Maiwald, C.; Grau, S.; Krauss, I.; Mauch, M.; Axmann, D.; Horstmann, T. Reproducibility of plantar pressure distribution data in barefoot running. J. Appl. Biomech. 2008, 24, 14–23. [Google Scholar] [CrossRef]
- Cavanagh, P.R.; Rodgers, M.; Liboshi, A. Pressure distribution under symptom-free feet during barefoot standing. Foot Ankle Int. 1987, 7, 262. [Google Scholar] [CrossRef]
- Shimizu, M.; Andrew, P.D. Effect of heel height on the foot in unilateral standing. J. Phys. Ther. Sci. 1999, 11, 95–100. [Google Scholar] [CrossRef]
- Bonanno, D.R.; Landorf, K.B.; Menz, H.B. Pressure-relieving properties of various shoe inserts in older people with plantar heel pain. Gait Posture 2011, 33, 385–389. [Google Scholar] [CrossRef] [PubMed]


| Subject Number | 1 | 2 | 3 | 4 | 5 | 6 | 7 | 8 | 9 | 10 | 11 | 12 | 13 |
|---|---|---|---|---|---|---|---|---|---|---|---|---|---|
| Height, cm | 155 | 157 | 151 | 153 | 153 | 172 | 150 | 156 | 146 | 159 | 164 | 163 | 144 |
| Weight, kg | 57.2 | 60 | 50 | 52 | 70 | 63.8 | 59 | 68.6 | 55.3 | 84.6 | 62.7 | 72 | 67.6 |
| FL, mm | 249 | 266 | 237 | 240 | 252 | 276 | 237 | 251 | 240 | 240 | 270 | 273 | 234 |
| FW, mm | 98 | 118 | 106 | 91 | 100 | 108 | 96 | 102 | 94 | 100 | 100 | 99 | 90 |
| Shoe size | 40 | 42 | 38 | 38 | 40 | 43 | 38 | 40 | 38 | 39 | 40 | 42 | 37 |
| L, mm | 4.5 | 3.0 | 1.5 | 4.0 | 5.0 | 3.0 | 4.0 | 7.0 | 6.0 | 7.0 | 2.0 | 4.0 | 6.0 |
| CH, mm | 37.4 | 39.9 | 35.6 | 36.0 | 37.8 | 41.4 | 35.6 | 37.7 | 36.0 | 36.0 | 40.5 | 41.0 | 35.1 |
| S, mm | 38.0 | 34.0 | 36.0 | 38.0 | 39.0 | 41.0 | 35.0 | 39.0 | 30.0 | 38.0 | 34.0 | 34.0 | 36.0 |
| (CH-S), mm | −0.6 | 5.9 | −0.5 | −2.0 | −1.2 | 0.4 | 0.5 | −1.4 | 6.0 | −2.0 | 6.5 | 7.0 | −0.9 |
| Heel Site | Number of Feet | PMCP (kg/cm2) | PMCP Related to the Length of Spur Types (kg/cm2) Mean ± SD (Number of Feet) | ||
|---|---|---|---|---|---|
| Mean ± SD (Range) | Small | Medium | Large | ||
| 1 | 1 | 1.32 | 1.32 (1) | - | - |
| 2 | 5 | 1.63 ± 0.25 (1.24–1.87) | - | 1.24 (1) | 1.73 ± 0.13 (4) |
| 3 | 2 | 3.13 ± 0.25 (2.95–3.3) | 2.95 (1) | 3.3 (1) | - |
| 4 | 2 | 2.38 ± 0.37 (2.11–2.64) | - | 2.38 ± 0.37 (2) | - |
| 5 | 3 | 2.25 ± 0.41 (1.92–2.71) | - | 2.25 ± 0.41 (3) | - |
| % Shoe Insole Area | % Deduction | Shoe Insole Area (mm2) | |
|---|---|---|---|
| From Modification of z-Coordinates | From Equation (1) | ||
| 100 | 0 | 17,972 | 17,972 |
| 75 | 16.5 | 17,063 | 17,071 |
| 50 | 34.5 | 16,169 | 16,170 |
| 25 | 56 | 15,266 | 15,269 |
| 0 | 100 | 14,368 | 14,368 |
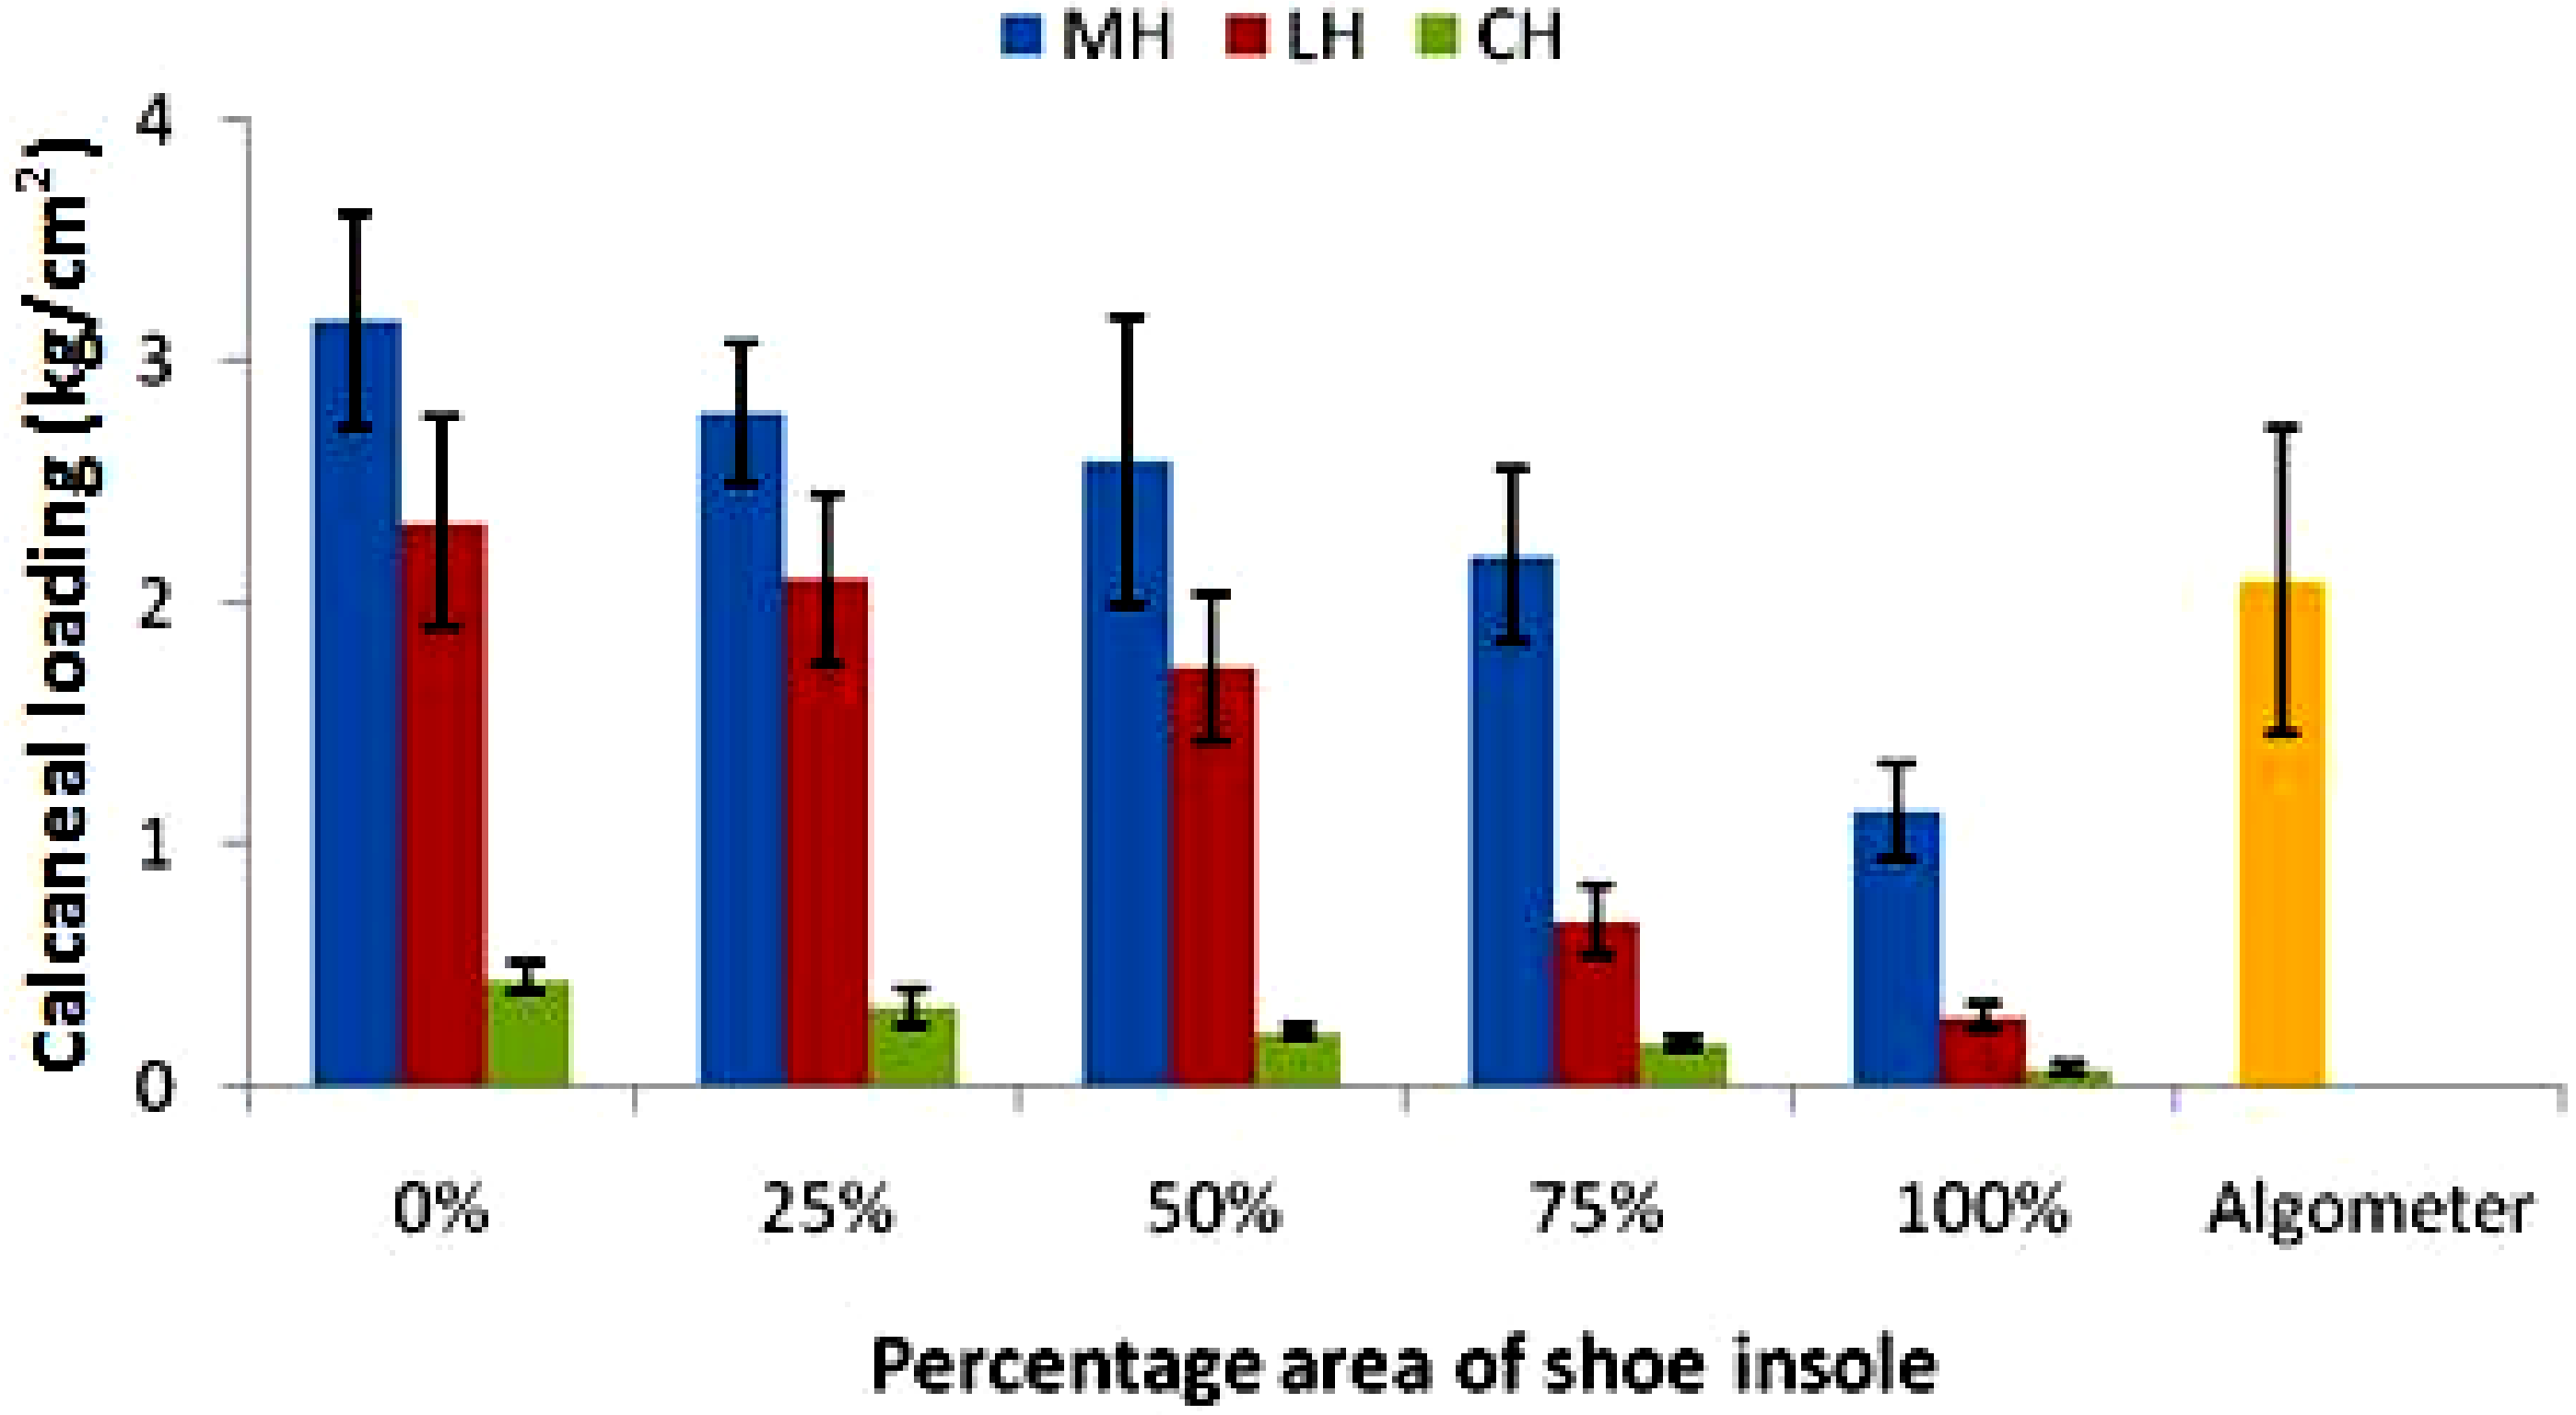
| Percentage Area of Shoe Insole | 0% | 25% | 50% | 75% | 100% |
|---|---|---|---|---|---|
| Calcaneal region | Comparison to the BW (mean ± SD) | ||||
| MH | 10.14 ± 1.46 | 8.93 ± 1.16 | 8.26 ± 1.65 | 7.01 ± 1.09 | 3.64 ± 0.60 |
| LH | 7.46 ± 1.28 | 6.70 ± 1.06 | 5.53 ± 0.91 | 2.23 ± 0.52 | 0.93 ± 0.16 |
| CH | 1.44 ± 0.20 | 1.05 ± 0.21 | 0.73 ± 0.09 | 0.59 ± 0.09 | 0.24 ± 0.06 |
| Calcaneal region | Comparison to all sensors (mean ± SD) | ||||
| MH | 53.31 ± 0.82 | 53.60 ± 1.55 | 56.69 ± 1.26 | 71.49 ± 2.36 | 75.47 ± 3.04 |
| LH | 39.11 ± 1.01 | 40.11 ± 1.04 | 38.20 ± 0.78 | 22.44 ± 2.55 | 19.44 ± 2.41 |
| CH | 7.58 ± 0.18 | 6.29 ± 0.51 | 5.11 ± 0.48 | 6.07 ± 0.20 | 5.09 ± 1.03 |
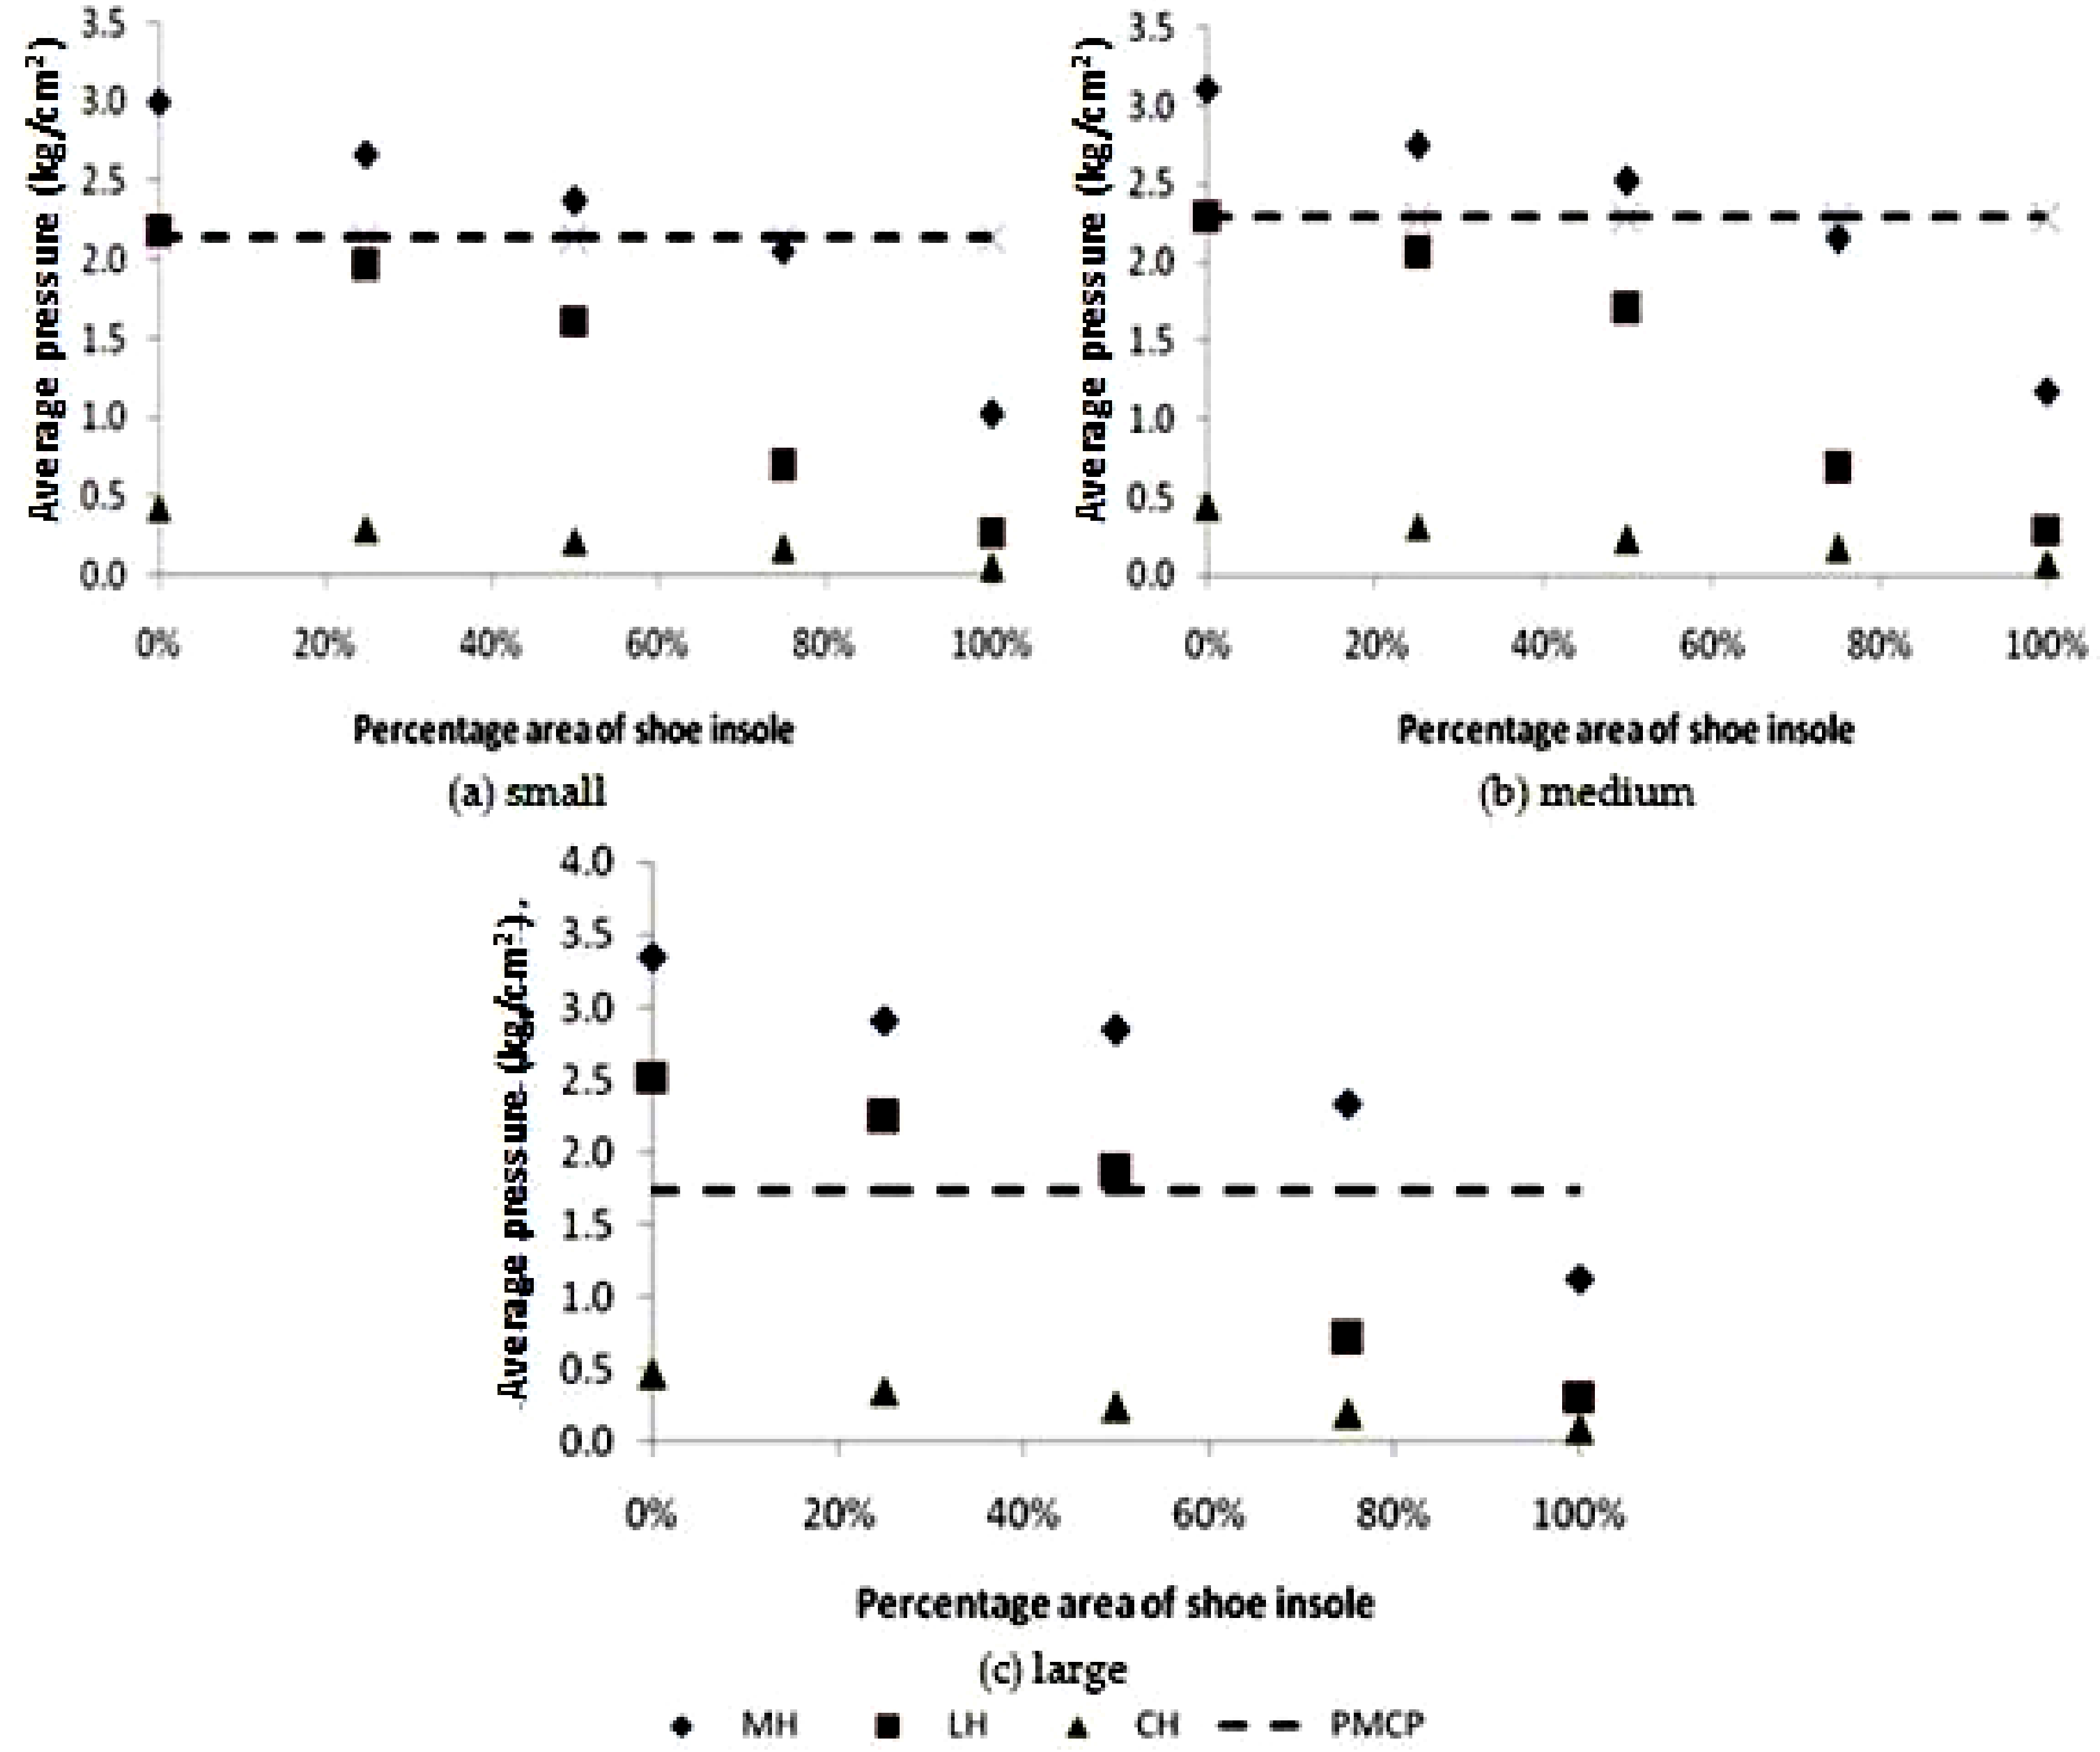
| Spur Length | PMCP (kg/cm2) | Calcaneal Region | Calcaneal Loading for Each Percentage Area of Shoe Insole (kg/cm2) | ||||
|---|---|---|---|---|---|---|---|
| 0% | 25% | 50% | 75% | 100% | |||
| MH | 3.00 ± 0.34 | 2.67 ± 0.22 | 2.37 ± 0.45 | 2.06 ± 0.27 | 1.02 ± 0.10 | ||
| Small | 2.14 ± 1.15 | LH | 2.17 ± 0.34 | 1.96 ± 0.27 | 1.61 ± 0.24 | 0.69 ± 0.15 | 0.27 ± 0.04 |
| CH | 0.43 ± 0.05 | 0.30 ± 0.06 | 0.22 ± 0.02 | 0.17 ± 0.02 | 0.05 ± 0.00 | ||
| MH | 3.11 ± 0.33 | 2.75 ± 0.21 | 2.52 ± 0.43 | 2.15 ± 0.26 | 1.18 ± 0.22 | ||
| Medium | 2.29 ± 0.66 | LH | 2.28 ± 0.32 | 2.06 ± 0.26 | 1.70 ± 0.23 | 0.68 ± 0.11 | 0.29 ± 0.04 |
| CH | 0.44 ± 0.04 | 0.32 ± 0.06 | 0.23 ± 0.02 | 0.18 ± 0.02 | 0.08 ± 0.01 | ||
| MH | 3.35 ± 0.69 | 2.91 ± 0.45 | 2.84 ± 0.91 | 2.34 ± 0.56 | 1.13 ± 0.18 | ||
| Large | 1.73 ± 0.13 | LH | 2.52 ± 0.68 | 2.24 ± 0.54 | 1.86 ± 0.48 | 0.71 ± 0.22 | 0.31 ± 0.08 |
| CH | 0.47 ± 0.09 | 0.36 ± 0.12 | 0.24 ± 0.03 | 0.20 ± 0.04 | 0.09 ± 0.03 | ||
© 2019 by the author. Licensee MDPI, Basel, Switzerland. This article is an open access article distributed under the terms and conditions of the Creative Commons Attribution (CC BY) license (http://creativecommons.org/licenses/by/4.0/).
Share and Cite
Wibowo, D.B.; Widodo, A.; Haryadi, G.D.; Caesarendra, W.; Harahap, R. Effect of In-Shoe Foot Orthosis Contours on Heel Pain Due to Calcaneal Spurs. Appl. Sci. 2019, 9, 495. https://doi.org/10.3390/app9030495
Wibowo DB, Widodo A, Haryadi GD, Caesarendra W, Harahap R. Effect of In-Shoe Foot Orthosis Contours on Heel Pain Due to Calcaneal Spurs. Applied Sciences. 2019; 9(3):495. https://doi.org/10.3390/app9030495
Chicago/Turabian StyleWibowo, Dwi Basuki, Achmad Widodo, Gunawan Dwi Haryadi, Wahyu Caesarendra, and Rudiansyah Harahap. 2019. "Effect of In-Shoe Foot Orthosis Contours on Heel Pain Due to Calcaneal Spurs" Applied Sciences 9, no. 3: 495. https://doi.org/10.3390/app9030495
APA StyleWibowo, D. B., Widodo, A., Haryadi, G. D., Caesarendra, W., & Harahap, R. (2019). Effect of In-Shoe Foot Orthosis Contours on Heel Pain Due to Calcaneal Spurs. Applied Sciences, 9(3), 495. https://doi.org/10.3390/app9030495