Article

The Correlation between Users’ Cognitive Characteristics and Visualization Literacy

1
School of Industrial Engineering, Purdue University, West Lafayette, IN 47907, USA
2
IBM Research, Cambridge, MA 02141, USA
3
Industrial & Operations Engineering, University of Michigan, Ann Arbor, MI 48109, USA
4
Department of Engineering, Texas A&M University-Corpus Christi, Corpus Christi, TX 78412, USA
5
Industrial ICT Engineering, Dong-eui University, Busan 47340, Korea
*
Author to whom correspondence should be addressed.
Appl. Sci. 2019, 9(3), 488; https://doi.org/10.3390/app9030488
Submission received: 14 October 2018 / Revised: 21 January 2019 / Accepted: 24 January 2019 / Published: 31 January 2019
(This article belongs to the Section Computing and Artificial Intelligence)

Abstract

:
One of the ultimate goals of studies on visualization literacy is to improve users’ visualization literacy through education and training. Even though users’ cognitive characteristics may significantly affect learning and responding processes in general, studies have addressed the relationships between users’ cognitive characteristics and visualization literacy. As a first step toward discovering the relationships, we conducted an empirical study to investigate the correlation between cognitive characteristics and visualization literacy. Our first study focuses on testing the correlation between visualization and three cognitive characteristics: numeracy, need for cognition, and visualizer-verbalizer style. In this study, we measured 178 participants’ visualization literacy and the level of the three cognitive characteristics using the Visualization Literacy Assessment Test (VLAT), the Decision Research Numeracy Test (DRNT), the Need for Cognition Scale (NCS), and the Verbalizer-Visualizer Questionnaire (VVQ) through a crowdsourcing experiment. Our test results confirmed that a correlation exists between visualization literacy and both numeracy and need for cognition. Based on our test results, we discuss the implications for education to enhance visualization literacy and future studies to investigate on related user characteristics.

1. Introduction

Visualization literacy is “the ability and skill to read and interpret visually represented data in and to extract information from data visualizations” ([1] p. 552). In recent years, visualization literacy has become more and more important because many people have started using data visualizations to support their communication, problem-solving, and decision-making in various areas. However, a recent study shows that ordinary people have a low level of visualization literacy and limitations in understanding and interpreting data visualizations [2]. To get a better understanding of how people understand data visualizations, many researchers in the information visualization community have conducted empirical studies. Some researchers conducted a qualitative study to characterize users’ underlying cognitive behaviors with data visualizations [3]. Other researchers introduced new methods to quantitatively measure users’ ability to read and interpret data visualizations [1,4].
To systematically teach data visualizations and improve users’ visualization literacy, we should understand users better by characterizing their states and abilities more clearly. Traditionally, researchers in the area of educational studies have investigated various individual characteristics (e.g., cognitive characteristics, personality, and previous knowledge of learners) and their relationships to learners’ aptitude for more systematic and efficient learning and instruction. Researchers have suggested various forms of learning and instruction methods depending on individual differences and proven their effectiveness based on learning outcomes [5,6]. In such a manner, we can certainly gain valuable insights by investigating more closely users’ cognitive characteristics related to visualization literacy. Furthermore, that understanding will be the basis for designing efficient and tailored education and training systems to improve visualization literacy. For instance, if we know users’ cognitive abilities related to visualization literacy, we can pay special attention to their abilities in terms of visualization literacy. If we know users’ cognitive characteristics associated with visualization literacy, we can design instructions that meet users’ needs and aptitudes.
Thus, in this study, we investigate the correlation between cognitive characteristics and visualization literacy as a first step. Prior research has investigated the relationship between graph comprehension and various types of cognitive abilities, such as numeracy, need for cognition, and visualizer-verbalizer style e.g., [7,8,9]. Many studies have introduced mixed results about the relationship between the individual differences in the users’ cognitive abilities and confidence and accuracy of comprehending graphic representations of data. Despite such continuing efforts, previous studies have not tested wide breadth of visualization types and analytic task types because they conducted studies with a small selection of charts (usually, bar chart, line chart, and pie chart) being used in a limited context, such as in health risk assessment, news reading, and education. Furthermore, prior research has tended to focus on graph comprehension/literacy, which is a different concept from visualization literacy, which captures users’ abilities to perform analytic tasks (e.g., derive trends and compare) using a variety of data visualizations. Therefore, we believe that we need to test the findings in the graph comprehension/literacy fields in an information visualization context. To fill the research gap, our study aims to extend previous research efforts in the visual data analysis context by conducting a within-subject experiment with a wider breadth of 12 types of visualizations and analytic task types.
The goal of the study is to find the relationship between visualization literacy and the following three cognitive characteristics: numeracy as a cognitive ability, need for cognition as cognitive motivation, and visualizer-verbalizer style as a cognitive style. Our general hypothesis is that an individual user’s visualization literacy is highly correlated with the three cognitive characteristics because graph literacy/comprehension has been shown to have a correlation with them. We test whether visualization literacy correlates with numeracy, which is an individual’s ability to understand and process numerical information, because data visualizations are graphical representations of numerical data in most cases. Of course, not all data visualizations are based on numerical data, but we believe that the ability to work with numerical data can help users understand basic mapping processes from data to visual representations as well. We also test whether visualization literacy correlates with need for cognition, an individual’s tendency to engage in effortful cognitive activities, because we believe that users need to be willingly inclined toward conducting cognitive activities to discover meaningful information and identify interesting patterns from data visualizations. Finally, we test whether visualization literacy correlates with verbalizer-visualizer information processing style because we believe that visualizers, who prefer to process visual information, may feel more comfortable with data visualizations than verbalizers.
In Section 2, we begin with a brief review of literature on visualization literacy and user characteristics with data visualization use, as well as the three user cognitive characteristics investigated in this study. Then, we provide our hypotheses in Section 3 based on the review. In Section 4, we describe our experiment to test the hypotheses, including the participants, measures, and procedure. In Section 5, we present the results of the experiment and analysis. In Section 6, we discuss our findings, implications for education and training approaches for data visualizations to improve individual users’ visualization literacy, and suggestions for future visualization research. Finally, we offer concluding remarks in Section 7.

2. Background

In this section, we review previous studies on visualization literacy, individual differences, and user cognitive characteristics.

2.1. Visualization Literacy

Over the last few years, several researchers have investigated visualization literacy in various directions. Boy et al. [4] define it as “the ability to confidently use a given data visualization to translate questions specified in the data domain into visual queries in the visual domain, as well as interpreting visual patterns in the visual domain as properties in the data domain” and Lee et al. [1] refer it as “the ability and skill to read and interpret visually represented data in and to extract16information from data visualizations.” There are also related concepts such as visual literacy [10], in which is defined as the “ability to understand, interpret, and evaluate visual messages.” However, this is rooted in more to semiotics, which distinguishes it from visualization literacy. Börner et al. [2] surveyed the ordinary users’ level of visualization literacy and their familiarity using a questionnaire and qualitatively explored users’ cognitive activities when they tried to make sense of data visualizations [3]. More importantly, some researchers attempted to develop assessment tests to quantitatively measure the visualization literacy of users [1,4]. Lee et al. [1] proposed the Visualization Literacy Assessment Test (VLAT) in which followed the test construction procedure in Psychological and Educational Measurement. The VLAT consisted of 12 data visualization types, which were the most frequently exposed to the users, and 53 test items that covered eight eight types of tasks. The wide use of a range of visualization tasks helps ensure that it can cover a broad spectrum of participants’ abilities with visualization.
Even though the developed assessment tests might be too limited to measure an all-inclusive ability to read and interpret data visualizations, researchers, designers, and educators can acquire valuable information from test results. From the test results, they could identify users’ the strengths and weaknesses in reading and interpreting data visualizations of users as well as the current level of visualization literacy.
One of the ultimate goals of visualization literacy research is to promote and improve the visualization literacy of users through education and training [1]. In response to this, a couple of interesting education approaches have been proposed. Ruchikachorn and Mueller [11] tried to teach an unfamiliar data visualization (e.g., treemap) by linking it to a familiar data visualization (e.g., pie chart); and Kwon and Lee [12] adapted the learning-by-doing approach to teach an unfamiliar data visualization (i.e., parallel-coordinates plot). Most recently, Alper et al. [13] investigated the current practices and challenges in teaching and learning data visualizations in early education settings and identified design goals to improve the visualization literacy of elementary students. However, researchers still lack an understanding of the role of user cognitive characteristics in visualization literacy even though they affect individuals’ learning abilities and pace in response to education materials and training programs, as copious literature on differential psychology has indicated [5]. Understanding the correlation between visualization literacy and cognitive characteristics can provide insightful implications on tailored education for individuals with various levels in of ability.

2.2. Individual Differences in Graph Comprehension

Previous studies have investigated individual differences in the field of graph comprehension. Several researchers focused on different behaviors between highly skilled graph readers and less skilled graph readers when viewing and interpreting graphs or charts [9,14,15,16]. Prior research has shown evidence that highly skilled graph readers extracted more elaborate information from graphs or charts, made fewer errors with the intermediate and advanced level tasks of the three-level graph comprehension framework [17,18,19], comprehensively considered the relevant graph components, and relied more on data depicted in graphs or charts than on their prior knowledge about the content. Though these findings provided some perspective of individual differences (i.e., highly skilled graph readers versus less skilled graph readers) in graph comprehension, we find several limitations in this research for adoption into the information visualization context. Most of the research considered simple data visualizations such as line charts and bar charts. In addition, measures used in these studies covered only limited task types, and they were sometimes based on graph readers’ subjective descriptions. More importantly, it was not clear which types of individual characteristics caused the differences in graph comprehension.

2.3. User Characteristics and Visualization

Researchers in the information visualization community have investigated how user characteristics affect visualization use. In particular, the line of prior work focused on the effects of perceptual abilities, cognitive abilities, and personality, among many user characteristics, on the users’ abilities to read visualizations.
Some researchers endeavored to find a connection between perceptual abilities and visualization use. In particular, they were interested in perceptual speed (e.g., speed in completing simple tasks involving visual perception: for example, recognizing a figure appearing on the left from a set of five similar objects on the right). One of the common findings was that the perceptual speed of users was correlated with and significantly influenced visualization task performance in terms of speed and accuracy [20,21,22,23]. Furthermore, the effects of individuals’ perceptual speed on task performance were different depending on visualization types. For example, users with high-perceptual speed performed better with bar charts and colored boxes views on information seeking tasks; in contrast, users with low-perceptual speed performed better with radar charts [20,22].
More extensive studies have been conducted to investigate the roles of cognitive abilities (e.g., spatial rotation ability, visual working memory, and verbal working memory). Chen and Czerwinski [24] examined the effects of spatial rotation ability on information retrieval tasks with a node-link visualization. They showed that spatial rotation ability is moderately correlated with the tasks, and different navigation strategies emerged between high- and low-spatial ability user groups. Velez et al. [23] explored the effects of various cognitive abilities on a 3D visualization task identifying a 3D object from orthogonal projections. They found that visual memory and spatial rotation ability correlated with only the accuracy of task performance. Conati and Maclaren [20] compared the effects of cognitive abilities on different visualization types (i.e., colored boxes view and radar view); however, no significant interactions occured with the visualization types. One interesting finding by Toker et al. [22] was that an individual’s visual working memory and verbal working memory affected his/her preference for visualization types; for instance, users with high-visual working memory generally preferred radar charts to bar charts. In addition, the roles of spatial rotation ability, visual working memory, and verbal working memory have been inspected with visualization training approaches [25] and highlighted interventions [26].
As shown in the previous work, researchers have been searching for evidence that user characteristics have a significant effect on visualization use and preference. However, most studies have considered very limited target visualizations and associated visualization tasks. For these reasons, it may not be enough to generalize and extend the findings to other visualization types. Furthermore, previous studies have investigated derivative user characteristics (e.g., perceptual speed, spatial rotation ability, visual working memory, locus of control, and expertise). As Yi [27] and Ziemkiewicz et al. [28] argued, other relevant user cognitive characteristics should be examined to expand the understanding of user characteristics in data visualization.

2.4. User Cognitive Characteristics Investigated in This Study

To expand the understanding of user characteristics in visualization, we focused on user cognitive characteristics that were shown to be associated with a closely related but different ability, graph comprehension. The three are numeracy as a cognitive ability, need for cognition as cognitive motivation, and visualizer-verbalizer style as a cognitive style. We hypothesize that the three are positively correlated with users’ ability to read and interpret data visualizations, visualization literacy.

2.4.1. Graph Comprehension and Literacy

Graph literacy is a term defined in cognitive psychology, which refers to the user’s ability to extract and understand graphically represented information [9]. Graph comprehension has been shown to be influenced by domain knowledge and graph literacy [9]. Graph literacy, combined with other correlated measures, influences one’s graph comprehension. Many cognitive characteristics have been studied concerning their relationship with graph literacy. Our study focuses on the three characteristics that are known to interplay with graph literacy on one’s graph comprehension. The three characteristics are numeracy, need for cognition, and visualizer-verbalizer. In next three sections, we summarize previous studies on the relationship between graph literacy and the three characteristics for the design of our experiment.

2.4.2. Cognitive Ability: Numeracy

Numeracy is defined as the ability to apply and to reason simple numerical principles [5,29]. Basic numeracy skills consist of comprehending fundamental arithmetics like addition, subtraction, multiplication, and division. Additional aspects of numeracy include number and operation sense, measurement, computation, probability, geometry, and statistics.They require mental operations and are described in terms of maximal performance. In many cases, cognitive abilities are not stable and can be improved through education, training, and effort. Along with other cognitive abilities (e.g., spatial rotation ability, visual working memory), numeracy could be an influential cognitive ability in visualization literacy because most data visualizations represent numerical data, and users conduct data visualization tasks using extracted numerical information from the visualizations. Numeracy is defined as an individual’s ability to understand, use, and process numerical information [30,31]. Highly numerated individuals appropriately infer what numerical and mathematical concepts need to be applied when interpreting specific situations [32,33]. Furthermore, they tend to extract precise meaning from numbers and numerical comparisons [32]. Several studies have provided evidence for the effects of numeracy on graph comprehension. In general, high-numeracy people have high-graph comprehension [14]. They find critical information from graphs and often recall numerical information in graphs well [14,34]. Furthermore, low-numeracy people with high-graph comprehension get meaningful help from visual aids when they extract information [14]. Like other graph comprehension literature, however, these studies considered only elementary visualizations with limited visualization tasks.

2.4.3. Cognitive Motivation: Need for Cognition

Need for cognition describes an individual’s tendency to engage in and enjoy effortful cognitive activities, and it has been diversely defined as “a need to structure relevant situations in meaningful, integrated ways” and “a need to understand and make reasonable the experiential world” [35,36]. According to Cacioppos and Petty’s conceptualization, need for cognition is general, intrinsic, and stable, but it can be changed or developed [36,37]. Because the need for cognition depends on an individual’s propensity, it differs from cognitive abilities. People with low-need for cognition lack the motivation for efforful cognitive activities. In contrast, those with high need for cognition are more likely to seek, acquire, think about, and derive meaning from information [36]. Furthermore, they tend to objectively make decisions based on acquired information. Eventually, they have positive attitudes towards tasks that require critical thinking and reasoning [36,38]. Taken all together, need for cognition could be a potent individual factor in visualization literacy because extracting information from data visualizations is a task that requires both perceptual and cognitive operations, and it demands users’ cognitive effort. Hullman et al., summarizing prior research studies in cognitive psychology, conjectured that individuals with low scores in need for cognition will encounter roadblocks in understanding graphically presented information [39]. Even though this was not the focal point of their studies, Pandey et al. [40,41] tested the effects of need for cognition on particular visualization use; however, they did not find conclusive information from the test.

2.4.4. Cognitive Style: Visualizer and Verbalizer

The visualizer-verbalizer cognitive style is described by “individual preferences for attending to and processing visual versus verbal information” [5] (p. 191). Visualizers are individuals who prefer to imagery processes when attempting to perform cognitive tasks and rely on information from charts, diagrams, or graphics; verbalizers depend primarily on verbal-logical means in cognitive information processing and rely on information from text. Visualizers are fluent with illustrations, whereas verbalizers are fluent with words. Many studies that focused on the visualizer-verbalizer style examined relationships with other cognitive abilities (e.g., spatial rotation ability, visual working memory, verbal ability [42,43]). Other studies examined the effects of the visualizer-verbalizer style on the use of learning materials [44], maps [45], and newspapers [46]. However, it is difficult to find previous work that examines the effects of visualizer-verbalizer cognitive style on visualization literacy or graph comprehension despite a natural inclination of users toward visualization literacy.

3. Hypotheses

Given the background of the three cognitive characteristics (i.e., numeracy, need for cognition, and visualizer-verbalizer style), we set the following hypotheses:
H1
A positive correlation exists between visualization literacy and numeracy: The visualization literacy of the high-numeracy user group will be higher than that of the low-numeracy user group.
H2
A positive correlation exists between visualization literacy and need for cognition: The visualization literacy of the user group with high need for cognition will be higher than that of the low-need for cognition user group.
H3
A positive correlation exists between visualization literacy and the verbalizer-visualizer; People who have higher visualization literacy are more likely to be visualizer rather than verbalizers. The visualization literacy of the visualizer style user group will be higher than that of the verbalizer style user group.
Besides testing the three main hypotheses, we aim to discover findings at the item level of visualization literacy tests so that we can infer general trends of scores in terms of visualization types and task types between people with different levels of cognitive characteristics.

4. Experiment

To test the hypotheses in Section 3, we conducted a crowdsourcing experiment. In the experiment, we measured participants’ visualization literacy and their three cognitive characteristics (i.e., numeracy, need for cognition, and visualizer-verbalizer style) using instruments developed in previous literature.

4.1. Participants

We originally recruited a total of 220 participants through Amazon Mechanical Turk (MTurk). We conducted power analysis on correlation test, and we derived the total number of participants needed as 123 ( α = 0.05, β = 0.2, r = 0.3). We also expected some dropouts, outliers, and bad turkers because of the nature of online studies [47]. Thus, we decided to initially recruit 220 participants. We recruited crowdsourced workers who had a total of 100 or more approved HITs (Human Intelligence Tasks, unit used for tasks on MTurk) and a 95% or greater HIT approval rate only from the United States. MTurk has become increasingly popular as an online experiment platform, and it has clear strengths and weaknesses [48,49]. For example, while MTurk allows researchers to recruit a large number of diverse participants in a relatively in a short amount of time and at low costs, researchers cannot control participants and their work environment as in controlled lab studies. However, MTurk can be reasonably used for experiments using objective instruments [49,50].
We intentionally recruited crowdsourced workers who were native English speakers because the measures used in this study were written in English, and using a non-native language might prevent smooth thought processes and lead to poor performance [51,52]. We also tried to recruit crowdsourced workers who were not color blind because the measures of visualization literacy did not use color-blind-safe colors. So we ruled out one participant who was a self-reported non-native English speaker and one participant who was self-reported color blind. Out of the 218 participants, we also ruled out 32 participants who failed to complete the tasks as instructed. In addition, we considered the following participants as random clickers and discarded their responses: (1) three participants who answered more than eight items in the measure of visualization literacy in under five seconds, and (2) five participants who provided inappropriate answers to the following question in the measure of visualization literacy: “In the test that you took, can you recall what the data visualizations were about (e.g., hotel, bicycle, or airfare)? Please type the context as your memory serves.” Note that we included three filtering questions asking to retrieve a value from a simple seven by six table in the experiment; however, all participants went through the questions well.
As a result, a total of 178 participants remained. The remaining participants were 85 females and 93 males with the self reported ages ranging from 21 to 69 ( M = 35 . 02 , S D = 10 . 39 ). Everybody had an education level of high school or above. Of the participants, 43% of the participants had a bachelor’s degree and 8% of the participants had a master’s or a doctoral degree.

4.2. Measures

Here we introduce measures for four variables, visualization literacy, numeracy, need for cognition, and visualizer/verbalizer, used in our study. Because of the page limitation, we do not include all questionnaires in the body of the paper. Please find the original questions in our appendices.

4.2.1. Visualization Literacy

To measure the visualization literacy of the participants, we used VLAT developed by Lee et al. [1] as the test is a validated and reliable instrument for measuring ordinary users’ visualization literacy (Screenshots are shown in Figure 1). The original version of the VLAT consisted of 53 selected-response items. However, in this study, we used only 41 selected-response items without 12 low discriminating items (For the detailed low discriminating items, please refer to the Lee et al.’s paper [1].) to promote the efficiency of test taking. In order to make sure the quality of the modified VLAT, we checked the coefficient omega without the 12 items. The value of McDonald’s reliability coefficient omega [53] slightly decreased from ω = 0.75 to ω = 0.74 , but still showed acceptably good reliability. Generally, the acceptable reliability coefficient value is 0.7 in test development procedure [54]. One point was assigned for each correct response. Some penalties were given for incorrect answers in order to prevent the issue of guessing in selected-response items. The penalties were calculated according to the correction-for-guessing formula [55].

4.2.2. Numeracy

We measured the participants’ numeracy using the Decision Research Numeracy Test (DRNT) designed by Peters et al. [31]. The early version of this test was developed by Schwartz et al. [56] with three test items, and it was expanded to 11 test items by Lipkus et al. [30]. Then it was further expanded to 15 test items by Peters et al. [31] in order to stretch the range of difficulty. The 15 items of the DRNT consisted of 11 constructed-response items and four selected-response items to measure the ability to understand, use, and process numerical information (e.g., Imagine that we roll a fair, six-sided die 1000 times. Out of 1000 rolls, how many times do you think the die would come up even (2, 4, or 6)?, In the Big Bucks Lottery, the chances of winning a $10 prize are 1%. What is your best guess about how many people would win a $10 prize if 1000 people each buy a single ticket from Big Bucks?). One point was assigned for each correct reponse, and the possible range of scores was 0 to 15.

4.2.3. Need for Cognition

To assess the need for cognition of the participants, we employed the short form of the Need for Cognition Scale (NCS) developed by Cacioppo et al. [57]. The scale was composed of 18 items describing the tendency to engage in and enjoy effortful cognitive endeavors. All participants responded to the 18 items on a 7-point scale ranging from 1 (strongly disagree) to 7 (strongly agree), and the possible range of scores was 18 to 127 (e.g., I would prefer complex to simple problems. I like to have the responsibility of handling a situation that requires a lot of thinking. Thinking is not my idea of fun. I would rather do something that requires little thought than something that is sure to challenge my thinking abilities).

4.2.4. Visualizer-Verbalizer
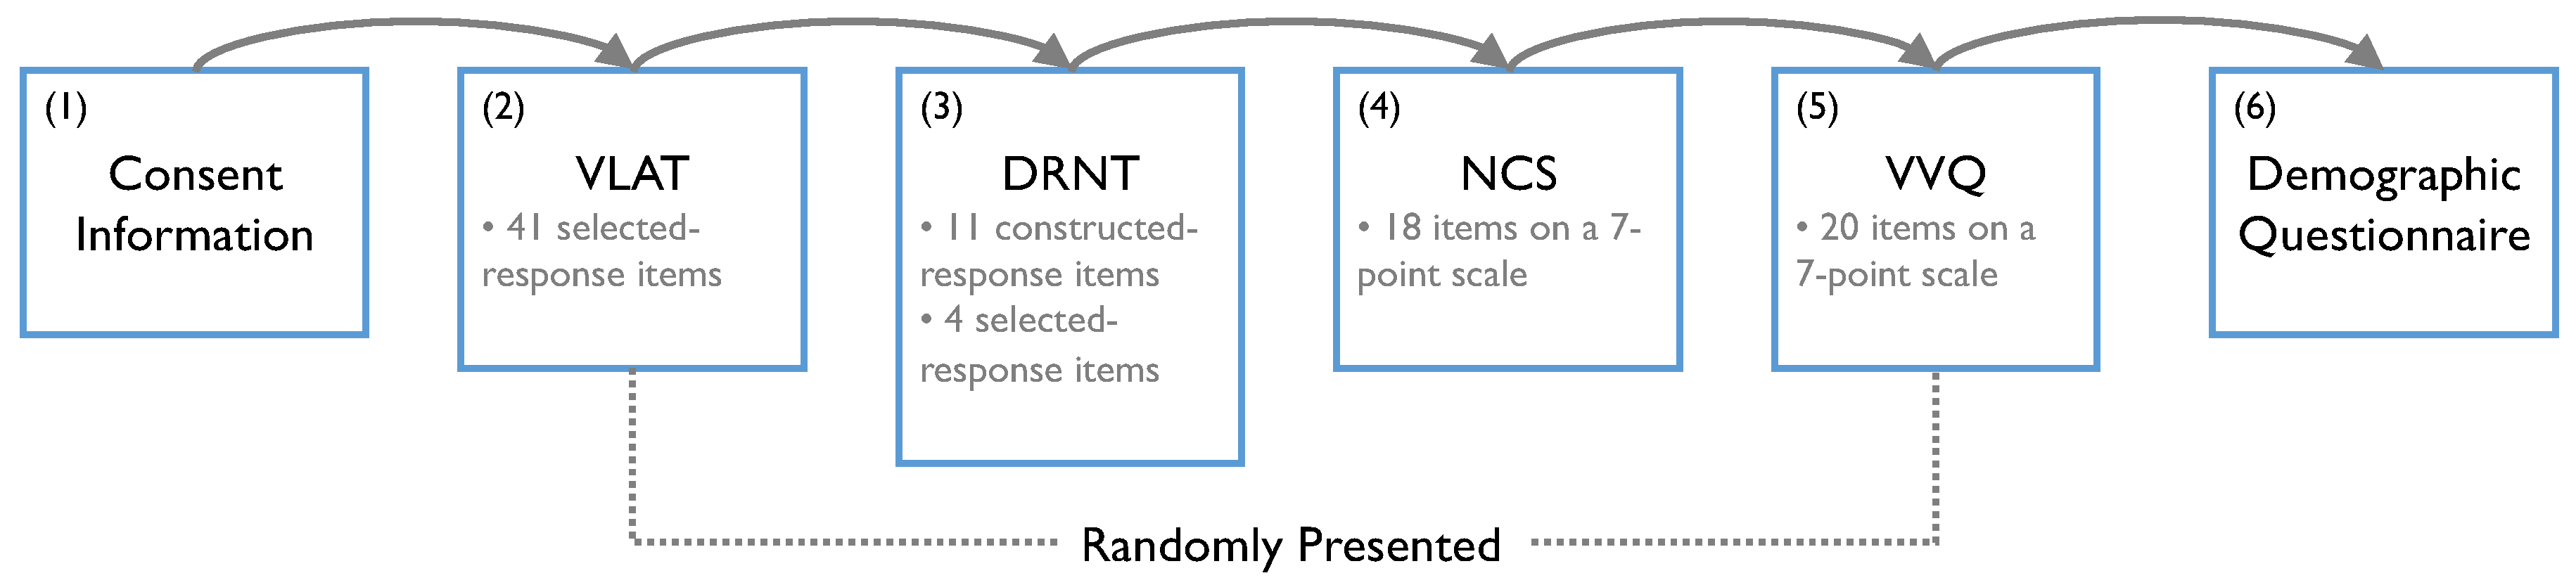
We used the Kirby et al.’s [43] Verbalizer-Visualizer Questionnaire (VVQ) to assess the participants’ visualizer-verbalizer cognitive style. The VVQ was originally designed as a true-false items questionnaire, and it consisted of three dimensions: verbal, visual, and dream dimensions. However, we slightly modified the questionnaire for this study. We decided to place each item on a 7-point scale ranging from -3 (strongly disagree) to 3 (strongly agree) to expand variations in responses as in other previous studies [46,58]. It is also known that Likert scales are more useful than dichotomous scales when we measure human traits [59]. Furthermore, we decided not to employ the “dream dimension,” which asks about the vividness of participants’ dreams, because we do not believe this dimension correlates with visualization literacy. Thus, we used the VVQ that was composed of the 20 items of verbal and visual dimensions, and the possible range of scores was −60 to 60.

4.3. Procedure

We administered the experiment on Amazon Mechanical Turk (MTurk). As shown in Figure 2, the experiment was conducted in six stages. First, we provided authorized consent information to the participants with the general purpose of this study, the procedure of the experiment, and tasks they would be asked to perform. After the participants read the information, we asked them to complete all four instruments: VLAT, DRNT, NCS, and VVQ. At the beginning of each measurement stage, we provided detailed instructions. For instance, with the VLAT, the participants were asked to select the best answer to each item within a time limit (i.e., 25 s). With the DRNT, the participants were asked to answer both quickly and accurately instead of using a time limit. With both the NCS and the VVQ, the participants were asked to indicate the extent to which each item reflected their cognitive characteristics on a 7-point scale ranging from strongly disagree to strongly agree. Because the sequence of the measures might influence the participants’ performance or responses, we randomly presented the four measures to the participants. At the end of the experiment, we asked the participants to fill out a demographic questionnaire. Overall, the experiment lasted approximately 40 min.

4.4. Analysis

We analyzed the collected survey responses in the following ways. First, we calculated the means and standard deviations of the individual variables. Second, we computed correlations across all pairs (six pairs in total) between the four variables. Third, we investigated further the relationships between visualization literacy and the other three measures by applying the median split method, which clusters participants into high and low groups for each variable. The method has been applied for many research studies in human-computer interaction, psychology, and consumer research [60], including studies about graph literacy and cognitive characteristics e.g., [8,34]. Fourth, for the pairs in which we found significance, namely, visualization literacy—numeracy and visualization literacy—need for cognition, we conducted further analysis on an item level to identify the root of the differences. We also uncovered the general tendency of participants’ scores for individual items of visualization literacy with respect to visualization types and tasks between high- and low-score groups of cognitive measures. Combining these four analysis, we confirmed or disproved the three hypotheses and provided our best explanation.

5. Results

In this section, we share the results by analyzing correlations between variables and further investigate details of the relationships.

5.1. General Measurement Results

Here we report the descriptive statistics of the four measures (Table 1). The participants in this study had a mean VLAT score of 19.25 ( S D = 8 . 32 ) that ranged from −2.81 to 37.67. Particularly, the VLAT scores were normally distributed as assessed by the Shapiro-Wilk test ( W = 0 . 994 , p = 0 . 721 ) which facilitated score interpretation. The participants also had an average DRNT score of 12.13 ( S D = 1 . 91 ) that ranged from 3 to 15. The general distribution of the DRNT scores was skewed left. Furthermore, the participants had an average NCS score of 80.98 ( S D = 25 . 81 ) and an average VVQ score of 4.28 ( S D = 12 . 93 ).
We also report correlations between all pairs of the four measurement scores (Table 2). We found a moderate positive correlation between the VLAT scores and the DRNT scores ( r s = 0 . 565 , N = 178 , p < 0 . 001 ) (H1 confirmed). We also found a weak negative correlation between the NCS scores and the VVQ scores ( r s = 0 . 334 , N = 178 , p < 0 . 001 ). In particular, this result was in line with Venkatraman et al.’s [61] finding that individuals with high-need for cognition preferred verbal information. We found no significant correlations in any other pairs (H2 and H3 not supported).
Because the primary interest of this study was to examine the correlation between user cognitive characteristics (i.e., numeracy, need for cognition, and visualizer-verbalizer style) and visualization literacy, further analyses focused on the correlation between visualization literacy scores and the high- and low-score groups in cognitive characteristics.

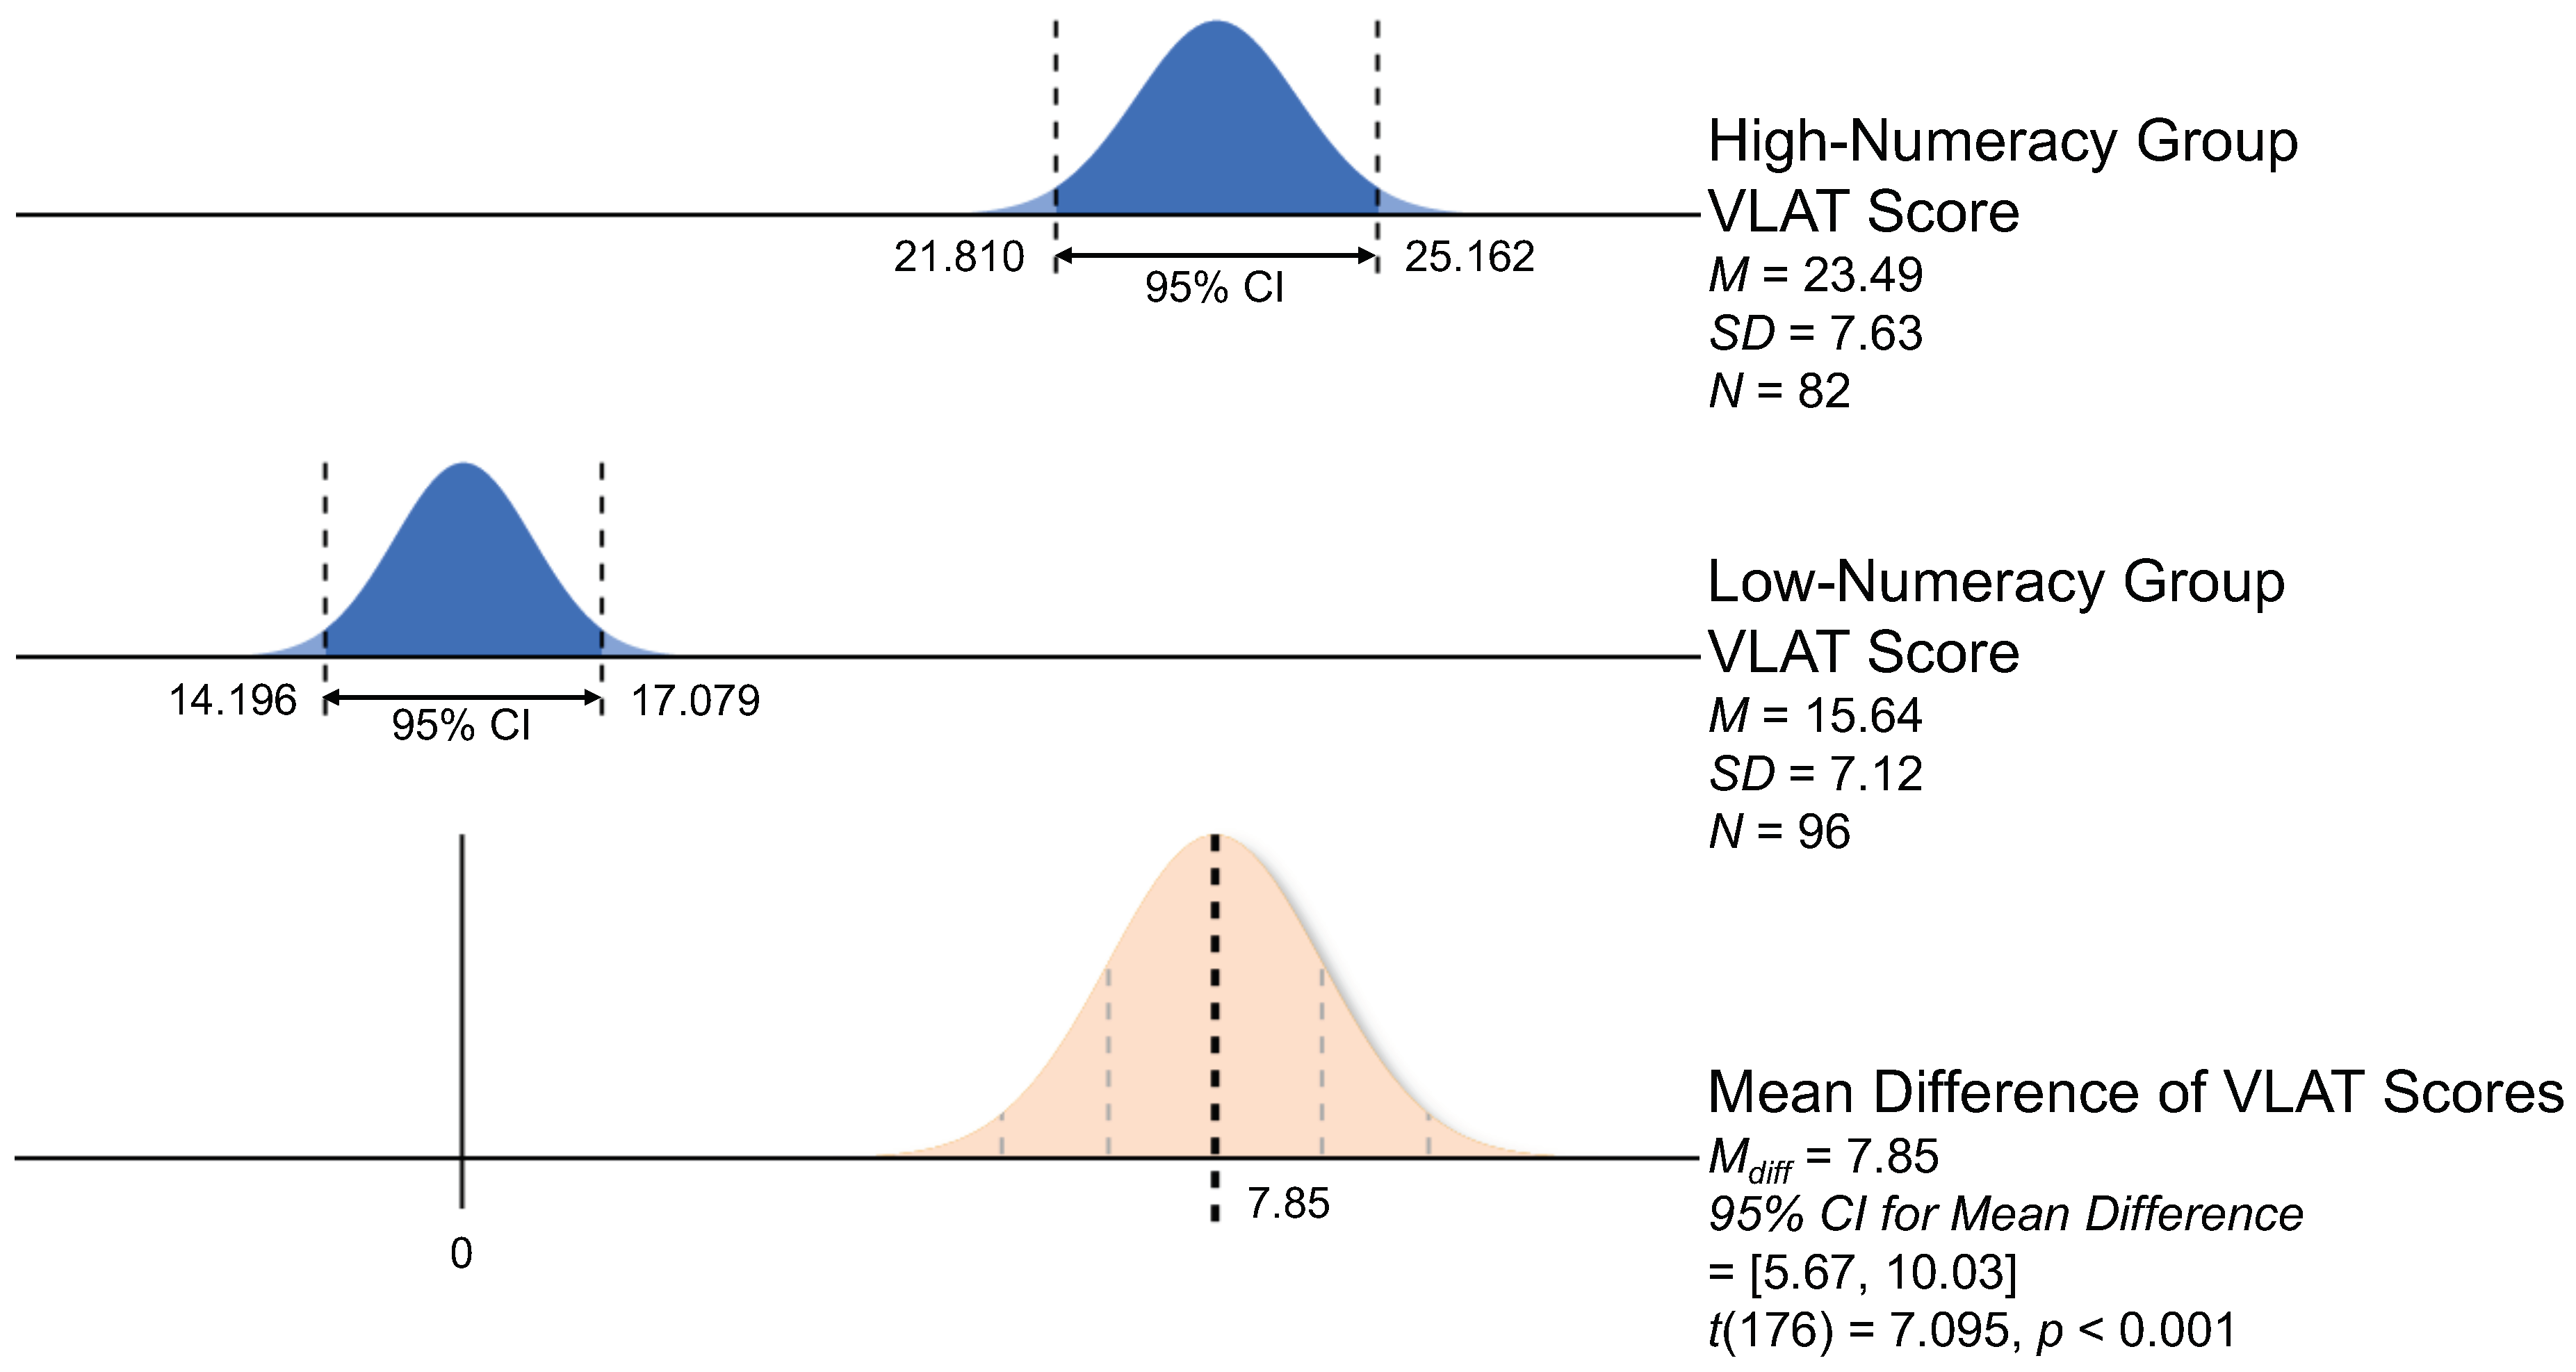
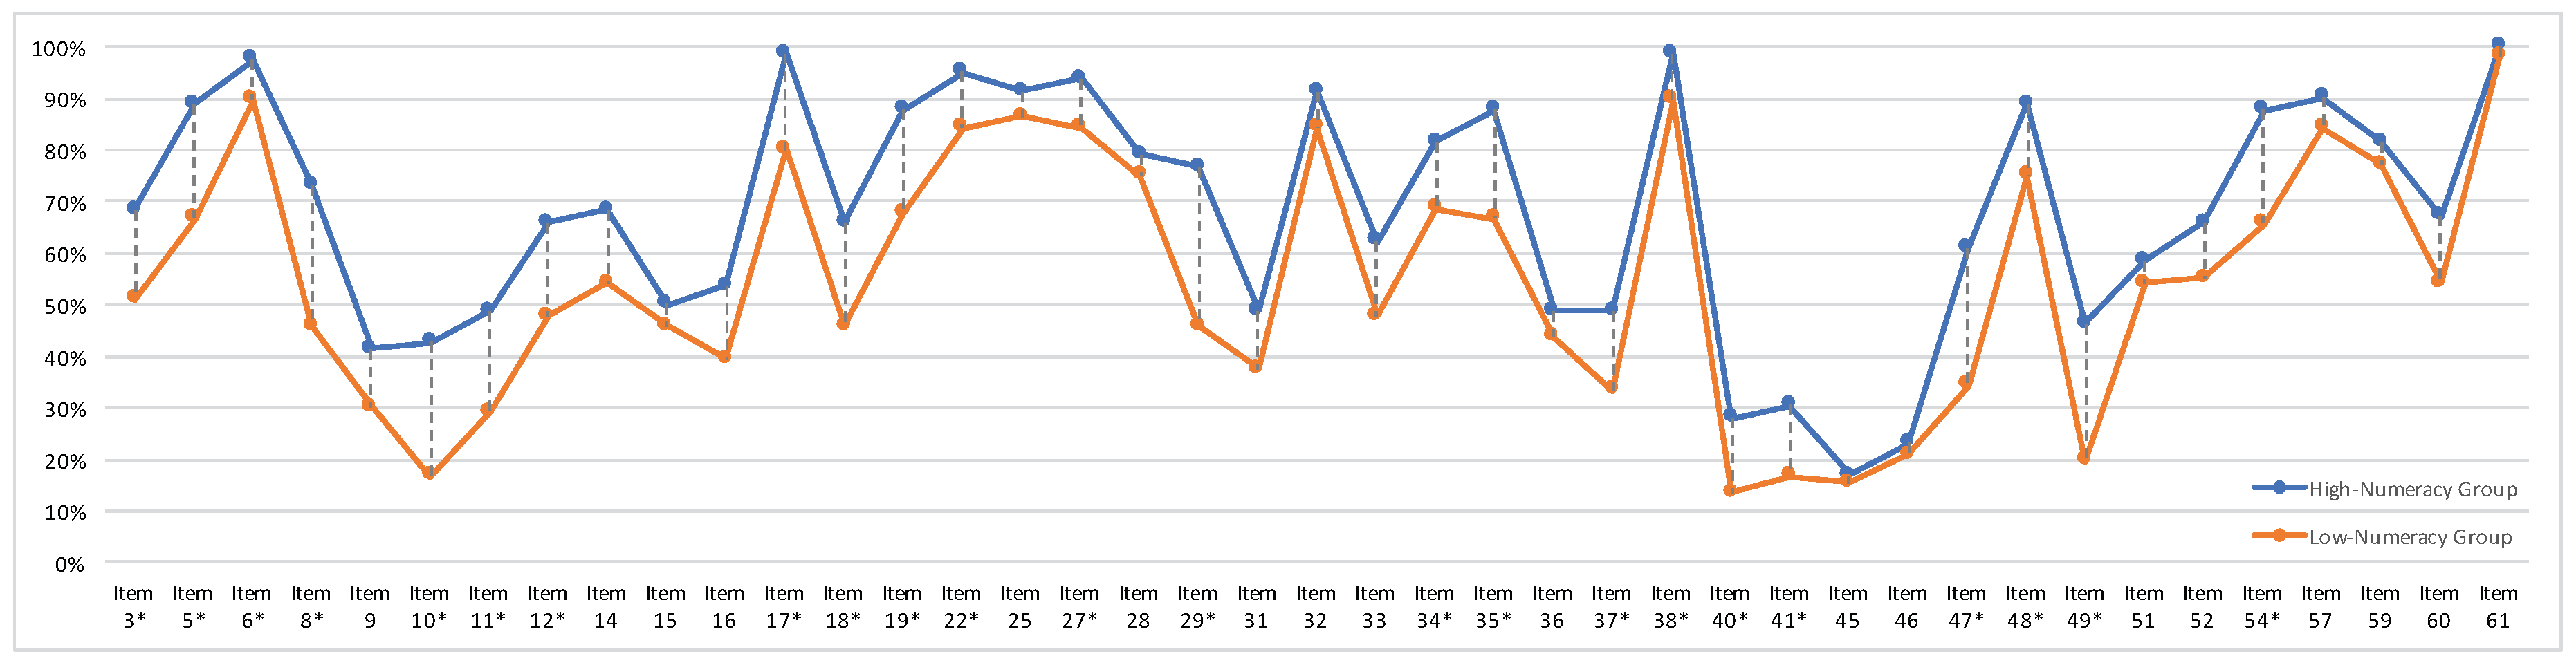
5.2. Numeracy and Visualization Literacy

We divided the participants into two groups by applying the median split method on the numeracy variable. Participants with a score higher than the median of DRNT scores ( M d n = 12 ) were classified as a high-numeracy group. Subsequently, those with a score lower than or equal to the median were classified as a low-numeracy group.
We found evidence to support the first hypothesis (H1 confirmed) that the visualization literacy of the high-numeracy user group would be higher than that of the low-numeracy user group. We ran an independent-sample t-test to determine whether differences in visualization literacy scores between the high-numeracy group and the low-numeracy group. We found no significant outliers in the data as assessed by the inspection of a boxplot. Based on the Shapiro-Wilk test, visualization literacy scores for each numeracy group were normally distributed (high-numeracy group: W = 0 . 979 , p = 0 . 199 ; low-numeracy group: W = 0 . 991 , p = 0 . 799 ). The scores of the two groups also had homogeneous variances as assessed by the Levene’s test for equality of variances ( F = 0 . 995 , p = 0 . 032 ). The test results indicated that the visualization literacy scores were higher for the high-numeracy group ( M = 23 . 49 , S D = 7 . 63 ) than the low-numeracy group ( M = 15 . 64 , S D = 7 . 12 ), and they were significantly different, t ( 176 ) = 7 . 095 , p < 0 . 001 , Cohen’s d = 1 . 07 . We also confirmed the results through a point-biserial correlation analysis ( r p b = 0 . 47 , N = 178 , p < 0 . 001 ). The results relevant to H1 are summarized in Figure 3.

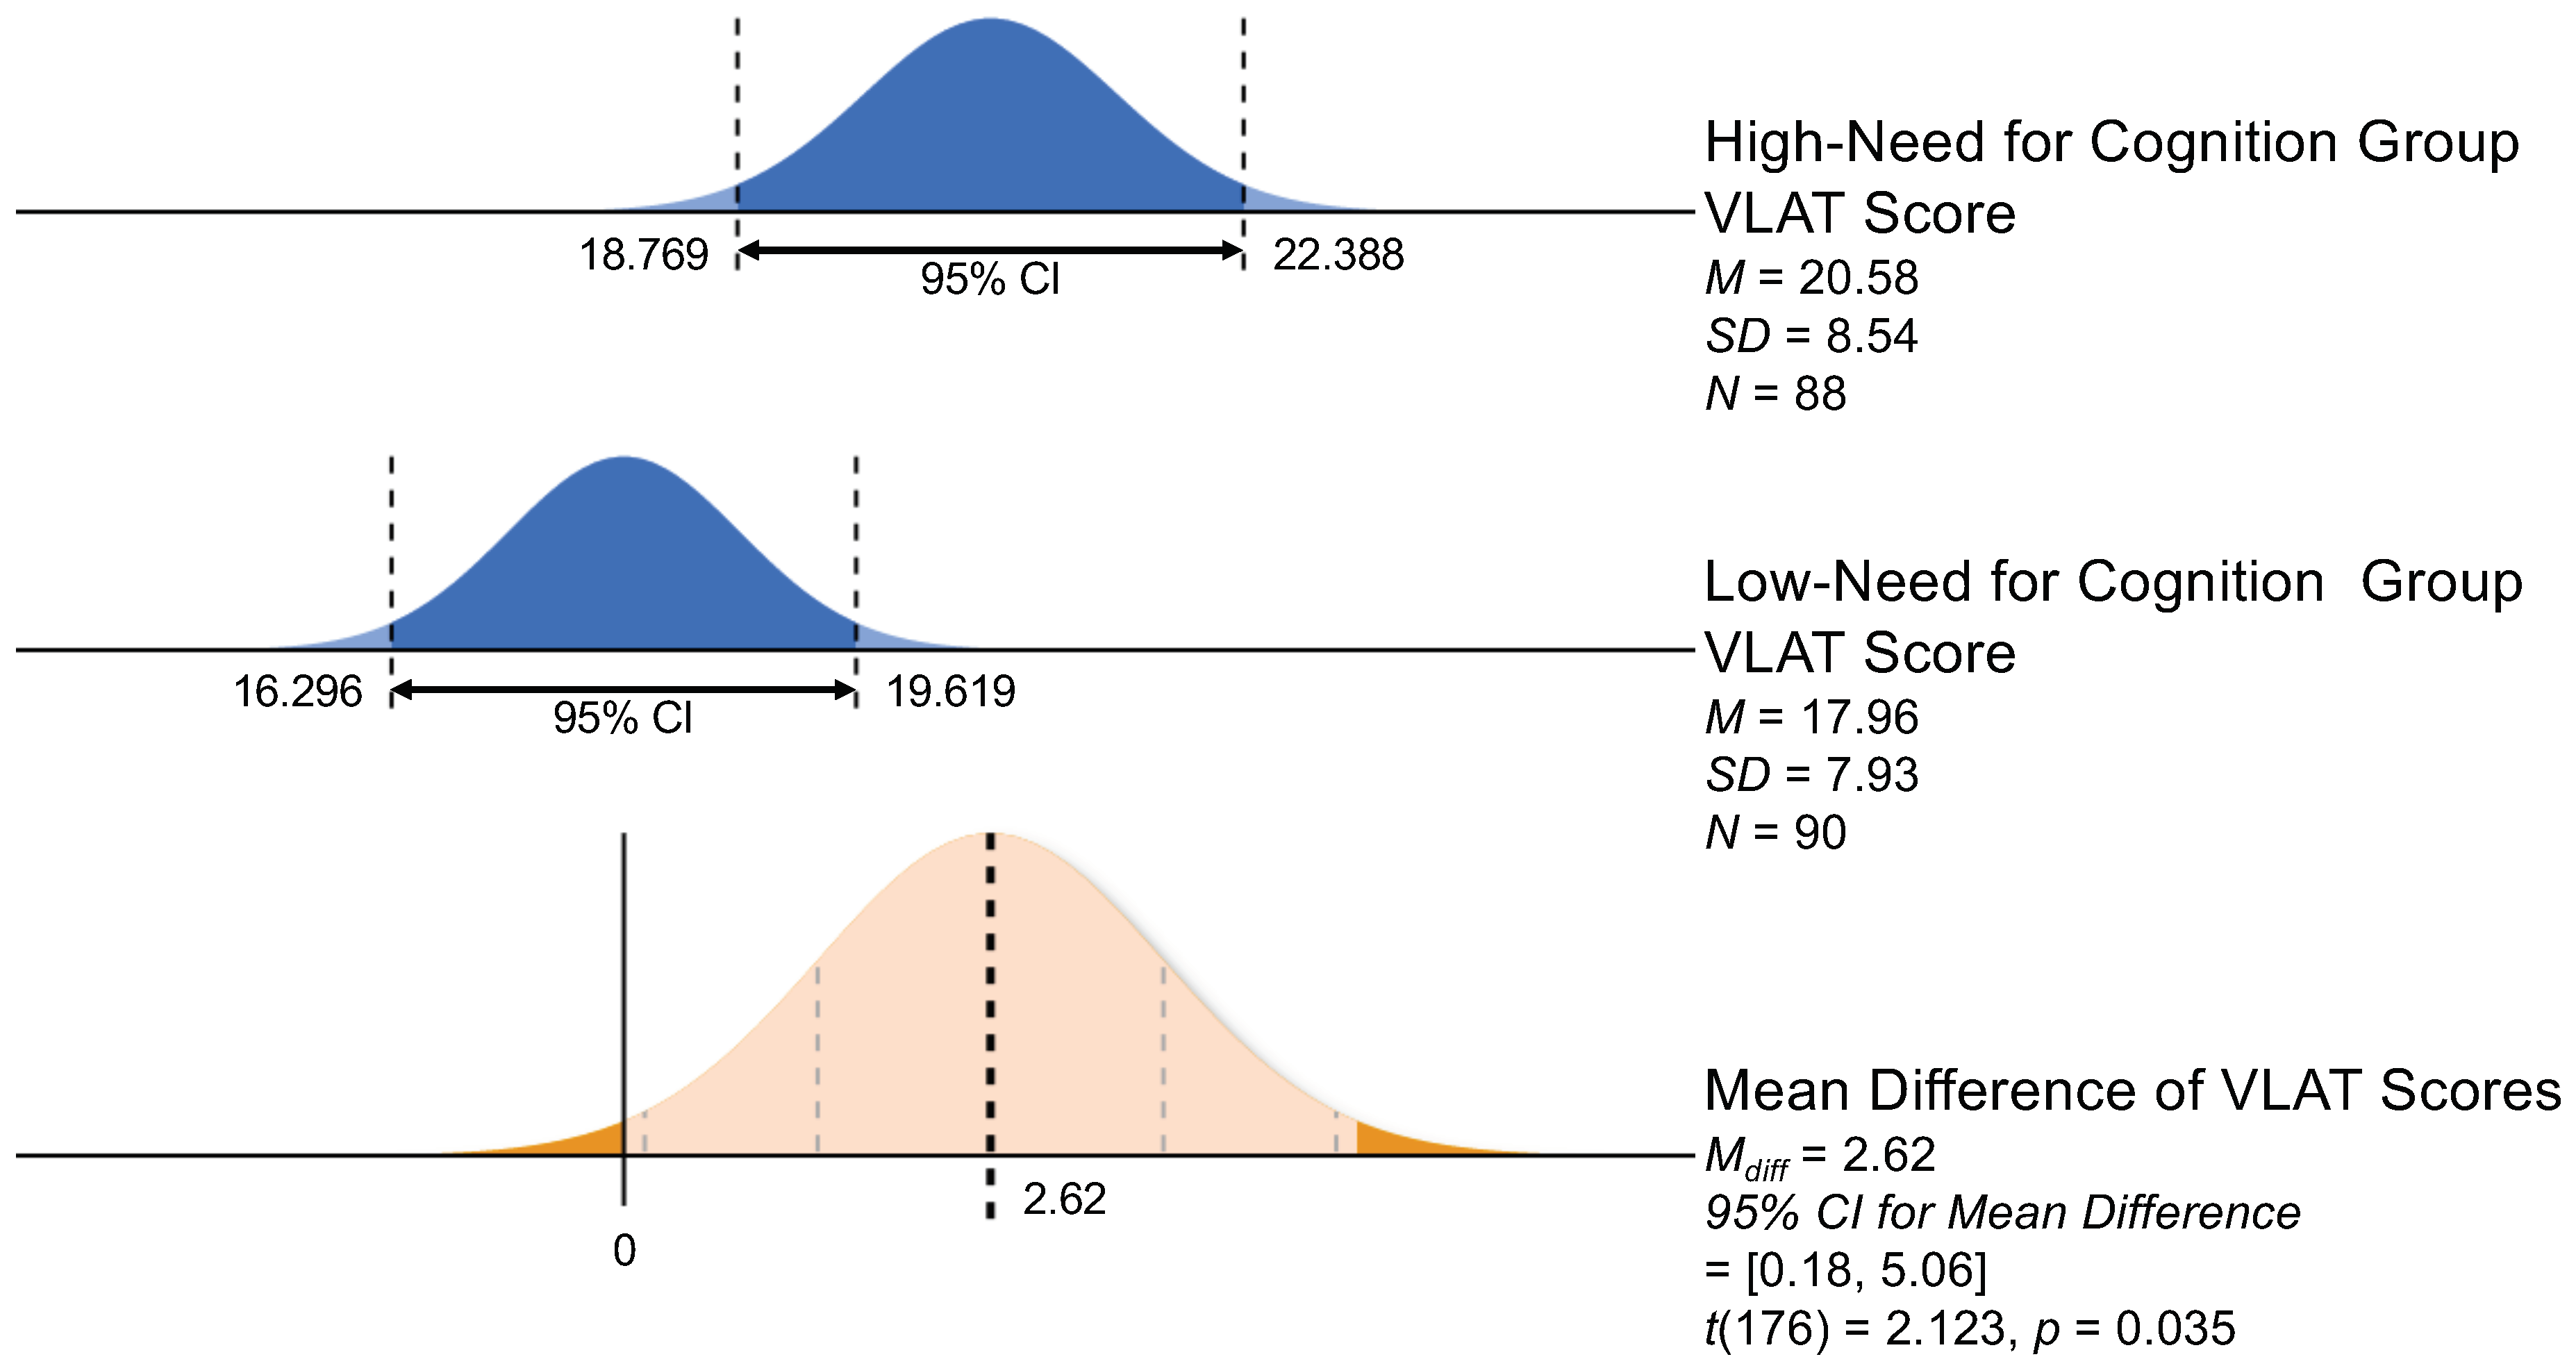
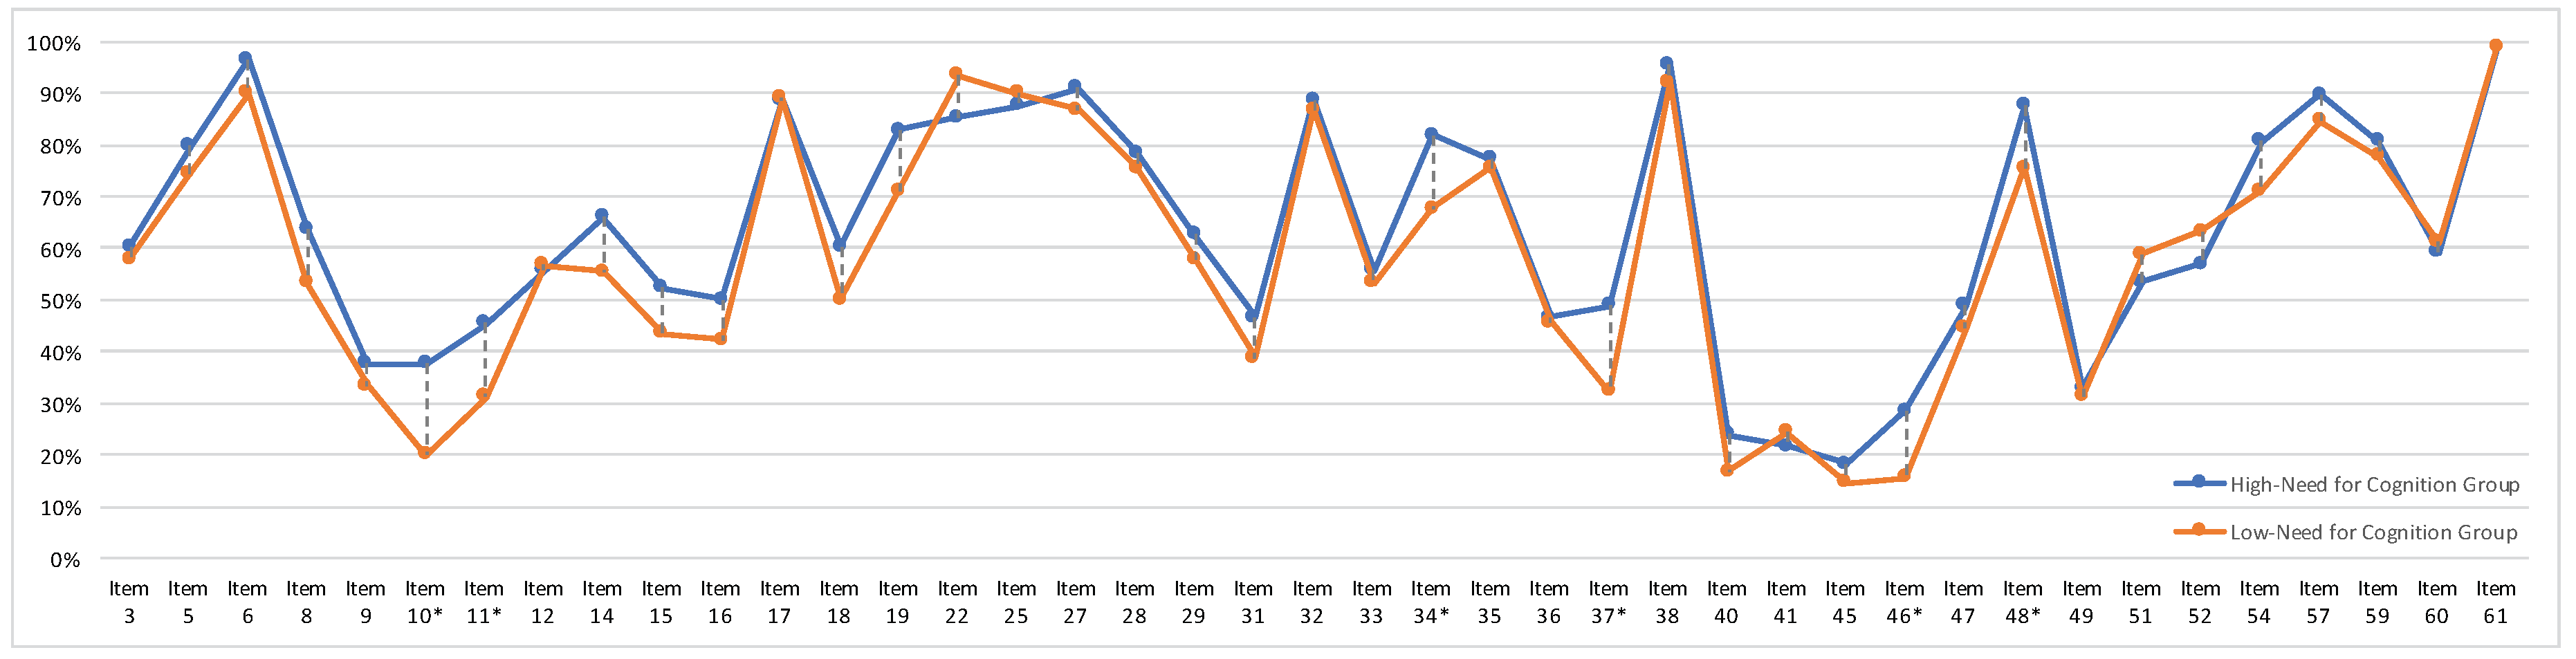
5.3. Need for Cognition and Visualization Literacy

As with numeracy, we divided the participants into two groups based on the median split method. Participants with a score higher than the median of NCS scores ( M d n = 86 ) were classified as a high-need-for-cognition group. The rest of participants were classified as a low-need-for-cognition group.
We found support for the second hypothesis (H2) that the visualization literacy of the high-need-for-cognition user group would be higher than that of the low-need-for-cognition user group (H2 Confirmed). To see whether differences in visualization literacy scores emerged between the high-need-for-cognition group and the low-need-for-cognition group, we also ran an independent-sample t-test. We found no significant outliers in the data as assessed by the inspection of a boxplot. Based on the Shapiro-Wilk test, visualization literacy scores for each need-for-cognition group were normally distributed (high-need-for-cognition group: W = 0 . 978 , p = 0 . 138 ; low-need-for-cognition group: W = 0 . 993 , p = 0 . 893 ). The scores of the two groups also had homogeneous variances as assessed by the Levene’s test for equality of variances ( F = 1 . 775 , p = 0 . 184 ). The test results indicated that the visualization literacy scores were higher for the high-need for cognition group ( M = 20 . 58 , S D = 8 . 54 ) than the low-need for cognition group ( M = 17 . 96 , S D = 7 . 93 ), and they were significantly different, t ( 176 ) = 2 . 123 , p = 0 . 035 , Cohen’s d = 0 . 32 . We also double-checked the results by a point-biserial correlation analysis ( r p b = 0 . 16 , N = 178 , p = 0 . 035 ). The results relevant to H2 are summarized in Figure 4.

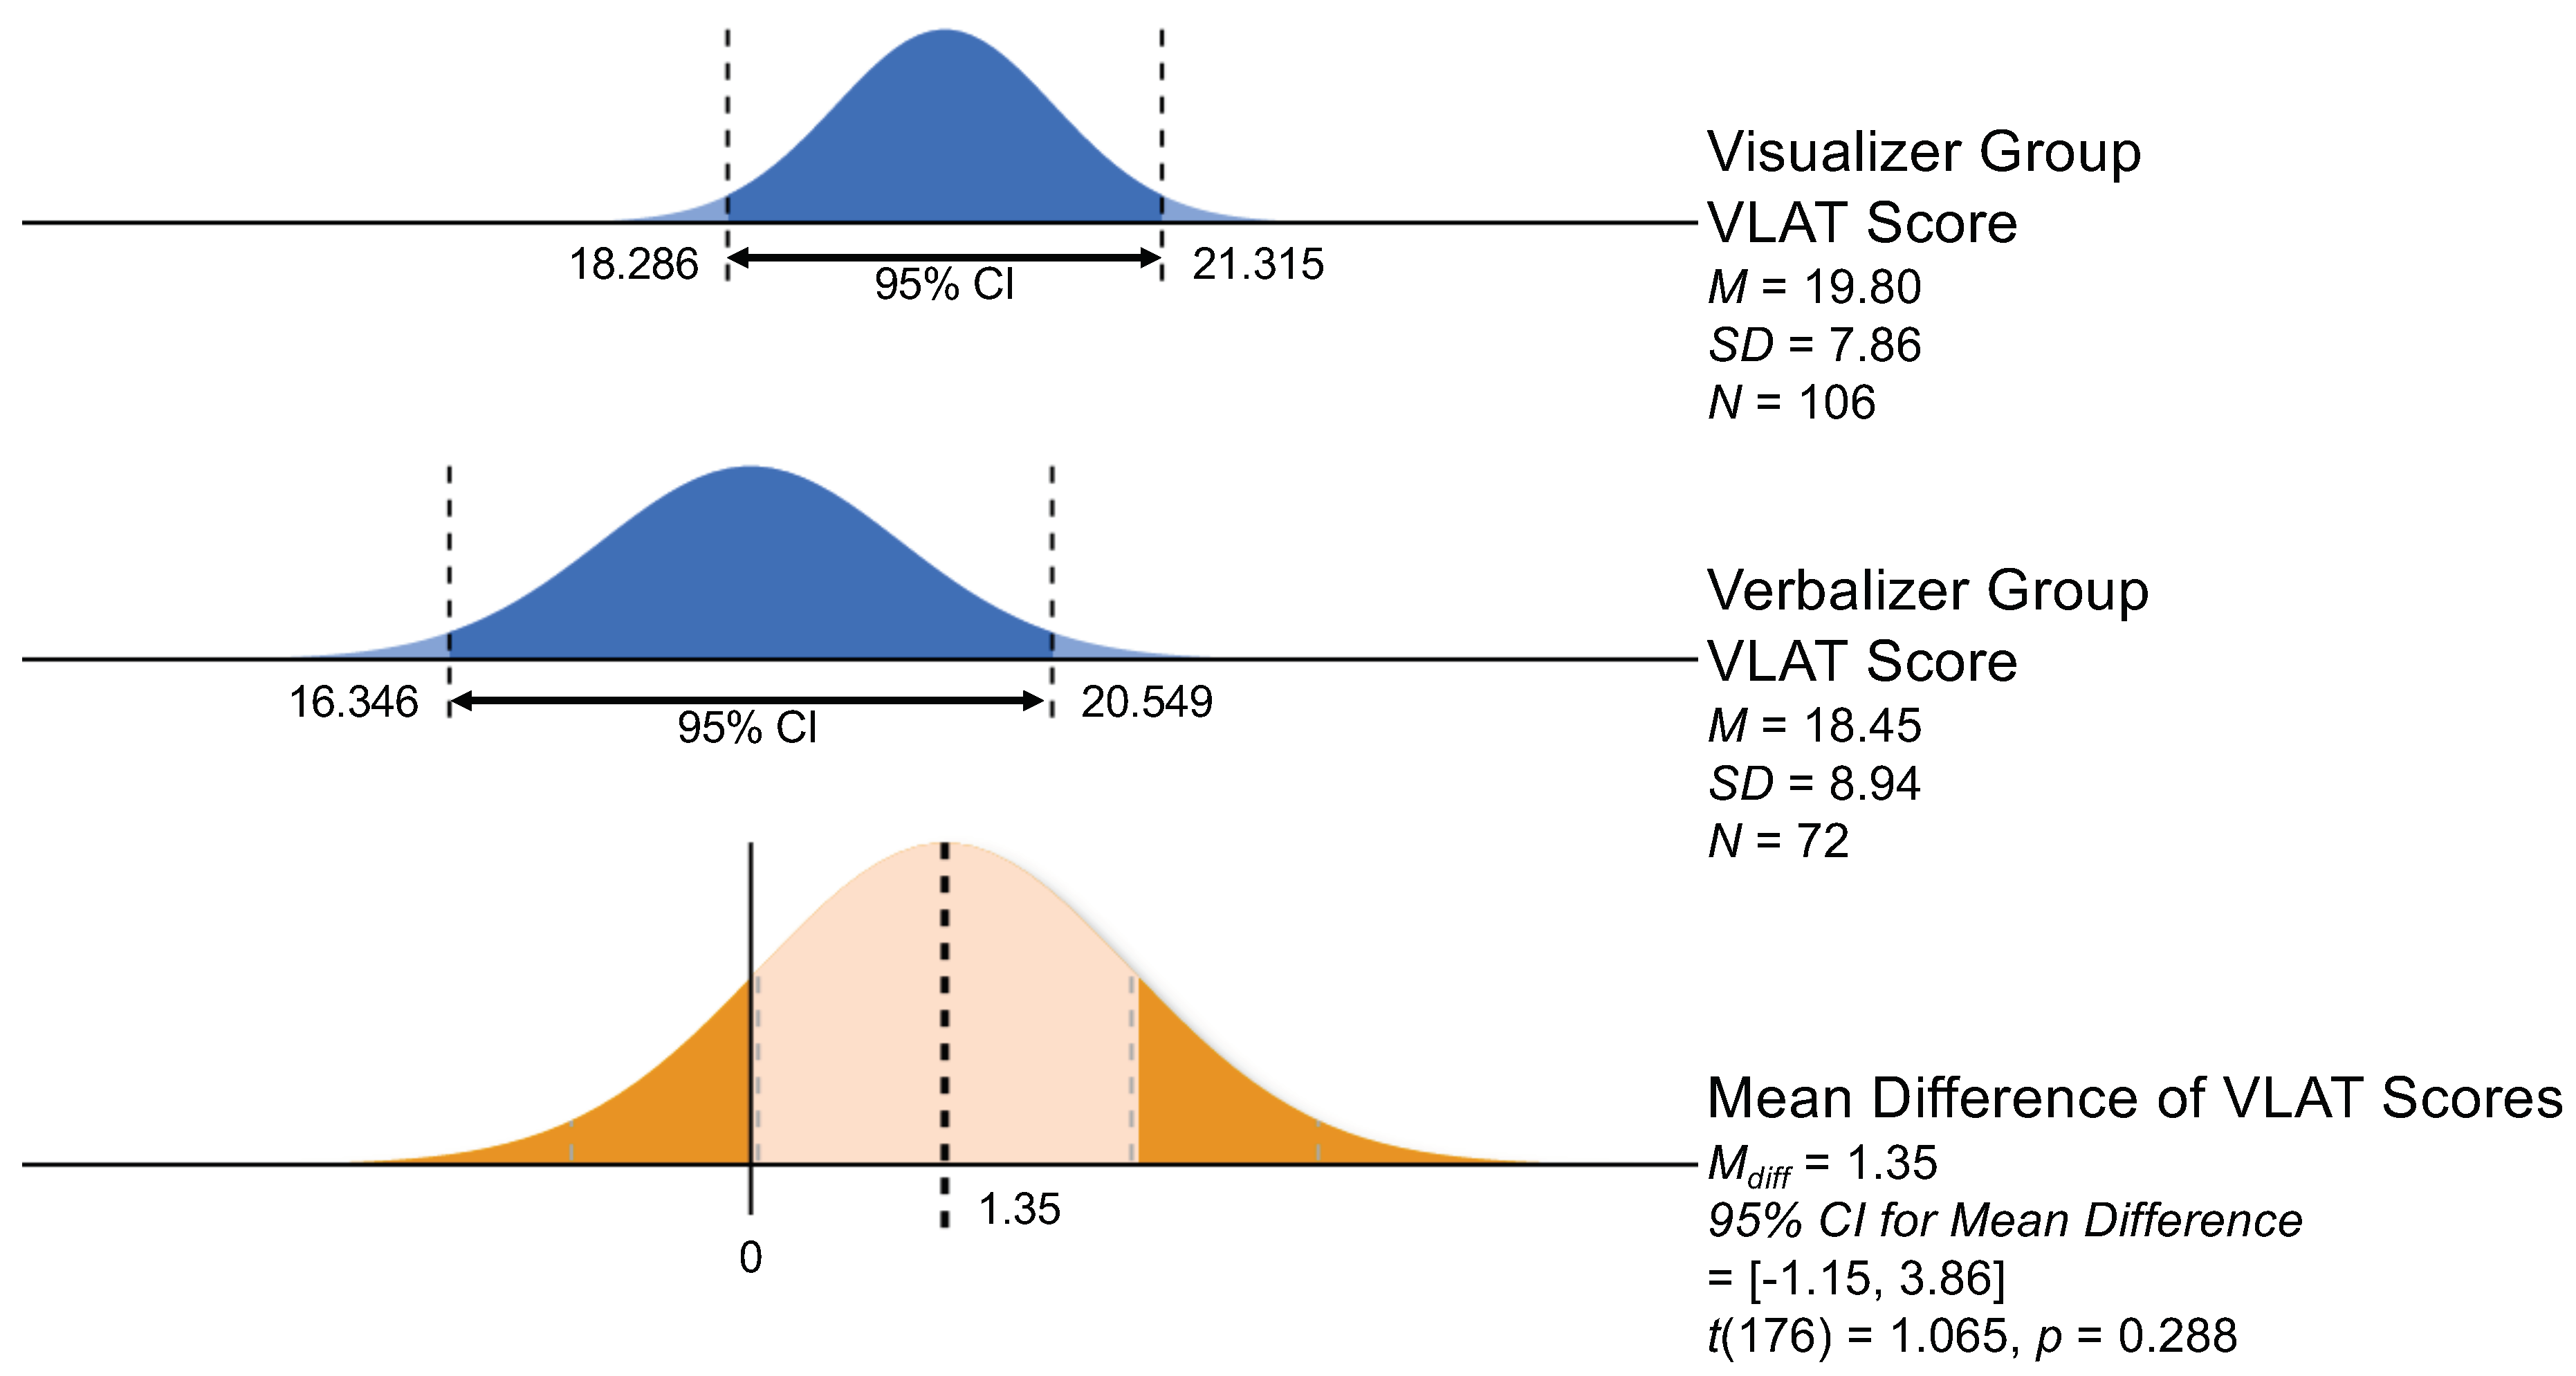
5.4. Visualizer-Verbalizer and Visualization Literacy

We divided the participants into two groups according to the VVQ criteria [43] instead of the median split method. Participants who scored higher than 0 on the VVQ were classified as a visualizer style group. Participants who scored lower than or equal to 0 on the VVQ were classified as a verbalizer style group.
We did not find support for the last hypothesis (H3 not supported) that the visualization literacy of the visualizer style user group would be higher than that of the verbalizer style user group. We determined whether differences emerged in visualization literacy scores between the visualizer group and the verbalizer group through an independent-sample t-test. We found no significant outliers in the data as assessed by the inspection of a boxplot. Based on the Shapiro-Wilk test, visualization literacy scores for each group were normally distributed (visualizer group: W = 0 . 992 , p = 0 . 828 ; verbalizer group: W = 0 . 985 , p = 0 . 537 ). The scores of the two groups also had homogeneous variances as assessed by Levene’s test for equality of variances ( F = 3 . 077 , p = 0 . 081 ). The test results showed no statistically significant differences in visualization literacy scores between the visualizer group ( M = 19 . 80 , S D = 7 . 86 ) and the verbalizer group ( M = 18 . 45 , S D = 8 . 94 ), t ( 176 ) = 1 . 065 , p = 0 . 288 . We also collected the results of a point-biserial correlation analysis; however, they were not statistically significant ( r p b = 0 . 08 , N = 178 , p = 0 . 288 ). The results relevant to H3 are summarized in Figure 5.

5.5. Further Analysis at the Item Level

After confirming that numeracy and need for cognition were influential cognitive characteristics in visualization literacy, we conducted a further analysis at the item level of the VLAT, because each item in the VLAT represented a specific visualization task with an associated data visualization (see Table 2 in Lee et al.’s paper [1] for details). As we did in Section 5.2 and Section 5.3, we divided the participants into high- and low-numeracy user groups and high- and low-need-for-cognition user groups based on the median split method. We calculated the percentages of the groups who answered Item i in the VLAT correctly. Then, we ran a two-proportion Z-test for each of the 41 items in order to test the difference in the two proportions between the high and low groups. The results are represented in Figure 6 and Figure 7. The asterisk marks indicate items that have a significant difference between high and low groups at the significance level of 0.05 based on the two-proportion Z-tests. Besides statistical tests, we also reviewed the general tendency of visualization literacy scores, especially in terms of visualization types and task types, between the high and low groups of cognitive measures.
First, we confirmed the general trends in the correct answer rates of the high-numeracy user group and the low-numeracy user group (Figure 6). The high-numeracy user group had higher rates of correct answers across all items in the VLAT as compared to the low-numeracy user group. In other words, the high-numeracy user group generally performed all data visualization tasks with associated visualizations better than the low-numeracy user group. In addition, the overall tendencies between the correct answer rates of the high-numeracy user group and the low-numeracy user group were very similar. Both groups showed relatively high correct answer rates for some items (e.g., Items 6, 17, 38, 61); they also showed relatively low correct answer rates for other items (e.g., Items 10, 40, 45). More specifically, compared to other tasks, users in the both groups showed low performance with the tasks of Make Comparisons (Items 9, 45, 46), Find Anomalies (Item 31), Find Extremum (Item 36), and Determine Range (Items 37, 49).
According to the results of Z-tests, we fond significant differences in 23 items between the high- and low-numeracy user groups. Among them, five items (Items 6, 17, 22, 27, 38) had relatively very high correct answer rates (≥80%) in the both high- and low-numeracy user groups even though there were significant differences between them. Among the remaining items that had significant differences between two groups, seven items (Items 10, 11, 19, 35, 40, 41, 47) were associated with the task of Retrieve Value with Stacked Bar Chart, Pie Chart, Area Chart, Stacked Area Chart, and Bubble Chart. The participants with low-numeracy performed the Retrieve Value tasks with the five data visualizations significantly worse than the participants with high-numeracy; furthermore, the correct answer rates for the items were not high. In addition, nine items that were associated with tasks that required simple arithmetic operations using retrieved values from visualizations also had significant differences between the two groups. For example, Items 3, 8, 29, 37, and 49 were associated with the task of Determine Range, and Items 5, 18, 34, and 54 were associated with the task of Make Comparisons. The participants with low numeracy performed these tasks significantly worse than the participants with high numeracy.
We also confirmed the general trends in correct answer rates of the high-need-for-cognition user group and the low-need-for-cognition user group (Figure 7). We observed few differences in correct answer rates between the high- and low-need-for-cognition groups. As shown in Figure 7, the rates followed the same trend, and their gap was narrower than that of the high- and low-numeracy groups in Figure 6. According to the results of Z-tests, we found significant differences in the correct answer rates of six items between the high- and low-need-for-cognition groups. Even though the participants with low-need for cognition showed worse performance with a number of tasks of Determine Range, Find Extremum, and Make Comparisons that required cognitive endeavors, than the participants with high-need-for-cognition, we did not find conclusive findings from the six items.
Another notable finding was that most items with Stacked Bar Chart (items 10, 11, 12, 14, 15) and Stacked Area Chart (items 40, 41, 45, 46) had low rates of correct answers for all four groups (i.e., high- and low-numeracy user groups and high- and low-need-for-cognition user groups). Regardless of the groups, the participants did not perform well in visualization tasks with the two data visualizations. Particularly, they lacked the ability to understand the visual encoding scheme of stacked visual objects in the two visualizations.

6. Discussion

In this section, we discuss our findings and share lessons learned from this study. We connect our findings to previous studies and provide implications for future work.

6.1. Discussion on the Correlation

The goal of this study was to investigate the correlation between user cognitive characteristics and visualization literacy. We focused on numeracy, need for cognition, and visualizer-verbalizer style in the scope of this study. Our results confirmed that an individual’s numeracy and need for cognition has a positive correlation with his/her visualization literacy, but visualizer-verbalizer cognitive style deos not.
Our study shows that numeracy correlates positively with visualization literacy. Users with high-numeracy had significantly high visualization literacy scores (on average, it was approximately 50% higher). It indicates that an individual who is good at understanding, using, and processing numerical information would be likely to be good at reading and interpreting data visualizations. This is consistent with a finding in the context of health risk assessment tasks with bar charts and icon arrays from Galesic and Garcia-Retamero [14]. Perhaps it is an inevitable result because data visualizations are graphically transformed forms of numerical data [62]. In particular, we may also speculate possible reasons that low-numeracy users may perform poorly at certain visualization tasks that require numerical manipulation (e.g., Determine Range, Make Comparisons, and Find Correlations/Trends). Low-numeracy users may not have established a proper understanding of visual encoding schemes for certain data visualizations (e.g., Bubble Chart) and thus may be inaccurate in carrying out visualization tasks. Low-numeracy users may also neglect crucial numerical information on data visualizations. Low-numeracy users may simply not be interested in visually represented numerical data. Our additional findings in Section 5.5 allude to these speculations further.
In addition to numeracy, need for cognition also turned out to have a positive correlation with visualization literacy. However, the correlation between need for cognition and visualization literacy was not as high as that between numeracy and visualization literacy (numeracy and visualization literacy: Cohen’s d = 1 . 07 ; need for cognition and visualization literacy: Cohen’s d = 0 . 32 ). Even though it has a medium-small effect size, this still indicates that if an individual tends to engage in and enjoy effortful cognitive endeavors, he/she would be good at reading and interpreting data visualizations. This finding is consistent with a recent study on a bar chart and a line chart [63]. According to literature on need for cognition (e.g., [36,38,64]), it is possible that high-need-for-cognition users may be motivated to extract information from visually represented data. In addition, high-need for cognition users may make fact-based judgments that are supported by underlying data. They may perhaps employ thorough seeking strategies while reading and interpreting data visualizations.
Surprisingly we did not find a correlation between visualizer-verbalizer cognitive style and visualization literacy. The visualizers’ ability to read and interpret data visualizations was no better than that of the verbalizers. This implies that an individual’s preference to use and process a certain format of information does not have a positive/negative correlation with his/her visualization literacy. Even if an individual prefers visual information (e.g., graphs, diagrams, pictures) and relies on visual information while conducting cognitive tasks, he/she may not be good at reading and interpreting data visualizations. However, even if an individual prefers perceiving, processing, and using verbal information (e.g., text, words), he/she may be able to use data visualizations without any problems. It is necessary to investigate this result further by considering relevant findings from other studies; for example, visualizer cognitive style may not be related to spatial rotation ability and visual working memory [42,44,65].

6.2. Implications for Education and Training

People are all different. Some people are well equipped to learn some skills, whereas others are not. Furthermore, people do not improve their abilities equally well through education and training because everybody has a unique set of cognitive characteristics [5]. In that sense, individuals’ visualization literacy may not automatically increase by the same means of education. So, we need to think about various and original education approaches by considering differences in cognitive characteristics. Based on our findings, we provide some implications for effective and tailored education and training approaches to improve an individual user’s visualization literacy.
We need to educate an individual’s numeracy for successful education in data visualization. The findings in this study show that numeracy has a positive correlation with visualization literacy. An individual’s ability to understand and manipulate numerical information may have positive correlation with his/her ability to construct a frame of visual encoding or transform visual encoding schemes when he/she tries to read data visualizations. Thus, we need to teach basic numerical and arithmetical concepts and facilitate their use at the same time that we teach data visualizations. However, we still do not have a clear answer on which cognitive tasks in numeracy are directly related to which visualization tasks/types. Future studies should investigate realtionships between individual cognitive tasks and visualization types/tasks in more detail.
We need to encourage an individual’s willingness to put cognitive effort into successfully learning data visualization. Need for cognition has a positive correlation with visualization literacy. This implies that an individual’s visualization literacy is related not only to his/her cognitive abilities but also to his/her willingness to engage in effortful cognitive activities. However, need for cognition can not easily improve through repetitive training like cognitive abilities (e.g., numeracy) because it depends on an individual’s inclinations. Therefore, we need to encourage students’ engagement with data visualizations. For example, data visualizations and instructional materials considering personal experience [3], curiosity, emotion, creativity [66], and perceived aesthetics [67] would increase learners’ motivation.

6.3. Toward Improving Human Parameters in Visualization Recommendation Systems

Taken together with previous work, the findings in this study provide empirical evidence that numeracy and need for cognition each has positive correlation with visualization literacy. In the following section, we introduce a subset of implications of our study for the other related research activities in the field of data visualization.
There are growing interests in developing visualization recommendation engines. Studies like those by Voyager [68], VizDeck [69], and VizRec [70] attempt to provide a ranked list of data visualizations following user inputs, data properties, and visualization types for adaptive exploration depending on users’ tasks in hand. However, we still lack an understanding of the human parameters in this avenue of research. Most current recommendation engines rely on static sets of perceptual and cognitive disciplines and user preferences, which cannot reflect individual users’ current and potential capabilities of using data visualizations. As shown in this study, visualization literacy is related to various types of user cognitive characteristics. Specific evidence of user cognitive characteristics along with their relationships to visualization literacy can be an important consideration in building visualization recommendation systems, especially user models in the systems. Therefore, we need to investigate how we use the nature of visualization literacy within the pipeline of visualization recommendation systems.
Some studies show procedural learning, which tracks the user’s analysis of visualizations and adapts them so that visualization systems can nudge the users about undiscovered trends and patterns or optimal data visualization types for further exploration. Furthermore, other studies have found the effects of individual factors on task performance with data visualizations e.g., [22,71], and they provided rationales to create visualization systems that are adaptive to individual differences. However, few studies have accounted for the aspect of the user’s ability to perform tasks with the recommended and adapted visualizations and their aptitude for learning new data visualization types. Visualization literacy plays a central role in procedural understanding and users’ task performance when confronted with data visualizations. The recommendation and adaptation may need to be more specific, not only by highlighting visual elements to nudge the user toward better performance but also by guiding users to learn how to manipulate interfaces and to unpack visual outcomes. More research efforts are needed to reveal users’ mental steps and cognitive behaviors that can help people learn more advanced visualizations so that the system can timely diagnosis users’ misconceptions, estimate their understanding, and provide appropriate guidance, feedback, suggestions, and instructions.

6.4. Limitations and Future Work

In this study, we conducted an experiment on a crowdsourcing platform to examine the correlation between cognitive characteristics and visualization literacy. The crowdsourcing platform has several advantages including affordable experiment costs and convenient participant recruitment in a short period time. However, some researchers might be uncomfortable with the crowdsourcing platform because they cannot control participants as other controlled lab studies. The participants’ level of understanding of tasks, level of engagement in tasks, and level of attention to tasks may affect the measurement results. Our experiment also requires a high degree of mental demand to complete the tasks and the results could be influenced by fatigue, in which we cannot capture in crowdsourcing platforms. Even though we used a number of filtering questions to keep the participants’ attention, more systematic ways are necessary to deal with the participants’ fatigue and attention issues.
In addition, we did not empirically show the causal relationships between visualization literacy and the three cognitive characteristics. Even though we provided some evidence for a correlation between visualization literacy and cognitive characteristics, the study does not imply any causalities between them. Thus, future empirical studies should investigate causal relationships between visualization literacy and cognitive characteristics to gain a deeper understanding of the nature of visualization literacy.
In future studies, the relations between visualization literacy and other cognitive characteristics need to be examined. Other cognitive characteristics include personality, level of experience, and demographic information, as copious human-computer interaction literature has already discussed. In particular, the relationships to demographic factors may provide practical and useful information for designing education and training programs for visualization literacy (e.g., programs for K-12 curriculums or an elderly populations).

7. Conclusions

In this study, we examined the correlation between cognitive characteristics and visualization literacy. In particular, we focused on three cognitive characteristics: numeracy, need for cognition, and visualizer-verbalizer style. We found that an individual’s numeracy and need for cognition are positively correlated to his/her visualization literacy. However, visualizer-verbalizer cognitive style did not have a correlation with visualization literacy.

Author Contributions

All authors conceived the research questions and the structure of this study. S.L. designed and conducted the experiment, and J.Y. helped with data collection. All authors wrote the paper; S.L. wrote an original draft and B.K., B.L., and S.K. revised the paper. S.K. secured a funding to publish the paper.

Funding

This work was partially supported by the National Research Foundation of Korea Grant (NRF-2017R1C1B5076926).

Conflicts of Interest

The authors declare no conflicts of interest.

References

  1. Lee, S.; Kim, S.H.; Kwon, B.C. VLAT: Development of a Visualization Literacy Assessment Test. IEEE Trans. Vis. Comput. Gr. 2017, 23, 551–560. [Google Scholar] [CrossRef] [PubMed]
  2. Börner, K.; Maltese, A.; Balliet, R.N.; Heimlich, J. Investigating Aspects of Data Visualization Literacy Using 20 Information Visualizations and 273 Science Museum Visitors. Inf. Vis. 2016, 15, 198–213. [Google Scholar] [CrossRef]
  3. Lee, S.; Kim, S.H.; Hung, Y.H.; Lam, H.; Kang, Y.A.; Yi, J.S. How do People Make Sense of Unfamiliar Visualizations?: A Grounded Model of Novice’s Information Visualization Sensemaking. IEEE Trans. Vis. Comput. Gr. 2016, 22, 499–508. [Google Scholar] [CrossRef] [PubMed]
  4. Boy, J.; Rensink, R.; Bertini, E.; Fekete, J.D. A Principled Way of Assessing Visualization Literacy. IEEE Trans. Vis. Comput. Gr. 2014, 20, 1963–1972. [Google Scholar] [CrossRef] [PubMed]
  5. Jonassen, D.H.; Grabowski, B.L. Handbook of Individual Differences, Learning, and Instruction; Lawrence Erlbaum Associates: Mahwah, NJ, USA, 1993. [Google Scholar]
  6. Smith, P.L.; Ragan, T.J. Instructional Design; Wiley: New York, NY, USA, 1999. [Google Scholar]
  7. Galesic, M.; Garcia-Retamero, R. Do low-numeracy people avoid shared decision making? Health Psychol. 2011, 30, 336–341. [Google Scholar] [CrossRef] [PubMed] [Green Version]
  8. Garcia-Retamero, R.; Galesic, M. Who proficts from visual aids: Overcoming challenges in people’s understanding of risks. Soc. Sci. Med. 2010, 70, 1019–1025. [Google Scholar] [CrossRef] [PubMed]
  9. Shah, P.; Freedman, E.G. Bar and Line Graph Comprehension: An Interaction of Top-Down and Bottom-Up Processes. Top. Cognit. Sci. 2011, 3, 560–578. [Google Scholar] [CrossRef] [PubMed]
  10. Bristor, V.J.; Drake, S.V. Linking the language arts and content areas through visual technology. J. Technol. Horizons Educ. 1994, 22, 74. [Google Scholar]
  11. Ruchikachorn, P.; Mueller, K. Learning Visualizations by Analogy: Promoting Visual Literacy through Visualization Morphing. IEEE Trans. Vis. Comput. Gr. 2015, 21, 1028–1044. [Google Scholar] [CrossRef] [PubMed]
  12. Kwon, B.C.; Lee, B. A Comparative Evaluation on Online Learning Approaches using Parallel Coordinate Visualization. In Proceedings of the SIGCHI Conference on Human Factors in Computing Systems, San Jose, CA, USA, 7–12 May 2016; pp. 993–997. [Google Scholar]
  13. Alper, B.; Riche, N.H.; Chevalier, F.; Boy, J.; Sezgin, M. Visualization Literacy at Elementary School. In Proceedings of the SIGCHI Conference on Human Factors in Computing Systems, Denver, CO, USA, 6–11 May 2017. [Google Scholar]
  14. Galesic, M.; Garcia-Retamero, R. Graph Literacy A Cross-Cultural Comparison. Med. Decis. Mak. 2011, 31, 444–457. [Google Scholar] [CrossRef] [PubMed]
  15. Mazur, D.J.; Hickam, D.H. Patients’ and physicians’ interpretations of graphic data displays. Med. Decis. Mak. 1993, 13, 59–63. [Google Scholar] [CrossRef] [PubMed]
  16. Shah, P.; Hoeffner, J. Review of Graph Comprehension Research: Implications for Instruction. Educ. Psychol. Rev. 2002, 14, 47–69. [Google Scholar] [CrossRef]
  17. Bertin, J. Semiology of Graphics: Diagrams, Networks, Maps; Esri Press: Redlands, CA, USA, 2010. [Google Scholar]
  18. Carswell, C.M. Choosing specifiers: An evaluation of the basic tasks model of graphical perception. Hum. Fact. 1992, 34, 535–554. [Google Scholar] [CrossRef] [PubMed]
  19. Wainer, H. Understanding graphs and tables. Educ. Res. 1992, 21, 14–23. [Google Scholar] [CrossRef]
  20. Conati, C.; Maclaren, H. Exploring the Role of Individual Differences in Information Visualization. In Proceedings of the Working Conference on Advanced Visual Interfaces, Napoli, Italy, 28–30 May 2018; ACM: New York, NY, USA, 2008; pp. 199–206. [Google Scholar]
  21. Conati, C.; Carenini, G.; Hoque, E.; Steichen, B.; Toker, D. Evaluating the Impact of User Characteristics and Different Layouts on an Interactive Visualization for Decision Making. Comput. Gr. Forum 2014, 33, 371–380. [Google Scholar] [CrossRef] [Green Version]
  22. Toker, D.; Conati, C.; Carenini, G.; Haraty, M. Towards Adaptive Information Visualization: On the Influence of User Characteristics. In User Modeling, Adaptation, and Personalization; Masthoff, J., Mobasher, B., Desmarais, M.C., Nkambou, R., Eds.; Number 7379 in Lecture Notes in Computer Science; Springer: Berlin, Germany, 2012; pp. 274–285. [Google Scholar]
  23. Velez, M.C.; Silver, D.; Tremaine, M. Understanding visualization through spatial ability differences. In Proceedings of the IEEE Visualization, Minneapolis, MN, USA, 23–28 October 2005; pp. 511–518. [Google Scholar]
  24. Chen, C.; Czerwinski, M. Spatial ability and visual navigation: An empirical study. New Rev. Hypermedia Multimedia 1997, 3, 67–89. [Google Scholar] [CrossRef]
  25. Froese, M.E.; Tory, M.; Evans, G.W.; Shrikhande, K. Evaluation of Static and Dynamic Visualization Training Approaches for Users with Different Spatial Abilities. IEEE Trans. Vis. Comput. Gr. 2013, 19, 2810–2817. [Google Scholar] [CrossRef] [Green Version]
  26. Carenini, G.; Conati, C.; Hoque, E.; Steichen, B.; Toker, D.; Enns, J. Highlighting Interventions and User Differences: Informing Adaptive Information Visualization Support. In Proceedings of the SIGCHI Conference on Human Factors in Computing Systems, Toronto, ON, Canada, 26 April–1 May 2014; pp. 1835–1844. [Google Scholar]
  27. Yi, J.S. Implications of Individual Differences on Evaluating Information Visualization Techniques. In Proceedings of the Third Workshop on Beyond Time and Errors on Novel Evaluation Methods for Visualization (BELIV), Atlanta, GA, USA, 10–15 April 2010. [Google Scholar]
  28. Ziemkiewicz, C.; Ottley, A.; Crouser, R.J.; Chauncey, K.; Su, S.L.; Chang, R. Understanding Visualization by Understanding Individual Users. IEEE Comput. Gr. Appl. 2012, 32, 88–94. [Google Scholar] [CrossRef]
  29. Brooks, M.E.; Pui, S.Y. Are individual differences in numeracy unique from general mental ability? A closer look at a common measure of numeracy. Individ. Differ. Res. 2010, 8, 257–265. [Google Scholar]
  30. Lipkus, I.M.; Samsa, G.; Rimer, B.K. General performance on a numeracy scale among highly educated samples. Med. Decis. Mak. 2001, 21, 37–44. [Google Scholar] [CrossRef]
  31. Peters, E.; Dieckmann, N.; Dixon, A.; Hibbard, J.H.; Mertz, C.K. Less Is More in Presenting Quality Information to Consumers. Med. Care Res. Rev. 2007, 64, 169–190. [Google Scholar] [CrossRef] [PubMed]
  32. Peters, E.; Västfjäll, D.; Slovic, P.; Mertz, C.K.; Mazzocco, K.; Dickert, S. Numeracy and Decision Making. Psychol. Sci. 2006, 17, 407–413. [Google Scholar] [CrossRef] [PubMed]
  33. Rothman, R.L.; Montori, V.M.; Cherrington, A.; Pignone, M.P. Perspective: The Role of Numeracy in Health Care. J. Health Commun. 2008, 13, 583–595. [Google Scholar] [CrossRef] [PubMed] [Green Version]
  34. Okan, Y.; Garcia-Retamero, R.; Cokely, E.T.; Maldonado, A. Individual Differences in Graph Literacy: Overcoming Denominator Neglect in Risk Comprehension. J. Behav. Decis. Mak. 2012, 25, 390–401. [Google Scholar] [CrossRef]
  35. Cacioppo, J.T.; Petty, R.E.; Kao, C.F.; Rodriguez, R. Central and peripheral routes to persuasion: An individual difference perspective. J. Personal. Soc. Psychol. 1986, 51, 1032. [Google Scholar] [CrossRef]
  36. Cacioppo, J.T.; Petty, R.E.; Feinstein, J.A.; Jarvis, W.B.G. Dispositional differences in cognitive motivation: The life and times of individuals varying in need for cognition. Psychol. Bull. 1996, 119, 197–253. [Google Scholar] [CrossRef]
  37. Cacioppo, J.T.; Petty, R.E. The Need for Cognition. J. Persona. Soc. Psychol. 1982, 42, 116–131. [Google Scholar] [CrossRef]
  38. Blais, A.R.; Thompson, M.M.; Baranski, J.V. Individual differences in decision processing and confidence judgments in comparative judgment tasks: The role of cognitive styles. Personal. Individ. Differ. 2005, 38, 1701–1713. [Google Scholar] [CrossRef]
  39. Hullman, J.; Adar, E.; Shah, P. Benefitting InfoVis with Visual Difficulties. IEEE Trans. Vis. Comput. Gr. 2011, 17, 2213–2222. [Google Scholar] [CrossRef]
  40. Pandey, A.; Manivannan, A.; Nov, O.; Satterthwaite, M.; Bertini, E. The Persuasive Power of Data Visualization. IEEE Trans. Vis. Comput. Gr. 2014, 20, 2211–2220. [Google Scholar] [CrossRef] [Green Version]
  41. Pandey, A.V.; Rall, K.; Satterthwaite, M.L.; Nov, O.; Bertini, E. How Deceptive Are Deceptive Visualizations?: An Empirical Analysis of Common Distortion Techniques. In Proceedings of the 33rd Annual ACM Conference on Human Factors in Computing Systems, Seoul, Korea, 18–23 April 2015; pp. 1469–1478. [Google Scholar]
  42. Green, K.E.; Schroeder, D.H. Psychometric Quality of the Verbalizer-Visualizer Questionnaire as a Measure of Cognitive Style. Psychol. Rep. 1990, 66, 939–945. [Google Scholar] [CrossRef]
  43. Kirby, J.R.; Moore, P.J.; Schofield, N.J. Verbal and visual learning styles. Contemp. Educ. Psychol. 1988, 13, 169–184. [Google Scholar] [CrossRef]
  44. Kollöffel, B. Exploring the relation between visualizer–verbalizer cognitive styles and performance with visual or verbal learning material. Comput. Educ. 2012, 58, 697–706. [Google Scholar] [CrossRef]
  45. Schofield, N.J.; Kirby, J.R. Position location on topographical maps: Effects of task factors, training, and strategies. Cognit. Instruct. 1994, 12, 35–60. [Google Scholar] [CrossRef]
  46. Mendelson, A.L.; Thorson, E. How Verbalizers and Visualizers Process the Newspaper Environment. J. Commun. 2004, 54, 474–491. [Google Scholar] [CrossRef]
  47. Kim, S.H.; Li, S.; Kwon, B.C.; Yi, J.S. Investigating the Efficacy of Crowdsourcing on Evaluating Visual Decision Supporting System. In Proceedings of the Human Factors and Ergonomics Society Annual Meeting, Los Angeles, CA, USA, 19–23 September 2011; Volume 55, pp. 1090–1094. [Google Scholar]
  48. Berinsky, A.J.; Huber, G.A.; Lenz, G.S. Evaluating Online Labor Markets for Experimental Research: Amazon.com’s Mechanical Turk. Political Anal. 2012, 20, 351–368. [Google Scholar] [CrossRef]
  49. Kittur, A.; Chi, E.H.; Suh, B. Crowdsourcing user studies with Mechanical Turk. In Proceedings of the SIGCHI Conference on Human Factors in Computing Systems, Florence, Italy, 5–10 April 2008; pp. 453–456. [Google Scholar]
  50. Ipeirotis, P.G. Analyzing the Amazon Mechanical Turk marketplace. XRDS Crossroads ACM Mag. Stud. 2010, 17, 16–21. [Google Scholar] [CrossRef]
  51. Qi, D. An Inquiry into Language-switching in Second Language Composing Processes. Can. Modern Lang. Rev. 1998, 54, 413–435. [Google Scholar] [CrossRef]
  52. Willett, W.; Heer, J.; Agrawala, M. Strategies for Crowdsourcing Social Data Analysis. In Proceedings of the SIGCHI Conference on Human Factors in Computing Systems, Austin, TX, USA, 5–10 May 2012; pp. 227–236. [Google Scholar]
  53. McDonald, R.P. Test Theory: A Unified Treatment; Psychology Press: Hove, UK, 2013. [Google Scholar]
  54. Jum, N.; Bernstein, I.H. Psychometric Theory; McGraw-Hill: New York, NY, USA, 1978. [Google Scholar]
  55. Diamond, J.; Evans, W. The Correction for Guessing. Rev. Educ. Res. 1973, 43, 181–191. [Google Scholar] [CrossRef]
  56. Schwartz, L.M. The Role of Numeracy in Understanding the Benefit of Screening Mammography. Ann. Intern. Med. 1997, 127, 966–972. [Google Scholar] [CrossRef] [Green Version]
  57. Cacioppo, J.T.; Petty, R.E.; Kao, C.F. The Efficient Assessment of Need for Cognition. J. Personal. Assess. 1984, 48, 306–307. [Google Scholar] [CrossRef] [PubMed]
  58. Mayer, R.E.; Massa, L.J. Three Facets of Visual and Verbal Learners: Cognitive Ability, Cognitive Style, and Learning Preference. J. Educ. Psychol. 2003, 95, 833–846. [Google Scholar] [CrossRef]
  59. Cohen, R.J.; Swerdlik, M.E.; Phillips, S.M. Psychological Testing and Assessment: An Introduction to Tests and Measurement; Mayfield Publishing Co.: Mountain View, CA, USA, 1996. [Google Scholar]
  60. Iacobucci, D.; Posavac, S.S.; Kardes, F.R.; Schneider, M.J.; Popovich, D.L. The median split: Robust, refined, and revived. J. Consum. Psychol. 2015, 25, 690–704. [Google Scholar] [CrossRef]
  61. Venkatraman, M.P.; Marlino, D.; Kardes, F.R.; Sklar, K.B. Effects of individual difference variables on responses to factual and evaluative ads. Adv. Consum. Res. 1990, 17, 761–765. [Google Scholar]
  62. Ware, C. Information Visualization: Perception for Design, 2nd ed.; Morgan Kaufmann: San Mateo, CA, USA, 2004. [Google Scholar]
  63. Greenberg, R.A. Graph Comprehension: Difficulties, Individual Differences, and Instruction. Ph.D. Thesis, University of Michigan, Ann Arbor, MI, USA, 2014. [Google Scholar]
  64. Bailey, J.R. Need for cognition and response mode in the active construction of an information domain. J. Econ. Psychol. 1997, 18, 69–85. [Google Scholar] [CrossRef]
  65. Kozhevnikov, M.; Hegarty, M.; Mayer, R.E. Revising the visualizer-verbalizer dimension: Evidence for two types of visualizers. Cognit. Instruct. 2002, 20, 47–77. [Google Scholar] [CrossRef]
  66. Yalçin, M.A.; Elmqvist, N.; Bederson, B.B. Cognitive Stages in Visual Data Exploration. In Proceedings of the Sixth Workshop on Beyond Time and Errors on Novel Evaluation Methods for Visualization (BELIV), Baltimore, MD, USA, 24 October 2016; pp. 86–95. [Google Scholar]
  67. Quispel, A.; Maes, A.; Schilperoord, J. Graph and chart aesthetics for experts and laymen in design: The role of familiarity and perceived ease of use. Inf. Vis. 2016, 15, 238–252. [Google Scholar] [CrossRef]
  68. Wongsuphasawat, K.; Moritz, D.; Anand, A.; Mackinlay, J.; Howe, B.; Heer, J. Voyager: Exploratory Analysis via Faceted Browsing of Visualization Recommendations. IEEE Trans. Vis. Comput. Gr. 2016, 22, 649–658. [Google Scholar] [CrossRef]
  69. Perry, D.B.; Howe, B.; Key, A.M.; Aragon, C. VizDeck: Streamlining exploratory visual analytics of scientific data. In Proceedings of the iConference, Fort Worth, TX, USA, 12–15 February 2013; pp. 338–350. [Google Scholar]
  70. Mutlu, B.; Veas, E.; Trattner, C.; Sabol, V. Towards a Recommender Engine for Personalized Visualizations. User Modeling, Adaptation and Personalization; Springer: Cham, Switzerland, 2015; pp. 169–182. [Google Scholar]
  71. Ziemkiewicz, C.; Ottley, A.; Crouser, R.J.; Yauilla, A.R.; Su, S.L.; Ribarsky, W.; Chang, R. How Visualization Layout Relates to Locus of Control and Other Personality Factors. IEEE Trans. Vis. Comput. Gr. 2013, 19, 1109–1121. [Google Scholar] [CrossRef] [Green Version]
Figure 1. Screenshots for Visualization Literacy Assessment Test (VLAT).
Applsci 09 00488 g001
Figure 2. The experiment procedure that consists of six stages. Stages 2, 3, 4, and 5 were randomly presented to the participants.
Applsci 09 00488 g002
Figure 3. Difference in VLAT scores between high-numeracy user group and low-numeracy user group.
Applsci 09 00488 g003
Figure 4. Difference in VLAT scores between high-need-for-cognition user group and low-need-for-cognition user group.
Applsci 09 00488 g004
Figure 5. Difference in VLAT scores between visualizer user group and verbalizer user group.
Applsci 09 00488 g005
Figure 6. The percentages of high-numeracy group and low-numeracy group who answered Item i correctly. The asterisk marks indicate items that have a significant difference between the two groups based on the two-proportion Z-tests ( p < 0.05 ).
Applsci 09 00488 g006
Figure 7. The percentages of high-need for cognition group and low-need for cognition group who answered Item i correctly. The asterisk marks indicate items that have a significant difference between the two groups based on the two-proportion Z-tests ( p < 0.05 ).
Applsci 09 00488 g007
Table 1. Descriptive Statistics of Scores on the Measures.
MeasuresNMinMaxMSD
VLAT178−2.8137.6719.258.32
DRNT17831512.131.91
NCS1781812680.9825.81
VVQ178−33604.2812.93
Table 2. Correlations Between Four Measurement Scores ( N = 178 ).
MeasuresVLATDRNTNCSVVQ
VLAT1
DRNT 0 . 565 1
NCS0.0890.1211
VVQ0.1170.080 0 . 334 1
p < 0.01 .

