1. Introduction
Wood from planted forests is a natural material with a complex hierarchical structure consisting mainly of a cellulose, hemicellulose, and lignin matrix [
1]. Poplar wood (
Populus adenopoda Maxim) has become an important industrial raw material for the timber industry worldwide. However, this material has different properties, such as low density, softness, and poor dimensional stability, resulting in low-value materials [
2,
3,
4,
5,
6]. Improving the quality and use of poplar wood can not only promote the timber industry but can also effectively reduce the shortage in wood resources. Wood modification has developed rapidly in recent years. Industrial production of some modified wood products has begun [
7,
8,
9]. One of the major modification methods used is wood impregnation, which mainly refers to a technique in which a low-molecular-weight resin chemically reacts with a wood cell-wall polymer or physically fills and is fixed in a wood cell cavity [
10].
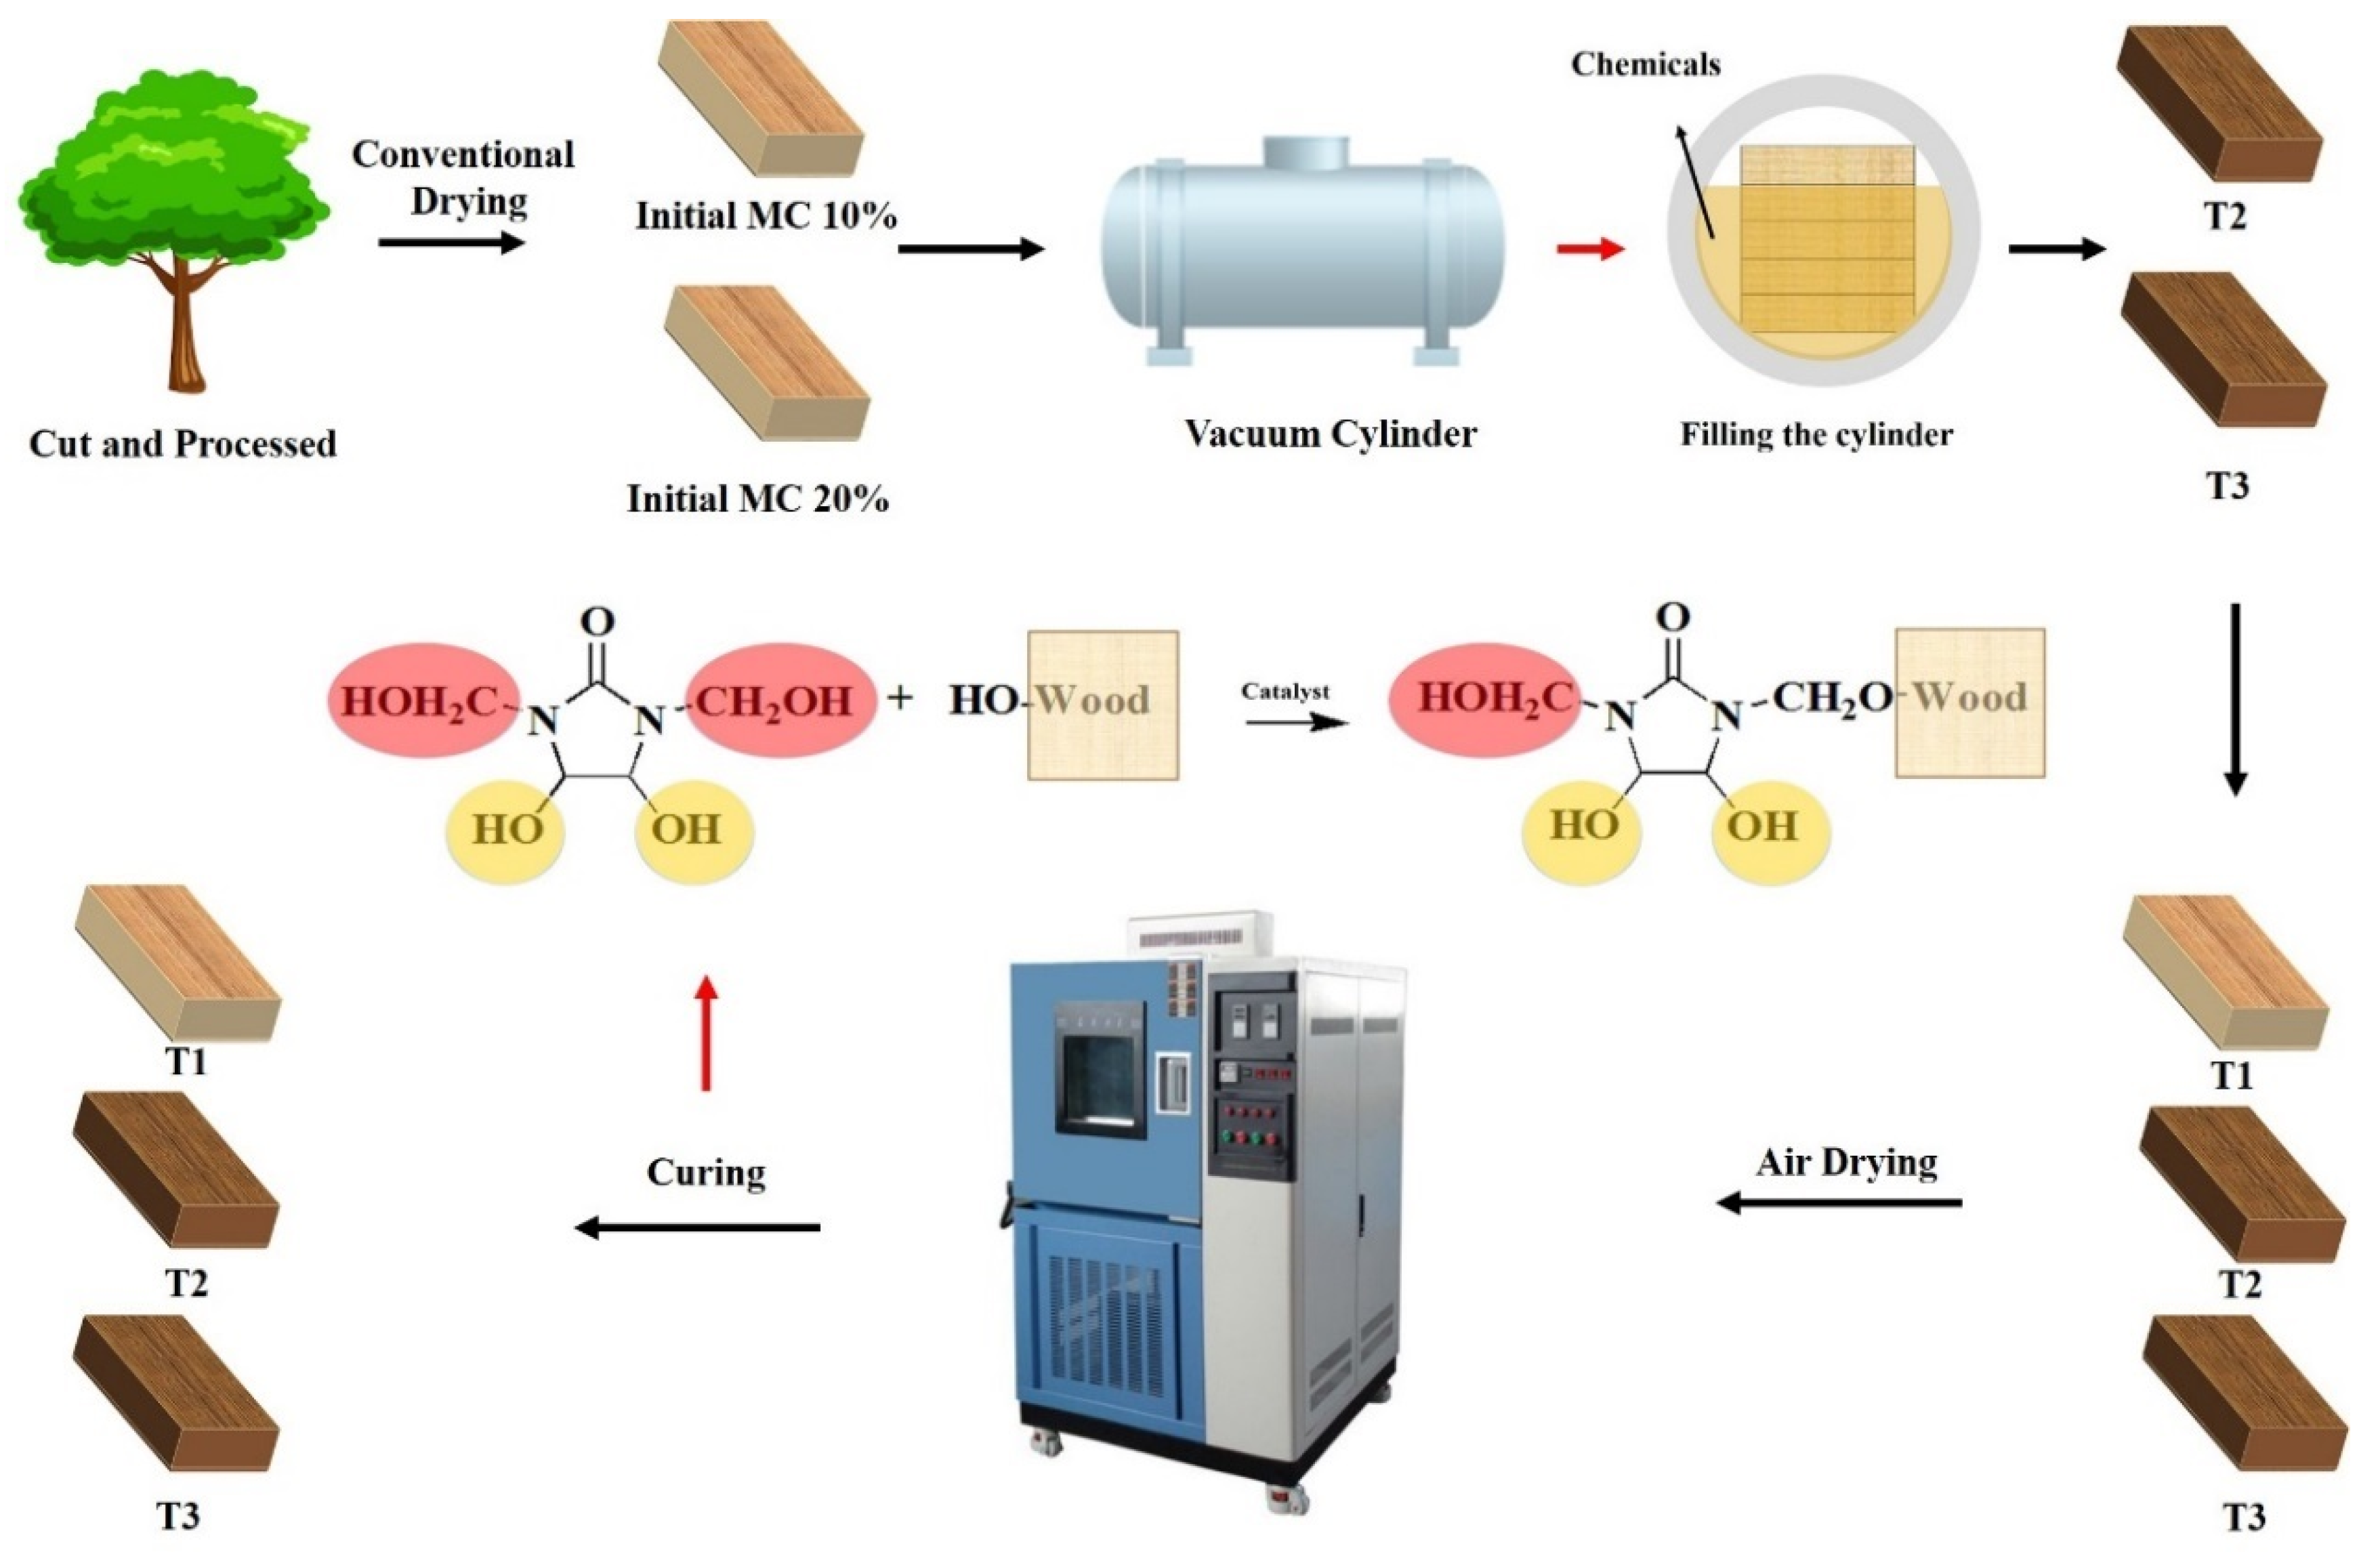
A type of resin commonly used in the textile industry is 1,3-dimethylol-4,5-dihydroxyethyleneurea (DM) which has achieved desirable results in wood modification, effectively improving the dimensional stability of wood and obtaining an anti-swelling efficiency (ASE) of up to 70%. These properties are attributed to its low molecular weight and strong polarity; in addition, the material can penetrate into the cell wall of wood, cross-link with wood cell-wall components, or self-condense and inflate cell walls [
11]. Xiao et al. systematically studied the modification of an aqueous mixture of sucrose and DM on the radiata pine wood. The effects on coating and weathering properties suggested that the adhesion of the modified wood film was significantly higher than that of the untreated wood, indicating that the modification treatment helped increase the durability of the paint film on the wood surface [
12]. Maltodextrin (MA) has a wide range of applications in food, pharmaceutical, papermaking, and other industries because of its low sweetness, low viscosity, low odor, and low browning reaction [
13]. Zhang et al. impregnated poplar wood with an MA-modified urea–formaldehyde resin, which not only retained the original natural properties of the wood but also conferred excellent properties on the treated material [
14]. Cai et al. used MA and DM as a joint modifier to systematically determine whether MA and DM could markedly improve the dimensional stability and mechanical strength of fast-growing poplar, providing an important theoretical basis for the current study [
15].
Wood impregnation is divided into two stages: modifier infusion and curing treatment. Drying removes moisture and causes modifiers to solidify and inflate within the cells [
16]. Wood drying is an important aspect of ensuring the quality of wood, reducing its degradation, and improving its utilization [
17,
18,
19]. It is also the most energy-intensive process in the production of wood products, comprising 40%–70% of the total energy consumption of wood processing enterprises in China [
20]. In wood drying, the surface moisture evaporates and then internal moisture moves toward the surface. Power is mainly derived from the water-vapor partial-pressure gradient and moisture content (MC) gradient. Ma Qing et al. evaluated the effect of initial MC on the impregnation of Chinese fir with BLW. The results indicated that with a decrease in initial MC, both the curing weight percent gain (WPG) and wet WPG of the Chinese fir increased, meanwhile, the compressive elastic modulus of modified Chinese fir at a higher initial MC was improved and met the standard of use, which meant modification under a relatively high initial MC could reduce energy consumption during drying [
21]. Most relevant studies on drying impregnated wood have focused on the drying aspect rather than the drying characteristics of impregnated wood. Zhou et al. compared three drying processes (air drying, high-temperature drying, and conventional drying) for impregnated poplar wood and determined that, compared with other methods, conventional drying was suitable for impregnated wood and achieved a higher quality; however, the process required a longer time [
22]. In the study by Peng et al., the initial cracking grade of impregnated poplar wood with a thickness of 25 mm was reduced after drying, but the grade of internal crack, section deformation, and drying rate was improved [
23]. Chai found that the drying defects of poplar wood after immersion with phenolic resin were not as severe as those of the pixel materials because of considerably lower drying stress than that of the untreated material [
24].
Previous studies have generally emphasized the weight-percent gain, weathering, flame retardancy, and other properties of modified wood during curing and rarely focused on the drying characteristics of wood after impregnation. In the current study, DM and MA were first used as modifiers to impregnate wood and investigate the drying rate, shrinkage, stratified MC, and stress index under the same drying schedules. An initial MC of about 8%–10% of oven-drying wood was typically used in immersion treatment [
21,
25]. This technique entailed very high drying costs to target MC. Thus, the current study first explored the wood with 20% initial MC to evaluate the effect on drying characteristics in order to improve the quality of the drying process and reduce energy consumption as well as to provide a reference for industrial drying.
3. Results and Discussion
3.1. Drying Curve and Drying Rate
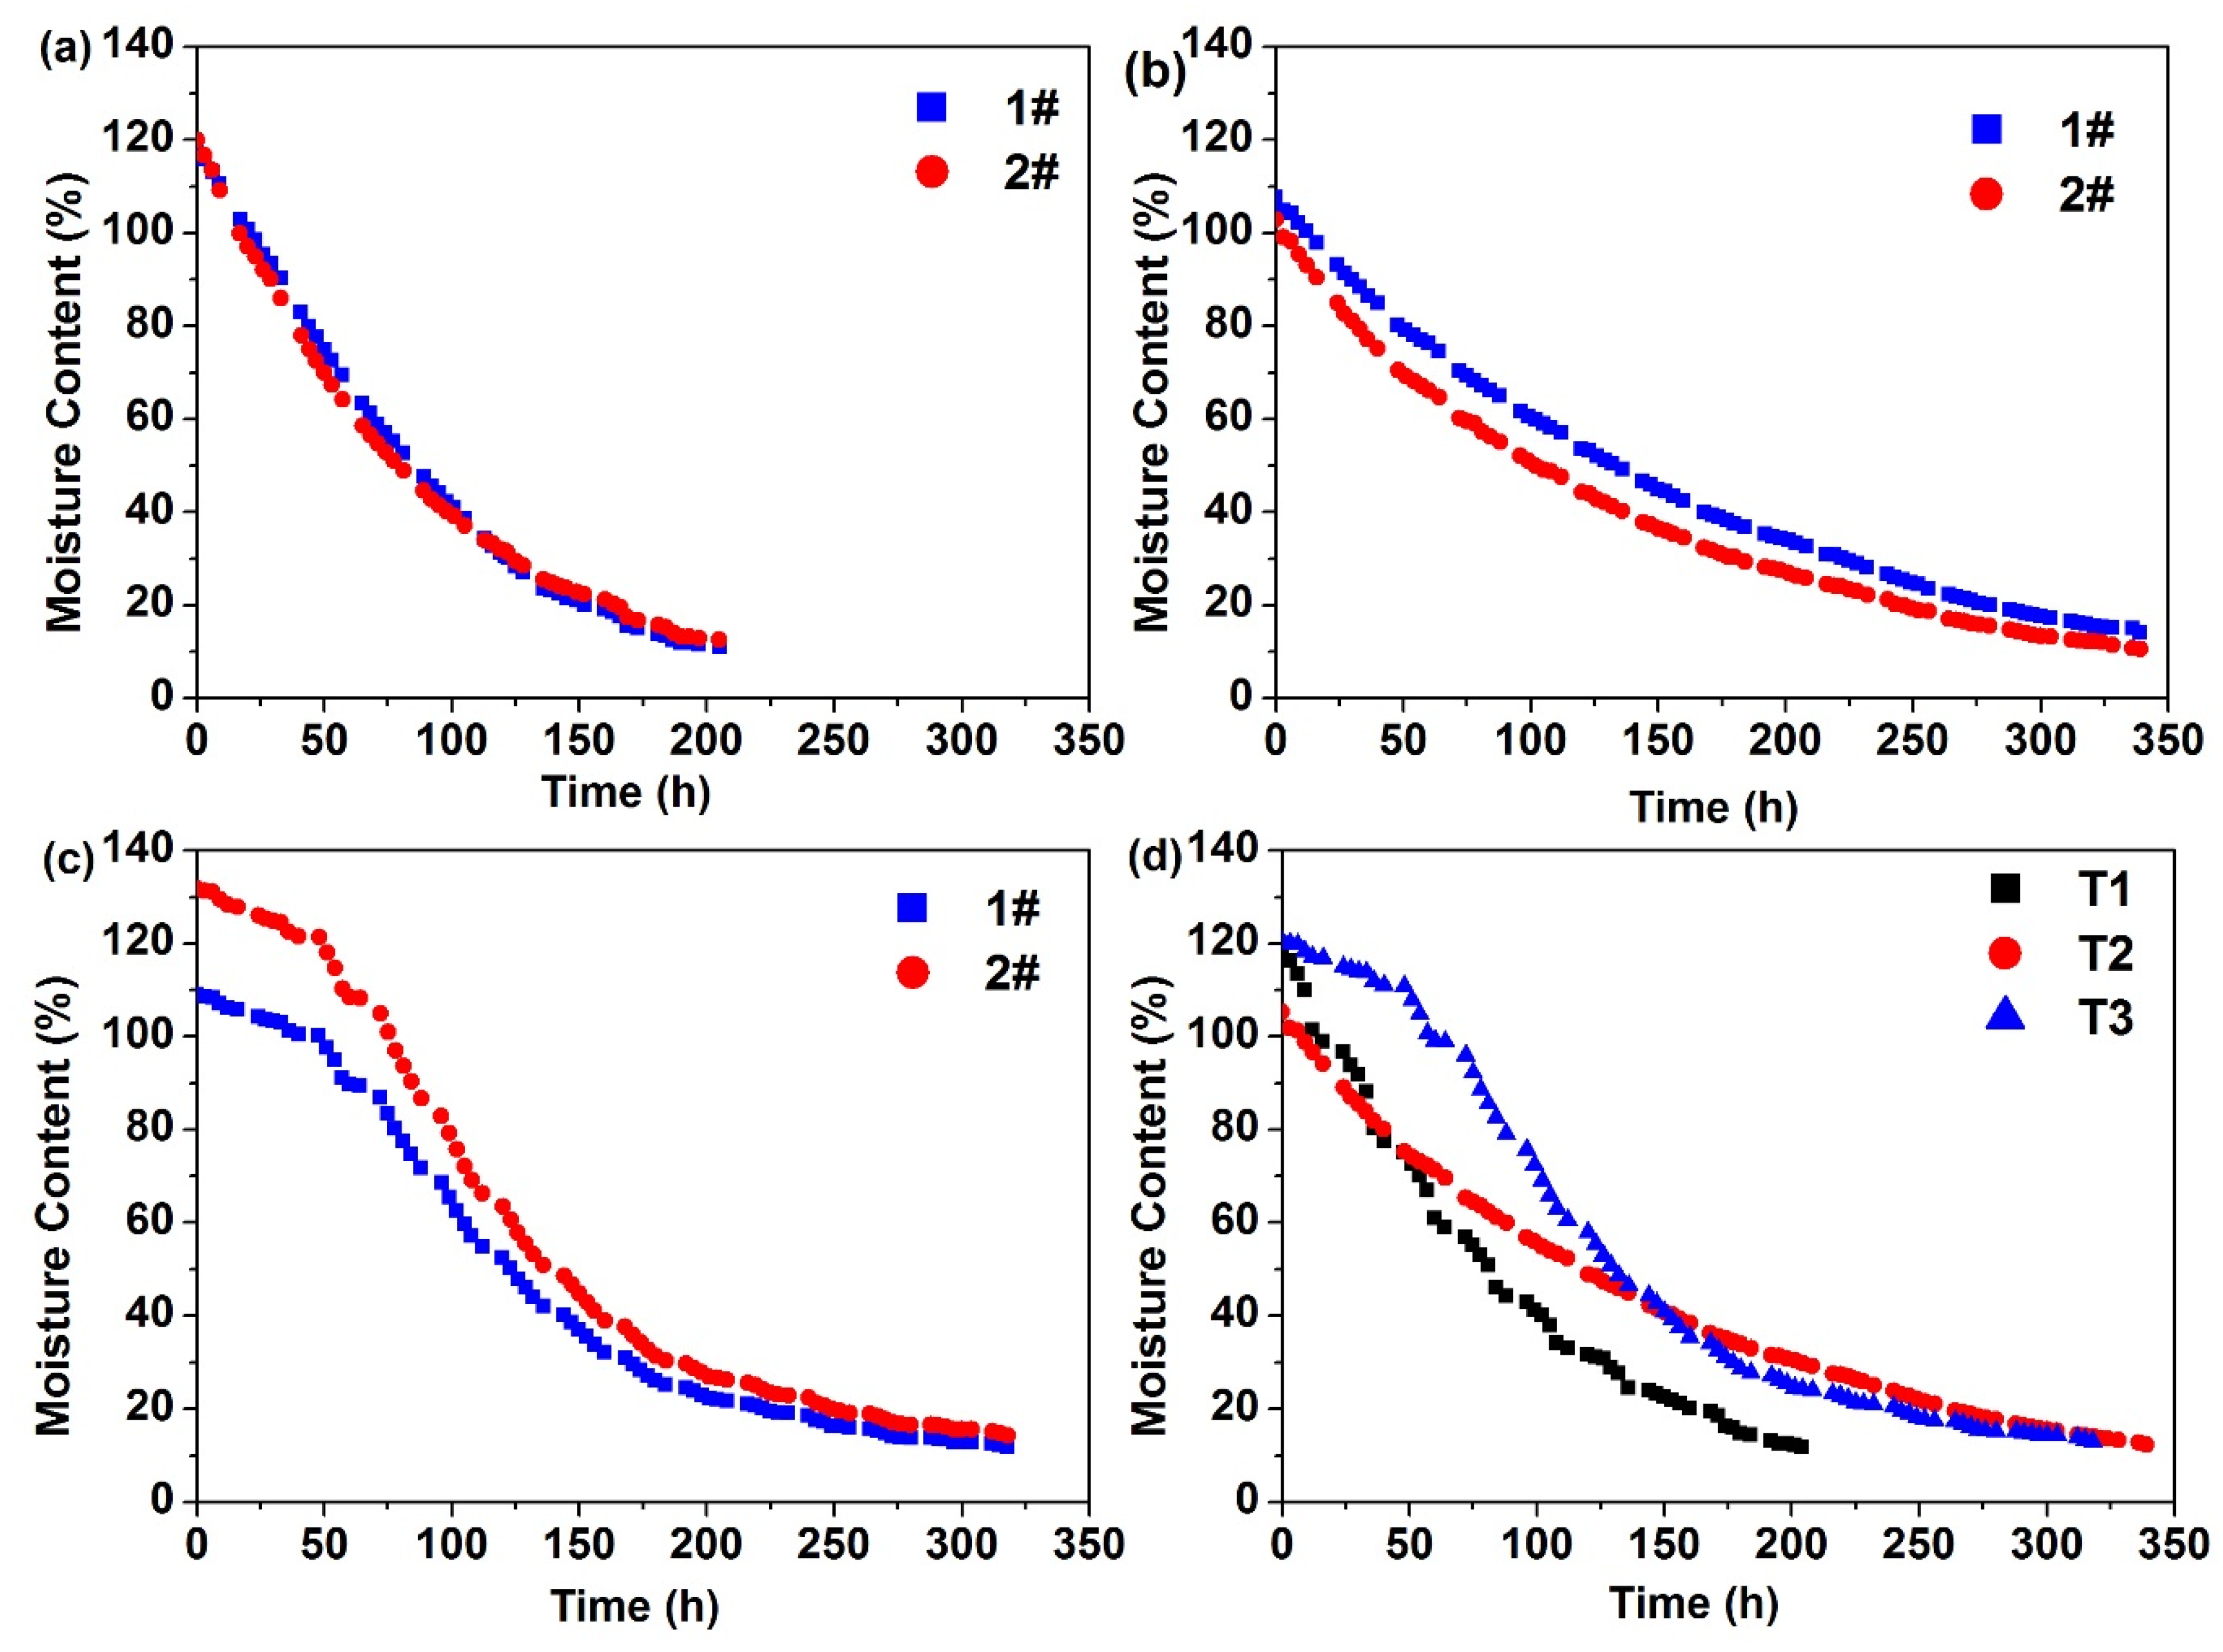
The trend of change in MC is depicted in
Figure 3. The two MC sample boards from each experimental group exhibited basically similar change trends. MC decreased abruptly at first and then decreased gradually when MC reached 30%. The reason could be that during drying, when the MC was higher than the fiber saturation point (FSP), the internal moisture flowed under capillary tension and water vapor pressure. This occurrence was caused by an increase in temperature and moisture along the large capillary system to the moving evaporation interface, prompting evaporation diffusion into the drying medium. At the early stage, the wood had a positive temperature gradient with high internal and low external surface areas, which increased the driving force of evaporation. This process accelerated the drying rate at this stage and reversed the temperature gradient, significantly decreasing the drying rate.
Figure 3d shows that the highest MC was obtained by T1, followed by T3 and T2. This result could be attributed to the solidification of the DM/MA resin in the wood conduit and cell cavity, which hindered the outward diffusion of moisture and led to a gradual decrease in the MC of T2. T3 was faster than T2 because of its high initial MC, impeding the complete penetration of modifiers into the interior of the wood conduit during immersion. Thus, a large amount of moisture was still diffused from the large capillary.
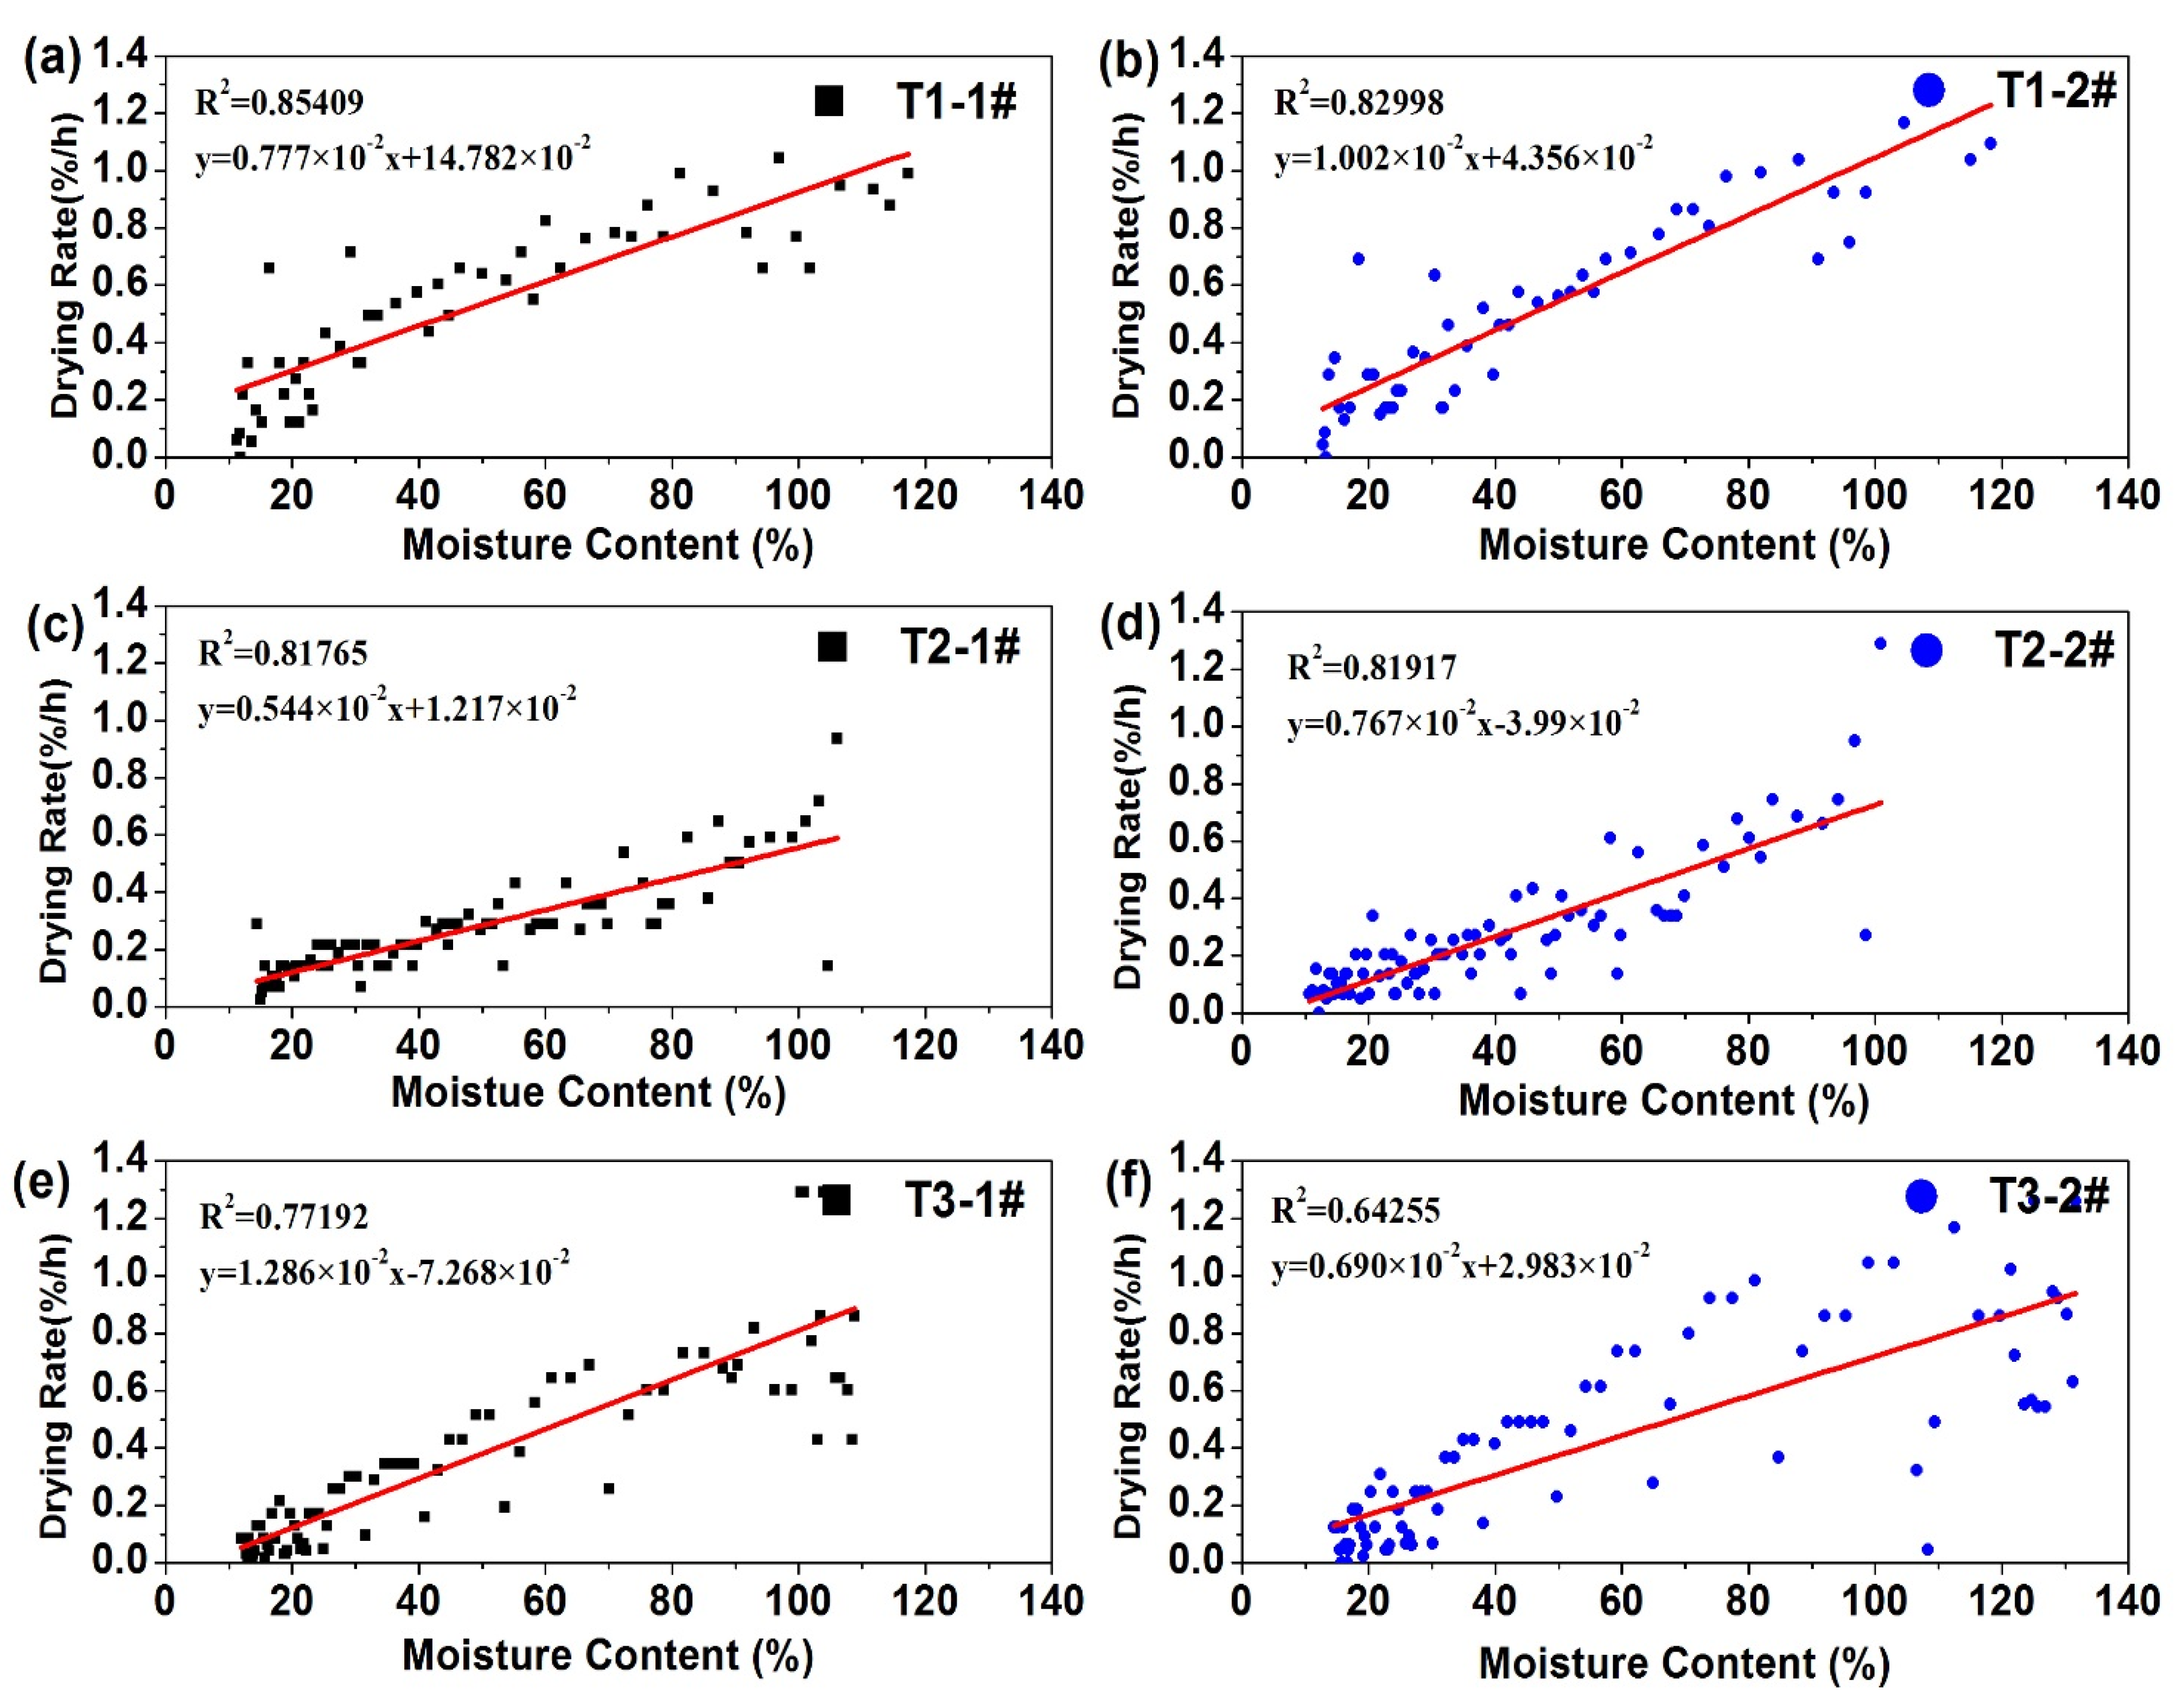
The drying rates are presented in
Figure 4, and the regression equations obtained using the least squares method and
R2 are also presented. The curve trends of the two sample boards in each group were similar. The average drying rates of T1, T2, and T3 were about 0.52%, 0.28%, and 0.33% per hour, respectively. These results are listed in
Table 2. As shown in the table, the standard deviation (STDEVA) of the initial MC of the three groups varies between 0.59% and 11.73%, and that of the final MC fluctuates between 0.42% and 1.74%, confirming that the error between different sample boards fell within a reasonable range. In addition, the MCs of T2 and T3 were reduced by about 46% and 37%, respectively, relative to that of T1. Simultaneously, the drying rates of T1 and T2 were close to the fitted regression line. The drying rate of T1 and T2 at each stage was significantly correlated with the regression equation (
R2 > 0.8), whereas the drying rate of T3 was more dispersed. The degree of fitting was also significantly correlated with the regression equation; regardless, the degree of fitting of T3 was slightly lower than those of T1 and T2 (
Figure 4). The reason might be that after immersion, the drying rate was adversely affected by the curing of modifiers, which hindered moisture migration along the large capillary tube. After immersion of wood at different initial MC stages, the drying rate of the wood was reduced to a similar extent, but the stability of the drying rate was not as good as that at a stage with a lower MC than those of T1 and T2; thus, the uniformity of the effect of impregnation could be determined by the initial MC.
3.2. Dimensional Stability
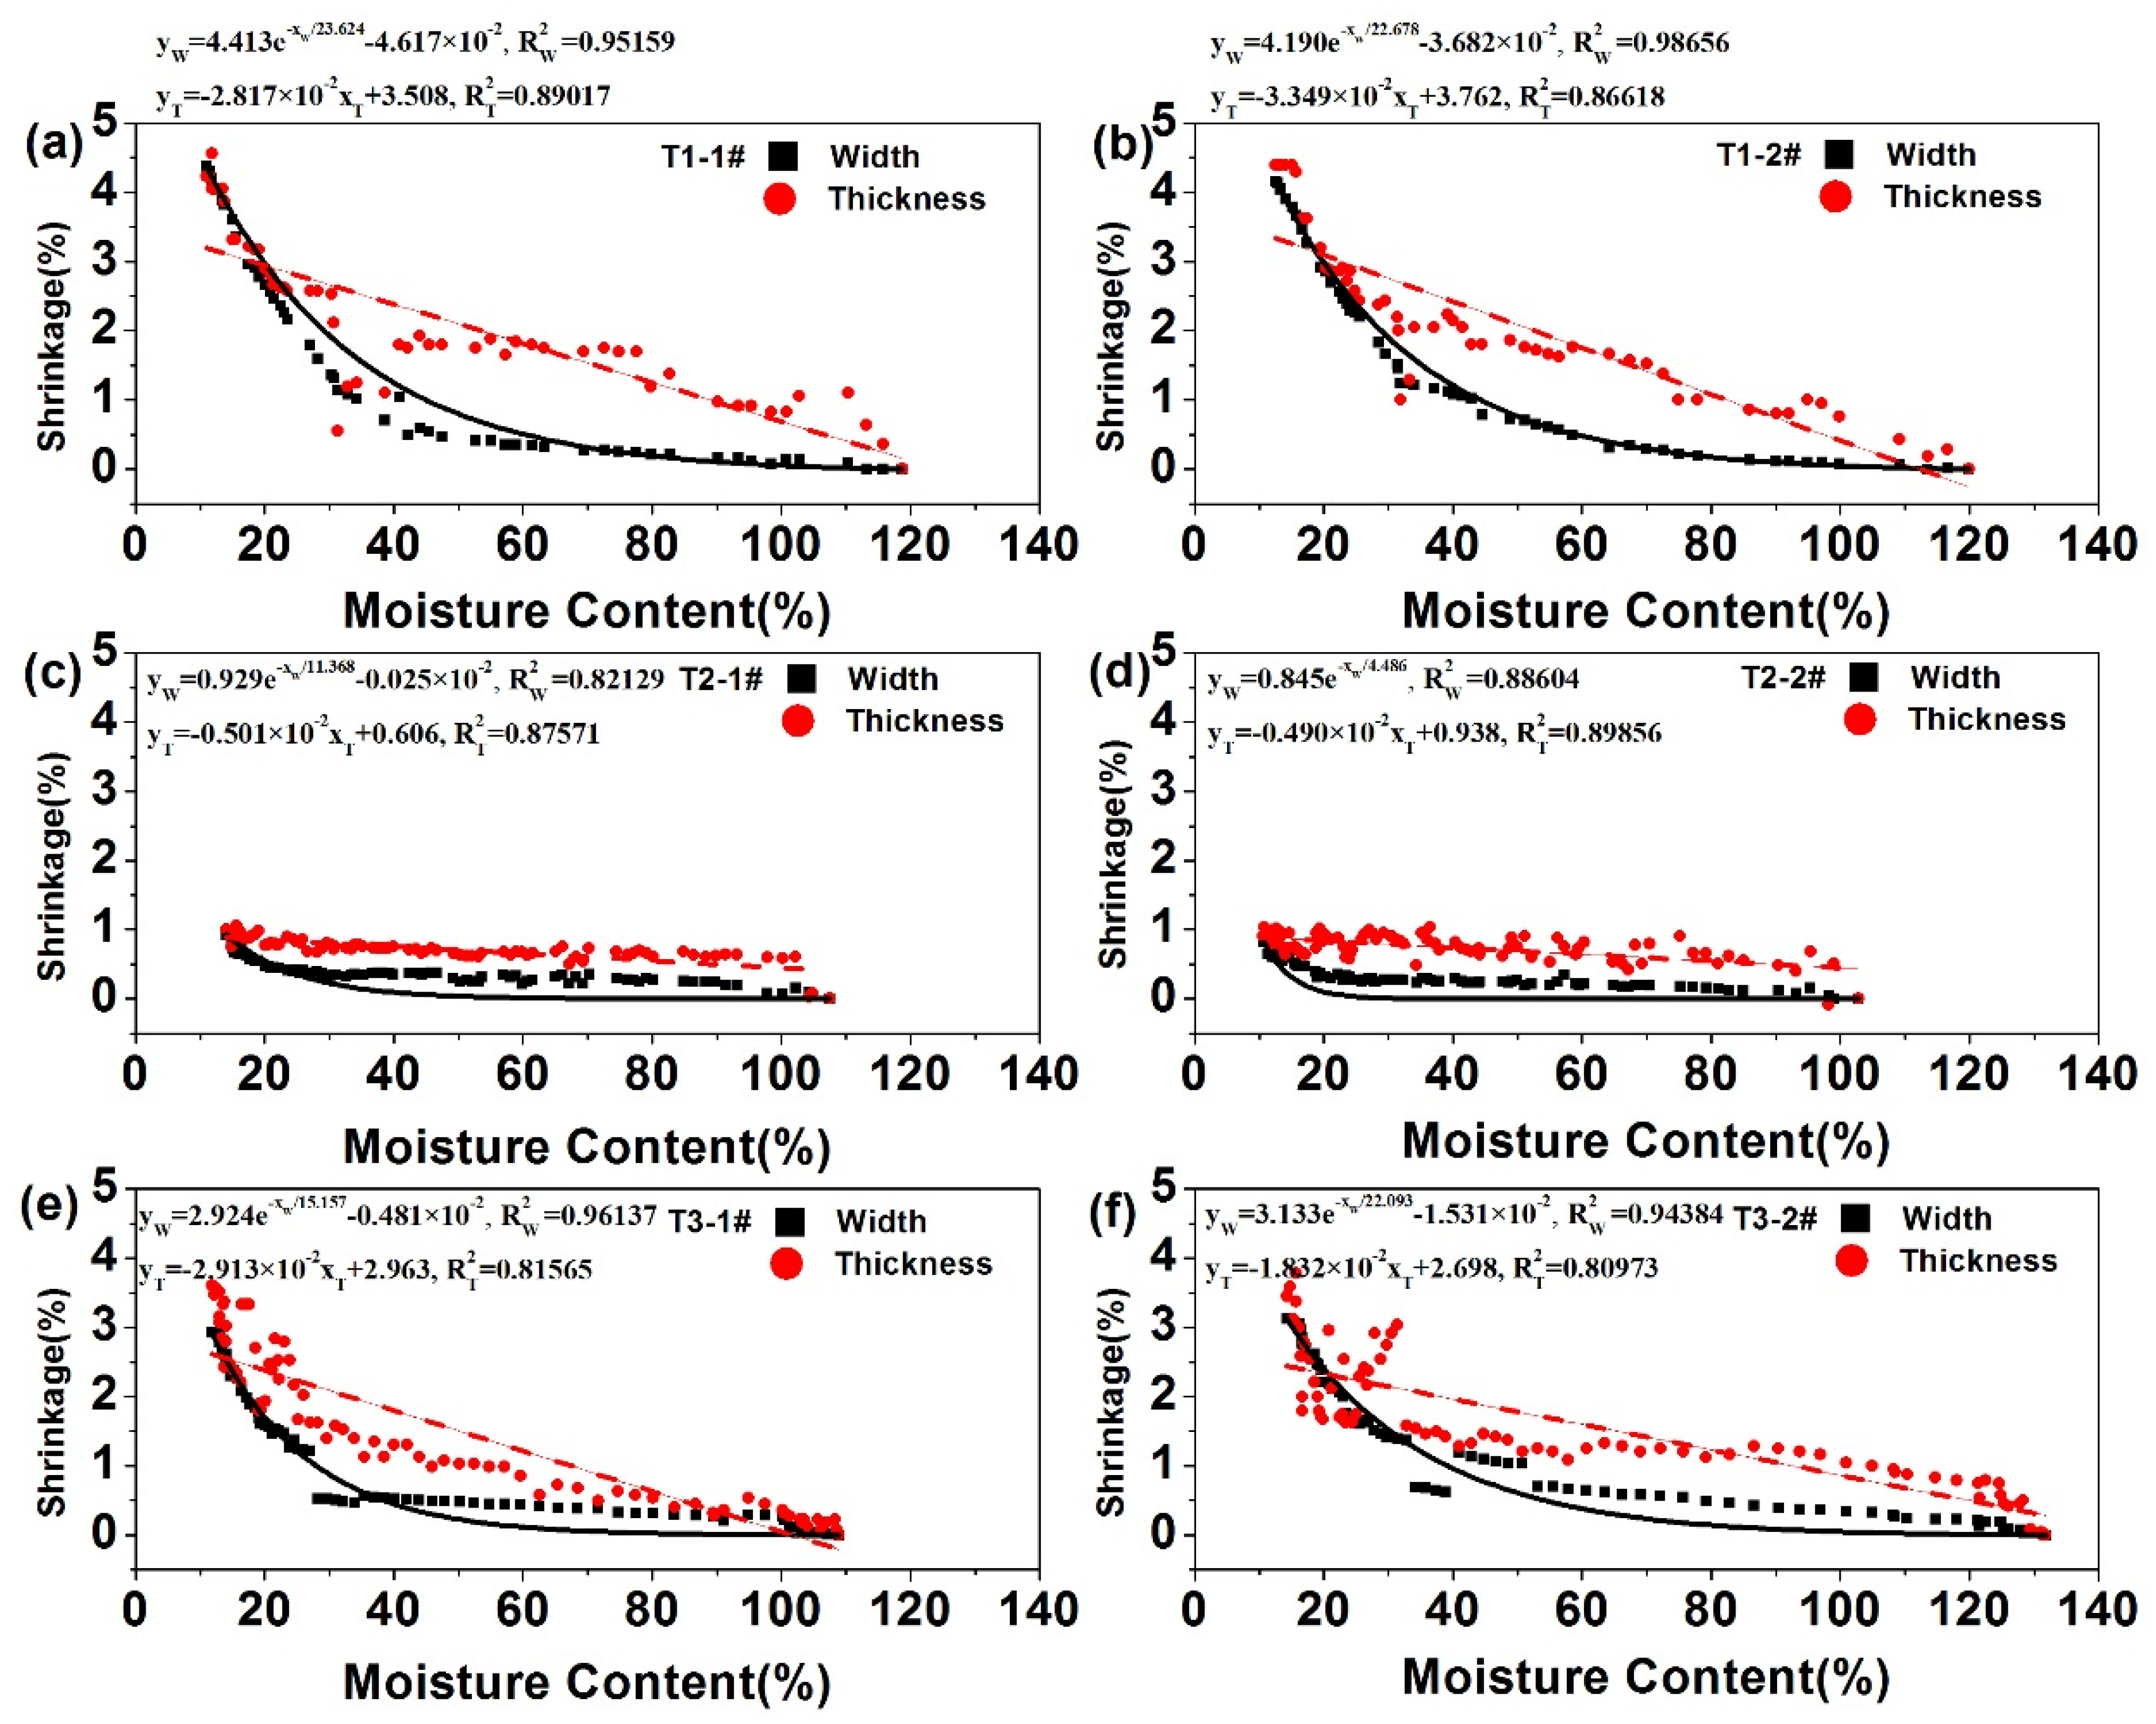
The curve depicting the shrinkage rate of the wood sample boards during drying is presented in
Figure 5. The regression equations and
R2 are also presented. An extremely high nonlinear or linear relationship is exhibited between shrinkage and MC in the width and thickness directions (
R2 > 0.8). The shrinkage rate of the three sets of experiments decreased with an increase in MC. When MC decreased to about 30%, the shrinkage of wood in both the width and thickness directions markedly increased. The reason might be that when MC was below the FSP, the gap between the microfibrils and micelles in the cell wall shrank after the absorbed water was discharged, causing a reduction in the thickness of the cell wall and abrupt shrinkage.
Figure 5 shows that during drying, the T1 group exhibited the largest amount of dry shrinkage, followed by T3 and then T2.
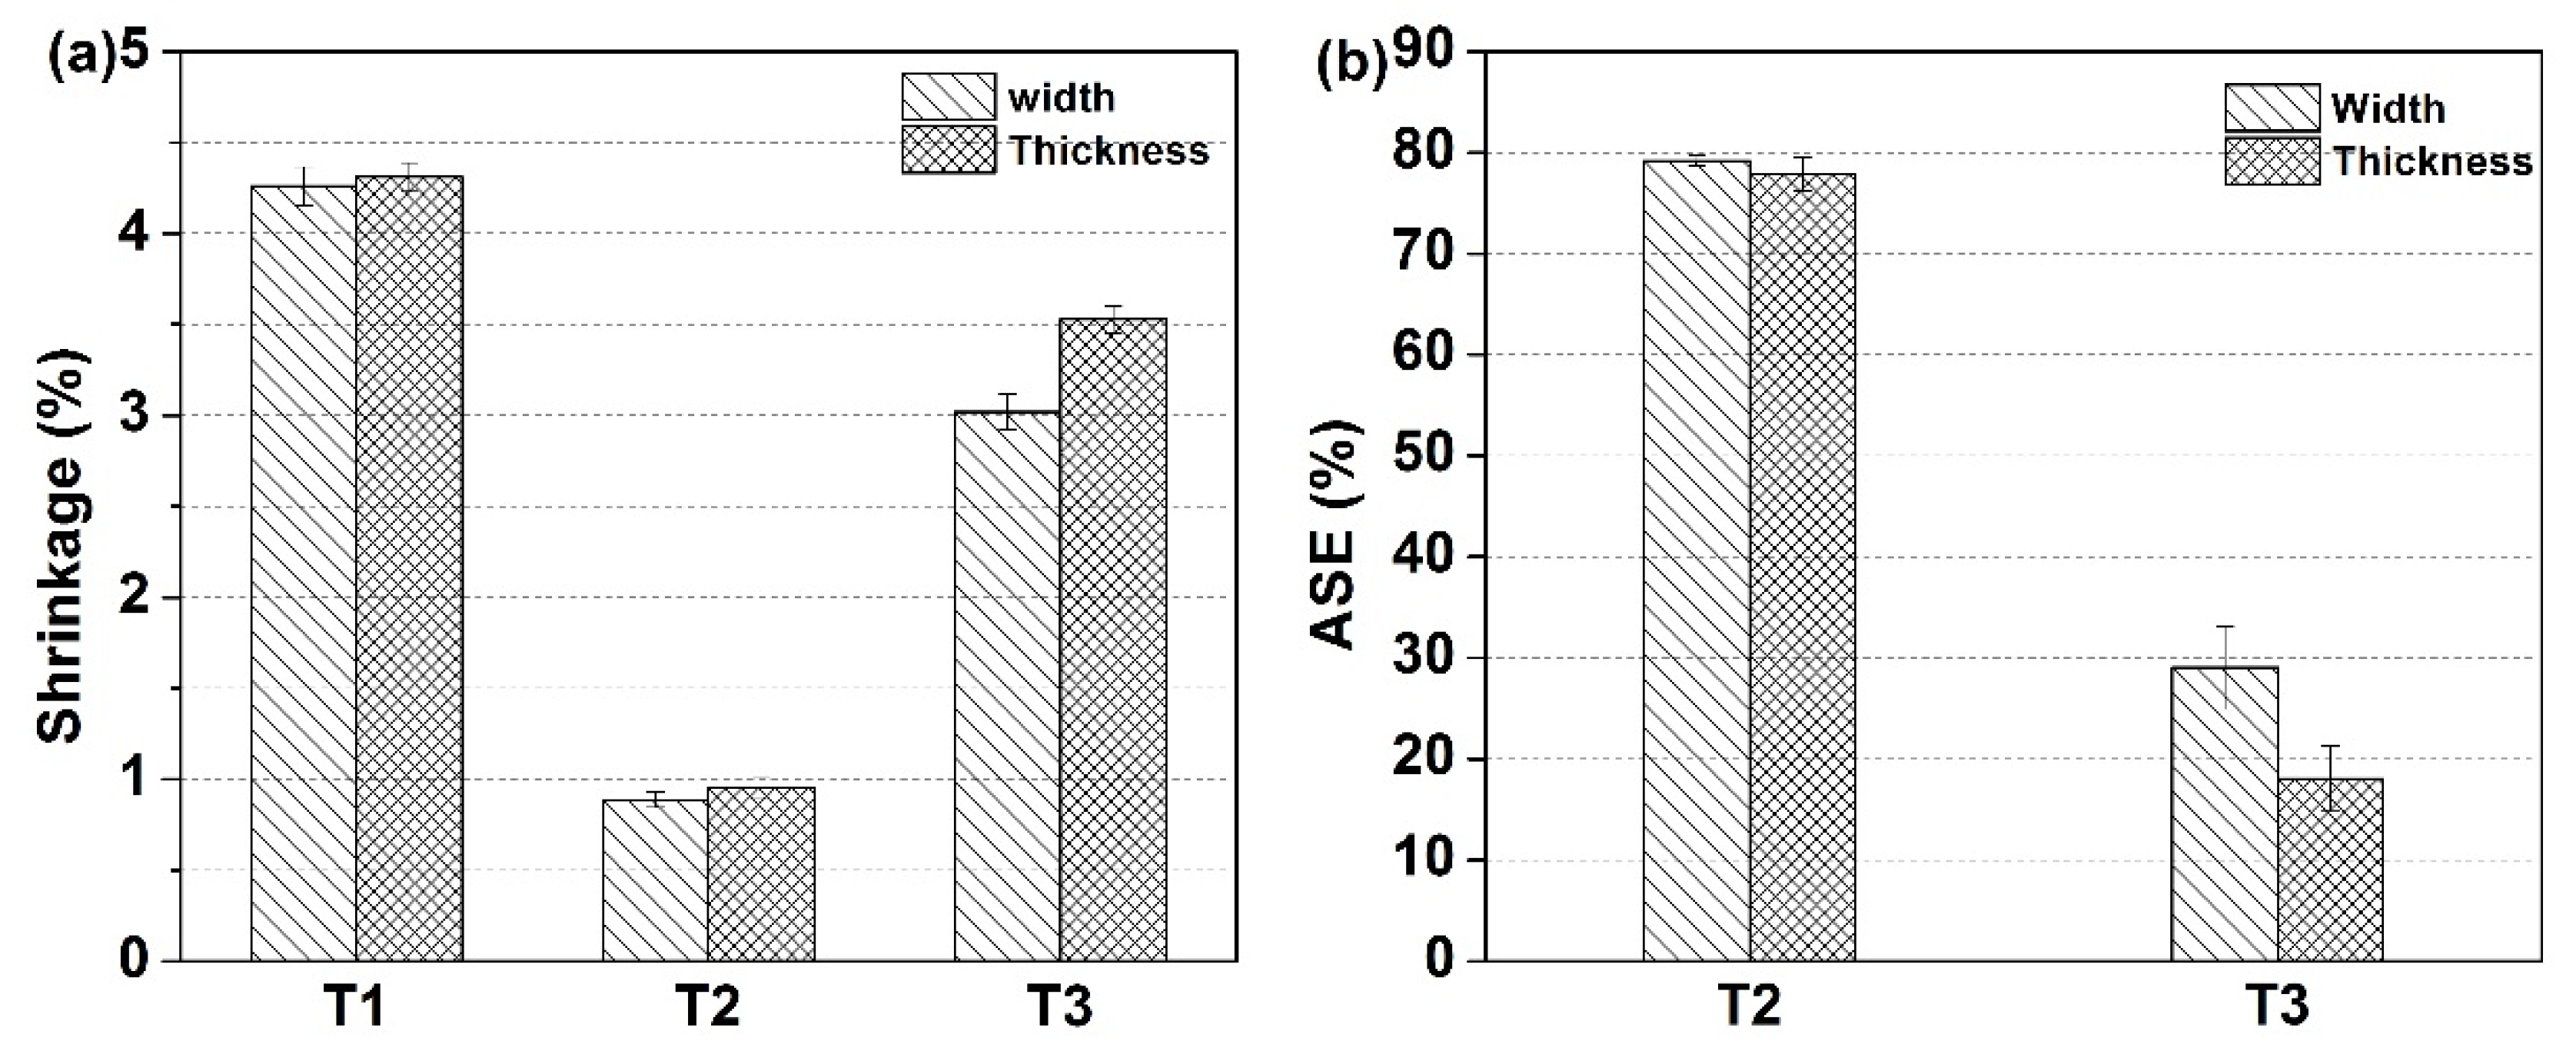
The final shrinkage rate of the three groups is shown in
Figure 6. The shrinkage rates of T1 in the width and thickness directions reached 4.26% and 4.31%, respectively, and STDEVA fluctuated between 0.08% and 0.11%, which proved the small variability of the two sample boards; the shrinkage rates of T2 in the width and thickness directions reached 0.89% and 0.95%, respectively (which were considerably lower than those of T1), and the STDEVA fluctuated between 0.04% and 0.05%. The shrinkage rates of T3 in the width and thickness directions were 3.02% and 3.53%, respectively, and the STDEVA fluctuated between 0.07% and 0.10%. Analysis of the STDEVA of T1, T2, and T3 indicate that the two sample boards in each group exhibited a small variability, and the results were in accordance with statistical standards. After immersion, wood shrinkage was significantly reduced. The ASEs of the T2 group in the width and thickness directions were 79% and 78%, respectively, and the STDEVA fluctuated between 0.47% and 1.61%. The reason is that wood mainly consists of cellulose, hemicellulose, and lignin; in addition, a large number of hydroxyl groups are found on the cellulose and hemicellulose molecules, and the hydroxyl groups are hydrophilic. Owing to the action of the hydroxyl groups, wood absorbs and evaporates moisture as a function of external temperature and humidity, resulting in shrinkage or swelling, hence the unstable wood size, internal stress, warpage, deformation, and cracking. However, DM could react with a large number of hydroxyl groups; thus, the reduction in hydroxyl content could alleviate the shrinkage of wood to a certain extent. Simultaneously, as the drying process progressed, the modifiers gradually solidified in the cell cavity, increasing the stability of the cell-wall structure and improving the dimensional stability of the wood. Compared with T1, T3 increased in dimensional stability in the width and thickness directions, but only by 29% and 18%, respectively. The standard deviation ranged from 3.21% to 4.10%. A deviation of nearly 11% was observed, which further indicates that a higher initial MC led to uneven curing of modifiers during immersion.
3.3. Distribution of MC in the Thickness Direction
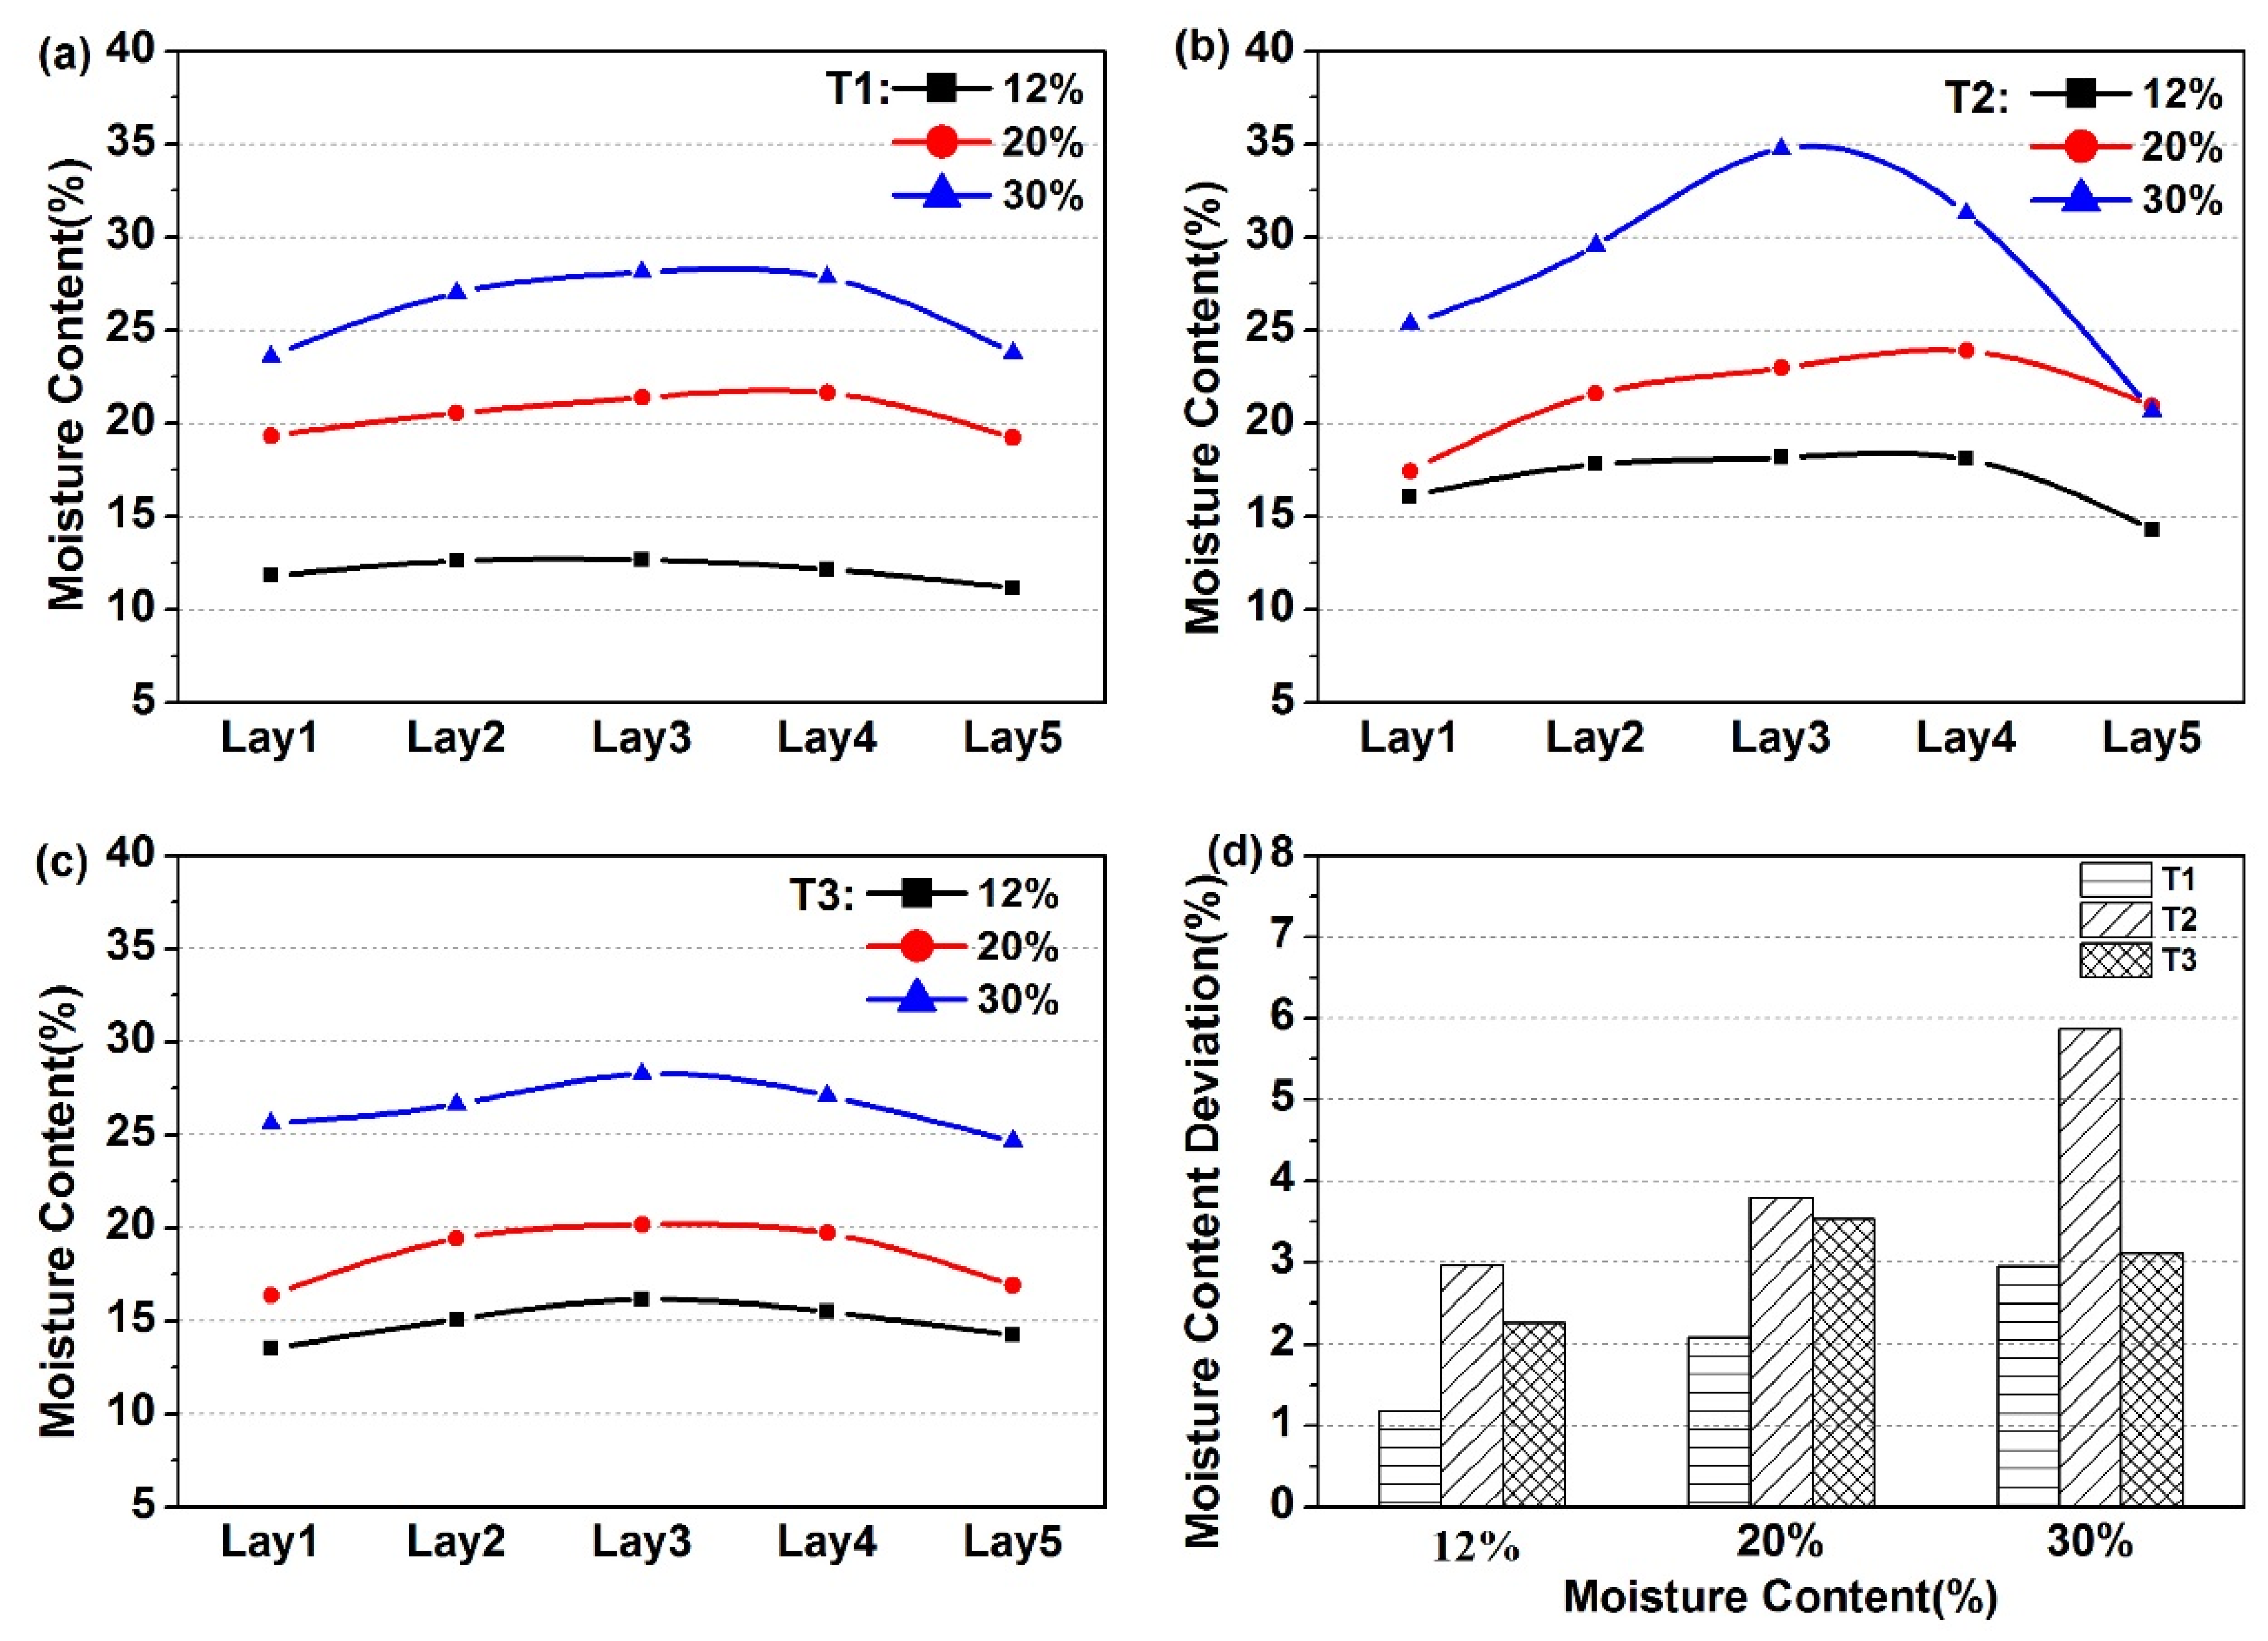
Figure 7 presents the MCs of T1, T2, and T3 in different thickness layers at 30%, 20%, and 12%. The figure shows that in the three experimental groups, a deviation in MC was observed between the core layer and the surface layer during the drying process. The curves of T1 and T3 fluctuated gradually, and with a decrease in moisture, the deviation gradually decreased from 4.43% and 3.12% at 30% to 1.18% and 2.27% at 10%, respectively (
Figure 7d). The reason could be that during drying, the broken-down invaders and the volatiles in the conduit were gradually pushed from the surface layer to the core layer, increasing the permeability of the wood samples and promoting the outward movement of moisture in the core layer, thus reducing the deviation in MC between the core layer and the surface layer.
The curve of T2 fluctuated sharply; however, as the MC decreased, the curve fluctuated moderately, from 11.75% at 30% to 2.97% at 10% (
Figure 7d). When the MC reached 30%, the MC deviated between 7.32% and 8.63% (deviation larger than those of T1 and T3). In regards to drying quality, the larger the deviation in the MC, the higher the probability of stress, which led to the generation of drying defects. The large MC deviation was caused by the modifier filling in the wood cell cavity, which was not conducive to the mass and heat transfer of the wood during the drying process. After the surface moisture evaporated, the moisture in the wood failed to spread to the surface of the wood samples, resulting in a large moisture gradient. In the T3 group, the result of impregnation was affected by the higher initial MC, and the modifier did not solidify inside the wood conduit, which did not affect the water discharge.
3.4. Determination of Residual Stress
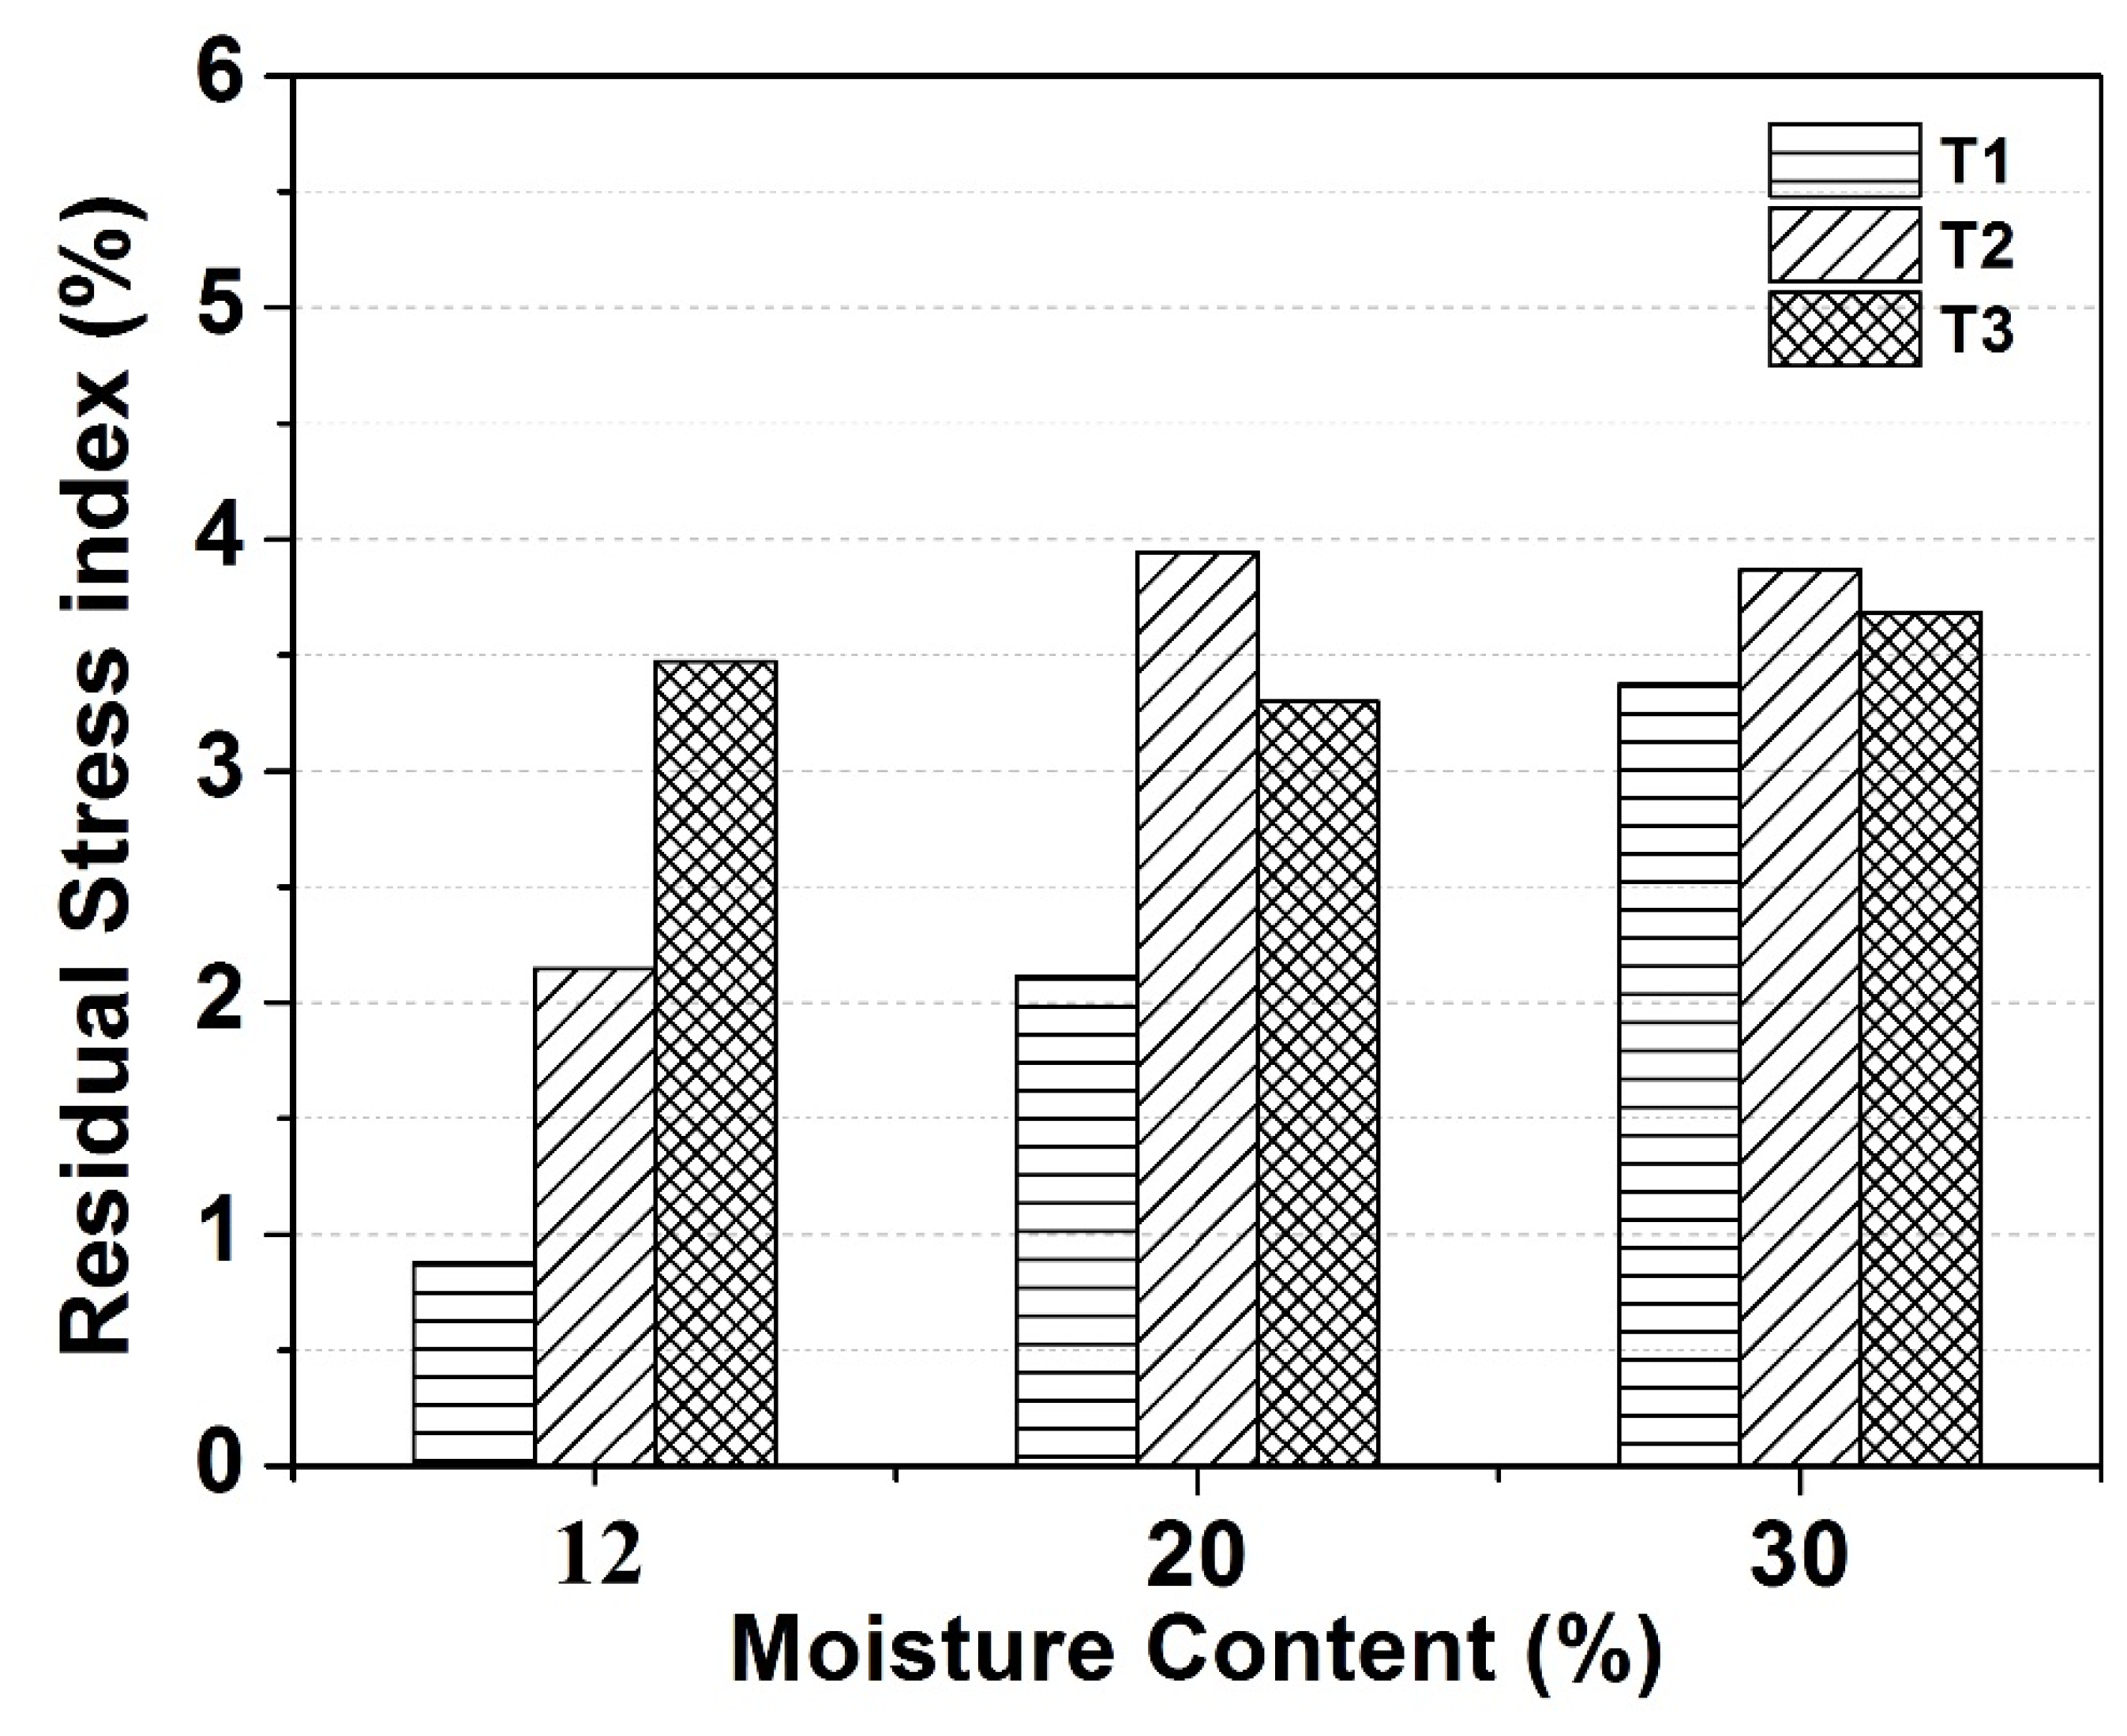
The variation in residual stress is shown in
Figure 8. The indices for the T1, T2, and T3 groups were reduced by 74.0%, 44.5%, and 5.7%, respectively, owing to the reduction in MC during drying. The MC distribution in the thickness direction exhibited uniformity (as shown in
Figure 7d), resulting in a decrease in the MC gradient and further reducing the residual stress.
At the stage with 30%–20% moisture, the residual stress index of T1 decreased from 3.38% to 2.11%; T3 decreased from 3.68% to 3.30%; T2 showed no significant change but considerably increased within the 3.87%–3.95% range, which might be attributed to the deposition of modifiers inside the conduit during drying that hindered the outward migration of moisture. In addition, the MC gradient still existed or even slightly increased; thus, the residual stress at this stage slightly increased. At the 20%–12% stage, T1 decreased from 2.11% to 0.88%, T2 decreased from 3.95% to 2.15%, and T3 increased from 3.30% to 3.47%. For T1, at the end of drying, no residual stress was observed. For T2, a decrease in residual stress was observed, which could be attributed to the increase in the filling amount of the modifier, which could absorb the stress released from the internal part of the wood. For T3, the decrease in MC caused no apparent change in residual stress, which could be explained by the following two points: 1) the modifier was solidified in the form of a film on the pit surface of the wood conduit that affected the migration of moisture inside the wood; 2) the quantities of the curing agent in T3 were not as high as that of T2; thus, the solidified part did not contribute to the absorption of residual stress. The residual stress index was not reduced and even exhibited an upward trend.
In summary, T1 maintained the minimum index at each MC stage. At the stage with 30% and 20% moisture, the MC of T2 was higher than those of the other two groups; T3 had the second highest MC. This results demonstrated that the modifier was impregnated in the wood; the greater the internal curing, the more uneven the MC distribution (
Figure 7d), resulting in a high stress index in the thickness direction of the wood. T3 exhibited an irregular change in residual stress because of poor impregnation.
3.5. Drying Defects
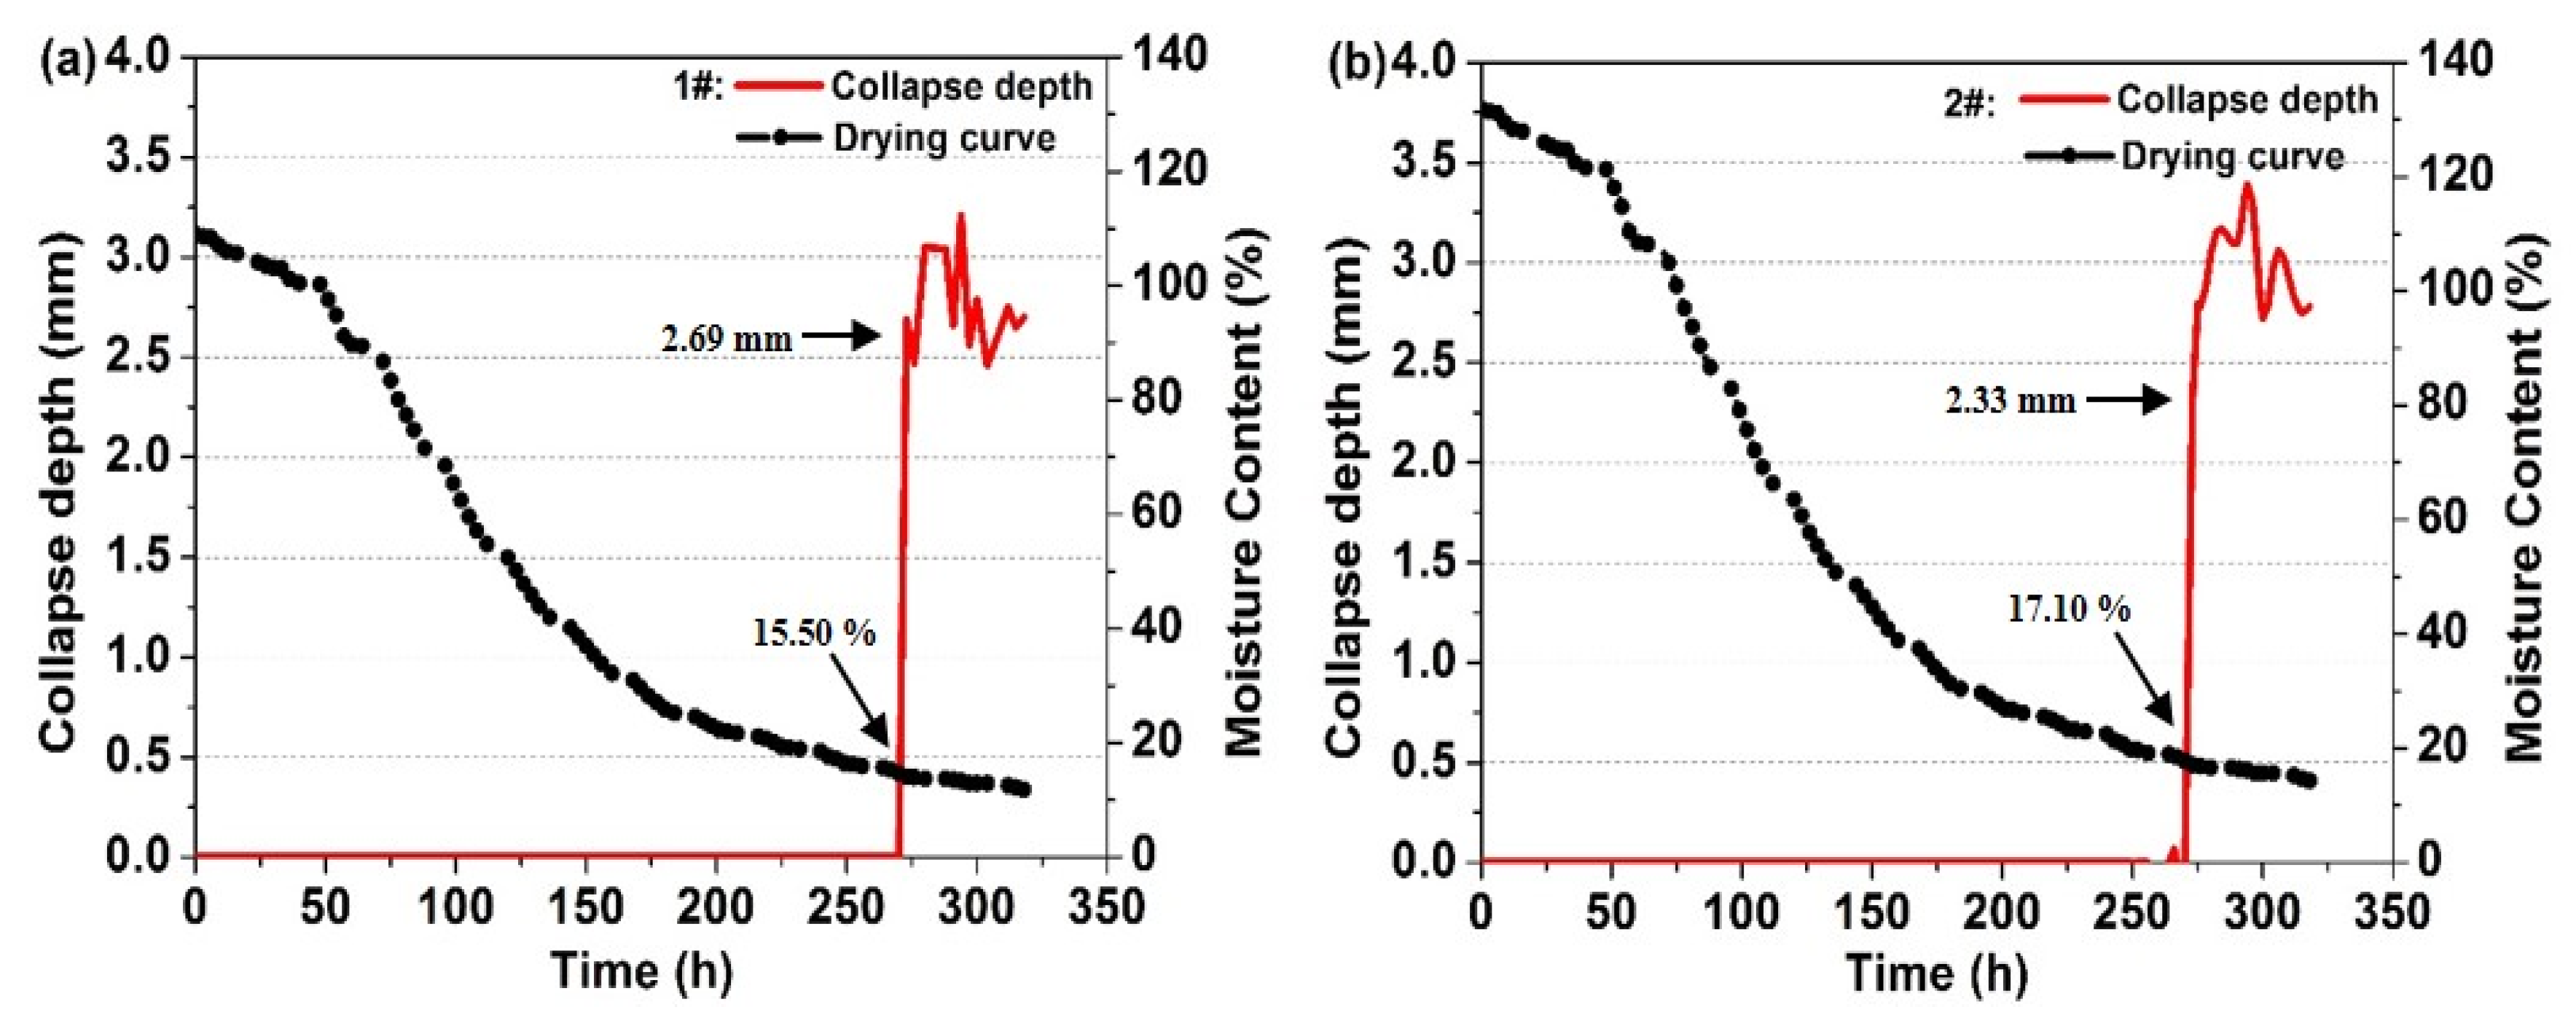
As shown in
Figure 9, only the T3 group exhibits a visible collapse defect. When dried to 273 h, the 1# and 2# MC sample boards first collapsed at MCs of 15.50% and 17.10%, reaching the collapse depth at 2.69 and 2.33 mm, respectively; as drying continued, the collapse depth also fluctuated, reaching its maximum at 3.21 and 3.39 mm, respectively. Previous research identified tree species, wood density, water content, drying temperature, drying speed, and so on as external factors for wood collapse [
27,
28,
29,
30].
In the current study, T1, T2, and T3 were heart-edged materials with basically similar initial MCs and drying schedules, which could be explained by internal causes, such as uneven water distribution between the tubes, ducts, and films of the wood fibers. In addition, the intrusion in the conduit not only partly or completely blocked the lumen of the catheter but blocked the pores on the side walls of the catheter as well. Therefore, the presence of the invader increased the resistance to moisture movement, rendering the pore size in the water-moving path smaller. This occurrence led to an increase in the tension generated when the moisture moved, enhancing the driving force causing the collapse. Simultaneously, the pressure gradient between capillary tension and drying stress was induced by the excessive movement of moisture during drying. This difference in pressure gradient forced the cell wall to collapse.
Owing to the uneven distribution of modifiers, the moisture distribution in the wood became more uneven (T3). The effect potentially increased the content of the intrusion, resulting in a larger difference in pressure gradient, hence the collapse. Although T2 also hindered moisture movement, modifiers were impregnated into the cell cavity and imparted a certain rigidity to the cell wall, such that the difference in pressure gradient failed to sufficiently cause the cell wall to collapse. In addition, wood collapse largely depends on shrinkage rate and wood penetration. The three sets of sample boards appeared to shrink at the beginning stage, but shrinkage values changed significantly when the MC reached around 30% (
Figure 5). The T1 group appeared no collapse, which attributed to the better penetration and water migration. In the T2 group, the chemicals were fully impregnated inside the tube and caused reduction of wood penetration, but the shrinkage rate was too small to cause collapse (
Figure 6a); For the T3 group, the collapse appeared mainly to be a result of uneven immersion, which not only reduced wood penetration but also increased the shrinkage rate (
Figure 6a).
At the end of the drying process, transverse bending defects appeared in the three experimental groups. The results are listed in
Table 3. The maximum WPs of T1, T2, and T3 were 3.76%, 2.59%, and 4.10%, respectively. Overall, T3 and T2 had the largest and smallest defects, respectively. The reason for stress deformation can be explained as follows: (1) The MC of any part of the wood fell below the FSP, causing shrinkage; (2) The normal shrinkage of the wood was inhibited, generating tensile stress in the wood; (3) When tensile stress was applied, compressive stress was generated in other parts, achieving balance in tensile stress. When the wood was subjected to stress, deformation occurred. The uneven impregnation of the modifiers led to the increase in bending defects (T3) because of the superposition of additional tensile stress outside the sheet and the surface tensile stress. However, as a result of the impregnation of DM and MA, the plasticizing property of wood increased. While drying reduced the stress in the wood, it was beneficial to the qualitative deformation of the wood after compression deformation and reduced the bending defects.
3.6. Morphological Analyses
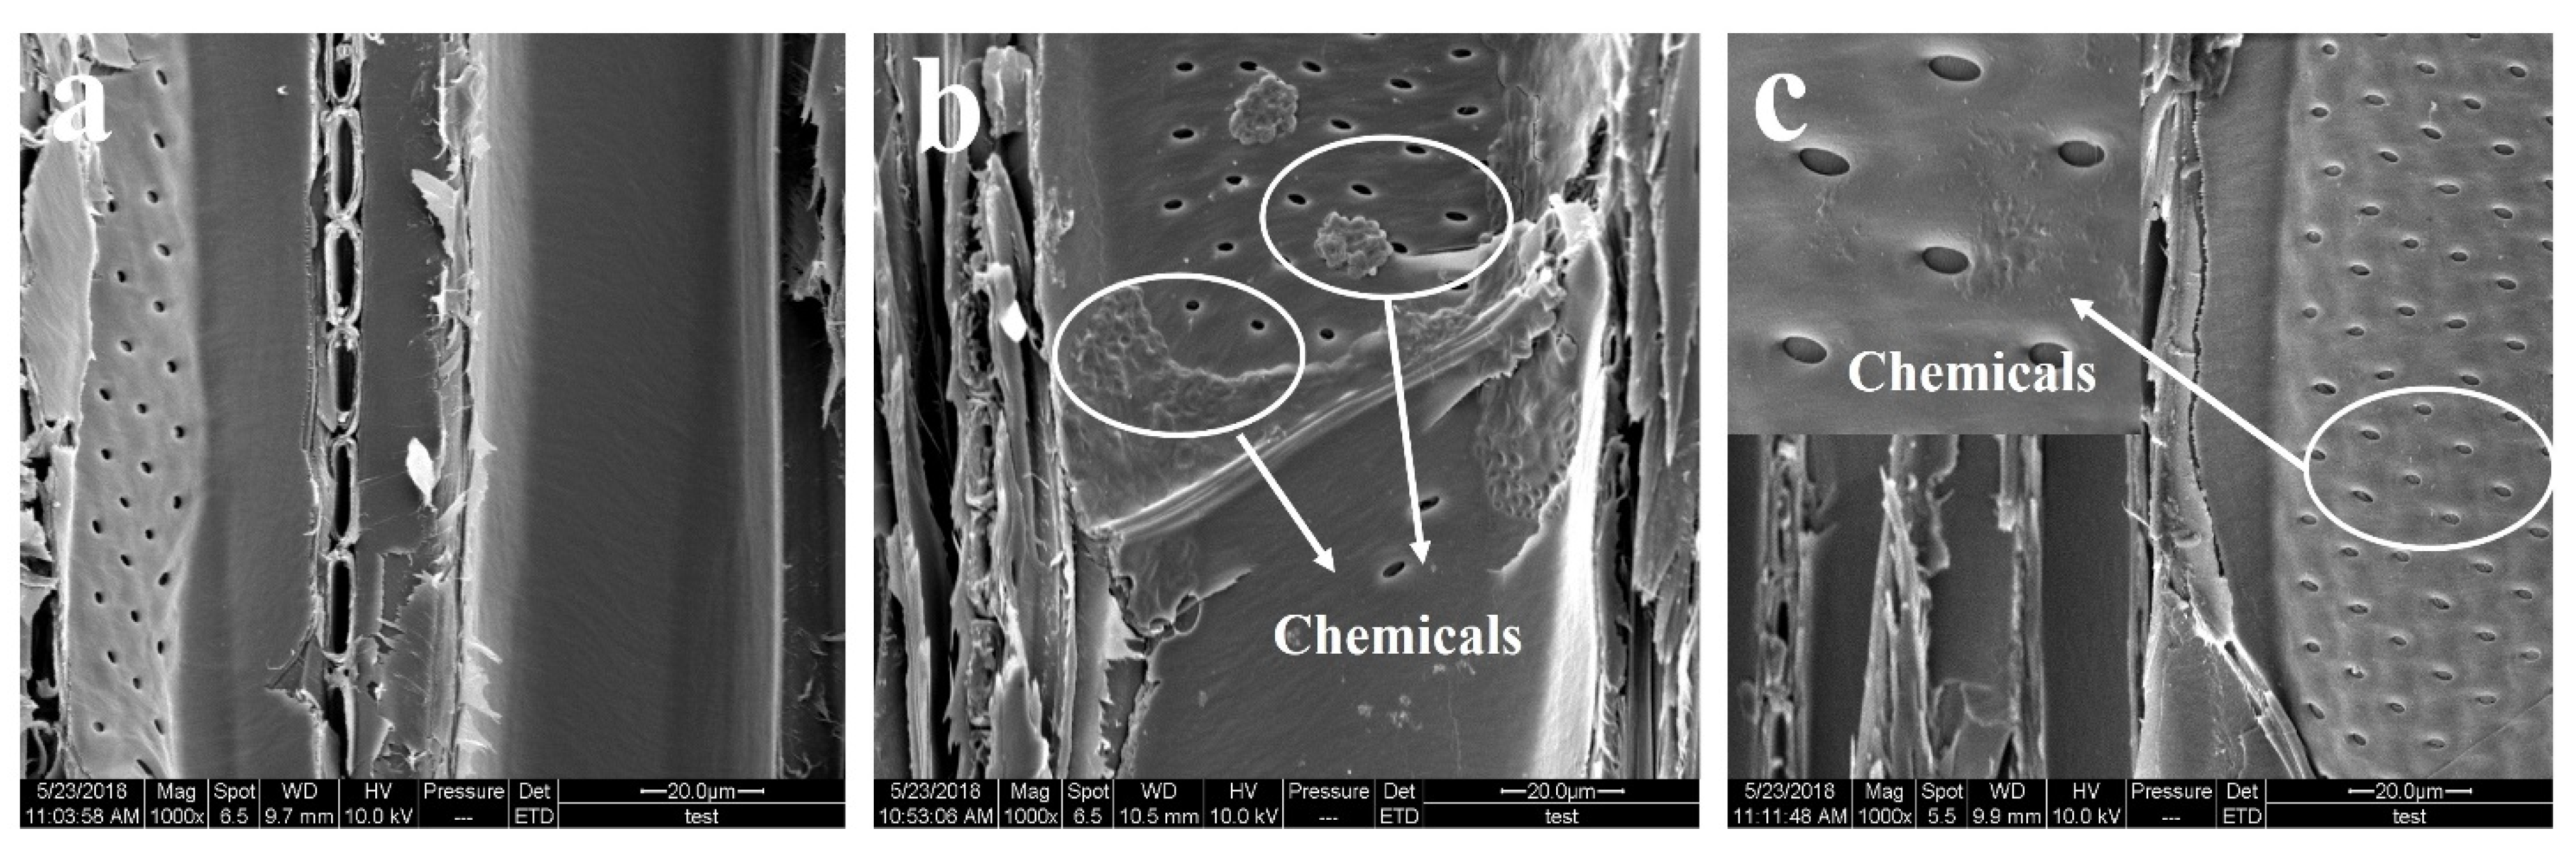
No modifiers were observed on the pits inside the wood conduit (
Figure 10a). Condensed chemicals were deposited on the inner conduit of the wood samples treated with 10%DM + 5%MA, markedly affecting the dimensional stability of the wood samples. By contrast, a very thin layer was coated on the inner cell walls, and wood pits were blocked by the resin film (
Figure 10c). It was proved that under the same proportion of modifiers and impregnation process conditions, a better impregnation effect can be obtained when the initial MC is lower. Owing to the high moisture level in the T3 group, a certain amount of water presented in the cell cavity and the catheter; thus, the modifiers immersed in the interior of the wood could not be uniformly retained within the wood or only stayed on the surface of the wood samples. During the drying process, the modifiers flowed out along the large capillary tubes, which could also be the reason the dimensional stability of the T2 group in the thickness and width directions was 50% higher than that of the T3 group.
During impregnation, the chemicals entered the interior of the wood primarily through the wood conduit and then circulated throughout the wood. By pressurization, the modifier molecules were freely diffused under the action of pressure in the intercellular spaces in the wood, cell wall, or cell cavity. During drying, the water evaporated, and the modifier was polymerized and deposited, filling the internal pores of the wood.
4. Conclusions
DM and MA were used as modified chemicals, with 10% and 20% initial MCs in poplar wood modified by vacuum pressure impregnation and cured by conventional drying. The drying characteristics were discussed as follows: the average drying rates of T2 and T3 decreased compared with T1; at the stages with 30%, 20%, and 12% MCs, the MC deviations and residual stress index of T2 and T3 were larger than T1; at the end of the drying process, T2 exhibited the lowest shrinkage in the width and thickness directions and revealed a high dimensional stability as well the highest drying quality. This work proved that poplar wood impregnated with a lower initial MC has better drying quality.
In future research, the effects of different initial MCs on the physical and mechanical properties of the impregnated materials can be studied, and a more suitable drying schedule for the impregnated wood can also be explored on the basis of this study.


