Article

Ultrasonic Parametrization of Arterial Wall Movements in Low- and High-Risk CVD Subjects

by
Monika Makūnaitė
1,*,
Rytis Jurkonis
1,
Alberto Rodríguez-Martínez
2,
Rūta Jurgaitienė
3,
Vytenis Semaška
3,
Karolina Mėlinytė
3 and
Raimondas Kubilius
3
1
Biomedical Engineering Institute, Kaunas University of Technology, 51423 Kaunas, Lithuania
2
Communications Engineering Department, Miguel Hernandez University, 03202 Elche, Spain
3
Department of Cardiology, Hospital of Lithuanian University of Health Sciences (LSMU) Kauno klinikos, 50161 Kaunas, Lithuania
*
Author to whom correspondence should be addressed.
Appl. Sci. 2019, 9(3), 465; https://doi.org/10.3390/app9030465
Submission received: 21 December 2018 / Revised: 23 January 2019 / Accepted: 26 January 2019 / Published: 30 January 2019
(This article belongs to the Special Issue Ultrasound B-mode Imaging: Beamforming and Image Formation Techniques)

Abstract

:
This paper shows the results of a preliminary study on the performance of new methods based on ultrasonic images parametrization, to estimate the arterial wall movements used for the evaluation of arterial stiffness, considered to be a predictor of cardiovascular events. The well-known technique of motion tracking in ultrasound image sequences was applied on cine loops scanned from subjects with different risks of suffering from cardiovascular disease (CVD). The motion of arterial walls was traced using displacement signals: Diameter, intima-media thickness (IMT) and longitudinal intima-media (IM) complex movement. The new methods used for the parametrization of the displacement signals were the average value (AV), effective or root mean square (RMS) value, and peak-to-peak motion amplitude estimate. A total of 79 subjects were analyzed in the study with 30 considered at low risk and 49 included in a preventive program for monitoring high CVD risk subjects. The results show a statistically significant difference between healthy volunteers and at-risk patients according to the AV of IMT, RMS values of longitudinal and radial motions and peak-to-peak amplitude of radial motion.

Graphical Abstract

1. Introduction

Cardiovascular diseases (CVDs) are the number one cause of human mortality and morbidity worldwide (WHO, 2017) [1]. Every year, more and more people die from these diseases than from any other illnesses. In 2016, 17.9 million people died from CVDs, constituting 31% of all global deaths. Heart attack and stroke make up 85% of these deaths [1] and the number of deaths from CVDs in the world is predicted to reach 23.6 million by 2030 [2].
CVDs are a group of disorders affecting the heart and blood vessels, which can cause myocardial infarction and stroke. They are usually acute events, mainly caused by a blood flow cut-off to the heart or brain, and described as the final stage of atherosclerosis [1,3], which is a systemic and chronic inflammatory disease of the medium and large arteries. Atherosclerosis is a degenerative progress that refers to the buildup over many years of lipids and other blood-borne materials in the arterial walls. Finally, atherosclerotic plaque forms, which can restrict blood flow in an artery. Overall, atherosclerotic arterial affection is not noticeable in the long term, but general signs of this disease develop only after complications start: Thickening of the intima-media complex, narrowing of the arterial lumen or its thrombosis, and/or loss of elasticity [4].
There are many risk factors that assist in the development of CVDs, which can be classified into two groups: Non-modifiable risk factors and modifiable risk factors. The first group’s factors cannot be changed, and they are age, gender, family history, and race. The second group of factors can be changed or treated, and they include smoking, high blood pressure, diabetes, physical inactivity, overweight, high blood cholesterol, etc. [5]
An independent predictor of cardiovascular events is arterial stiffness. This parameter is generally analyzed to assess cardiovascular risk [5,6,7]. In clinical practice, the most commonly used risk markers for arterial stiffness evaluation are IMT, pulse wave velocity (PWV), and cross-sectional distensibility (CSD) [8,9,10,11]. Unfortunately, the clinical potential of these traditional risk markers as a screening test remains limited [12]. The risk of CVDs in patients under the age of 50 is difficult to evaluate, especially in the absence of specific individual CVDs risk factors or anamnesis. Therefore, it is difficult to assess the likelihood of developing a disease, and if so, to start drug treatment [5].
Nonetheless, it has been proven that significant anatomical changes (i.e., IMT) of the arterial wall appear much later than mechanical changes (i.e., longitudinal and radial motion of the arterial wall) [3]. Radial motion is a parameter describing the mechanical properties of the arterial walls, and it has been widely studied in recent years, becoming an informative non-invasive parameter that helps to investigate cardiovascular diseases and to determine the elasticity of arterial walls. Unlike the radial motion of the arterial wall, the longitudinal motion has not received such recognition. It was believed that the longitudinal motion during the heart cycle was negligible compared with the radial motion. However, using modern ultrasound scanners, it has been noticed that the innermost and middle layers of the large arteries (i.e., intima-media complex) during the heart cycle move not only in radial, but also in a longitudinal direction [13,14]. It has also been observed that the longitudinal motion of the arterial wall has the same amplitude as the radial motion and reaches about one millimeter [15]. In addition, clinical studies demonstrated the correlation of common carotid artery (CCA) longitudinal motion with risk factors and CVDs [16,17]. Previous studies have shown a relationship between the decrease in longitudinal motion of the CCA wall, arterial stiffness and CVDs [3]. While there is a link between longitudinal motion amplitude and CVDs, determinants of the phases of longitudinal motion remain unknown [9].
The aforementioned bidirectional longitudinal motion of the intima-media complex is observed during the heart cycle. Cinthio et al. [14] discuss the dependence of longitudinal motion peaks on heart cycle phases, i.e., systole and diastole. There are many speculations about what causes longitudinal motion in the arterial wall. Finally, determinants of the phases of longitudinal motion remains unknown [9]. At the beginning of systole, the first antegrade motion of the IM complex is observed, i.e., motion in the direction of blood flow. Later, still in systole, the first retrograde motion of this complex appears, i.e., motion in the opposite direction of blood flow. During diastole, the second antegrade motion of the IM complex follows and then it gradually returns to its original position [14]. Predominantly, only the longitudinal motion amplitude in different heart cycle phases is used. Most researchers measure the first antegrade, the first retrograde and the peak-to-peak amplitude of the longitudinal motion during the heart cycle [14,18,19]. Despite the fact that the longitudinal motion amplitude is used and is able to distinguish low risk (i.e., healthy controls) from high risk (i.e., at-risk patients), the entire longitudinal motion pattern (waveform) can be useful [19,20]. Moreover, the longitudinal motion pattern is different for different individuals [18,21]. To the best knowledge of the authors of this article, the RMS estimates for arterial wall movements were not tested in healthy controls and at-risk patients.
The aim of this paper is to evaluate both the motion average (AV) and RMS values for the parameterization of the arterial motion. Proposed parameters will be influenced by all amplitude values of the temporal variation of IMT, longitudinal and radial motion signals during the heart cycle.

2. Materials and Methods

2.1. Study Population

Thirty-three young healthy volunteers and sixty-nine older volunteers were involved in this study. Healthy subjects had no cardiovascular risk factors as assessed by a written questionnaire, while older subjects had high risk of cardiovascular diseases. The age of healthy volunteers was 22–23 years, while the at-risk patients’ mean age was 51 years (±7 years standard deviation). In the control group, 9 subjects (27%) were male and 24 subjects (73%) were female. In the patients’ group, 43 subjects (51%) were male and 26 subjects (49%) were female.
Clinical data were collected at the Lithuanian University of Health Sciences Hospital, Department of Cardiology, during May–October, 2018. The study was approved by the Kaunas Region Biomedical Research Ethics Committee (2018-08-02, No. BE-2-51, Kaunas, Lithuania). Every participant provided written consent to participate in the study and allowed the usage of the obtained B-mode images under the principle of confidentiality.

2.2. Collection of In Vivo Data

All analyses were performed using a clinical scanner Ultrasonix SonixTouch (Analogic Ultrasound, Canada), equipped with a 5–14 MHz linear array probe. During the CCA echoscopy, the frame rate, depth and focus were 52 fps, 2.5 cm and 2 cm, set in the ultrasound scanner accordingly. The data was stored in a cine-loop as consecutive frames for later offline analysis.
The acquisition of CCA B-mode sequences was performed by two cardiology physicians. Before the measurement, all subjects were asked to rest in supine position for at least 15 min. During the measurement, the subjects were lying in supine position, stretching their neck and turning it 45 degrees to the right or left, depending on the echoscopic neck side. Arterial longitudinal motion amplitude does not depend on the echoscopic neck side [8], so both right and left CCA were scanned. Measurements of the longitudinal movement and the diameter change of the CCA were performed 2–3 cm proximate to the bifurcation during at least two full heart cycles. In order to ensure that the CCA data was of acceptable quality, the longitudinal movement had to be clearly visible along the preselected segment of the arterial wall. All sequences were stored digitally and transferred to a computer for further analysis.

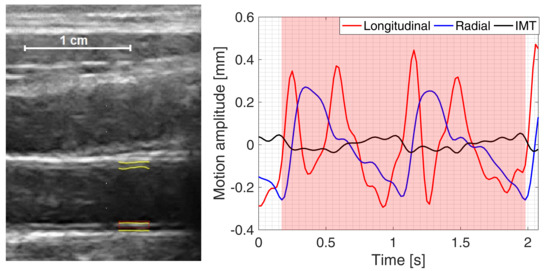
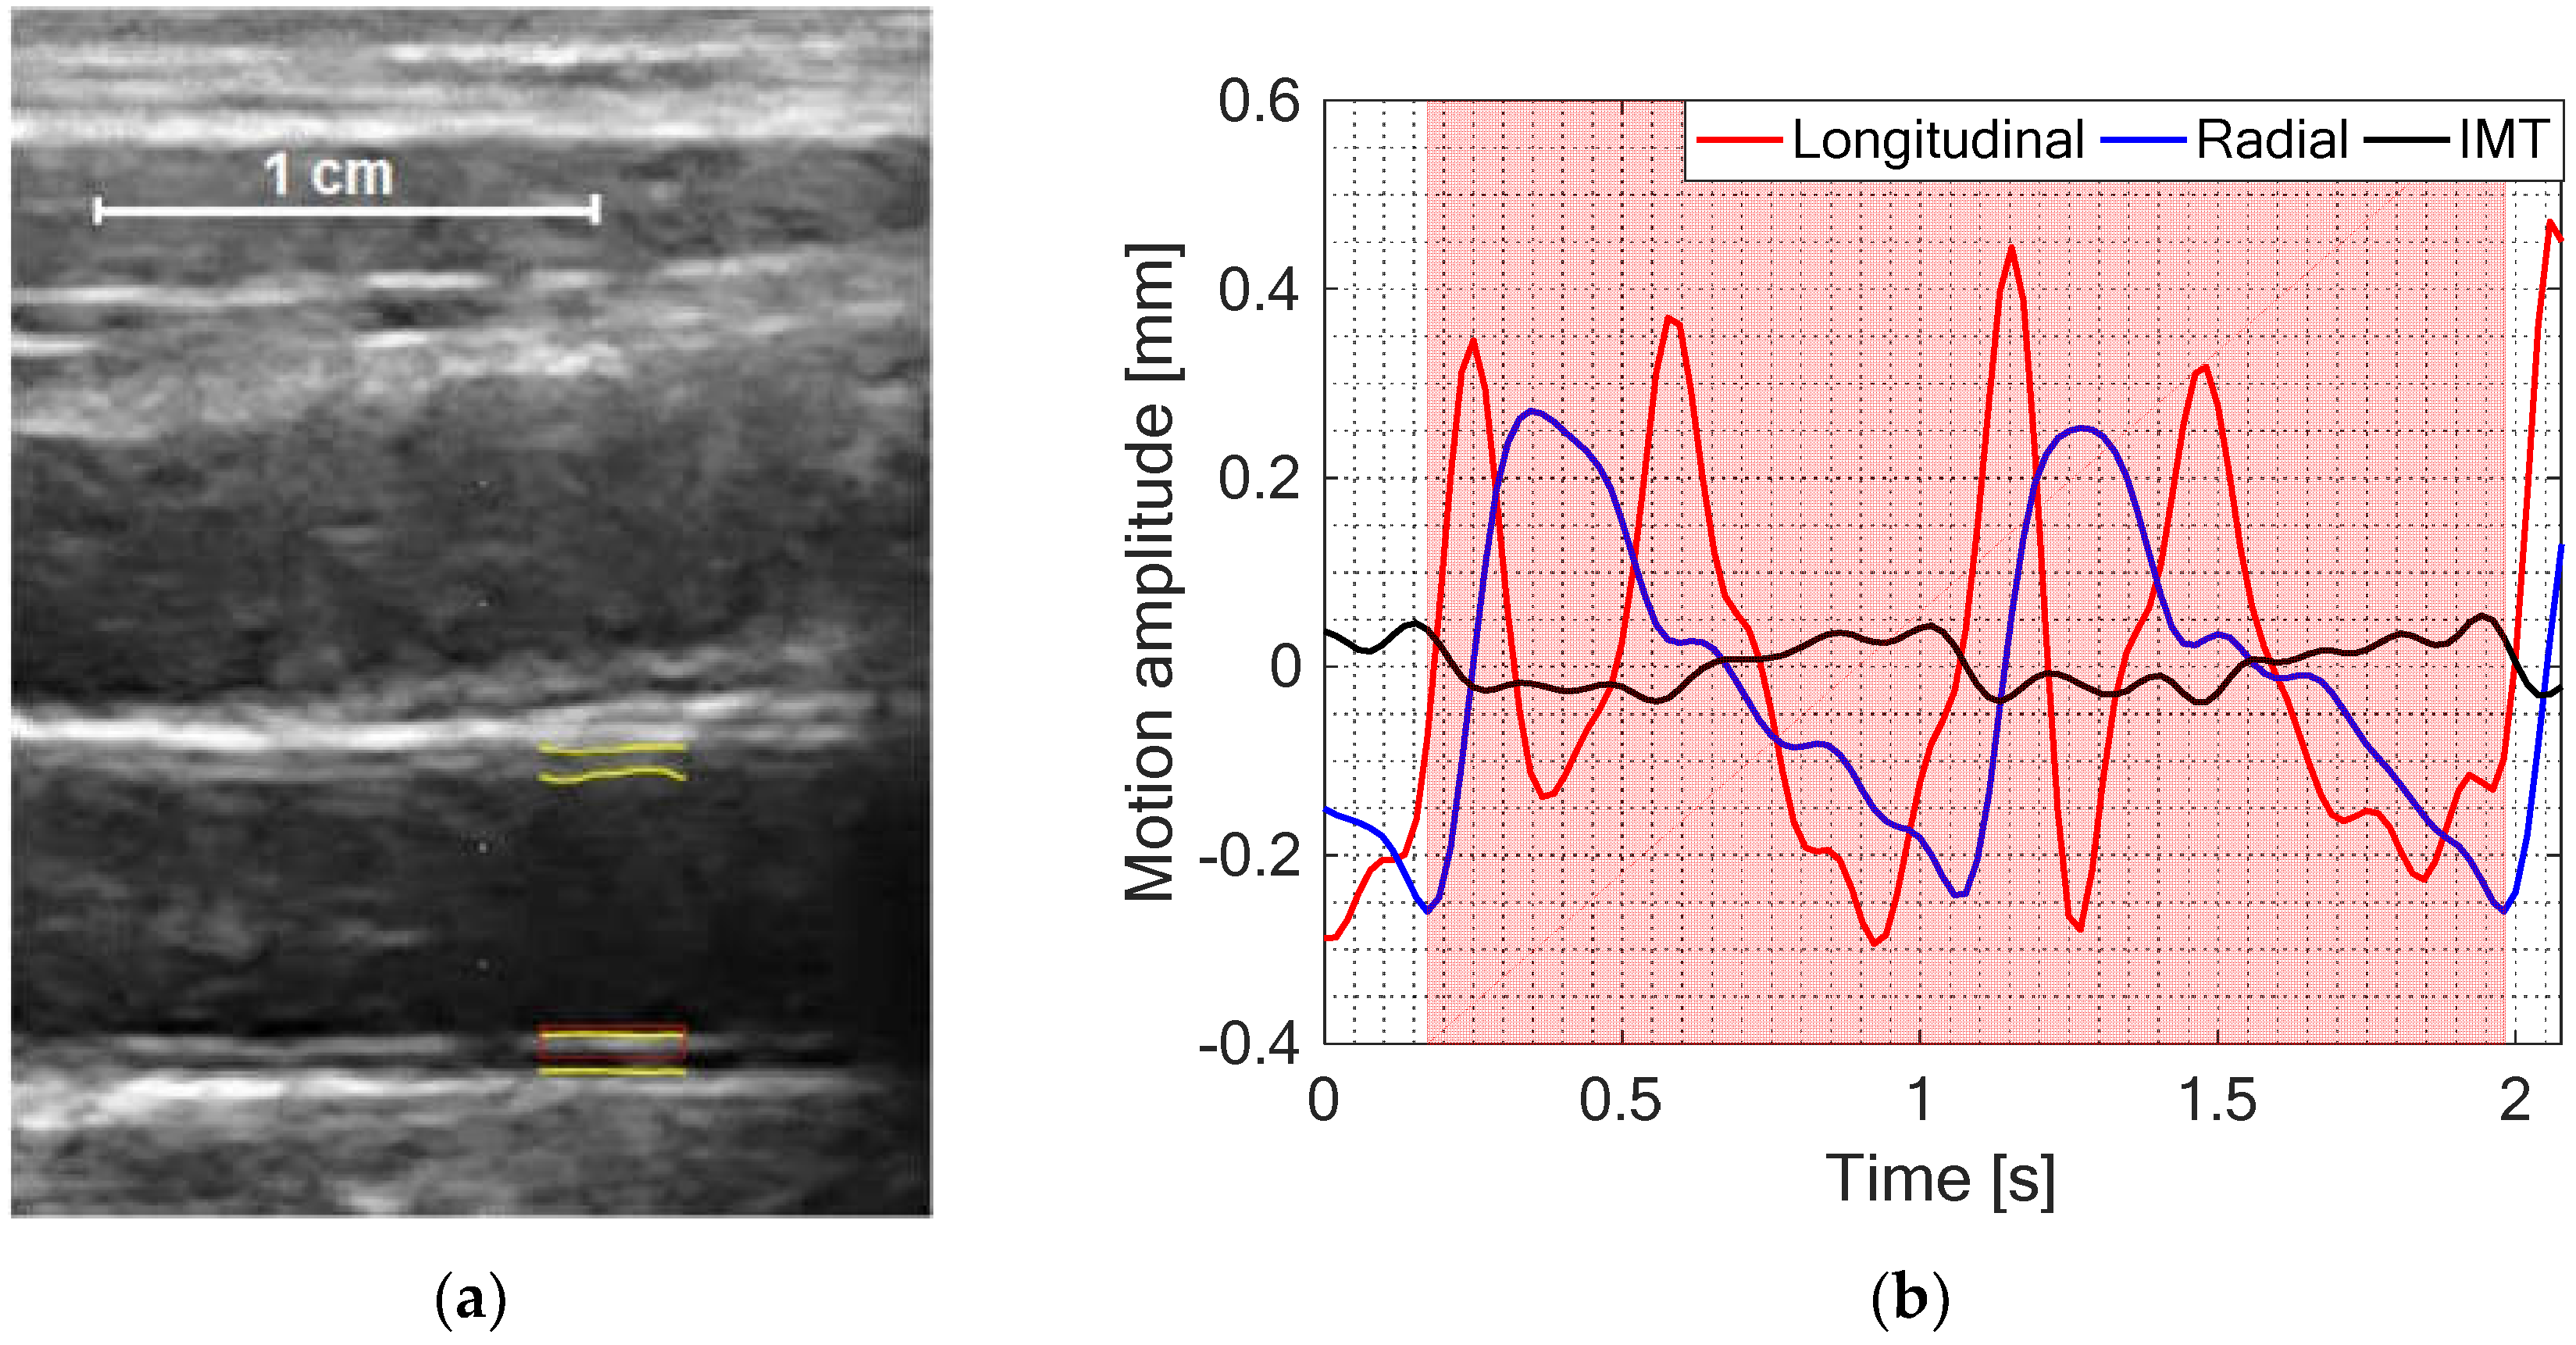
2.3. Estimation and Post-Processing of IMT, Longitudinal and Radial Motion Signals of CCA

For this study, CAROLAB software was used in order to estimate IMT, longitudinal and radial motions of CCA [10,22,23]. This software is used for the analysis of ultrasound B-mode image sequences and assesses the longitudinal motion with a speckle-tracking approach that is based on the block-matching (BM) method [10]. The main point of the BM framework is to detect the motion d(n) between two consequent frames by comparing pixel blocks of consecutive images I(n-1) and I(n). The motion corresponds to the displacement between the center point p(n-1) of the reference block and the center point p(n) of the best-matched block. This results in the shift of the center point p(n) between images I(n-1) and I(n). Pixel blocks alignment in images I(n-1) and I(n) takes place only within the search window, i.e., in the defined maximum margin around the center point of the reference and best-match blocks. After summing up all the displacements d(n) received, the p(n) point motion trajectory is estimated. In order to cope with the issue of speckle decorrelation, a pixel-wise Kalman filter is used to update the reference block [10]. Once the estimation is done, a fully-automatic technique based on front propagation is used [22] in order to segment the IM complex and track temporal variations in the IMT in CCA B-mode ultrasound images.
From right and left CCA image sequences, the higher-quality video sequence was chosen and finally one CCA image sequence was used for every subject. Subjects presenting low-quality video sequences or having less than two full heart cycles detected with CAROLAB were rejected from the study. Three subjects (9%) were rejected from the healthy volunteers’ group while twenty subjects (29%) were rejected from the at-risk patients’ group.
A region of interest (ROI) containing a well-contrasted speckle pattern of the distal vessel wall for longitudinal and radial motion, and clearly visible IM complex for IMT variation were chosen in the first frame of each B-mode sequence. A kernel of the ROI was selected manually, with size 3 × 0.5 mm as seen in Figure 1a. Estimated signals of longitudinal motion, radial motion and temporal variation in the IMT were saved for further post-processing in MATLAB.
Post-processing algorithm was developed in MATLAB. The CAROLAB output signals were loaded in original form as shown in Figure 2a.
Motion signals were then filtered with a band-pass IIR filter (fpass-lower = 0.9 Hz and fpass-higer = 8 Hz) and then detrended, subtracting the mean of the resulting signal. After this, two consequent heart cycles were selected manually in time. Only this time segment (see red shadowed area in Figure 1b for an example) was used in all signals for the evaluation of time domain parameters: Peak-to-peak amplitude change of the arterial diameter and IMT between systole and diastole, AV and RMS values of temporal variation of IMT (IMT0 and IMTRMS), and longitudinal and radial motions (X0, D0 XRMS, DRMS) of two consequent heart cycles.

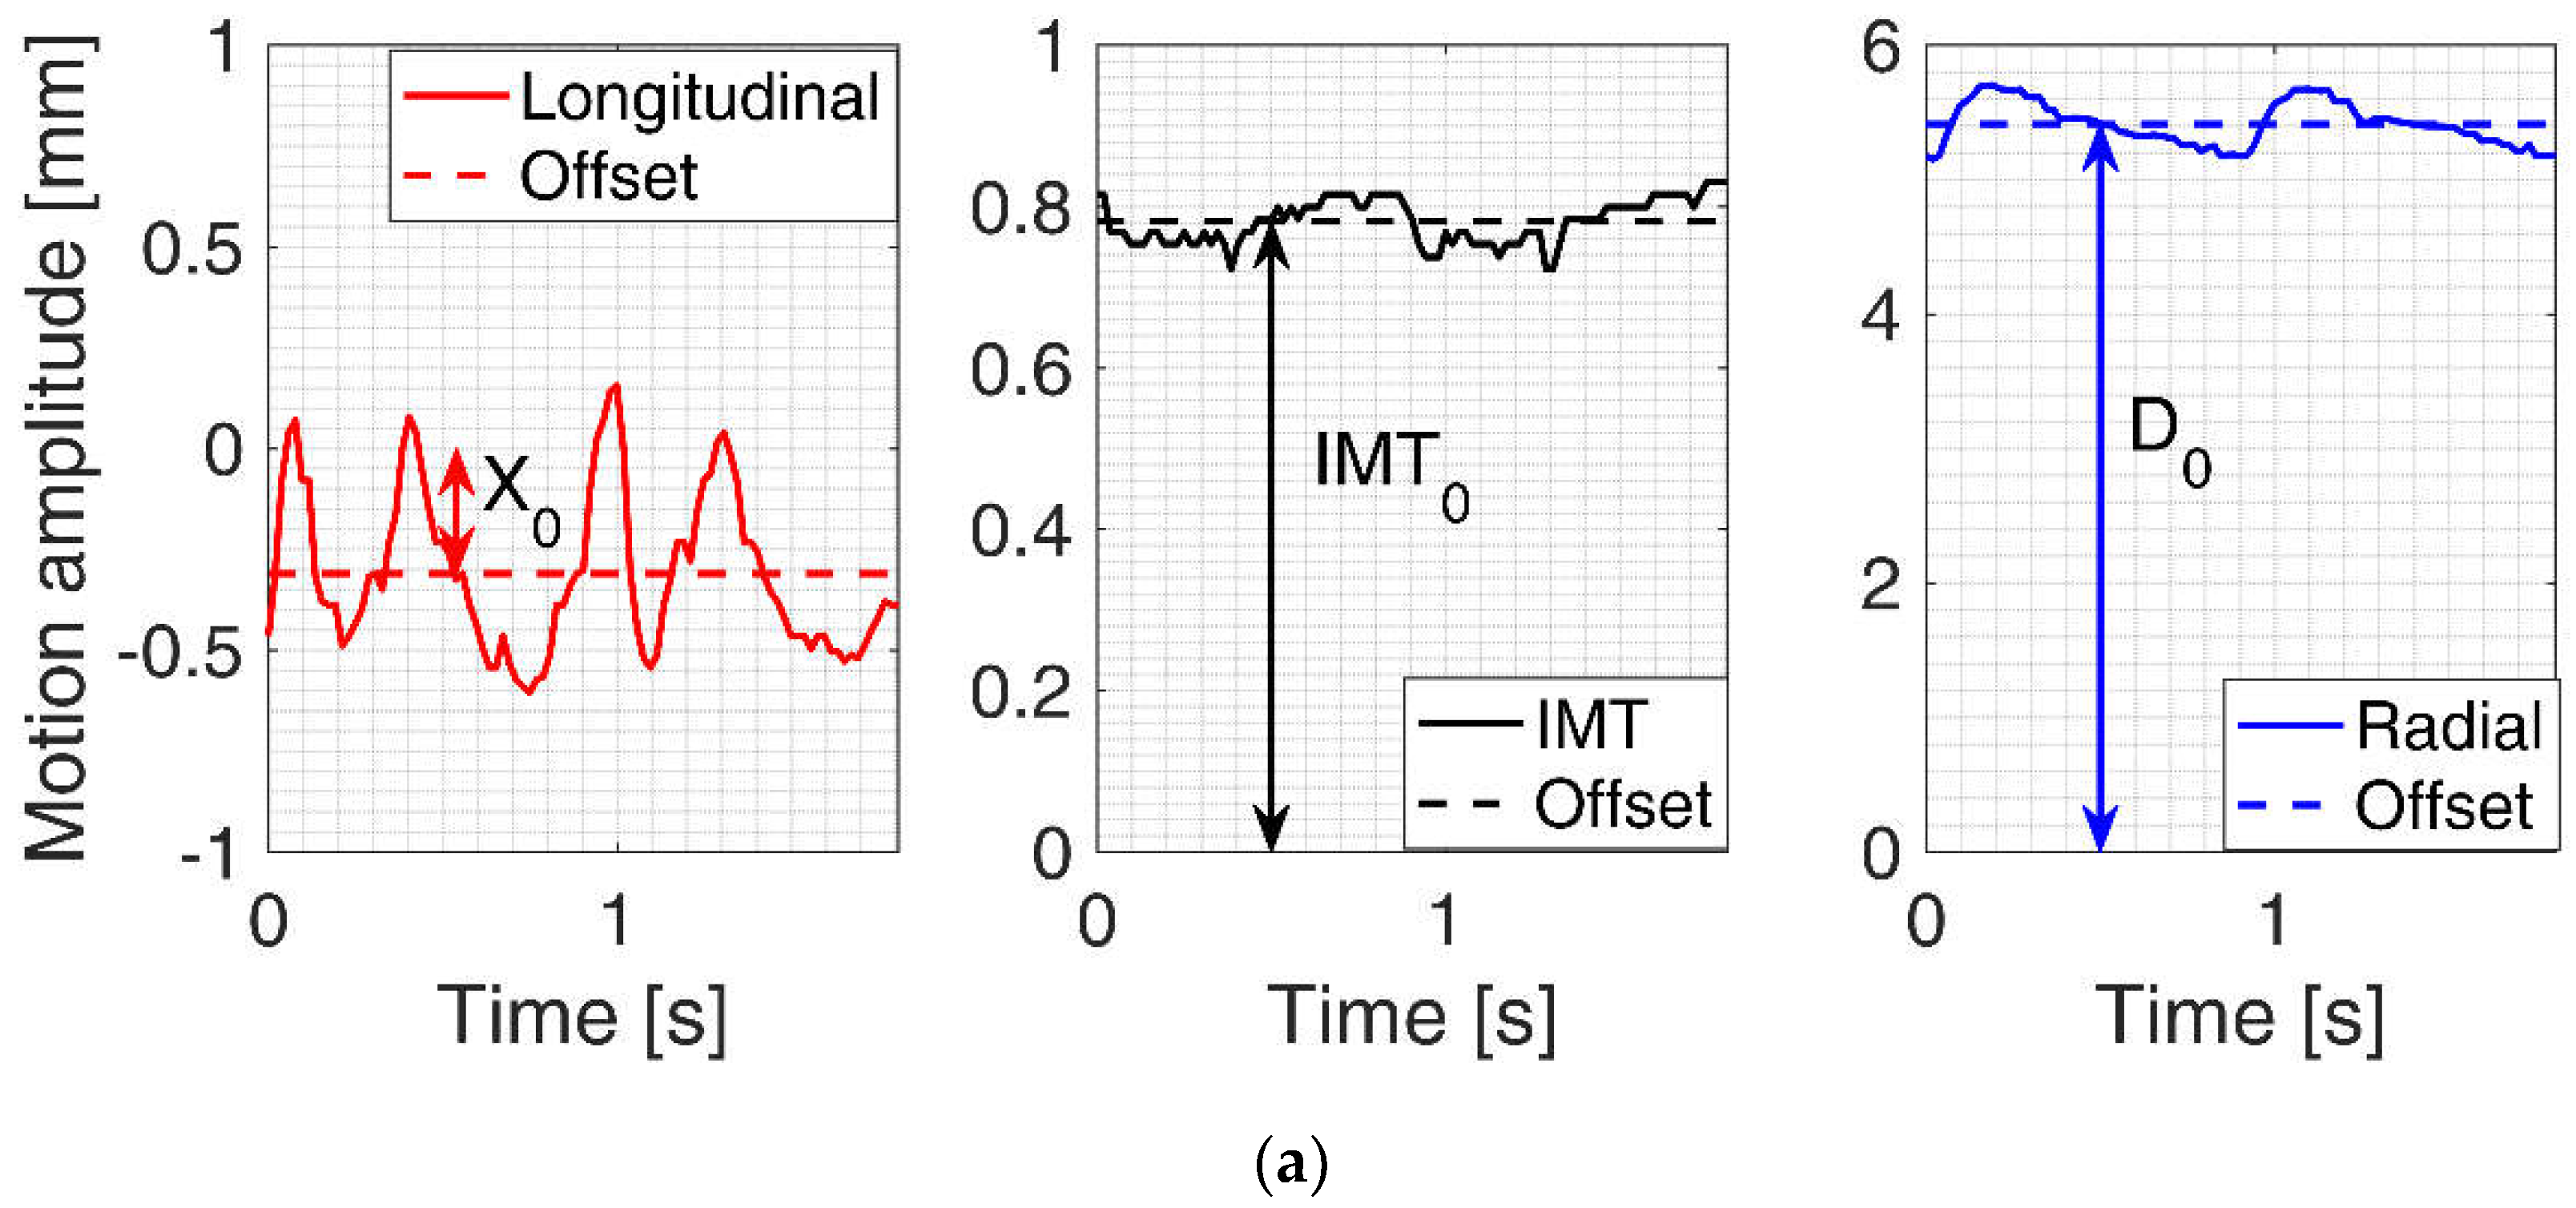
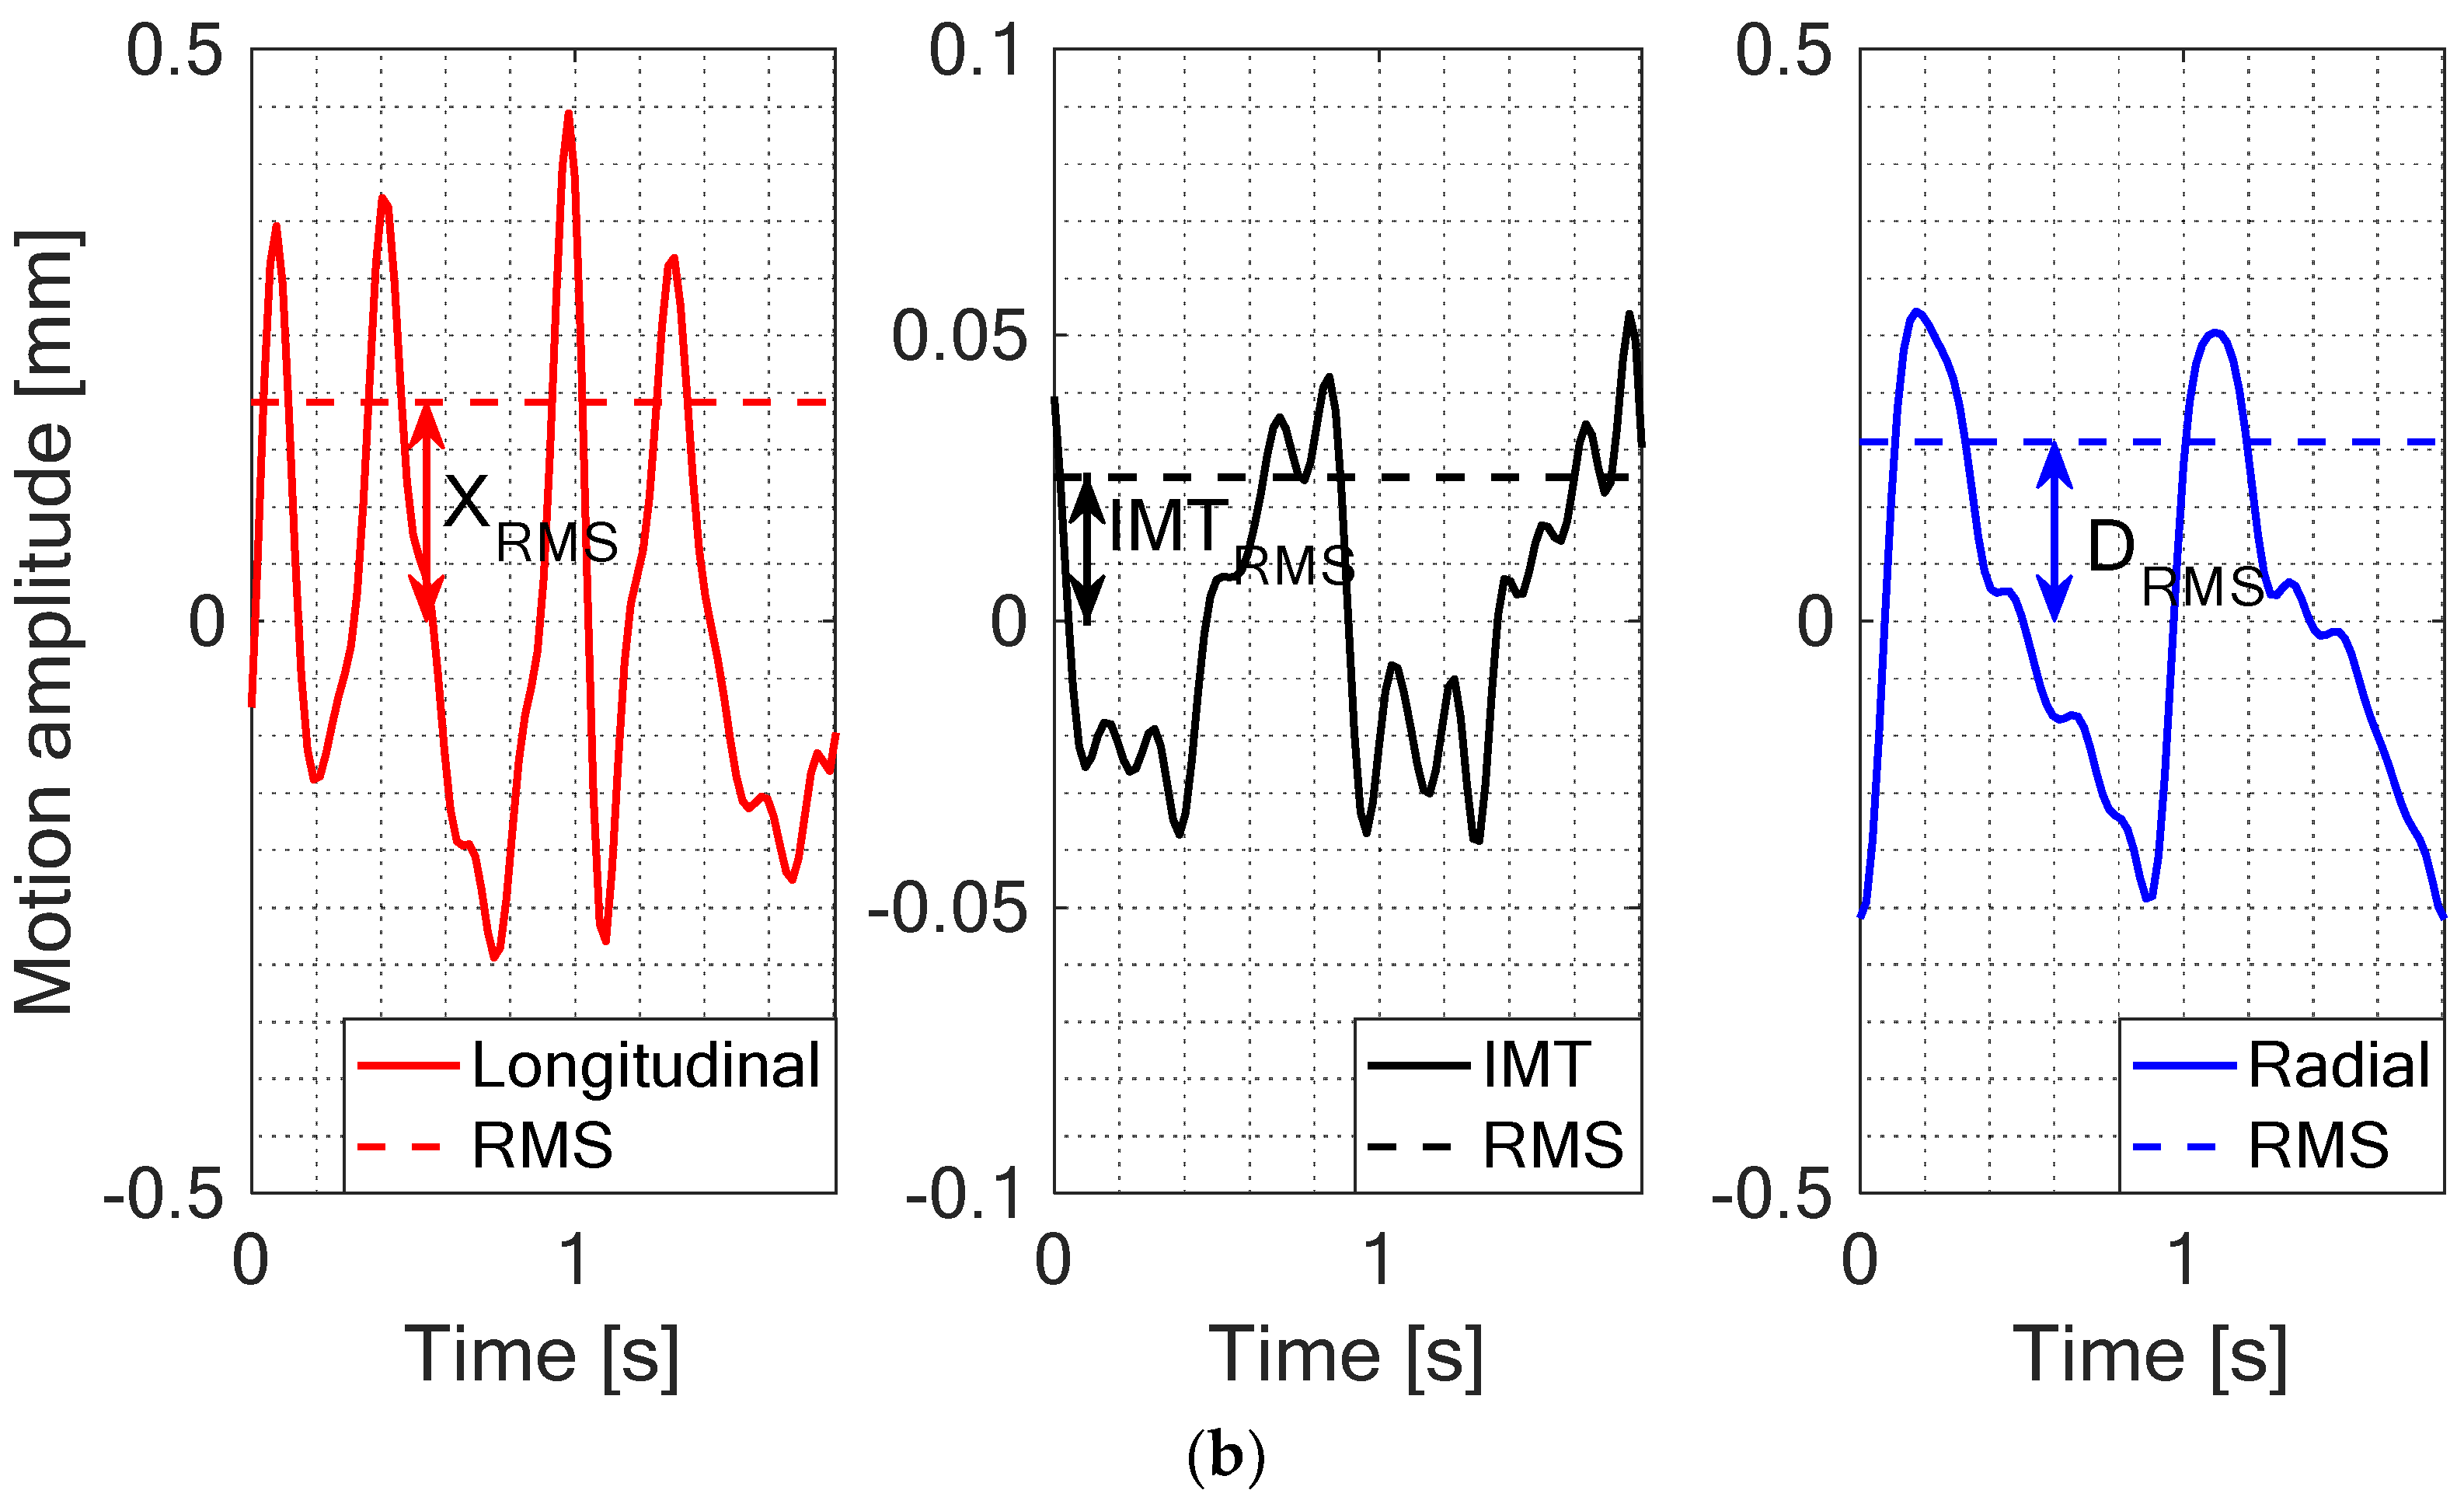
2.4. Quantitative Parametrization of IMT, Longitudinal and Radial Motion Signals of CCA

The average value (AV) is the mean amplitude of the waveform and can be calculated as follows:
A V = i = 1 n x i n
The RMS value of a quantity is the square root of the mean value of the squared values of the quantity taken over an interval:
R M S = 1 n i = 1 n ( x i D C ) 2
CAROLAB output signals were post-processed and quantitatively parametrized in our algorithm. From Equation (1), we calculate offset estimate or AV of longitudinal motion (X0), diameter motion (D0), and IMT motion (IMT0) signals in the preselected time interval before post-processing. Examples of these estimates are shown with the help of arrows in Figure 2a. After filtering and detrending, all the aforementioned signals are parametrized calculating peak-to-peak amplitude and RMS estimates. Longitudinal motion RMS values were denoted by XRMS, radial motions by DRMS, and temporal variation of IMT by IMTRMS. Examples of these estimates are indicated in Figure 2b.

2.5. Statistical Analysis

All the earlier calculated parameters were represented as box-and-whisker plots for evaluation and analysis. The data were assessed for normality using the Shapiro–Wilk test [24]. This test was applied to the two subject groups and for each evaluated parameter, separately. The significance level was 5% and we found that the data were not normally distributed. To determine the difference between the two groups, a Mann–Whitney U test was used. The value p < 0.015 was considered to indicate a statistically significant difference. Statistical analysis was performed using MATLAB.

3. Results

From now on, we will provide two sets of boxplots for comparisons: One for healthy volunteers (white) and one for at-risk patients (yellow).
Figure 3 shows the comparison between the AV of longitudinal motion, radial motion and temporal variation of IMT for healthy volunteers and at-risk patients. The AV of radial motion and IMT variation can be interpreted as arterial diameter and IMT at equilibrium instants between pulses. The AV of longitudinal motion is near zero because the IM complex is returning to the initial position after anterograde and retrograde longitudinal shifts. Both the radial and IMT average values in healthy volunteers are a little more closely grouped, whereas the variability of these measurements in the at-risk patients’ group is slightly greater. Two extreme outliers of the IMT AV appear in both subjects’ groups.
Figure 4 shows statistics of RMS estimates of longitudinal motion, radial motion and temporal variation of IMT of the two groups. RMS estimates, or so-called effective values, are commonly used to indicate the time-averaged magnitude of a signal. In this particular case, this parameter accounts for the average activity of motion during two heart cycles. Both longitudinal and radial RMS values in healthy volunteers are a little wider whereas the spread of these measurements in at-risk patients are a little more closely grouped. Additionally, three to four extreme outliers of IMT RMS values appear in both groups.
Figure 5 shows the IMT and radial peak-to-peak motion amplitude distribution between the two groups. Peak-to-peak amplitudes represent time instant estimates of peaking motion signals. Radial motion signals are in maximal peak at systole and in minimal at diastole. IMT motion signals are in minimal peak at systole and in maximal at diastole. In addition, there are two extreme outliers in the healthy volunteers’ group and three in the at-risk patients’ group for the IMT peak-to-peak motion amplitude.

4. Discussion

In this study, we propose new parameters for the evaluation of the temporal variation of IMT and the longitudinal and radial arterial walls’ motions during the heart cycle. The main purpose is to provide estimates that will be influenced by all amplitude values of the aforementioned motion variations.
We have used CAROLAB software [10,22,23] in order to analyze two different populations (33 healthy volunteers and 69 at-risk patients). Our results have demonstrated that the arterial diameter of healthy volunteers is not distinct from that of the at-risk patients, while there is a significant difference in the IMT between these two groups, as seen in Figure 3. The arterial diameter is the same among all subjects while IMT increases for at-risk patients. In accordance with previous studies [10,11], we can state that IM thickening is associated with CVDs. There is a significant difference between healthy volunteers and at-risk patients according to the RMS values of longitudinal and radial motions, as seen in Figure 4. From these results, it is clear that the healthy volunteers’ CCA moves more in longitudinal and radial directions than in at-risk patients. This is consistent with what has been found in previous studies [17] and it may explain higher arterial elasticity in the healthy volunteers’ group. In this paper we only have motion or displacement signals to analyze. Elastography researchers [25,26] state that in response to pulsatile flow, a stiffer artery moves less. This empirical knowledge about the negative correlation of motion amplitude with artery stiffness can be observed in our estimates. In addition, we have done our own experiments [27] determining that displacement correlates with stiffness. We found that with the decrease of agar-based phantoms’ stiffness, the motion amplitude increases. No statistical difference can be claimed between the two groups according to the RMS value of IMT. Contrary to the findings of Zahnd et al. [23], we did not find any IMT variation increase in at-risk patients compared with healthy volunteers. Our results have demonstrated that there is no significant difference between healthy volunteers and at-risk patients according to IMT peak-to-peak motion amplitude, demonstrated in Figure 5. Although in our study two investigated populations were not so different, like healthy volunteers and diabetic patients, there is enough statistical difference of radial peak-to-peak motion amplitude between healthy volunteers and at-risk patients.
The main drawback is that some subjects presented low-quality B-mode sequences resulting in motion signals that were not repeatable. In these cases, the tracking process was repeated again with another kernel position in the CCA image, but this did not yield any better results. In addition, there were some sequences with fewer than two full heart cycles. Finally, all the B-mode sequences having such repeatability limitations were rejected from the study.
In order to get correct estimates of the temporal variation of IMT and radial motion, CCA walls have to appear as double-line patterns in all video sequences [14]. However, there were a few frames in some B-mode sequences where the intima-media complex was not as clearly visible as needed in CAROLAB software. This appears to be a case of errors resulting in inaccurate IM complex segmentation and finally incorrect values of IMT and radial motion.
According to our study, the echoscopy of CCA for the registration of temporal variation of IMT, longitudinal and radial motions is challenging. Following completion of the work reported in this paper, Au et al. [28] suggested to average four consequent heart cycles for representative measurement of longitudinal motion in CCA. Au et al. [28] noticed that indices of variability were reduced when two to four heart cycles were used. Any improvements in indices of variability were not observed when more than four heart cycles were averaged. This proves that more than four heart cycles are unnecessary to use [28]. In future studies, we propose using four heart cycles for representative estimates of not only longitudinal, but also temporal variation of IMT and radial motion. In addition, parameters for consecutive heart cycles’ repeatability must be incorporated into the B-mode sequences’ acquisition. Only similar consecutive heart cycles will be taken for evaluation of CCA motion. Standard deviation values can be derived between four consequent heart cycles as feedback for the sonographer and determine if the acquired sequence is acceptable or not. As we understand it, this gives clearly better results and ensures correct parametrization of the temporal variation of IMT, longitudinal and radial motions.
AV and RMS values of IMT variation, longitudinal and radial motions of two consequent heart cycles are new parameters, which have not been used previously in clinical studies associated with CCA and atherosclerosis. Future investigations are necessary to validate the conclusions that can be drawn from this study. Frequency domain parameters could be proposed in the future to distinguish healthy subjects from at-risk patients.

5. Conclusions

Reliable recording of sequences of echoscopy images from subject CCA is challenging. Collaboration of the subject is necessary to keep the body motionless during recording. All subjects’ motions during echoscopy were recorded as artefacts and this decreased repeatability of arterial pulsing movements. The results show statistically significant difference between healthy volunteers and at-risk patients according to the AV of temporal variation of IMT, RMS values of longitudinal and radial motions, and peak-to-peak amplitude of radial motions.

Author Contributions

Conceptualization, R.J. (Rytis Jurkonis) and R.K.; data curation, V.S.; formal analysis, M.M.; funding acquisition, R.J. (Rytis Jurkonis) and R.K.; investigation, R.J. (Rūta Jurgaitienė) and V.S.; methodology, R.J. (Rytis Jurkonis); project administration, R.J. (Rytis Jurkonis) and K.M.; resources, R.J. (Rytis Jurkonis) and K.M.; software, M.M. and R.J. (Rytis Jurkonis); supervision, R.J. (Rytis Jurkonis) and R.K.; visualization, M.M.; writing—original draft, M.M. and R.J. (Rytis Jurkonis); writing—review and editing, A.R.-M.

Funding

This research was supported by the Research, Development and Innovation Fund of Kaunas University of Technology (grant no. PP22/185) and the Research Fund of Lithuanian University of Health Sciences (grant no. BN18-73/SV5-0296).

Conflicts of Interest

The authors declare no conflict of interest.

References

  1. Cardiovascular Diseases (CVDs). Available online: https://www.who.int/en/news-room/fact-sheets/detail/cardiovascular-diseases-(cvds) (accessed on 11 December 2018).
  2. Cardiovascular Diseases (CVDs)–Global Facts and Figures. Available online: https://www.world-heart-federation.org/resources/cardiovascular-diseases-cvds-global-facts-figures/ (accessed on 17 December 2018).
  3. Zahnd, G.; Boussel, L.; Sérusclat, A.; Vray, D. Intramural Shear Strain can Highlight the Presence of Atherosclerosis: A Clinical in Vivo Study. In Proceedings of the 2011 IEEE International Ultrasonics Symposium, Orlando, FL, USA, 18–21 October 2011; pp. 1770–1773. [Google Scholar]
  4. Molinari, F.; Suri, J.S. Automated Measurement of Carotid Artery Intima-Media Thickness. In Ultrasound and Carotid Bifurcation Atherosclerosis; Nicolaides, A., Beach, K.W., Kyriacou, E., Pattichis, C.S., Eds.; Springer: London, UK; Dordrecht, The Netherlands; Heidelberg, Germany; New York, NY, USA, 2012; pp. 177–192. ISBN 978-1-84882-687-8. [Google Scholar]
  5. Hobbs, F.; Hoes, A.W.; Agewall, S.; Albus, C.; Brotons, C.; Catapano, A.L.; Cooney, M.; Corrà, U.; Cosyns, B.; Deaton, C.; et al. 2016 European Guidelines on Cardiovascular Disease Prevention in Clinical Practice. Eur. Heart J. 2016, 37, 2315–2381. [Google Scholar] [CrossRef]
  6. Zahnd, G.; Orkisz, M.; Sérusclat, A.; Vray, D. Minimal-Path Contours Combined with Speckle Tracking to Estimate 2D Displacements of the Carotid Artery Wall in B-Mode Imaging. In Proceedings of the 2011 IEEE International Ultrasonics Symposium, Orlando, FL, USA, 18–21 October 2011; pp. 732–735. [Google Scholar]
  7. Ahlgren, A.R.; Cinthio, M.; Steen, S.; Persson, H.W.; Sjöberg, T.; Lindström, K. Effects of Adrenaline on Longitudinal Arterial Wall Movements and Resulting Intramural Shear Strain: A First Report. Clin. Physiol. Funct. Imaging 2009, 29, 353–359. [Google Scholar] [CrossRef] [PubMed]
  8. Svedlund, S.; Gan, L. Longitudinal Wall Motion of the Common Carotid Artery can be Assessed by Velocity Vector Imaging. Clin. Physiol. Funct. Imaging 2011, 31, 32–38. [Google Scholar] [CrossRef] [PubMed]
  9. Au, J.S.; Ditor, D.S.; Macdonald, M.J.; Stöhr, E.J. Carotid Artery Longitudinal Wall Motion is Associated with Local Blood Velocity and Left Ventricular Rotational, but Not Longitudinal, Mechanics. Physiol. Rep. 2016, 4, 1–11. [Google Scholar] [CrossRef] [PubMed]
  10. Zahnd, G.; Orkisz, M.; Sérusclat, A.; Moulin, P.; Vray, D. Evaluation of a Kalman-Based Block Matching Method to Assess the Bi-Dimensional Motion of the Carotid Artery Wall in B-Mode Ultrasound Sequences. Med. Image Anal. 2013, 17, 573–585. [Google Scholar] [CrossRef] [PubMed]
  11. Bauer, M.; Caviezel, S.; Teynor, A.; Erbel, R.; Mahabadi, A.A.; Schmidt-Trucksäss, A. Carotid Intima-Media Thickness as a Biomarker of Subclinical Atherosclerosis. Swiss Med. Wkly. 2012, 142, 1–9. [Google Scholar] [CrossRef] [PubMed]
  12. Zahnd, G.; Salles, S.; Liebgott, H.; Vray, D.; Sérusclat, A.; Moulin, P. Real-time Ultrasound-tagging to Track the 2D Motion of the Common Carotid Artery Wall in Vivo. Med. Phys. 2015, 42, 820–830. [Google Scholar] [CrossRef] [PubMed]
  13. Persson, M.; Ahlgren, A.R.; Jansson, T.; Eriksson, A.; Persson, H.W.; Lindström, K. A New Non-invasive Ultrasonic Method for Simultaneous Measurements of Longitudinal and Radial Arterial Wall Movements: First in Vivo Trial. Wiley Online Libr. 2003, 23, 247–251. [Google Scholar] [CrossRef]
  14. Cinthio, M.; Ahlgren, A.R.; Bergkvist, J.; Jansson, T.; Persson, H.W.; Lindström, K. Longitudinal Movements and Resulting Shear Strain of the Arterial Wall. Am. J. Physiol.-Heart Circ. Physiol. 2006, 291, 394–402. [Google Scholar] [CrossRef] [PubMed]
  15. Cinthio, M.; Ahlgren, A.R.; Jansson, T.; Eriksson, A.; Persson, H.W.; Lindstrom, K. Evaluation of an Ultrasonic Echo-Tracking Method for Measurements of Arterial Wall Movements in Two Dimensions. IEEE Trans. Ultrason. Ferroelectr. Freq. Control 2005, 52, 1300–1311. [Google Scholar] [CrossRef] [PubMed]
  16. Svedlund, S. Carotid Artery Longitudinal Displacement Predicts 1-Year Cardiovascular Outcome in Patients with Suspected Coronary Artery Disease Arteriosclerosis. Thromb. Vasc. Biol. 2011, 31, 1668–1674. [Google Scholar] [CrossRef] [PubMed]
  17. Zahnd, G.; Boussel, L.; Marion, A.; Durand, M.; Moulin, P.; Sérusclat, A.; Vray, D. Measurement of Two-Dimensional Movement Parameters of the Carotid Artery Wall for Early Detection of Arteriosclerosis: A Preliminary Clinical Study. Ultrasound Med. Biol. 2011, 37, 1421–1429. [Google Scholar] [CrossRef] [PubMed]
  18. Taivainen, S.H.; Yli-Ollila, H.; Juonala, M.; Kähönen, M.; Raitakari, O.T.; Laitinen, T.M.; Laitinen, T.P. Interrelationships between Indices of Longitudinal Movement of the Common Carotid Artery Wall and the Conventional Measures of Subclinical Arteriosclerosis. Clin. Physiol. Funct. Imaging 2017, 37, 305–313. [Google Scholar] [CrossRef] [PubMed]
  19. Yli-Ollila, H.; Laitinen, T.; Weckström, M.; Laitinen, T.M. New Indices of Arterial Stiffness Measured from Longitudinal Motion of Common Carotid Artery in Relation to Reference Methods, a Pilot Study. Clin. Physiol. Funct. Imaging 2016, 36, 376–388. [Google Scholar] [CrossRef] [PubMed]
  20. Qorchi, S. Extraction of Characteristic Patterns from Carotid Longitudinal Kinetics. In Proceedings of the Recherche en Imagerie et Technologies pour la Santé (RITS) 2017, Lyon, France, 27–29 March 2017. [Google Scholar]
  21. Cinthio, M.; Albinsson, J.; Erlöv, T.; Bjarnegård, N.; Länne, T.; Ahlgren, Å.R. Longitudinal Movement of the Common Carotid Artery Wall: New Information on Cardiovascular Aging. Ultrasound Med. Biol. 2018, 44, 2283–2295. [Google Scholar] [CrossRef] [PubMed]
  22. Zahnd, G.; Orkisz, M.; Vray, D. Imaging-Based Computational Biomedicine Lab; Graduate School of Information Science, Nara Institute of Science and Technology (NAIST): Nara, Japan, 2017. [Google Scholar] [CrossRef]
  23. Zahnd, G.; Kapellas, K.; van Hattem, M.; van Dijk, A.; Sérusclat, A.; Moulin, P.; van der Lugt, A.; Skilton, M.; Orkisz, M. A Fully-Automatic Method to Segment the Carotid Artery Layers in Ultrasound Imaging: Application to Quantify the Compression-Decompression Pattern of the Intima-Media Complex during the Cardiac Cycle. Ultrasound Med. Biol. 2017, 43, 239–257. [Google Scholar] [CrossRef] [PubMed]
  24. Razali, N.M.; Wah, Y.B. Power comparisons of Shapiro-Wilk, Kolmogorov-Smirnov, Lilliefors and Anderson-Darling tests. J. Stat. Model. Anal. 2011, 2, 21–33. [Google Scholar]
  25. Wells, P.N.T.; Liang, H.-D. Medical ultrasound: Imaging of soft tissue strain and elasticity. J. R. Soc. Interface 2011, 8, 1521–1549. [Google Scholar] [CrossRef] [PubMed]
  26. Shiina, T.; Nightingale, K.R.; Palmeri, M.L.; Hall, T.J.; Bamber, J.C.; Barr, R.G.; Castera, L.; Choi, B.I.; Chou, Y.H.; Cosgrove, D.; et al. WFUMB guidelines and recommendations for clinical use of ultrasound elastography: Part 1: Basic principles and terminology. 2015, 41, 1126–1147. [Google Scholar] [CrossRef]
  27. Zambacevičienė, M. RF Ultrasound Based Estimation of Pulsatile Flow Induced Microdisplacements in Phantom. In Proceedings of the World Congress on Medical Physics and Biomedical Engineering 2018, Prague, Czech Republic, 3–8 June 2018; pp. 601–605. [Google Scholar]
  28. Au, J.S.; Yli-Ollila, H.; Macdonald, M.J. An Assessment of Intra-Individual Variability in Carotid Artery Longitudinal Wall Motion: Recommendations for Data Acquisition. Physiol. Meas. 2018, 39, 09NT01. [Google Scholar] [CrossRef] [PubMed]
Figure 1. (a) Common carotid artery (CCA) echoscopy image with preselected kernel (red rectangular) for the estimation of the longitudinal motion and the segmented intima-media (IM) complex of both proximal and distal arterial walls (yellow lines) for temporal variation of intima-media thickness (IMT) and radial motion estimation in CAROLAB. (b) CAROLAB output signals detrended and filtered for better observation in a single diagram. A post-processed diameter signal was used to select two consequent heart cycles (red shadowed area). Only this time interval was used for quantitative parametrization of the signals.
Applsci 09 00465 g001
Figure 2. (a) Examples of three signals of CAROLAB output: Longitudinal motion, temporal variation of intima-media thickness (IMT) and radial motion. Average values (AV) or offsets of these three signals were denoted by X0, IMT0 and D0 accordingly. (b) Post-processed (each motion signal was filtered and detrended, subtracting the offset of the signal) motion signals of the common carotid artery (CCA) wall were used for the estimation of the root mean square (RMS): XRMS, IMTRMS, DRMS.
Applsci 09 00465 g002aApplsci 09 00465 g002b
Figure 3. Box-and-whisker plots of average values (AV) of longitudinal motion (X0), radial motion (D0), and temporal variation of IMT (IMT0) multiplied by a constant for healthy volunteers (white boxes, n = 30) and at-risk patients (yellow boxes, n = 49). Median values (successively, –0.09, –0.03, 5.41, 5.89, 5.49, 7.05) are shown as a horizontal red line within each box. Whiskers represent the minimum and maximum values. Outliers (estimates outside 1.5 times the inter-quartile range) are indicated by red +. The comparisons between the two groups are indicated by the p values. NS–non-significant.
Applsci 09 00465 g003
Figure 4. Box-and-whisker plots of root mean square (RMS) values of longitudinal motion (XRMS), radial motion (DRMS) and temporal variation of IMT (IMTRMS) multiplied by a constant for healthy volunteers (white boxes, n = 30) and at-risk patients (yellow boxes, n = 49). Median values (successively, 0.25, 0.18, 0.19, 0.14, 0.24, 0.22) are shown as a horizontal red line within each box. Whiskers represent the minimum and maximum values. Outliers (estimates outside 1.5 times the inter-quartile range) are indicated by red +. The comparisons between the two groups are indicated by the p values. NS–non-significant.
Applsci 09 00465 g004
Figure 5. Box-and-whisker plots of peak-to-peak motion amplitude of radial motion and temporal variation of IMT multiplied by a constant for healthy volunteers (white boxes, n = 30) and at-risk patients (yellow boxes, n = 49). Median values (successively, 0.67, 0.62, 0.62, 0.47) are shown as a horizontal red line within each box. Whiskers represent the minimum and maximum values. Outliers (estimates outside 1.5 times the inter-quartile range) are indicated by red +. The comparisons between the two groups are indicated by the p values.
Applsci 09 00465 g005

