Article

TDLAS Monitoring of Carbon Dioxide with Temperature Compensation in Power Plant Exhausts

1
School of Electric Power, South China University of Technology, Guangzhou 510640, China
2
Department of Mechanical and Automation Engineering, The Chinese University of Hong Kong, Shatin, Hong Kong SAR 2912, China
3
Guangdong Province Engineering Research Center of High Efficiency and Low Pollution Energy Conversion, Guangzhou 501640, China
*
Author to whom correspondence should be addressed.
Appl. Sci. 2019, 9(3), 442; https://doi.org/10.3390/app9030442
Submission received: 7 January 2019 / Revised: 24 January 2019 / Accepted: 24 January 2019 / Published: 28 January 2019
(This article belongs to the Special Issue State-of-the-art Laser Gas Sensing Technologies)

Abstract

:

Featured Application

Applying to complex industrial environment, TDLAS monitoring with temperature compensation can come handy.

Abstract

Temperature variations of flue gas have an effect on carbon dioxide (CO2) emissions monitoring. This paper demonstrates accurate CO2 concentration measurement using tunable diode laser absorption spectroscopy (TDLAS) with temperature compensation methods. A distributed feedback diode laser at 1579 nm was chosen as the laser source for CO2 measurements. A modeled flue gas was made referring to CO2 concentrations of 10–20% and temperatures of 298–338 K in the exhaust of a power plant. Two temperature compensation methods based on direct absorption (DA) and wavelength modulation (WMS) are presented to improve the accuracy of the concentration measurement. The relative standard deviations of DA and WMS measurements of concentration were reduced from 0.84% and 0.35% to 0.42% and 0.31%, respectively. Our experimental results have validated the rationality of temperature compensations and can be further applied for high-precision measurement of gas concentrations in industrial emission monitoring.

1. Introduction

Carbon dioxide (CO2) is a major component of greenhouse gases. Measurements of CO2 in large emission sources such as coal-fired power plants provide an effective support of carbon emission statistics. Outlet ducts in power plants provide a challenging detection environment for gas absorption detection due to the instability and poor timeliness. Compared with the current spectroscopic techniques such as Fourier transform infrared (FTIR) [1] and non-dispersive infrared (NDIR) spectroscopy [2], tunable diode laser absorption spectroscopy (TDLAS) with high sensitivity and short response time [3] offers significant advantages for in situ CO2 measurements in the hot, humid, and dusty environments of power plants. With the rapid advancements in semiconductor laser industry, TDLAS has been widely applied in different fields such as combustion diagnostics [4,5,6,7,8], isotopic analysis [9,10,11,12,13], and atmospheric gas detection [14,15,16,17,18]. Because of their exquisite constituents and compact packaging, as well as low cost, tunable semiconductor diode lasers are nearly the ideal source for highly-sensitive and highly-spectral-resolved measurements in industrial fields [19]. However, Doppler-broadening at high temperatures alters a larger portion of the integrated absorbance for a particular transition to the far-wing region. For in-situ CO2 measurements in outlet ducts, the temperature-varied absorption line intensity leads to measurement error in both direct absorption (DA) and wavelength modulation spectroscopy (WMS) signals.
Numerous studies have been performed to investigate the influence of temperature variation on TDLAS measurement. Many of them used spectroscopic parameters such as line intensity [20] from databases like HITRAN (High Resolution Transmission) or HITEMP (High Temperature Molecular Spectroscopic). Nevertheless, these databases, which mainly derive from theoretical calculation, may have some uncertainty while applied in high-temperature measurement. Several of previous studies [21,22,23,24,25] measured spectral parameters such as line intensity, line position, and broadening coefficients in a harsh experimental condition. Under a certain range of pressure and temperature, they employed these spectroscopic parameters for temperature compensation. Empirical corrections to the temperature dependence of the absorption for CO2–CO2, CO2–N2, and CO2–O2 at 193–300 K and the wavelength near 4.3 μm are discussed [26,27]. These corrections are applied via the corrective shape χ-function to the line shape function of individual absorption features. Perrin et al. [28] continued the studies at 4.3 μm to develop a temperature dependent χ-function for corrections of CO2–CO2 and CO2–N2 collisions at temperatures up to 800 K. Additionally, Zhang et al. [29] proposed a 1f ratio method to correct the harmonic signals affected by temperature fluctuations. They employed a DFB (Distributed Feedback) laser at 760.77 nm to monitor 21% oxygen in the range of 300–900 K and the results showed that the proposed method was effective for minimizing the influence of temperature changes. Shu et al. [30] introduced a temperature correction coefficient for HCl concentration using TDLAS at 1.7 μm. Zhang et al. [31] studied the temperature influence on the detection of ammonia slip based on TDLAS. The empirical formula for temperature compensation was proposed and the error was reduced to about 5.1%. Qi et al. [32] simulated the process of direct TDLAS measurement of H2O based on the HITRAN spectra database and gave the temperature correction curve in atmosphere detection. A temperature correction function was optimized based on open-path TDLAS for determining ammonia emission rules in soil environments [33]. Liu et al. [34] combined regularization methods with TDLAS to measure non-uniform temperature distribution, relying on the measurements of 12 absorption transitions of water vapor from 1300 nm to 1350 nm. The results showed that regularization methods are less sensitive to the noise caused by temperature variation.
Despite some temperature compensation methods applied in industrial process monitoring, little work is found in practical emission measurements of CO2 at 1579 nm in power plants. In this paper, TDLAS experiments were conducted in a temperature field simulating the outlet duct of a power plant. Both DA and WMS methods are used to measure CO2 concentrations at different temperatures. Two temperature compensation methods are used to reduce the measurement errors.

2. Absorption Spectroscopy

2.1. Direct Absorption Spectroscopy

The fundamental theory that governs absorption spectroscopy for narrow-linewidth radiation sources is embodied in the Beer–Lambert law (Equation (1)). The ratio of the transmitted intensity It and initial (reference) intensity I0 of laser radiation through an absorbing medium at a particular frequency v is exponentially related to the transition line intensity S(T) (cm−2·atm−1), line-shape function φ(v) (cm), total pressure P (atm), volume concentration of the absorbing species X, and the path length L (cm):
I t I 0 = exp [ P S ( T ) ϕ ( v ) X L ]
If both sides of Equation (1) are computed logarithmically and integrated over the whole frequency domain, the volume concentration X is described by [34]:
X = + ln I t I 0 d v P S ( T ) L = A P S ( T ) L
If the minimum detectable integrated absorbance Amin is known, i.e., SNR (signal-to-noise ratio) = 1, the detection limit Xj,min of species j can be expressed as:
X j , min = A min P S ( T ) L
The temperature-dependent line intensity for a particular transition is determined by its line intensity S at a reference temperature T0 with the following equation:
S ( T ) = S ( T 0 ) ( Q ( T 0 ) Q ( T ) ) T 0 exp [ h c E i k ( 1 T 1 T 0 ) ] · [ 1 exp ( h c ν 0 , i / k T ) 1 exp ( h c ν 0 , i / k T 0 ) ]
where Q(T) is the partition function of the absorbing molecule (CO2), v0,i is the frequency of the transition, E″ is the lower-state energy of the transition, h is the Planck’s constant (6.626 × 10⁻²⁷ erg·s), k is the Boltzmann’s constant (1.38 × 10⁻¹⁶ erg/K), and c is the speed of light in vacuum [35].
Temperature correction is required for TDLAS measurements in the environment with varying gas temperatures. According to Equation (2), in the case of the constant optical path and pressure, the ratio of integrated absorbance and line intensity, A/S(T) is theoretically proportional to gas concentration X in the same system. Therefore, the linear correction between A/S(T) and gas concentration can be applied to compensate the errors caused by temperature influence as shown in the Equation (5):
y A / S ( T ) = a + b x X
In Equation (5), a and b are fitting coefficients. a is the background signal without absorption, and b is the gradient of the linear correction.

2.2. Wavelength Modulation Spectroscopy

Wavelength modulation spectroscopy could be used to improve the sensitivity of measurement. In WMS, the wavelength of the laser used is modulated by a combination of slow triangle wave and a fast-sinusoidal signal while the transmitted light is demodulated at a harmonic of the modulation frequency. For a sufficiently slow ramp, the frequency output of the laser can be expressed as [36]:
ν ( t ) = ν ¯ + ν 0 cos ( 2 π f t )
where ν ¯ is the laser center frequency, ν0 is the modulation amplitude, and f is the modulation frequency. The transmitted laser intensity can be expanded in a Fourier cosine series as:
I ( t ) = I 0 ( t ) T [ ν ¯ + ν 0 cos ( 2 π f t ) ] = I 0 ( t ) k = 0 k = H k ( ν ¯ , ν 0 ) cos ( 2 π k f t )
where Hk( ν ¯ , ν0) is the kth harmonic Fourier component of the transmission coefficient. The second harmonic Fourier coefficient which is given by:
H 2 ( x , m ) = 2 X L P S ( T ) π Δ ν c { 2 m 2 [ 2 + m 2 ( 1 + m 2 ) 1 / 2 2 ] }
Two dimensionless numbers x = 2( ν ¯ ν0)/Δvc, m = 2a/(Δvc), Δvc (cm−1) is the collisional linewidth (half width at half maximum, HWHM) of the probed transition, respectively; m is the modulation index, a dimensionless parameter defined as the ratio of the wavelength-modulation amplitude to the linewidth Δvc. CO2 concentration X is inferred explicitly from [37]:
X I 0 P 2 f π Δ v c S ( T ) P L { 2 m 2 [ 2 + m 2 ( 1 + m 2 ) 1 / 2 2 ] } 1
where P2f is the measured peak 2f signal at the line center v0; therefore, the measured column density depends on the line intensity and linewidth of the transition, both of which vary with temperature.
For the optical thin condition due to the weak absorption in the near-infrared and low-gas concentration in industrial emissions, the peak 2f signal is linearly proportional to concentration:
y X = a + b x P 2 f
The variation of line intensity and collisional linewidth caused by temperature change introduces errors to the above linear fitting. According to Equation (6), parameters like line intensity S(T) and collisional linewidth Δvc are considered in the correction of temperature influence, which is given by:
y X = a + b x P 2 f Δ v c S ( T )

3. Experiment Details

The exhaust of a power plant has a complicated composition, possibly including H2O, SO2, N2, O2, CO, and CO2. According to the HITRAN2012 database [38], O2 and SO2 have no transitions near 1579 nm, and the strongest transition of H2O is up to 10−26 in magnitude. Figure 1 shows the simulated absorbance of H2O (0.8%), CO (0.001%), and CO2 (10%) in the near-infrared at a typical condition of the power plant exhaust from 1578 to 1580 nm (6330–6335.5 cm−1). The CO2 absorbance near 1579.12 nm (6332.7 cm−1) selected in this study is approximately 1000 times stronger than the transitions of other gases and isolated from CO interference transitions, while it is still accessible by distributed feedback diode lasers. Thus, this transition is sufficiently strong and ideal for in situ CO2 measurement in the outlet ducts.
The experimental setup for CO2 concentration measurement is schematically shown in Figure 2. The setup consists of two main parts: gas preparation and laser detection. For the gas preparation, the CO2 mixtures were generated by mixing the pure N2 and CO2 (0%–20%, interval of 2%) continuous gas flows controlled by two mass flow controllers (Seven Stars, Beijing, China). A gas mixer was used to obtain the uniform gas mixture. For the laser detection, the 1.58 μm DFB laser with ~5 mW output power was used as the laser source to exploit the CO2 absorption line. A photodetector (SM05PD5A InGaAs Detector, THORLABS) was used to detect the transmitted laser beam through the test gas. Laser intensity and wavelength were varied by a combination of temperature and injection current using a commercial controller (PCI-1DA) with the real time spectrum display and capture features. The electrical signals received by the controller were processed into real-time spectral images. The wavelength was scanned (laser temperature at 35 °C, injection current scan between 30 and 120 mA) with a linear ramp of current from a function generator. The temperature and current tuning coefficients were measured to be 0.413 cm−1/K and 0.049 cm−1/mA, respectively. For the second harmonic signals, the laser controller contains lock-in amplification and demodulator for 2f signal extraction.
The laser beam was directed into a Herriot cell (29.5 cm long, 571 mL volume, effective optical path length of 20 m) by a collimator and detected by the InGaAs detector. The 20-meter optical path allowed the system to have sufficient detection sensitivity. The cell was mounted with two wedged (1.5°) sapphire windows to avoid unwanted interference fringes. Three type-K thermocouples were equally spaced along the center section of the Herriot cell to determine the temperature of CO2; the maximum temperature difference observed among these thermocouples was <0.1 K from 298 K to 338 K. The gas pressure was continuously measured by a pressure gauge (YN60, full range 0.6 MPa) with an accuracy grade of ±0.015 MPa.
Before each experiment, the Herriot cell was purged with pure N2 for 5 minutes to remove the residual gas. The cell was operated at 298–338 K (interval of 10 K) at an operational pressure of 1 atm. When a stabilized temperature was obtained, the test gases at six different CO2 concentrations (10%–20%, interval of 2%) were measured with a single sweep of the laser. The continuous tuning range (at constant temperature) was within 5 cm−1. The diode laser was scanned at a 5 Hz repetition rate continuously, and the data were sampled at a frequency of 24 kHz to provide 4800 data points/sweep. The response time of real-time online monitoring can be further reduced by decreasing the sampling frequency. Each measured spectrum was obtained with 20 averaged sweeps, yielding a 4 s measurement time that was fast enough to satisfy the industrial application. Experiments using both direct absorption and wavelength modulation were repeated for three times to evaluate the repeatability of the sensor system.

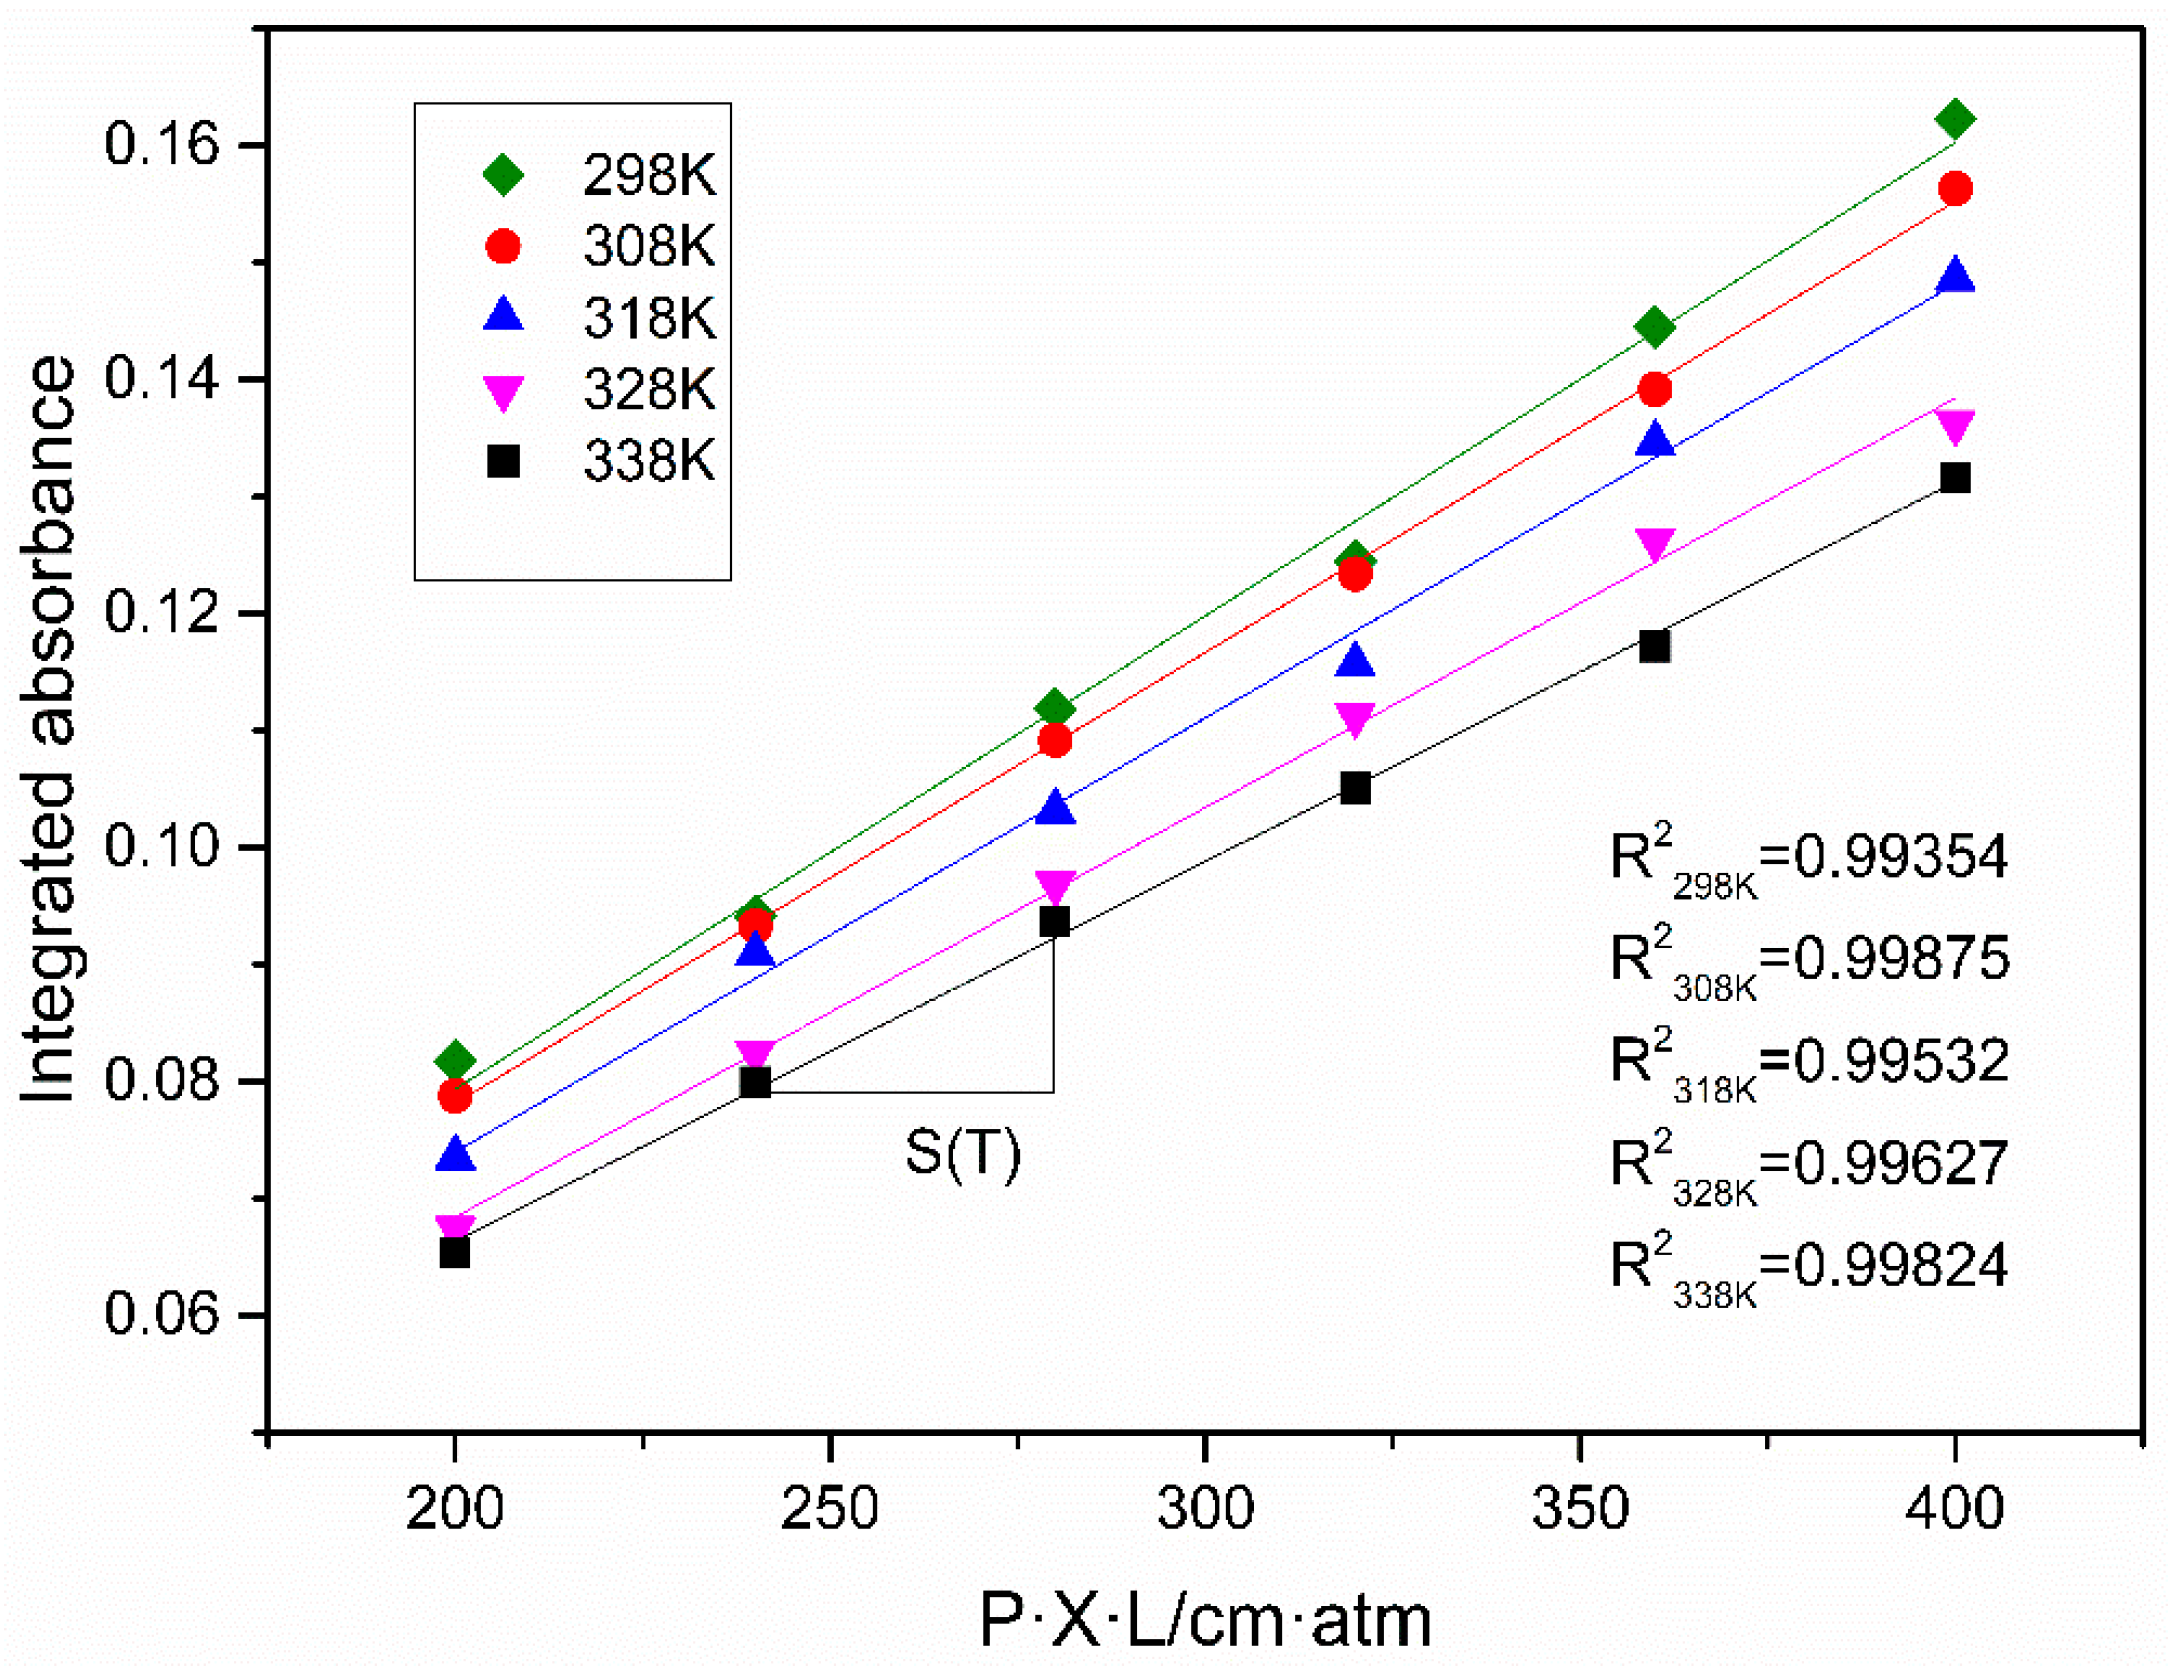
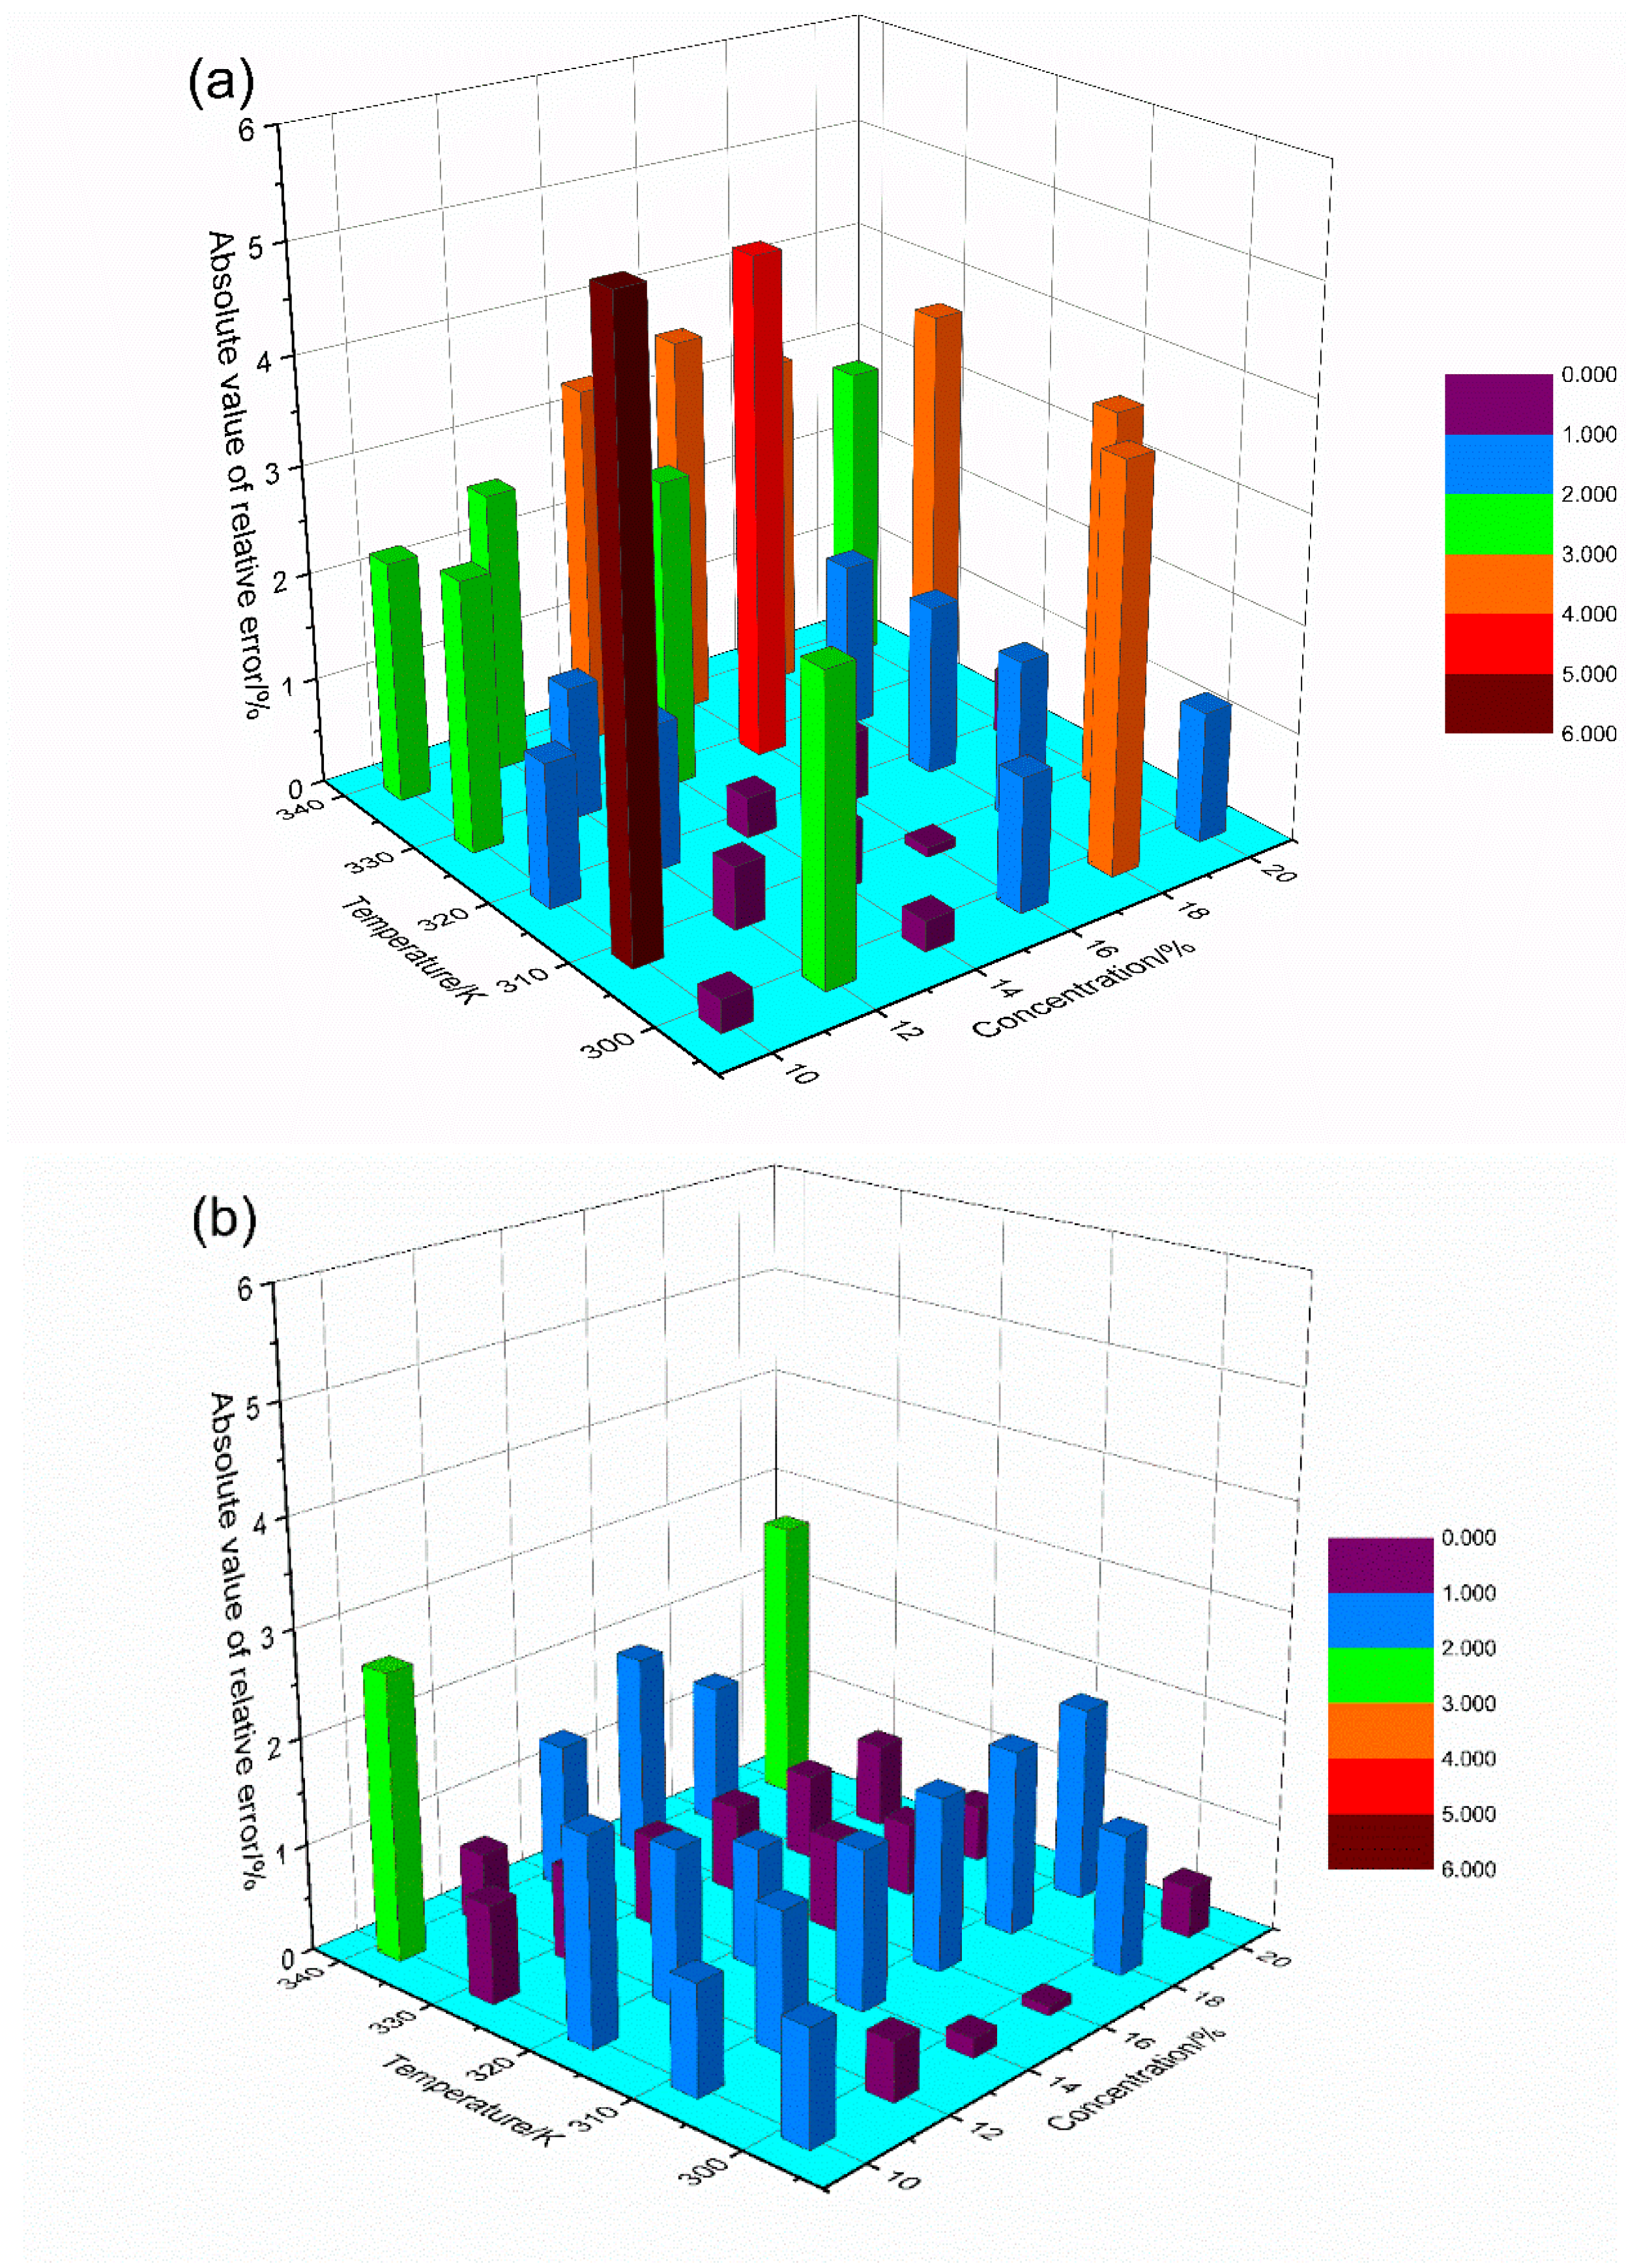
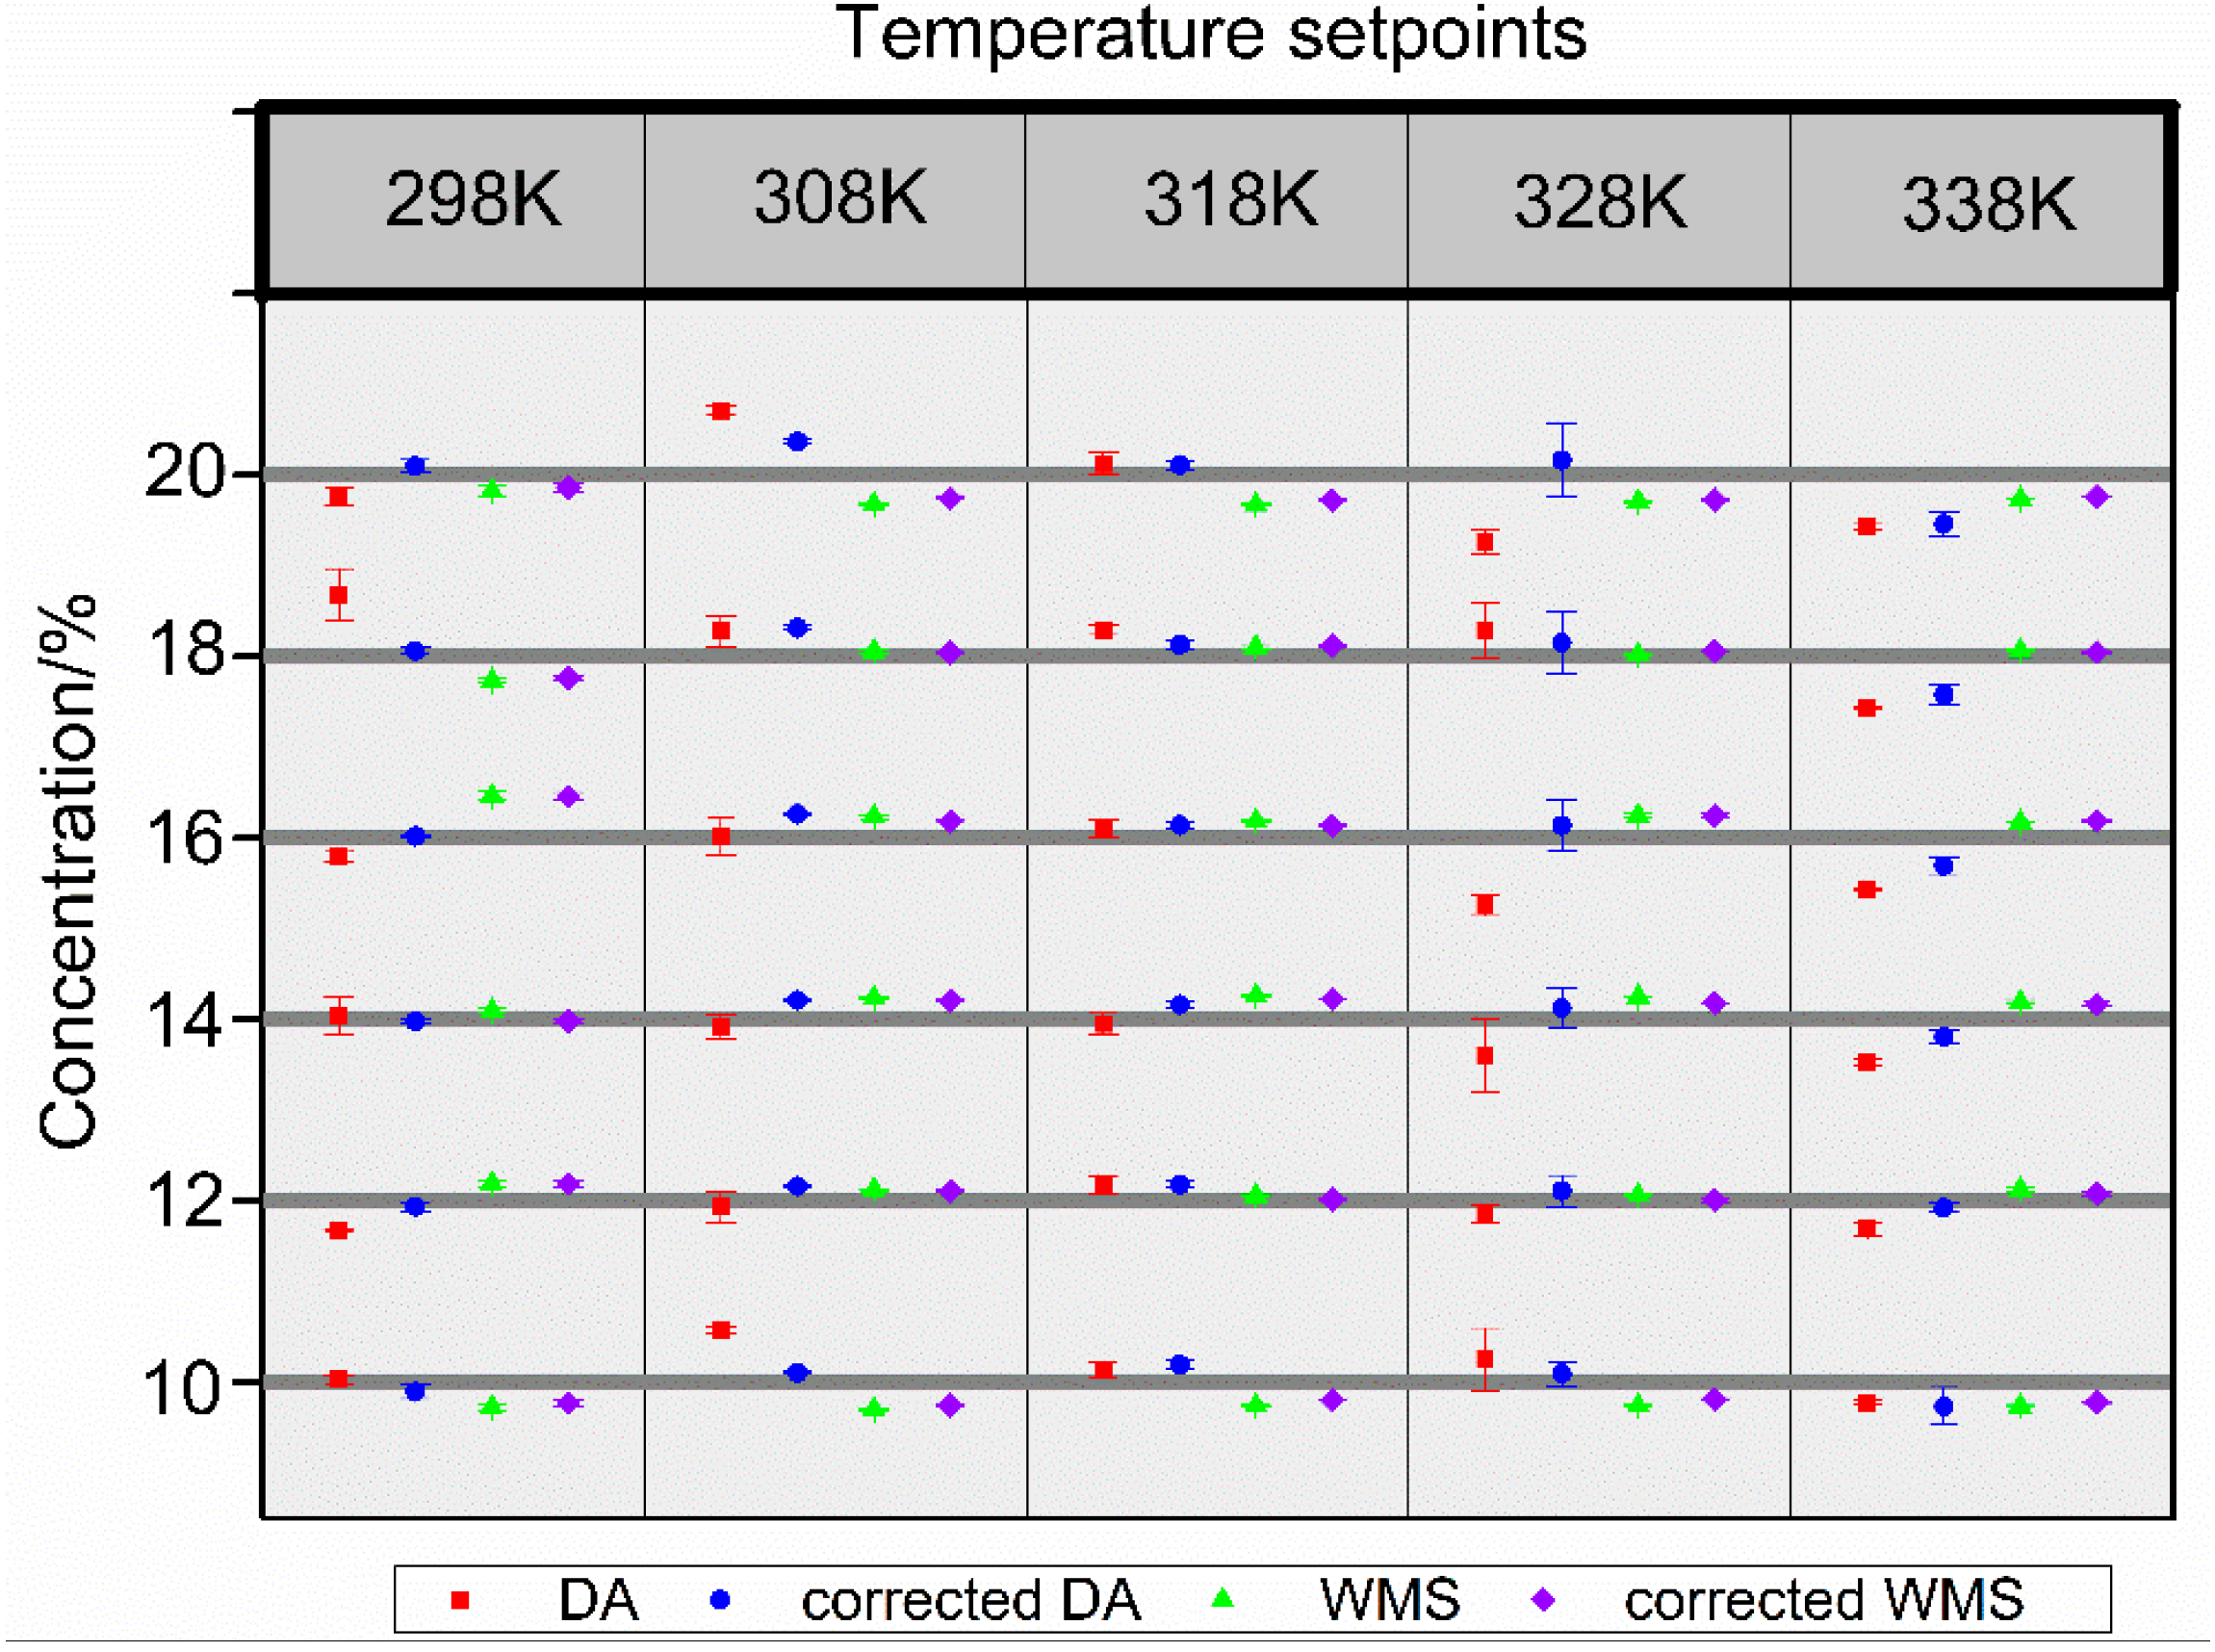
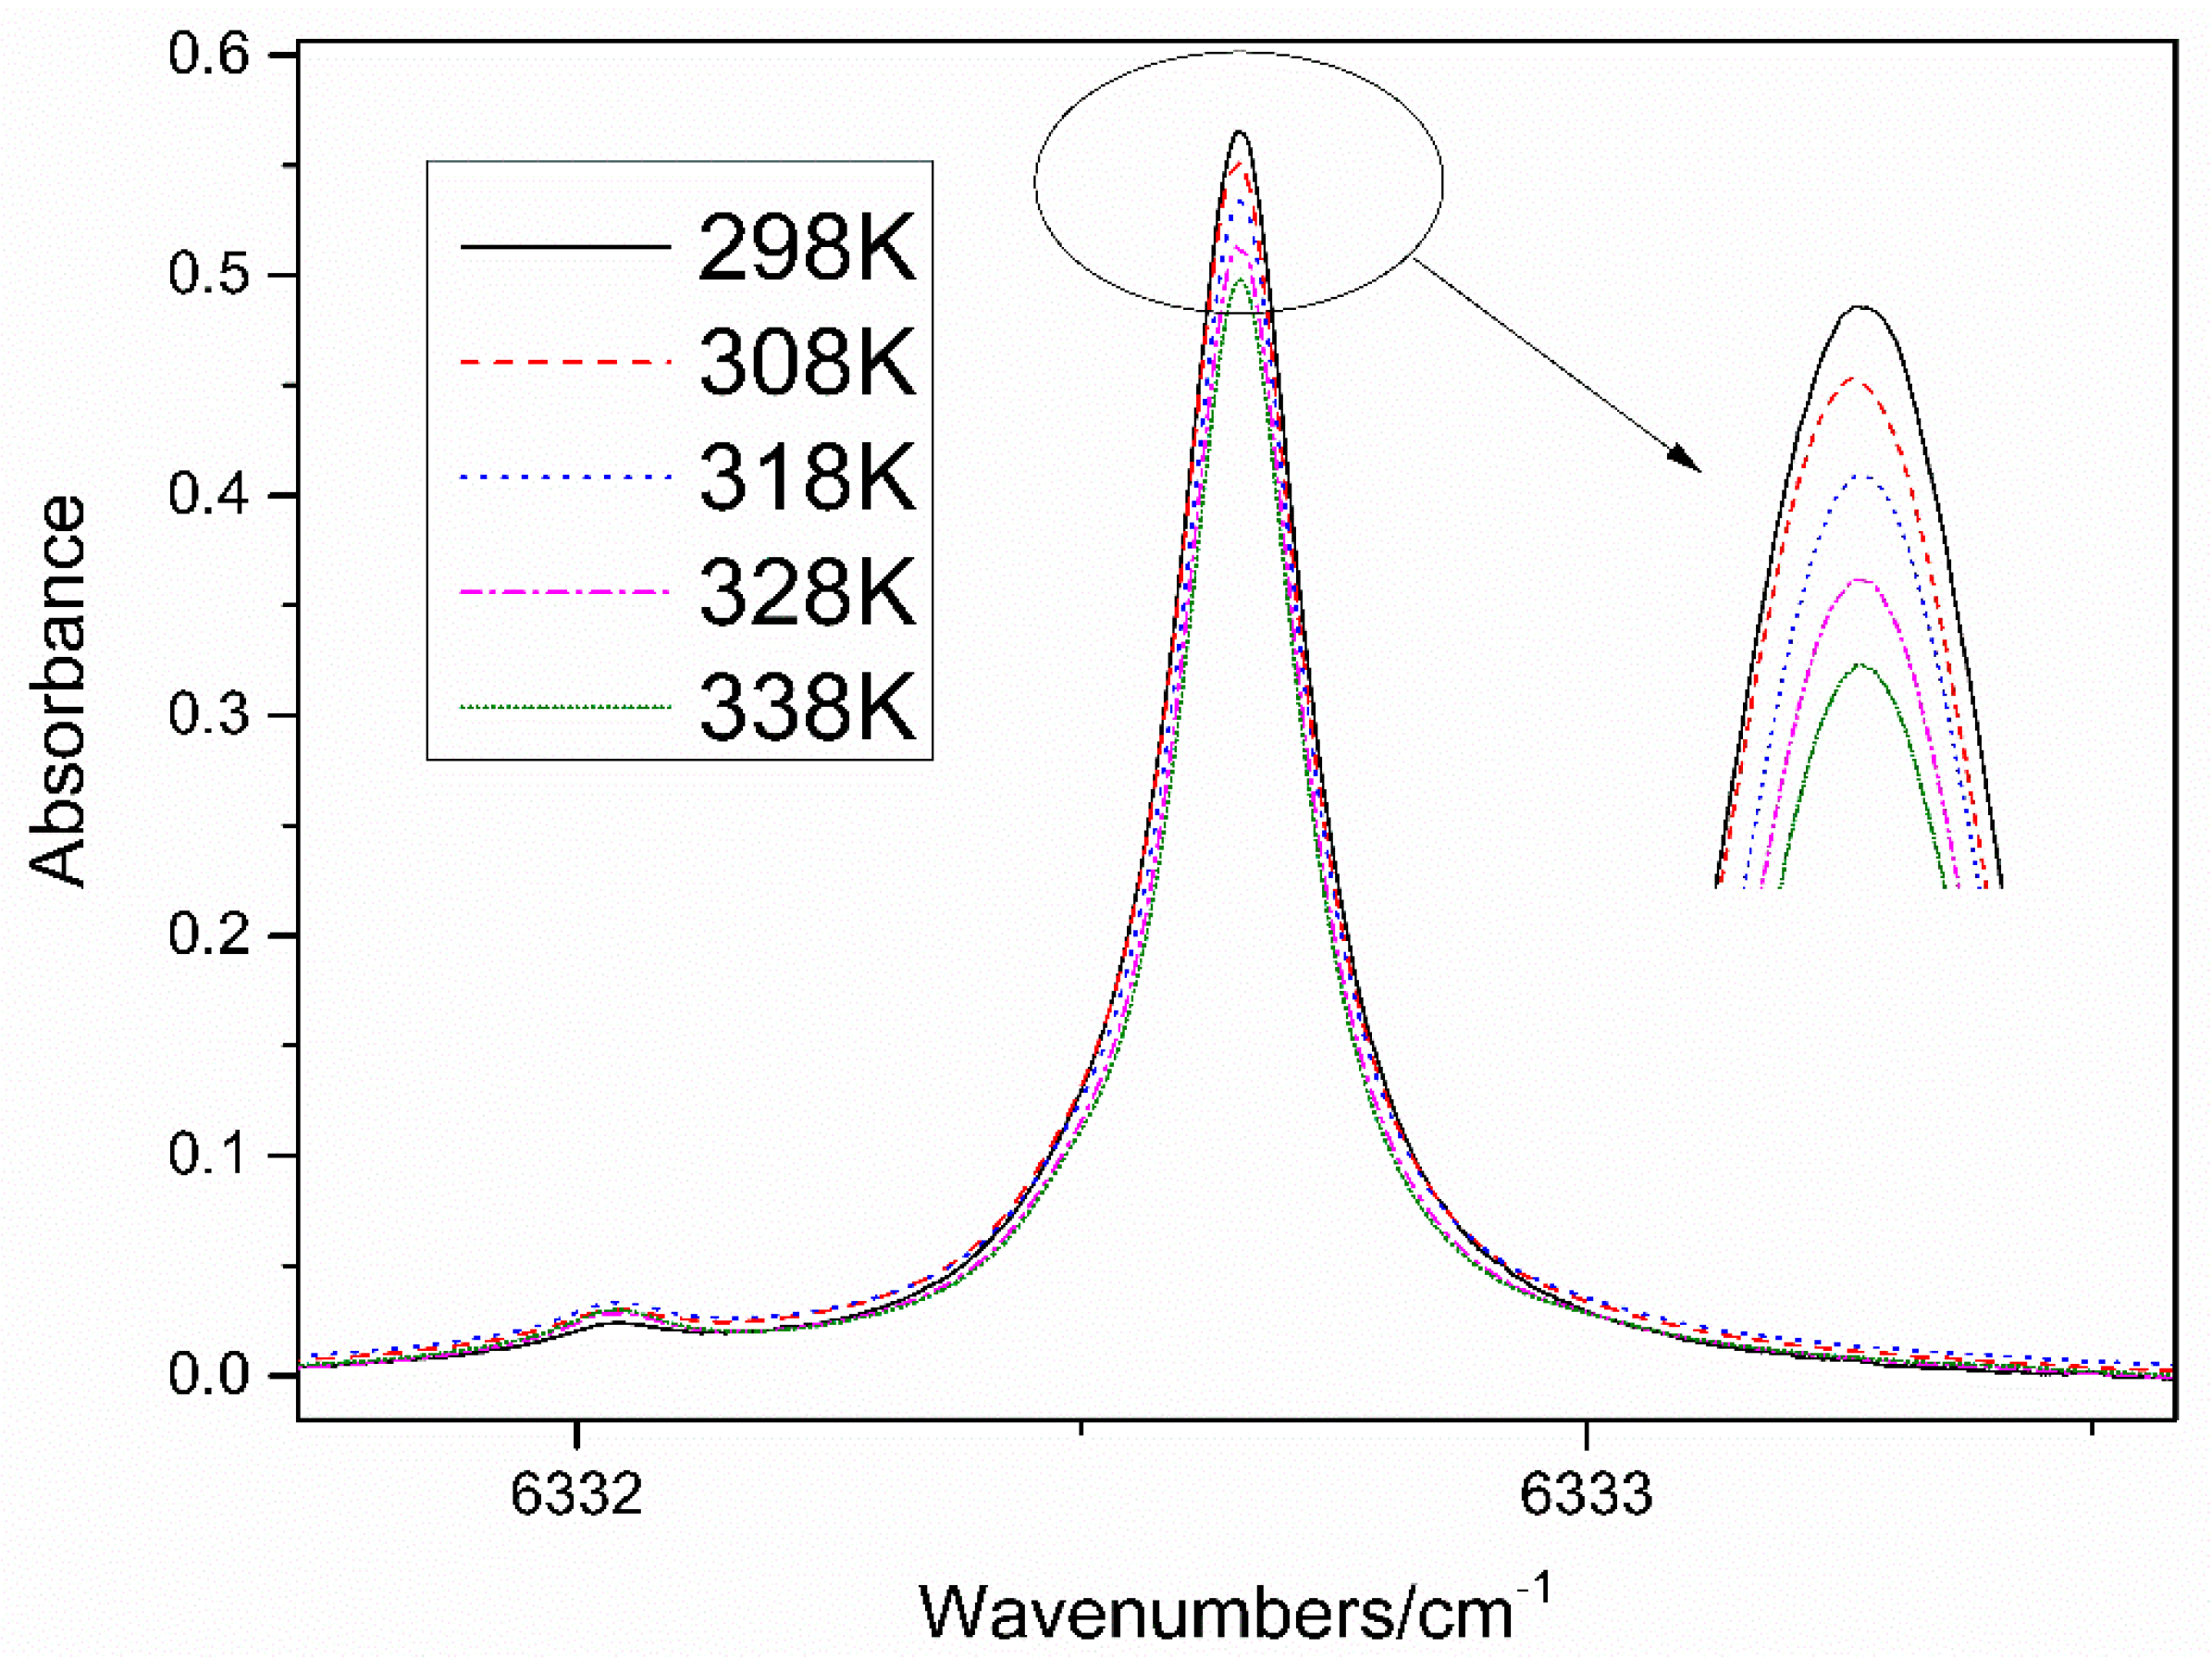
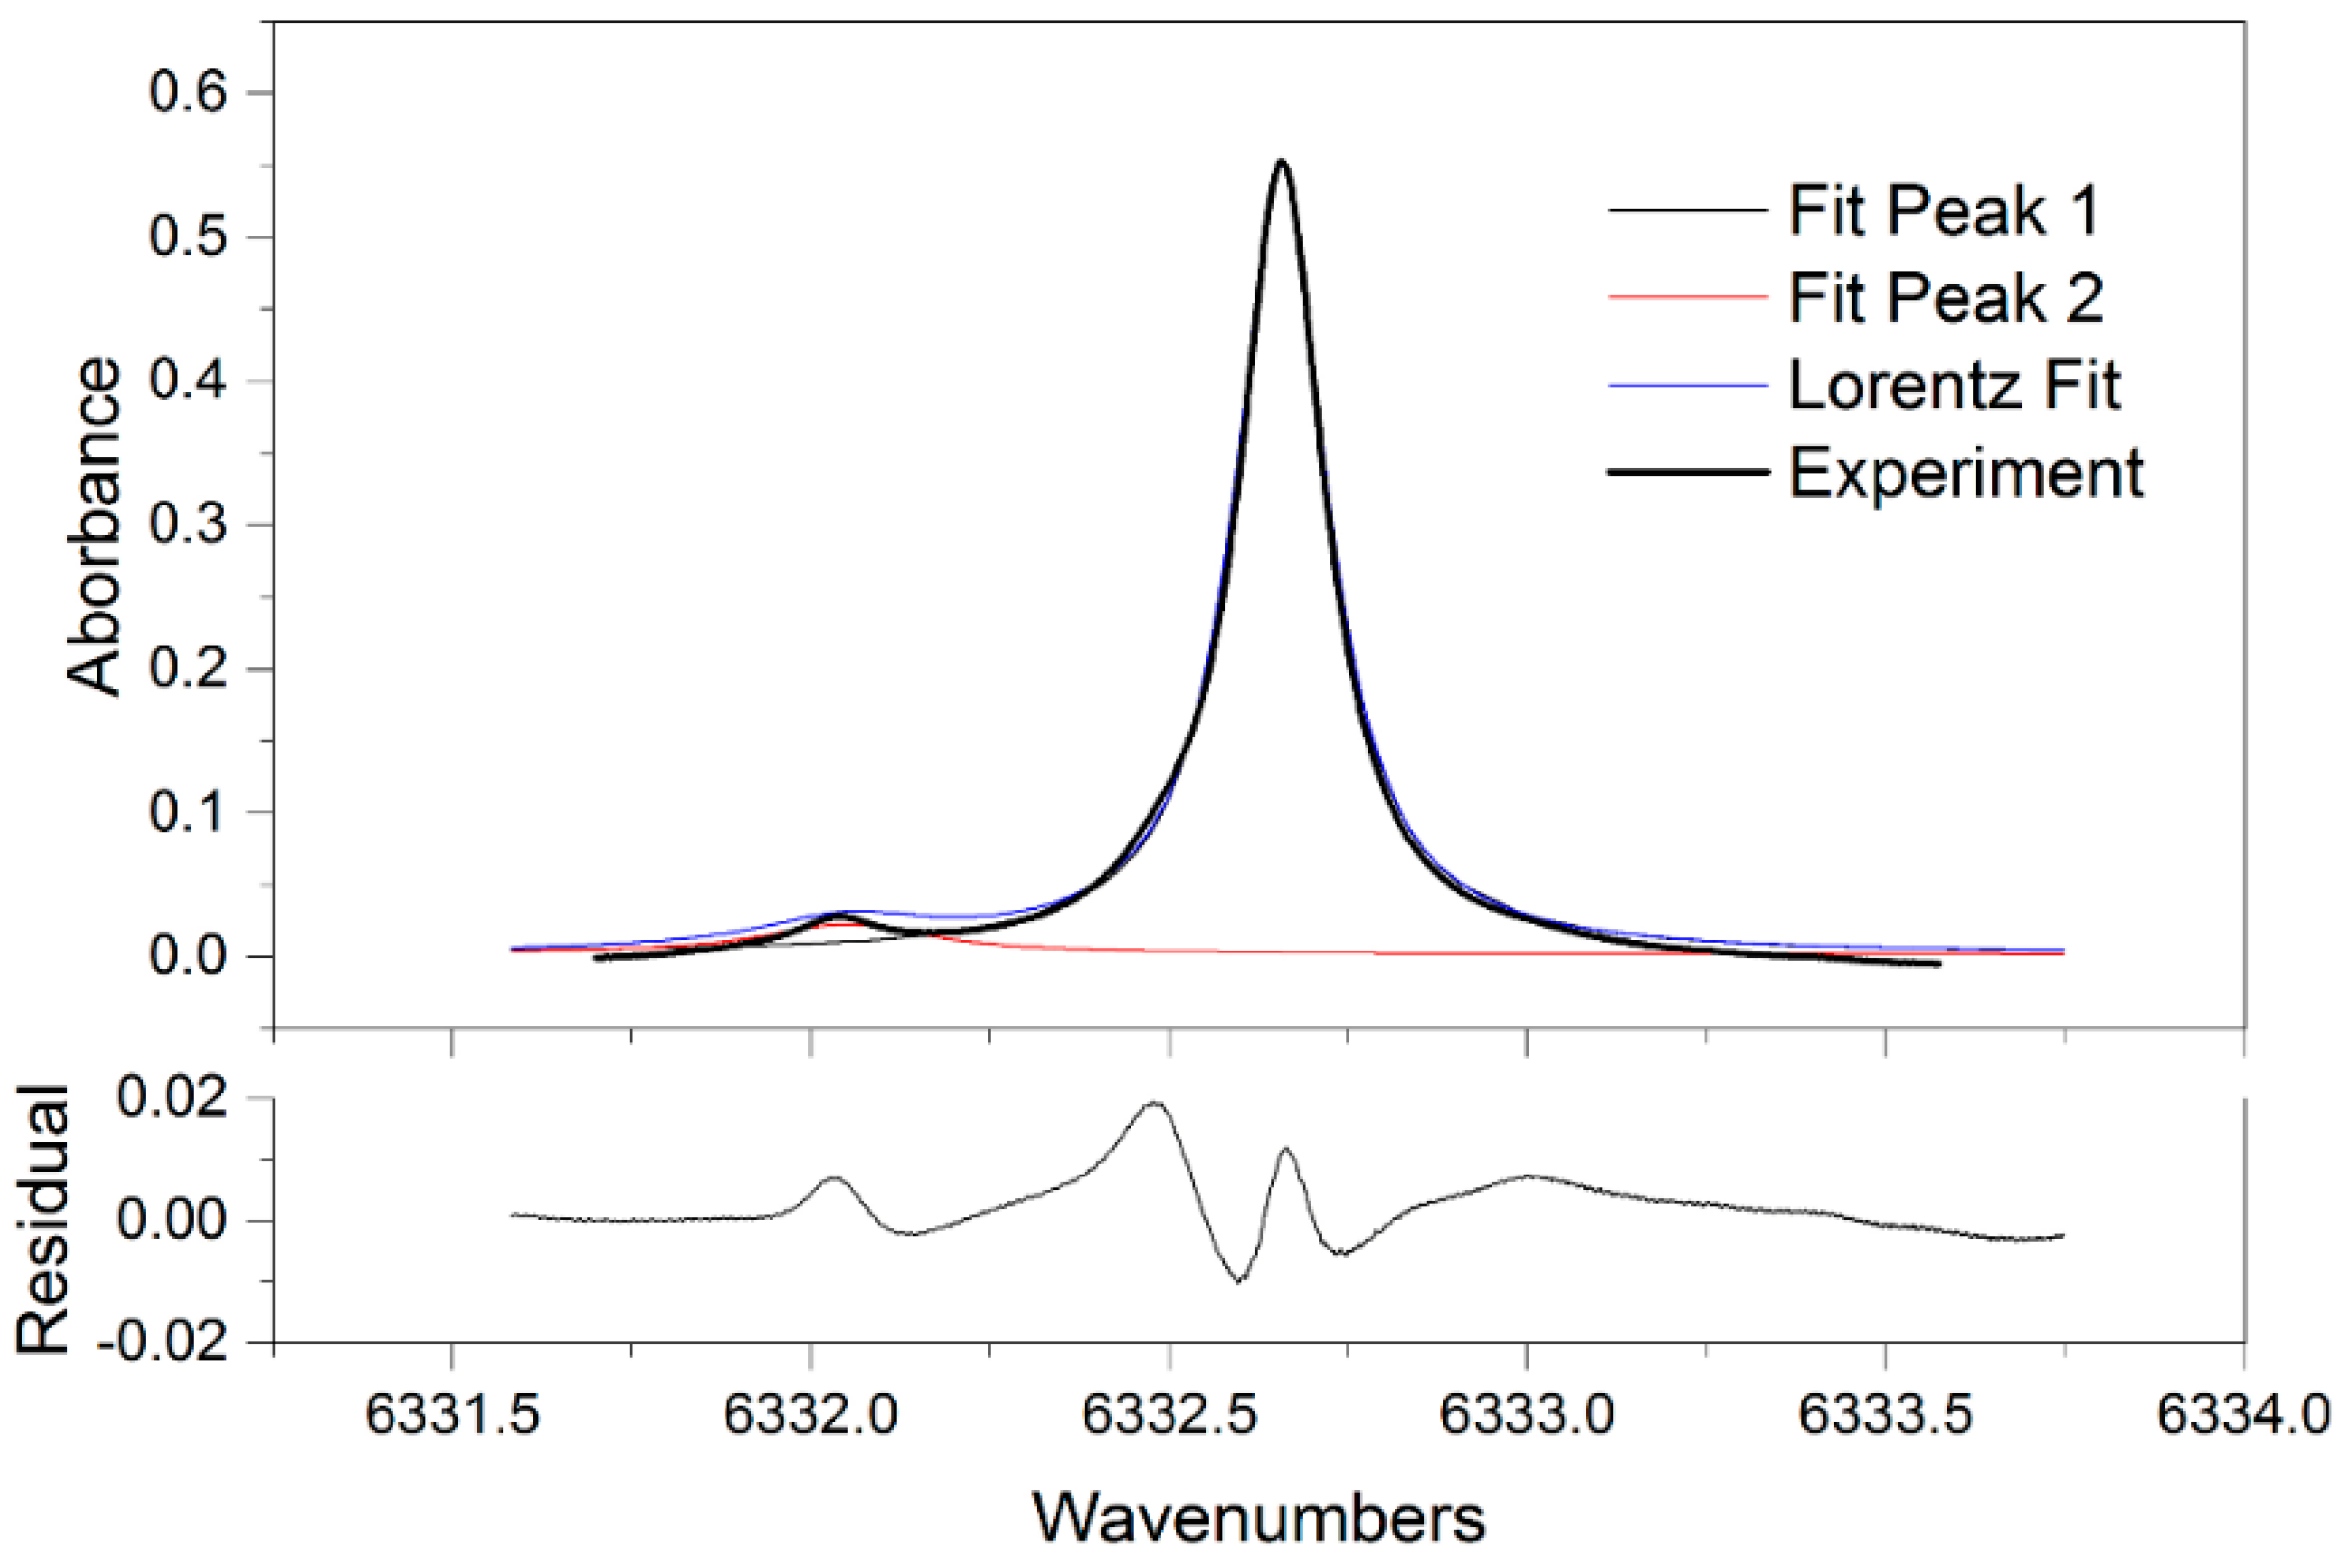
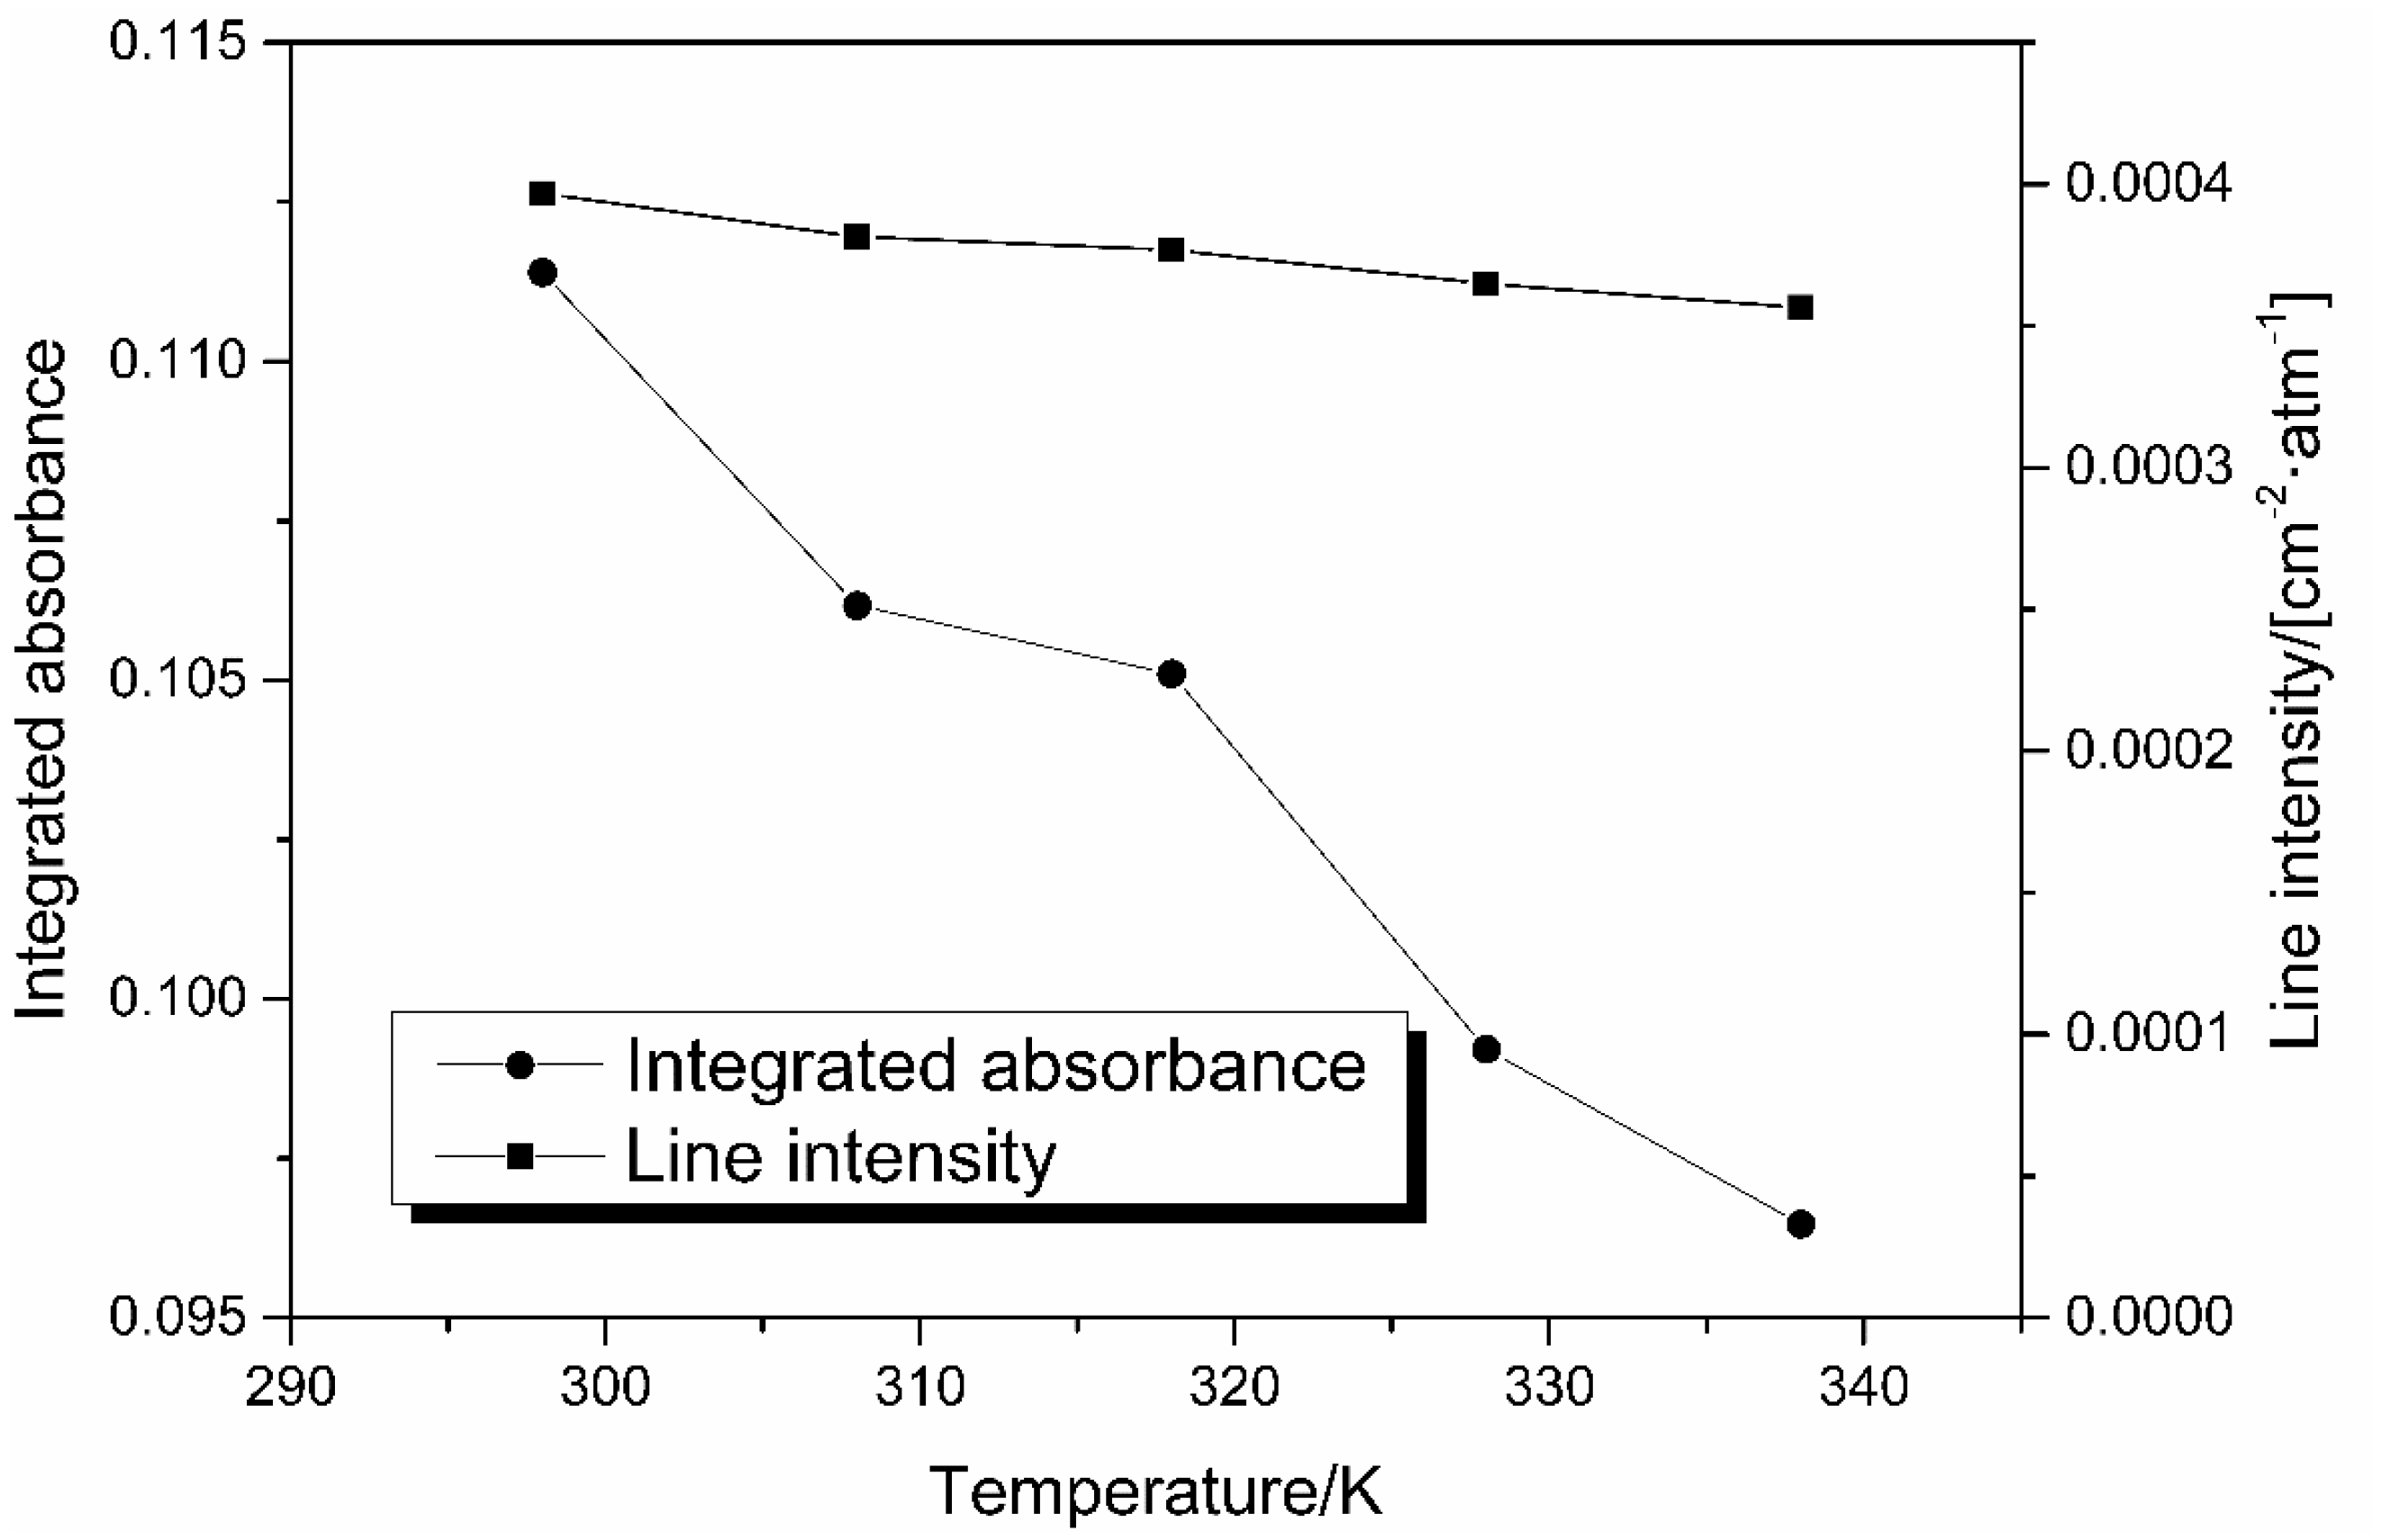
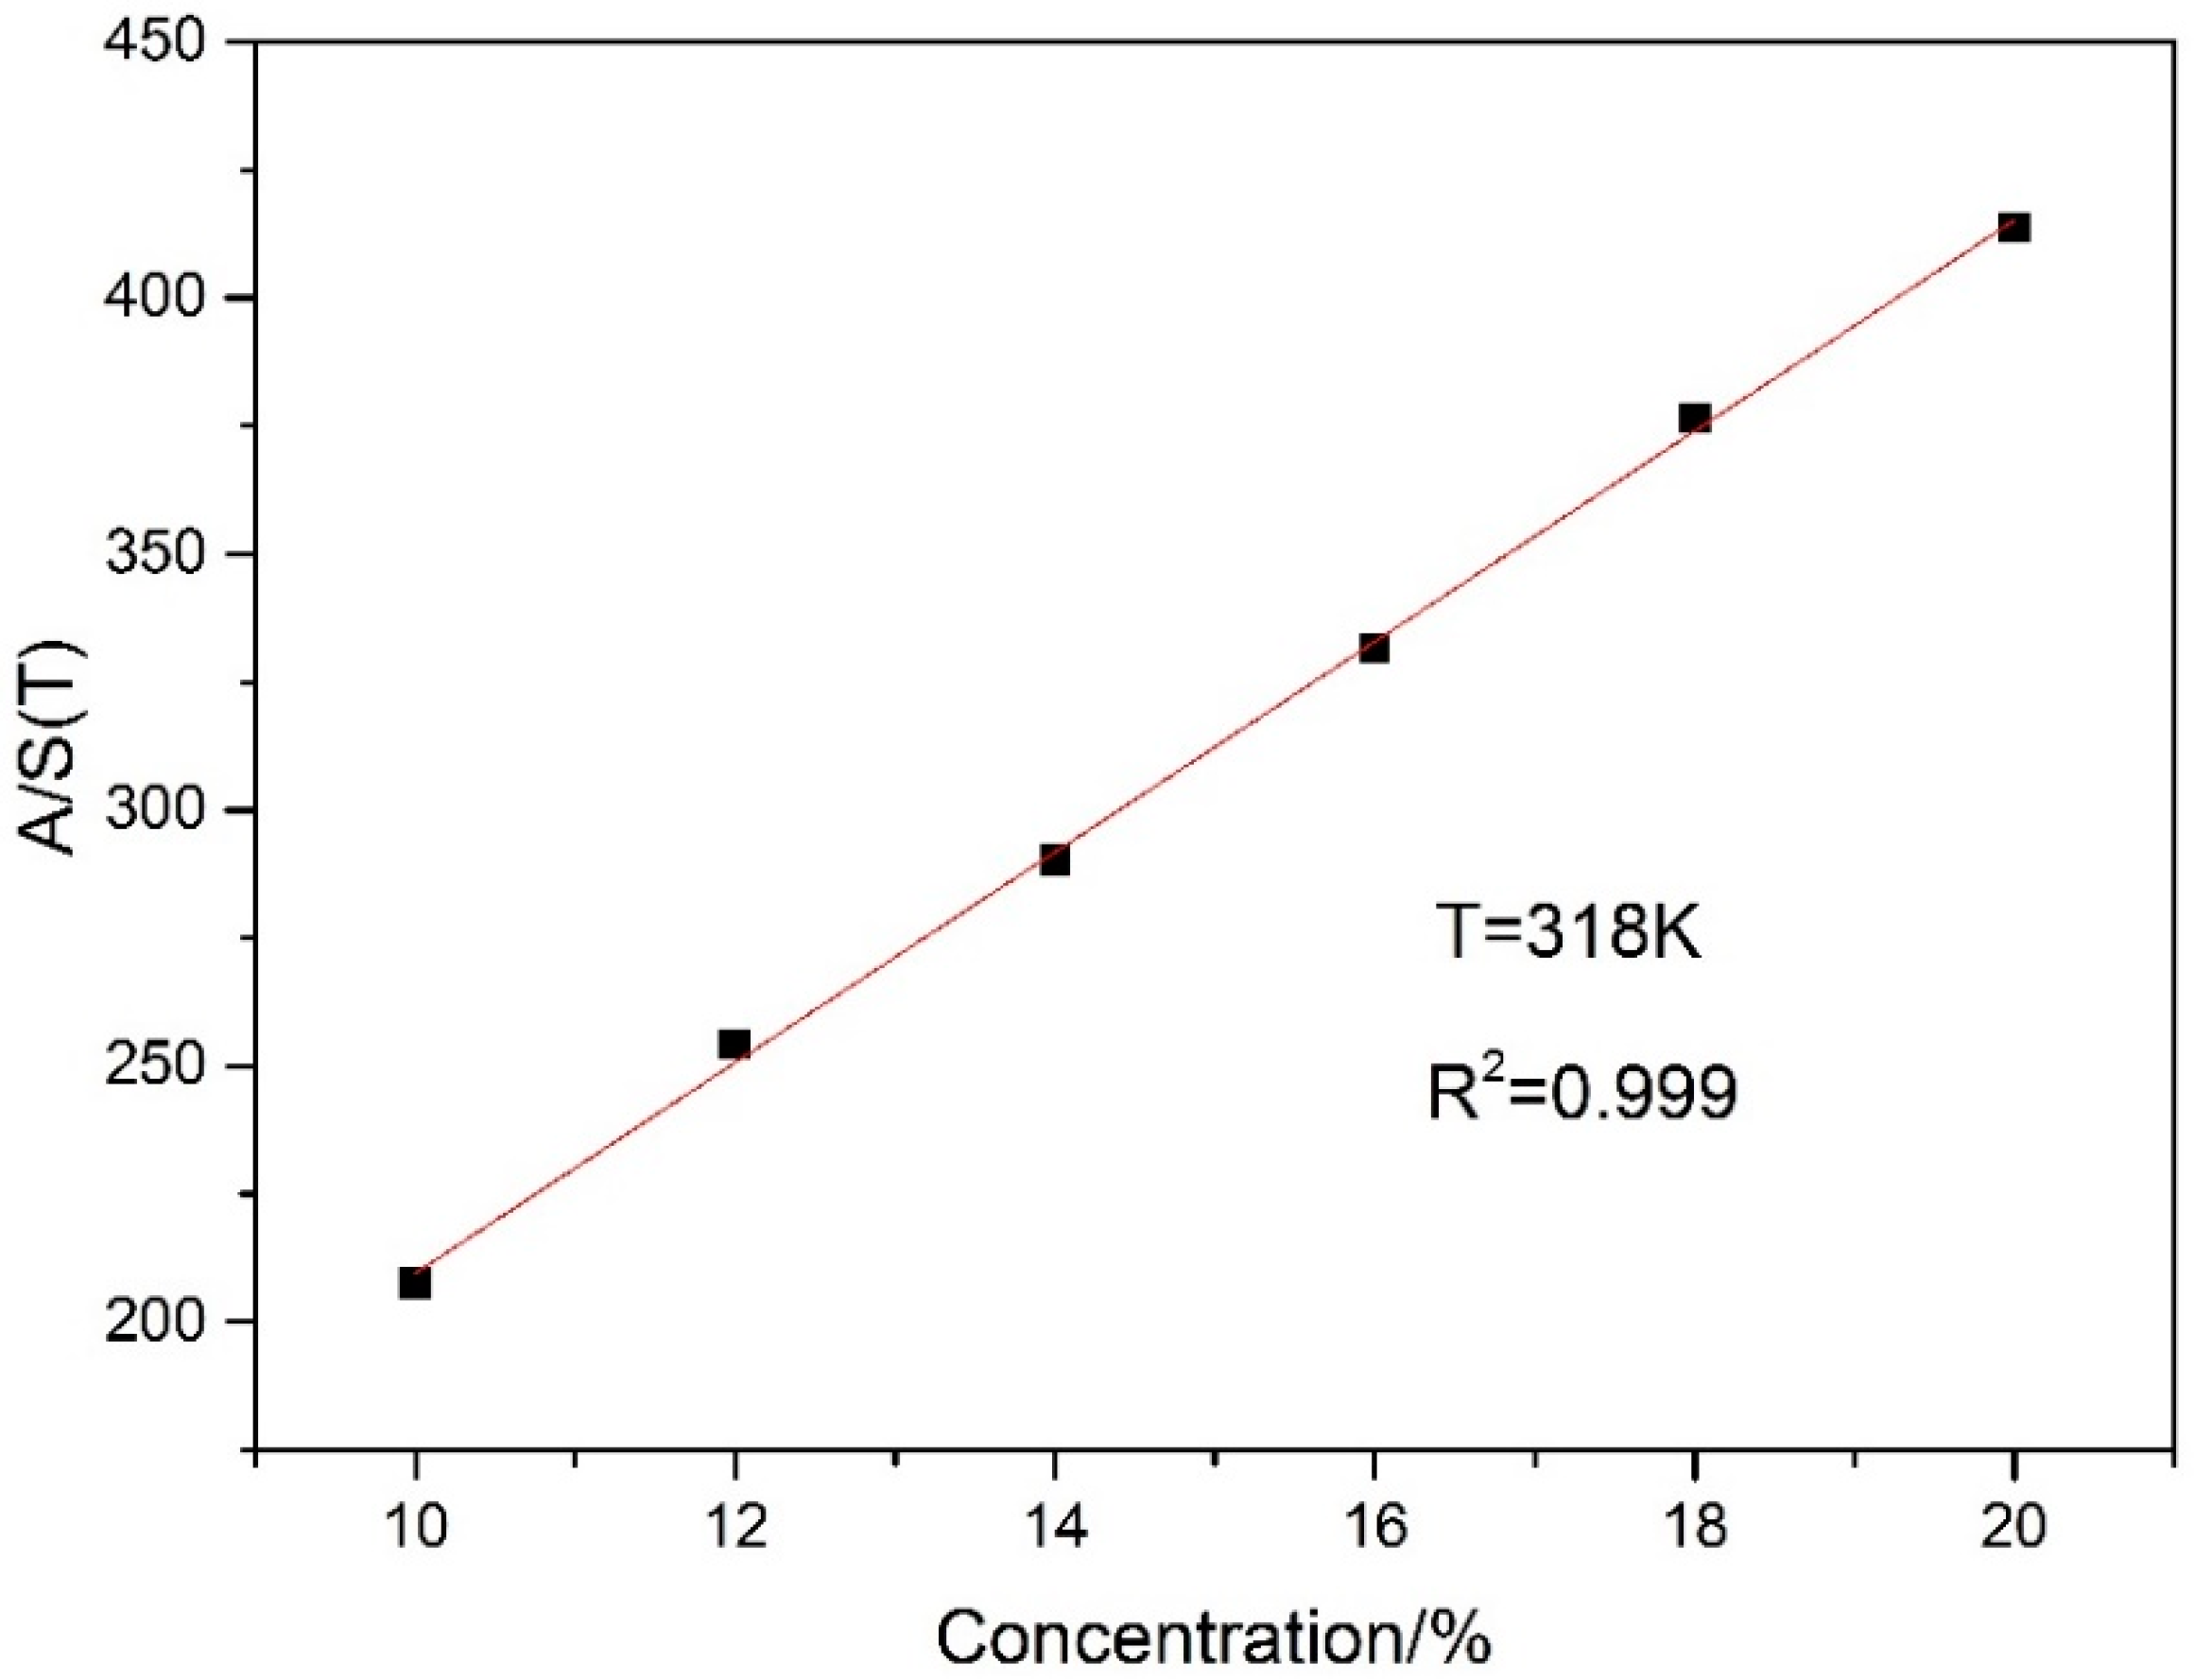
4. Direct Absorption Measurement and Correction

In this part, the direct absorption spectra with and without temperature corrections are compared to analyze the measurement accuracy by relative errors. The x-axis of measured spectral data were sampling points, which were time domain signals. The frequency calibration of the spectrum was required to convert the time domain to the frequency domain. The simulations based on HITRAN2012 were used to calibrate the frequency domain. As shown in Figure 3, three wavenumbers in HITRAN2012 correspond to three points in measured spectral. Therefore, the curvilinear equation of quadratic polynomial was obtained to convert the time domain to the frequency domain. Figure 4 plots the measured incident signal I0 and the direct absorption signals It for 10% CO2 at 318 K. The incident laser intensity I0 was inferred by third-order polynomial fit in the far-wing parts without absorption. The Lorentz profile was chosen to fit the line shape for improving accuracy due to the domination of Lorentzian component at 1 atm. After fitting, the logarithmic ln (It/I0) was integrated over the whole frequency domain to calculate the integrated absorbance A. Thus, the concentration X can be calculated from Equation (2), with line intensity S(T) obtained from Equation (4), total pressure P, and path length L as known parameters.
Figure 5 shows the measured absorption spectra of 16% CO2 in the 6331.8–6333.6 cm−1 spectral region at five different temperatures from 298 to 338K. The absorption signals in Figure 5 decrease with the increased temperature. Figure 6 plots the CO2 line shape near 6332.7 cm−1 (P = 1atm, T = 298 K, 10% CO2 in N2) well overlaid with the best-fit Lorentz profile. The obtained Lorentzian width of 0.15412 ± 0.0042 cm−1 was broadened by pressure and temperature. The residuals of the curve to data is shown in the bottom panel of Figure 6, showing that the fits are similar. Table 1 shows the relative errors of direct absorption from 298 to 338 K. The error of inferred concentration obtained from the spectroscopic measurement generally rises with the increase of temperature. At 308 K, the biggest relative error was up to 5.66%, which cannot meet the requirement of industrial application.
To further explore the cause of measurement errors, line intensities from the HITRAN database were compared with measured line intensities which are calculated by Equation (4). With a certain S(T), the obtained integrated absorbance A varies linearly with P·X·L where is the product of total pressure (P = 1 atm), absorption length (L = 2000 cm), and concentration (X = 10–20%, interval 2%). The relationship between A and P·X·L can be represented by a linear fitting and the slope of the fitting line is the intensity of the spectral line at the corresponding temperature from 298 K to 338 K, as depicted in Figure 7. Quality of the fit was very good in five temperatures, shown by R squared values from 0.99354 to 0.99875. As shown in Table 2, the calculated values show good agreement with the HITRAN values in variation tendency, but the former’s gradient decreases more with the temperature rising. The discrepancy indicates that a 3–10% change of line intensity leads to 1–6% change in the measured CO2 concentration.
Figure 8 depicts that both the integrated absorbance and the line intensity of 14% CO2 decrease with the increase of temperature. The discrepancy leads to large errors in the concentration measurement, when the total pressure P and path length L are invariable. This information can be used to compensate these errors caused by change of temperature. According to the Equation (5), the least squares method is used for linear fitting between A/S(T) and concentration X at different temperatures. Figure 9 shows the result of linear fit between A/S(T) and concentration at T = 318 K. The fitting results show that the R squared value reaches 0.999, indicating a good linear relationship between A/S(T) and concentration.
Figure 10 illustrates the absolute values of the relative error of the measured results before and after the correction. As shown in Figure 10, after temperature compensation, the maximum relative error is −2.57% corresponding to the measurement of 14% CO2 at 318 K. However, the absolute error was only 0.36% and the relative error of the mean square value was less than 3.5%. All these measurements confirm that this temperature compensation enables the direct detection of CO2 in outlet ducts temperature with a detection limit of 8.4 × l0−5 at SNR = 1. Measurements of CO2 concentration can be made for a variety of carbon emission sources, and the data are helpful for developing more accurate detection mechanisms.

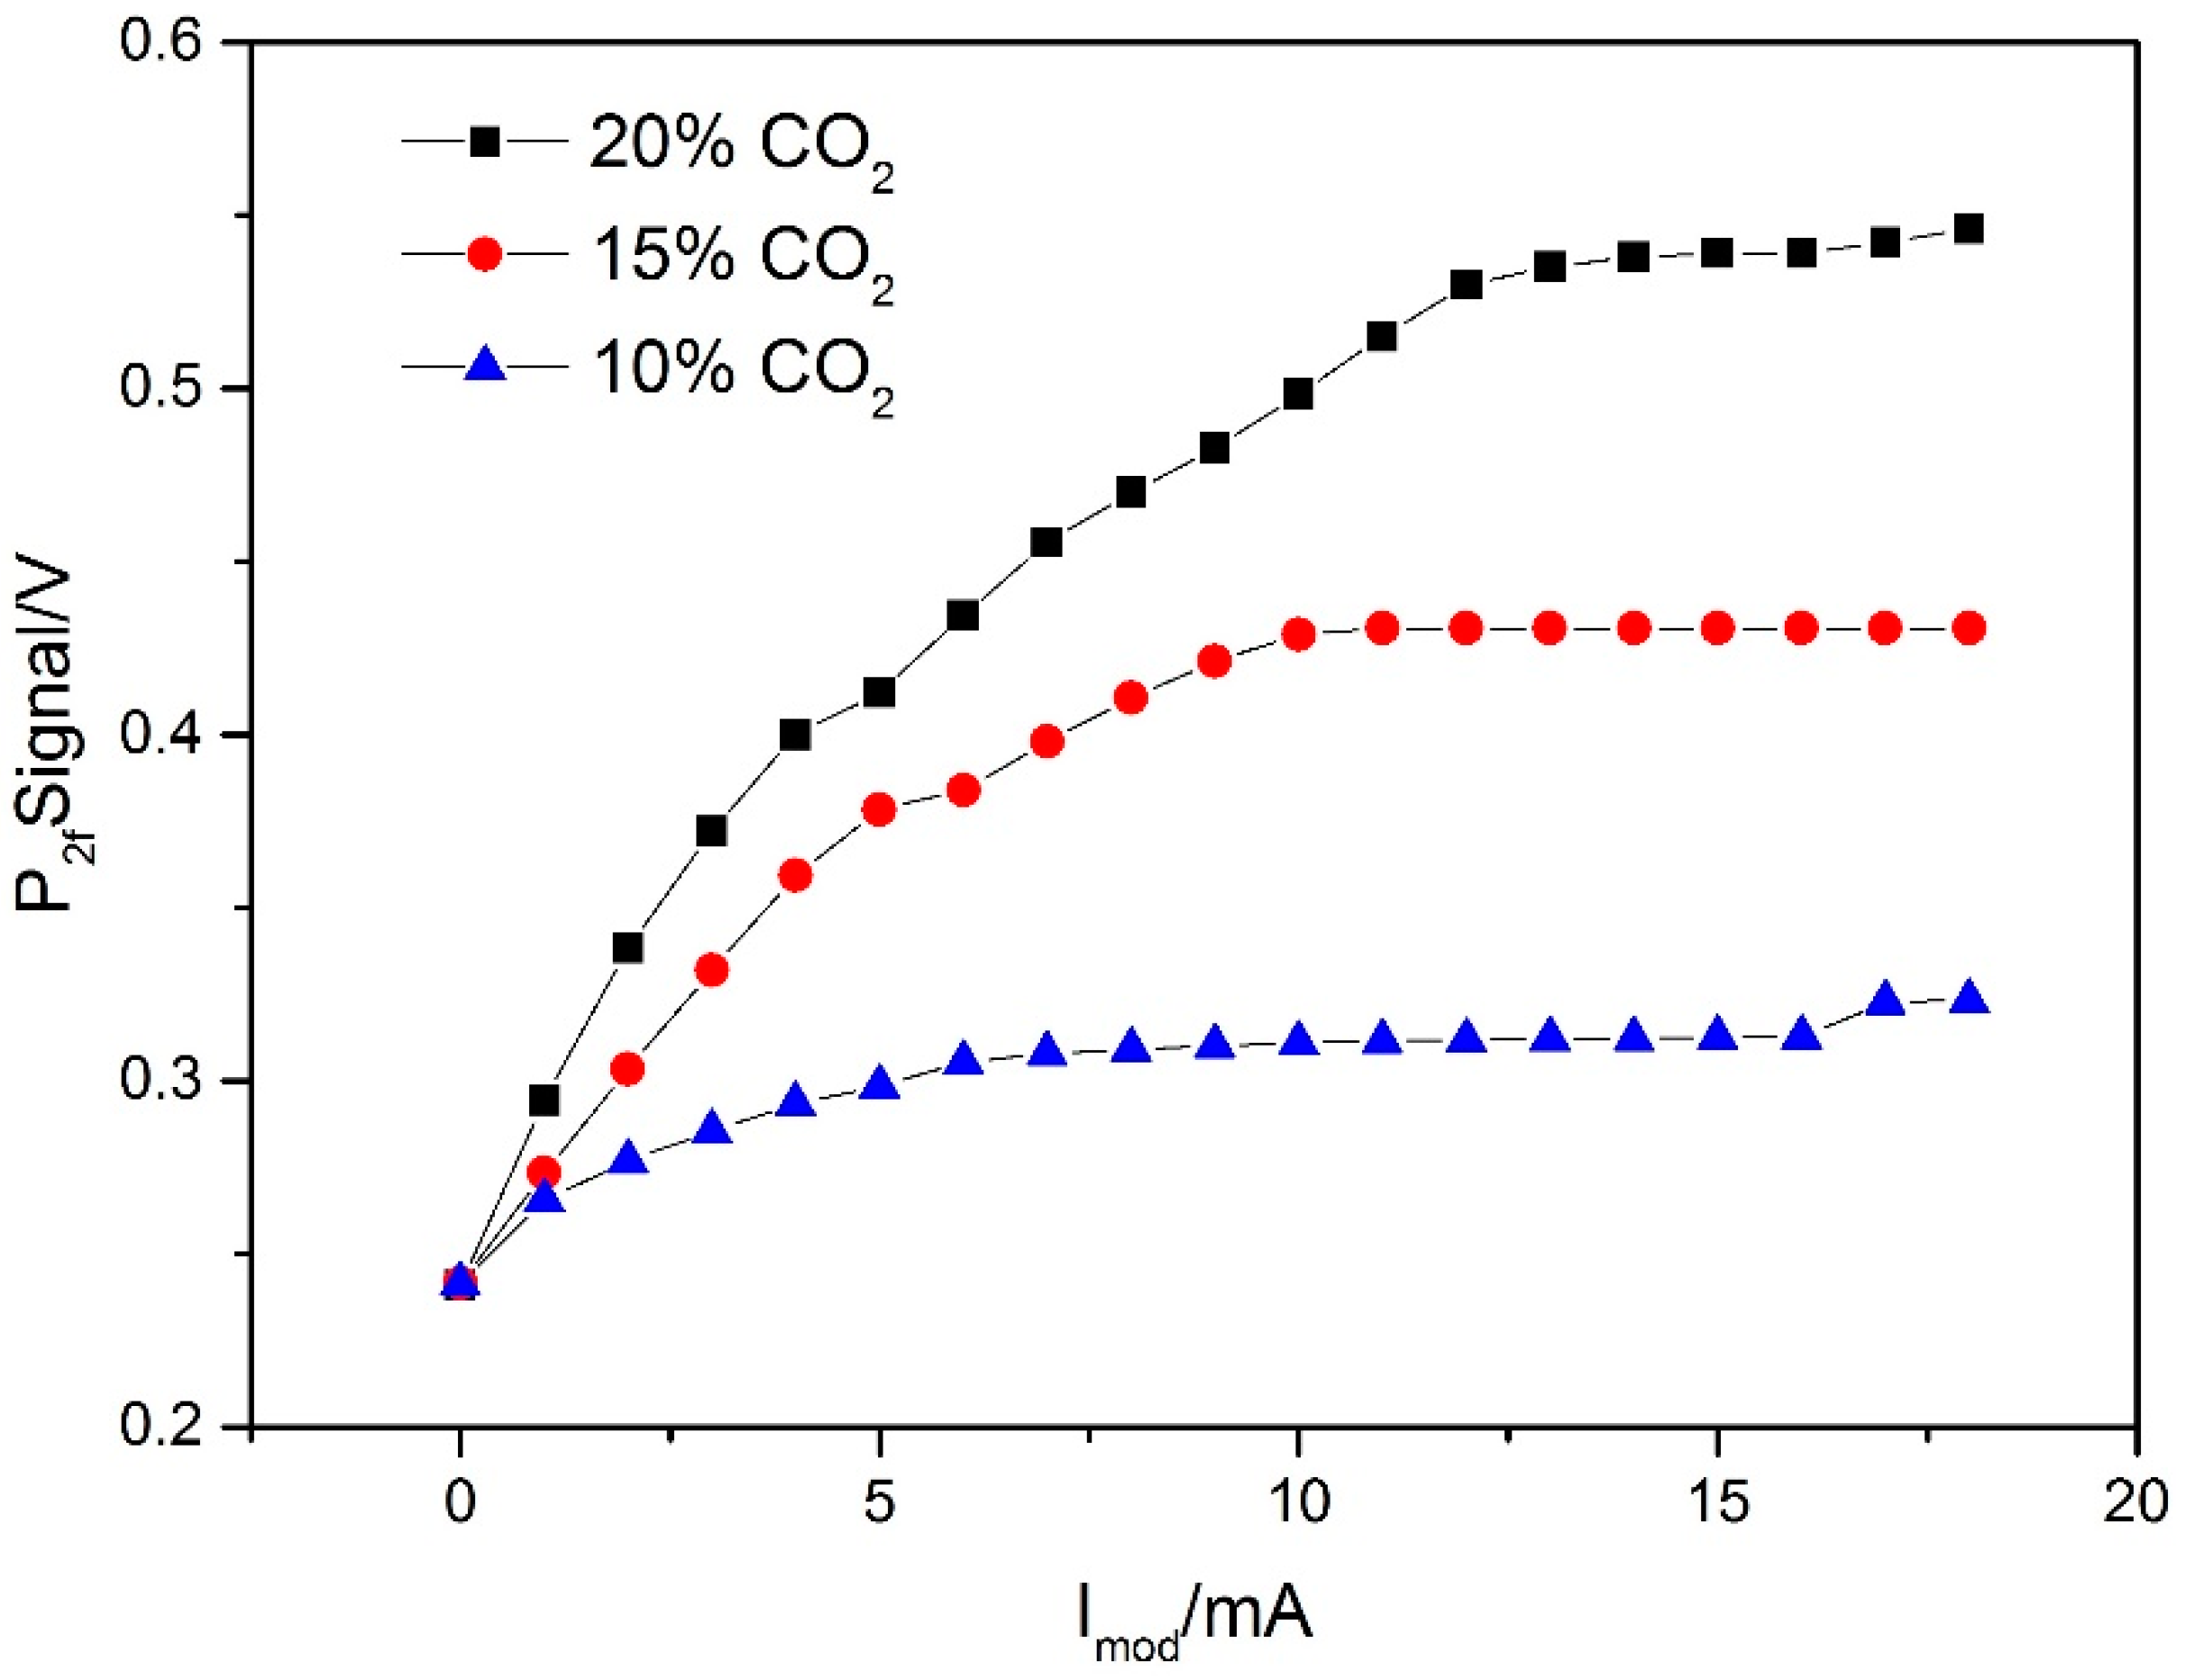
5. WMS-2f Measurement and Correction

Wavelength modulation spectroscopy (WMS) was applied to restrain a variety of background noise during measurement. Due to the low absorption of CO2 in the near-infrared, the second harmonic (2f) signal was directly proportional to concentration [39]. When the optical path and pressure were constant, the WMS-2f peak amplitude was related to gas concentration and the wavelength modulation index m, which is dependent on the modulation current Imod. Therefore, an appropriate choice of Imod was required to improve the detection precision.
The WMS-2f peak signals of CO2 measured at different concentrations (10%–20%, interval 5%) and modulation currents (0 mA–18 mA, interval 1mA) are plotted in Figure 11. These measurements were conducted by controlling the gas flow controller and laser controller to maintain CO2 concentrations and modulation currents. According to the experimental results shown in Figure 11, with the choice of Imod of ~15 mA, the WMS-2f peak signals are stable at all concentrations. Hence, Imod = 15 mA was selected in this study.
In this study, the experimental operation was the same as the direct absorption experiment except a scanning frequency of 50 Hz and modulation frequency of 31.2 KHz were used. There was sufficient time to stabilize the second harmonic peak before the second harmonic data were recorded. Because the shape of the harmonic signal was affected by optical fringe noise and beam noise, the multi-sampling average (40 times) were used to eliminate the negative influences. Gas concentrations and peaks of second harmonic signals show good linear relationships at 298–338 K by employing the mean filtering process. The relationships can be expressed as the fitting of X = a·P2f + b, as Equation (10), which was obtained by the linear least squares method, and P2f was the peak of the second harmonic (V), and X was gas concentration (%). The R squared value for linear fitting was >0.99 and the system reproducibility was tested after 60 min of continuous monitoring. In consideration of the temperature effect on line intensity and linewidth, the compensation method can be used to improve the accuracy of measurements. Following Equation (11), the linear relations between signals of P2f·Δνc/S(T) and corresponding concentrations were worked out by the least squares method. The averaged fitting R squared was improved up to 0.997, as shown in Figure 12. The peaks of WMS-2f signals at 6332.7 cm1 were plotted as a function of CO2 concentration (linear fit equation: y = 0.4114 − 0.0167x, T = 318 K). The results are shown in Table 3 and Table 4. Compared with the results without correction, the averaged relative error decreased by 0.24% and the total R squared value increased by 0.28%.
Figure 13 merges the inferred concentration values of all measurements at temperature 298–338 K and concentration 10–20%. The error bars represent the repeatability of three repeated experiments by SD. After compensation, the normal repeatability of CO2 values of DA and WMS were 5.55% and 1.79% at a SD (1σ). The mean relative error, which was caused by the uncertainties of temperature, pressure, and absorption length measurements, decreased from 3.06% to 1.17%. For the wavelength modulation, the mean relative errors were 1.44% and 1.20%, before and after compensation respectively. The relative standard deviation (RSD) for DA and WMS were 0.42% and 0.31%, while the maximum relative errors and detection limits (SNR = 1) for DA and WMS were 2.7% and 2.85%, 0.0084% and 0.0017%. It should be noted that the experiment in this study examined only high CO2 concentrations of 10–20%. As can be seen from the data, the effect on the direct absorption method was more outstanding.

6. Summary and Conclusions

Temperature compensations of CO2 concentration measurements using TDLAS were reported. Absorption spectra at different temperatures were derived from HITRAN to find suitable transitions for in situ CO2 measurements and recorded using DA and WMS. The temperature compensations based on temperature influence of line intensity were then applied to reduce measurement errors. Our experimental results show that there was an obvious decrease in the influence of temperature on signals after temperature compensation, and the detection limits of both methods meet the needs of the in situ CO2 measurement. However, compared with WMS, DA is less sensitive to fluctuations of temperature and pressure, resulting in a superior long-term stability. The DA measurement based on temperature compensation has enough accuracy to be used for reliable determination of high concentration CO2 in power plant exhausts.

Author Contributions

Conceptualization, X.Z. and S.Y.; Methodology, X.Z. and Z.L. (Zhenghui Li); Investigation, X.Z.; Writing—Original Draft Preparation, X.Z.; Writing—Review & Editing, W.R. and Z.L. (Zhimin Lu); Funding Acquisition, S.Y.

Funding

This research was funded by the Guangdong Province Train High-Level Personnel Special Support Program, grant number 2014TQ01N334, and the Guangdong Province Key Laboratory of Efficient and Clean Energy Utilization, grant number 2013A061401005.

Acknowledgments

The authors would like to thank the Guangdong Province Train High-Level Personnel Special Support Program (2014TQ01N334) and the Guangdong Province Key Laboratory of Efficient and Clean Energy Utilization (2013A061401005), South China University of Technology.

Conflicts of Interest

The authors declare no conflict of interest.

References

  1. Eng, R.S.; Butler, J.F.; Linden, K.J. Tunable diode laser spectroscopy—An invited review. Opt. Eng. 1980, 19, 945–960. [Google Scholar] [CrossRef]
  2. Werle, P. A review of recent advances in semiconductor laser based gas monitors. Spectrochim. Acta Part A Mol. Biomol. Spectrosc. 1998, 54, 197–236. [Google Scholar] [CrossRef]
  3. Nwaboh, J.A.; Werhahn, O.; Ortwein, P.; Schiel, D.; Ebert, V. Laser-spectrometric gas analysis: CO2-TDLAS at 2 µm. Meas. Sci. Technol. 2012, 24, 015202. [Google Scholar] [CrossRef]
  4. Wang, F.; Cen, K.F.; Li, N.; Jeffries, J.; Huang, Q.X.; Yan, J.H.; Chi, Y. Two-dimensional tomography for gas concentration and temperature distributions based on tunable diode laser absorption spectroscopy. Meas. Sci. Technol. 2010, 21, 045301. [Google Scholar] [CrossRef]
  5. Farooq, A.; Jeffries, J.B.; Hanson, R.K. CO2 concentration and temperature sensor for combustion gases using diode-laser absorption near 2.7 μm. Appl. Phys. B 2008, 90, 619–628. [Google Scholar] [CrossRef]
  6. Kamimoto, T.; Deguchi, Y.; Shisawa, Y.; Kitauchi, Y.; Eto, Y. Development of fuel composition measurement technology using laser diagnostics. Appl. Therm. Eng. 2016, 102, 596–603. [Google Scholar] [CrossRef]
  7. Wang, F.; Wu, Q.; Huang, Q.; Zhang, H.; Yan, J.; Cen, K. Simultaneous measurement of 2-dimensional H2O concentration and temperature distribution in premixed methane/air flame using TDLAS-based tomography technology. Opt. Commun. 2015, 346, 53–63. [Google Scholar] [CrossRef]
  8. Liu, C.; Cao, Z.; Li, F.; Lin, Y.; Xu, L. Flame monitoring of a model swirl injector using 1D tunable diode laser absorption spectroscopy tomography. Meas. Sci. Technol. 2017. [Google Scholar] [CrossRef]
  9. Li, J.S.; Durry, G.; Cousin, J.; Joly, L.; Parvitte, B.; Zeninari, V. Self-broadening coefficients and positions of acetylene around 1.533 μm studied by high-resolution diode laser absorption spectrometry. J. Quant. Spectrosc. Radiat. Transf. 2010, 111, 2332–2340. [Google Scholar] [CrossRef]
  10. Wen, X.F.; Lee, X.; Sun, X.M.; Wang, J.L.; Hu, Z.M.; Li, S.G.; Yu, G.R. Dew water isotopic ratios and their relationships to ecosystem water pools and fluxes in a cropland and a grassland in China. Oecologia 2012, 168, 549–561. [Google Scholar] [CrossRef]
  11. Durry, G.; Li, J.S.; Vinogradov, I.; Titov, A.; Joly, L.; Cousin, J.; Decarpenterie, T.; Amarouche, N.; Liu, X.; Parvitte, B.; et al. Near infrared diode laser spectroscopy of C2H2, H2O, CO2, and their isotopologues and the application to TDLAS, a tunable diode laser spectrometer for the martian PHOBOS-GRUNT space mission. Appl. Phys. B 2010, 99, 339–351. [Google Scholar] [CrossRef]
  12. Barbu, T.L.; Zéninari, V.; Parvitte, B.; Courtoisa, D.; Durrya, G. Line strengths and self-broadening coefficients of carbon dioxide isotopologues (13CO2, and 18O12C16O) near 2.04 μm for the in situ laser sensing of the Martian atmosphere. J. Quant. Spectrosc. Radiat. Transf. 2006, 98, 264–276. [Google Scholar] [CrossRef]
  13. Barbu, T.L.; Vinogradov, I.; Durry, G.; Korablev, O.; Chassefière, E.; Bertaux, J.-L. TDLAS a laser diode sensor for the in situ monitoring of H2O, CO2, and their isotopes in the Martian atmosphere. Adv. Space Res. 2006, 38, 718–725. [Google Scholar] [CrossRef]
  14. Li, J.; Parchatka, U.; Fischer, H. Applications of wavelet transform to quantum cascade laser spectrometer for atmospheric trace gas measurements. Appl. Phys. B 2012, 108, 951–963. [Google Scholar] [CrossRef]
  15. Pogãn, A.; Wagner, S.; Werhahn, O.; Eberta, V. Development and metrological characterization of a tunable diode laser absorption spectroscopy (TDLAS) spectrometer for simultaneous absolute measurement of carbon dioxide and water vapor. Appl. Spectrosc. 2015, 69, 257–268. [Google Scholar] [CrossRef] [PubMed]
  16. Tadic, I.; Parchatka, U.; Königstedt, R.; Fischer, H. In-flight stability of quantum cascade laser-based infrared absorption spectroscopy measurements of atmospheric carbon monoxide. Appl. Phys. B 2017, 123, 146. [Google Scholar] [CrossRef]
  17. Underwood, R.; Gardiner, T.; Finlayson, A.; Few, J.; Wilkinson, J.; Bell, S.; Merrison, J.; Iversonb, J.J.; de Podesta, M. A combined non-contact acoustic thermometer and infrared hygrometer for atmospheric measurements. Meteorol. Appl. 2016, 22, 830–835. [Google Scholar] [CrossRef]
  18. Nwaboh, J.A.; Qu, Z.; Werhahn, O.; Ebert, V. Interband cascade laser-based optical transfer standard for atmospheric carbon monoxide measurements. Appl. Opt. 2017, 56, E84–E93. [Google Scholar] [CrossRef]
  19. Zhou, X.; Liu, X.; Jeffries, J.B.; Hanson, R.K. Development of a sensor for temperature and water concentration in combustion gases using a single tunable diode laser. Meas. Sci. Technol. 2003, 14, 1459–1468. [Google Scholar] [CrossRef]
  20. Phillips, W.J.; Plemmons, D.H.; Galyen, N.A. HITRAN/HITEMP Spectral Databases and Uncertainty Propagation by Means of Monte Carlo Simulation with Application to Tunable Diode Laser Absorption Diagnostics; No. AEDC-TR-11-T-2; Office of the Deputy Undersecretary of Defense (Science and Technology) Washington DC Joint Technology Office on Hypersonic: Washington, DC, USA, 2011; pp. 15–17.
  21. Chen, J.; Li, C.; Zhou, M.; Liu, J.; Kan, R.; Xu, Z. Measurement of CO2, concentration at high-temperature based on tunable diode laser absorption spectroscopy. Infrared Phys. Technol. 2017, 80, 131–137. [Google Scholar] [CrossRef]
  22. Joly, L.; Gibert, F.; Grouiez, B.; Grossela, A.; Parvittea, B.; Durry, G.; Ze´ninari, V. A complete study of CO2, line parameters around 4845 cm−1, for Lidar applications. J. Quant. Spectrosc. Radiat. Transf. 2008, 109, 426–434. [Google Scholar] [CrossRef]
  23. Pogány, A.; Ott, O.; Werhahn, O.; Ebert, V. Towards traceability in CO2, line strength measurements by TDLAS at 2.7 µm. J. Quant. Spectrosc. Radiat. Transf. 2013, 130, 147–157. [Google Scholar]
  24. Cai, T.; Gao, G.; Wang, M.; Wang, G.; Liu, Y.; Gao, X. Experimental study of carbon dioxide spectroscopic parameters around 2.0 µm region for combustion diagnostic applications. J. Quant. Spectrosc. Radiat. Transf. 2017, 201, 136–147. [Google Scholar] [CrossRef]
  25. Sur, R.; Spearrin, R.M.; Peng, W.Y.; Strand, C.L.; Jeffries, J.B.; Enns, G.M.; Hanson, R.K. Line intensities and temperature-dependent line broadening coefficients of Q-branch transitions in the v2 band of ammonia near 10.4 μm. J. Quant. Spectrosc. Radiat. Transf. 2016, 175, 90–99. [Google Scholar] [CrossRef] [PubMed]
  26. Doucen, R.L.; Cousin, C.; Boulet, C.; Henry, A. Temperature dependence of the absorption in the region beyond the 4.3-micron band head of CO2. I—Pure CO2 case. Appl. Opt. 1985, 24, 3899–3907. [Google Scholar] [CrossRef] [PubMed]
  27. Cousin, C.; Doucen, R.L.; Boulet, C.; Henry, A. Temperature dependence of the absorption in the region beyond the 4.3-µm band head of CO2. 2: N2 and O2 broadening. Appl. Opt. 1985, 24, 3899–3907. [Google Scholar] [CrossRef] [PubMed]
  28. Perrin, M.Y.; Hartmann, J.M. Temperature-dependent measurements and modeling of absorption by CO2-N2 mixtures in the far line-wings of the 4.3 um CO2 band. J. Quant. Spectrosc. Radiat. Transf. 1989, 42, 311–317. [Google Scholar] [CrossRef]
  29. Zhang, Z.R.; Wu, B.; Xia, H.; Pang, T.; Wang, G.X.; Sun, P.S.; Dong, F.Z.; Wang, Y. Study on the temperature modified method for monitoring gas concentrations with tunable diode laser absorption spectroscopy. Acta Phys. Sin. 2013, 62, 1706–1721. [Google Scholar]
  30. Shu, X.W. An Investigation of Temperature Compensation of HCL Gas Online Monitoring Based on TDLAS Method. Spectrosc. Spectr. Anal. 2010, 30, 1352–1356. [Google Scholar]
  31. Zhang, Z.; Zou, D.; Chen, W.; Zhao, H.J.; Xu, K.X. Temperature influence in the TDLAS detection of escaping ammonia. Opto-Electron. Eng. 2014. [Google Scholar] [CrossRef]
  32. Qi, R.B.; He, S.K.; Li, X.T.; Wang, X.Z. Simulation of TDLAS direct absorption based on HITRAN database. Spectrosc. Spectr. Anal. 2015, 35, 172–177. [Google Scholar]
  33. He, Y.; Zhang, Y.J.; You, K.; Gao, Y.W.; Zhao, N.J.; Liu, W.Q. Volatilization characteristics analysis of ammonia from soil by straw returning to the field based on the infrared spectroscopy technology. J. Infrared Millim. Waves 2017, 36, 397–402. [Google Scholar]
  34. Liu, C.; Xu, L.; Cao, Z. Measurement of no uniform temperature and concentration distributions by combining line-of-sight tunable diode laser absorption spectroscopy with regularization methods. Appl. Opt. 2013, 52, 4827–4842. [Google Scholar] [CrossRef] [PubMed]
  35. You, K.; Zhang, Y.J.; Wang, L.M.; Li, H.B.; He, Y. Improving the Stability of Tunable Diode Laser Sensor for Natural Gas Leakage Monitoring. Adv. Mater. Res. 2013, 760–762, 84–87. [Google Scholar] [CrossRef]
  36. Yao, C.; Wang, Z.; Wang, Q.; Bian, Y.; Chen, C.; Zhang, L.; Ren, W. Interband cascade laser absorption sensor for real-time monitoring of formaldehyde filtration by a nanofiber membrane. Appl. Opt. 2018, 57, 8005–8010. [Google Scholar] [CrossRef] [PubMed]
  37. Gharavi, M. Quantification of near-IR tunable diode laser measurements in flames. In Proceedings of the 2nd Joint Meeting of the US Sections of the Combustion Institute, Oakland, CA, USA, 25–28 March 2001. [Google Scholar]
  38. Gordon, I.E.; Rothmana, L.S.; Hill, C.; Kochanovac, R.V.; Tan, Y.; Bernath, P.F.; Birk, M.; Boudon, V.; Campargue, A.; Chance, K.V.; et al. The HITRAN2016 molecular spectroscopic database. J. Quant. Spectrosc. Radiat. Transf. 2017, 203, 3–69. [Google Scholar] [CrossRef]
  39. Liu, J.T.; Jeffries, J.B.; Hanson, R.K. Large-modulation-depth 2f spectroscopy with diode lasers for rapid temperature and species measurements in gases with blended and broadened spectra. Appl. Opt. 2004, 43, 6500–6509. [Google Scholar] [CrossRef]
Figure 1. Simulated absorbance of CO2 (10%), CO (0.001%), and H2O (0.8%) from 6330–6335.5 cm−1 based on the HITRAN (High Resolution Transmission) database (298 K, 1 atm).
Applsci 09 00442 g001
Figure 2. Schematic diagram of the experimental setup.
Applsci 09 00442 g002
Figure 3. (a) Measured and (b) simulated absorbance of CO2 at 296 K and 1 atm.
Applsci 09 00442 g003
Figure 4. Direct absorption signals It and baseline signal I0 (T = 318 K, 10% CO2, L = 20 m).
Applsci 09 00442 g004
Figure 5. Absorption spectra of 16% CO2 in the 6331.8 to 6333.6 cm−1 spectral region at T = 298–338 K.
Applsci 09 00442 g005
Figure 6. Measured CO2 spectrum near 6332.7 cm−1 with Lorentz fitting (P = 1 atm, T = 338 K, 18% CO2).
Applsci 09 00442 g006
Figure 7. Integrated absorbance as a function of P·X·L (T = 298–338 K, P = 1 atm).
Applsci 09 00442 g007
Figure 8. Integrated absorbance and spectral intensity with temperature change (14% CO2).
Applsci 09 00442 g008
Figure 9. A linear fit between A/S(T) and concentration at T = 318 K.
Applsci 09 00442 g009
Figure 10. Absolute value of the relative error changes with concentration and temperature. (a) Before and (b) after compensation.
Applsci 09 00442 g010
Figure 11. WMS (Wavelength modulation spectroscopy)-2f peak signals as a function of the laser modulation current Imod at different concentrations of CO2.
Applsci 09 00442 g011
Figure 12. A linear fit of between P2f·Δνc/S(T) and concentration at different temperatures (298–338 K).
Applsci 09 00442 g012
Figure 13. Measured concentration of all four measurements at temperatures 298–338 K and concentrations 10–20%.
Applsci 09 00442 g013
Table 1. The relative errors of direct absorption results from 298 to 338 K.
True ConcentrationInferred Concentration
298 K308 K318 K328 K338 K
10%0.30%5.66%1.33%2.51%−2.25%
12%−2.78%−0.58%1.35%−1.24%−2.62%
14%0.28%−0.60%−0.38%−2.88%−3.35%
16%−1.24%0.09%0.65%−4.70%−3.58%
18%3.74%1.52%1.59%1.56%−3.14%
20%−1.21%3.54%0.61%−3.72%−2.83%
Table 2. Line intensity (10−4 cm−2·atm−1) values from database and calculated values.
S(T) 298 K308 K318 K328 K338 K
Database3.89673.81473.73183.64833.5648
Calculated4.06393.93293.88243.50113.2471
Table 3. The relative errors of wavelength modulation results before correction (298–338 K).
True ConcentrationInferred Concentration
298 K308 K318 K328 K338 K
10%−2.86%−3.02%−2.60%−2.62%−2.67%
12%1.49%0.99%0.43%0.46%1.04%
14%0.68%1.64%1.84%1.73%1.31%
16%2.89%1.43%1.15%1.51%1.06%
18%−1.50%0.31%0.54%0.10%0.32%
20%−0.89%−1.64%−1.65%−1.48%−1.35%
Table 4. The relative errors of wavelength modulation results after correction (298–338 K).
True ConcentrationInferred Concentration
298 K308 K318 K328 K338 K
10%−2.30%−2.58%−1.97%−1.94%−2.25%
12%1.52%0.83%0.11%0.02%0.66%
14%−0.16%1.43%1.56%1.27%1.17%
16%2.85%1.13%0.82%1.48%1.14%
18%−1.34%0.23%0.66%0.30%0.25%
20%−0.73%−1.32%−1.41%−1.40%−1.22%

