Article

Development of Low-Cost Fast Photoacoustic Computed Tomography: System Characterization and Phantom Study

1
Department of Biomedical Engineering, Wayne State University, Detroit, MI 48201, USA
2
Department of Neurology, Wayne State University School of Medicine, Detroit, MI 48201, USA
3
Barbara Ann Karmanos Cancer Institute, Detroit, MI 48201, USA
*
Author to whom correspondence should be addressed.
Appl. Sci. 2019, 9(3), 374; https://doi.org/10.3390/app9030374
Submission received: 4 December 2018 / Revised: 8 January 2019 / Accepted: 12 January 2019 / Published: 22 January 2019
(This article belongs to the Special Issue Photoacoustic Tomography (PAT))

Abstract

:
A low-cost Photoacoustic Computed Tomography (PACT) system consisting of 16 single-element transducers has been developed. Our design proposes a fast rotating mechanism of 360° rotation around the imaging target, generating comparable images to those produced by large-number-element (e.g., 512, 1024, etc.) ring-array PACT systems. The 2D images with a temporal resolution of 1.5 s and a spatial resolution of 240 µm were achieved. The performance of the proposed system was evaluated by imaging complex phantom. The purpose of the proposed development is to provide researchers a low-cost alternative 2D photoacoustic computed tomography system with comparable resolution to the current high performance expensive ring-array PACT systems.

1. Introduction

Photoacoustic imaging (PAI) is a promising imaging technique that combines higher imaging contrast of optical imaging with deeper penetration of ultrasonic imaging [1,2,3]. A nanosecond pulsed laser deposits energy onto a light absorbing sample, causing a local temperature increase and subsequent thermal expansion through the thermoacoustic effect [2,4,5,6,7,8]. This expansion causes a localized pressure increase, which propagates from the sample to be imaged, by an ultrasound transducer, similar to a traditional ultrasound detection system. PAI has gained popularity compared to other optical imaging techniques mainly due to its simultaneous great penetration depth and adequate resolution. PAI utilizes the deposition of diffusive photons and therefore can image at much greater depths [9,10] as compared to other high-resolution optical imaging modalities such as optical coherence tomography (OCT) [11,12]; OCT’s portability and high resolution however stand out in relevant applications [13,14]. As opposed to positron emission tomography (PET) and computed tomography (CT) that require the use of ionizing radiation, PAI uses safe, non-ionizing, visible and near-infrared light. Compared to magnetic resonance imaging (MRI) that requires sophisticated, large, and expensive designs, PAI is portable and cost-effective. PAI is capable of both functional and molecular imaging. PAI has proved to have a superior specificity in clinical diagnosis over conventional ultrasound imaging [15,16,17,18]. The wavelength dependence nature of PAI allows imaging of various molecules in biological tissues using endogenous and exogenous contrast agents [19]; e.g., tissue oxygen saturation can be measured using multispectral PAI [20,21,22]. The molecular imaging capability of PAI enables anatomical, and functional imaging of organelles, organs or even whole body of small animals, as well as many applications in human tissue analysis [19,23,24]. These advanced features have allowed PAI to play an important role in small animal imaging though different human diseases can be comprehensively studied. Furthermore, PAI can be integrated with other imaging modalities to generate multi-modality images that provide complementary information of the tissue.
There are two major implementations for PA imaging, i.e., photoacoustic computed tomography (PACT) and photoacoustic microscopy (PAM). PACT is used for deep tissue imaging applications where coarse resolution is acceptable. In PACT, high energy pulsed laser light is diffused to illuminate the entire tissue, which then generates photoacoustic waves. The waves around the tissue are collected by wideband ultrasound transducers, placed in the same plane, at radially symmetric angles, and ideally equidistant from the imaging target [25]. The detection scheme can be realized either by a single ultrasound transducer rotating around the sample, or a stationary ring array of 128, 256, or greater number of transducer elements [7,26,27]. Such configuration offers a fast image acquisition, but requires an expensive hardware and data acquisition unit. Moreover, PACT systems typically utilize bulky nanosecond pulsed laser sources, sometimes with an optical parametric oscillator (OPO). In addition to the light source, a major cost in these systems comes from the transducer arrays.
Some of the PACT systems developed are as follows. A 128-channel curved array PACT system was reported in [28] with 15–30 s rotation time to acquire a 2D image of the sample with a resolution of about 200 µm; rotating the animal for small animal in-vivo imaging is not recommended, also the long acquisition time does not allow imaging the hemodynamic changes (such changes occur with the frame rate of 2.5 Hz in small animals [29]). Gamelin et al. developed a fast, expensive, sophisticated 512-elements full ring PACT system that acquired images in less than one second [30]. The complexity and high cost of such a system prevents most researchers from developing PACT systems of their own. Therefore, strategies of decreasing the cost of PACT are needed. Some researchers have attempted to reduce the cost of ultrasound detection units by using partial view detection with reflectors [31] or using sparse arrays along with a compressed sensing reconstruction algorithm [32].
In [33], a multispectral PACT system was implemented where 8 single element transducers were utilized in an arc fashion. The system took around 30 s to acquire an image. In [25], a PACT system was developed using only two unfocused transducers, and a complete rotation was performed in 3s. In [34], a single element focused transducer-based PACT system was developed for in-vivo rat brain imaging. The total acquisition time was 16 minutes with a scanning step size of 1.5°. In [35], a spherical PACT system was developed to image zebra fish. The scanning step size was 0.75° with 480 scanning positions and 24 s acquisition time for each frame.
In this article, we present the development and characterization of a low-cost, fast PACT system that has been optimized to achieve 1.5 s temporal resolution with a 240 µm spatial resolution. The low number of elements (16) reduces the cost of the ultrasound unit as well as the need for an expensive DAQ. To reduce the cost of illumination, a Q-switched Nd:YAG laser was used. This comparatively lower-cost system provides fast, high-resolution images to potentially be used for small animal imaging. The performance of the system has been evaluated by imaging complex phantoms.

2. Materials and Methods

Figure 1 illustrates an experimental set up and architecture of our low-cost photoacoustic tomography system. A Q-switched Nd:YAG laser (NL231-50-SH, EKSPLA, Vilnius, Lithuania) with a pulse width of ~5 ns and pulse repetition rate of 50 Hz was used. The laser produces 532 nm and 1064 nm wavelengths.
The laser is coupled with 10mm diameter plastic PMMA optical fiber (epef-10, Ever Heng Optical Co., Shenzhen, China), for illumination of the imaging target. Output laser energy is ~32 mJ/cm2; recorded using an energy meter (QE12SP-H-MT-D0, Gentec-EO, Quebec, QC, Canada). Considering the distance between the optical fiber and the sample, as well as divergence of light, we calculated the light energy onto the sample, ~19.1 mJ/cm2, below the ANSI limit. The optical fiber is held in place by optical rods and positioned at the center of the scanner (circular ring) to illuminate the target with maximum uniformity. The energy loss in the optical fiber was ~30%.
The ultrasound detection unit consists of 16 single element 5 MHz ultrasound transducers (ISL-0504-GP, Technisonic Research Inc., Fairfield, CT, USA), inserted and fitted along the circumference of the circular ring made up of Polyactic Acid (PLA) plastic (15 cm diameter). These transducers are radially separated at 22.5° from one another as depicted in Figure 1. The object is separated from the water tank using a transparent saran wrap and the tank is filled with distilled water for ultrasound coupling as shown in Figure 2.
PA signals acquired from each transducer are amplified using a low-noise 24 dB amplifiers (ZFL-500LN, Mini-Circuits, Brooklyn, NY, USA). The amplified signals are then fed into a 16 channel DAQ (NI PXIe -1078, National Instruments, Austin, TX, USA). The NI system is equipped with two 14-bit, 8 channel data acquisition cards (NI PXIe-5170R, National Instruments, Austin, TX, USA). The data acquisition is synchronized by an internally generated trigger from the laser. The sampling rate is set to 50 MS/s. The number of samples in each PA signal acquired is 6000. Based on the pulse repetition rate of the laser and the number of channels, 1200 view angles are scanned in only 1.5 s; this data is then used for image reconstruction.
The ring is coupled to a servo motor (J0400-301-4-000, Applied Motion Products Inc., Watsonville, CA, USA) through mechanical gears (KHK SS1-200, KHK USA Inc., Mineola, NY, USA) for rotation of the system as shown in Figure 1c. Two meshed gears are used to rotate the circular ring. The small gear is mounted on a shaft that is directly connected to the servo motor and the large gear is mounted on a ball bearing with the same diameter of the circular ring to reduce friction and hence, increase the rotational speed. The small gear was chosen with higher pitch as compared to the large gear, further increasing rotational speed. With the objective of developing a fast scanning method, the gear system parameters were determined based on the weight of the system, moment of inertia, and holding torque of the motor as explained below.
For speed optimization, gear ratio was determined based on the ratio of the required torque to motor torque. The required torque was calculated based on the moment of inertia and angular motion that has an input criterion of 22.5° rotation per second. The moment of inertia, I, was calculated to be 0.0197 kg·m2 using total mass and internal radius of the ring. If the motor rotates 22.5° in 1.5 s, then the angular rotation per minute, α, would be 24 and hence, the required torque, Treqd, is 0.4728 N-m. According to the motor specification, motor torque, Tmotor, is 0.056 N·m. Therefore, the gear ratio, ηg is rounded up to 9. Mass of water inside the ring is calculated considering a density of 1000 kg/m3. Other structural parameters of the circular ring are provided in Table 1.
The motor rotates 22.5° in 1.5 s. The data acquisition and motor rotation are synchronized using a LabView code. Based on the laser repetition rate, 75 view angles are defined within the 22.5°. The size of the acquired data is 1200 × 16 bits.
For reconstruction, we used filtered back projection algorithm [36,37,38]. The algorithm requires the scanning radius as an input. Unlike a commercial ring array, where the transducers have been perfectly manufactured to be equidistant from the center of the ring, in the proposed system, the transducers are not equidistant from the center due to the manual insertion of the transducers into the holes on the ring; i.e., if 7.5 cm is used as the radius of the ring for all the channels, the reconstruction will be imperfect and lead to a distorted image. In fact, there is a shift in the expected location of the PA signals coming from the imaging target. Therefore, the calibration method is required. The original values of radius are within 7.58–7.68 mm (please see Table 2). An easy fix will be to change the scanning radius until an image with adequate quality is obtained. This method, is however, time consuming and somewhat inefficient.
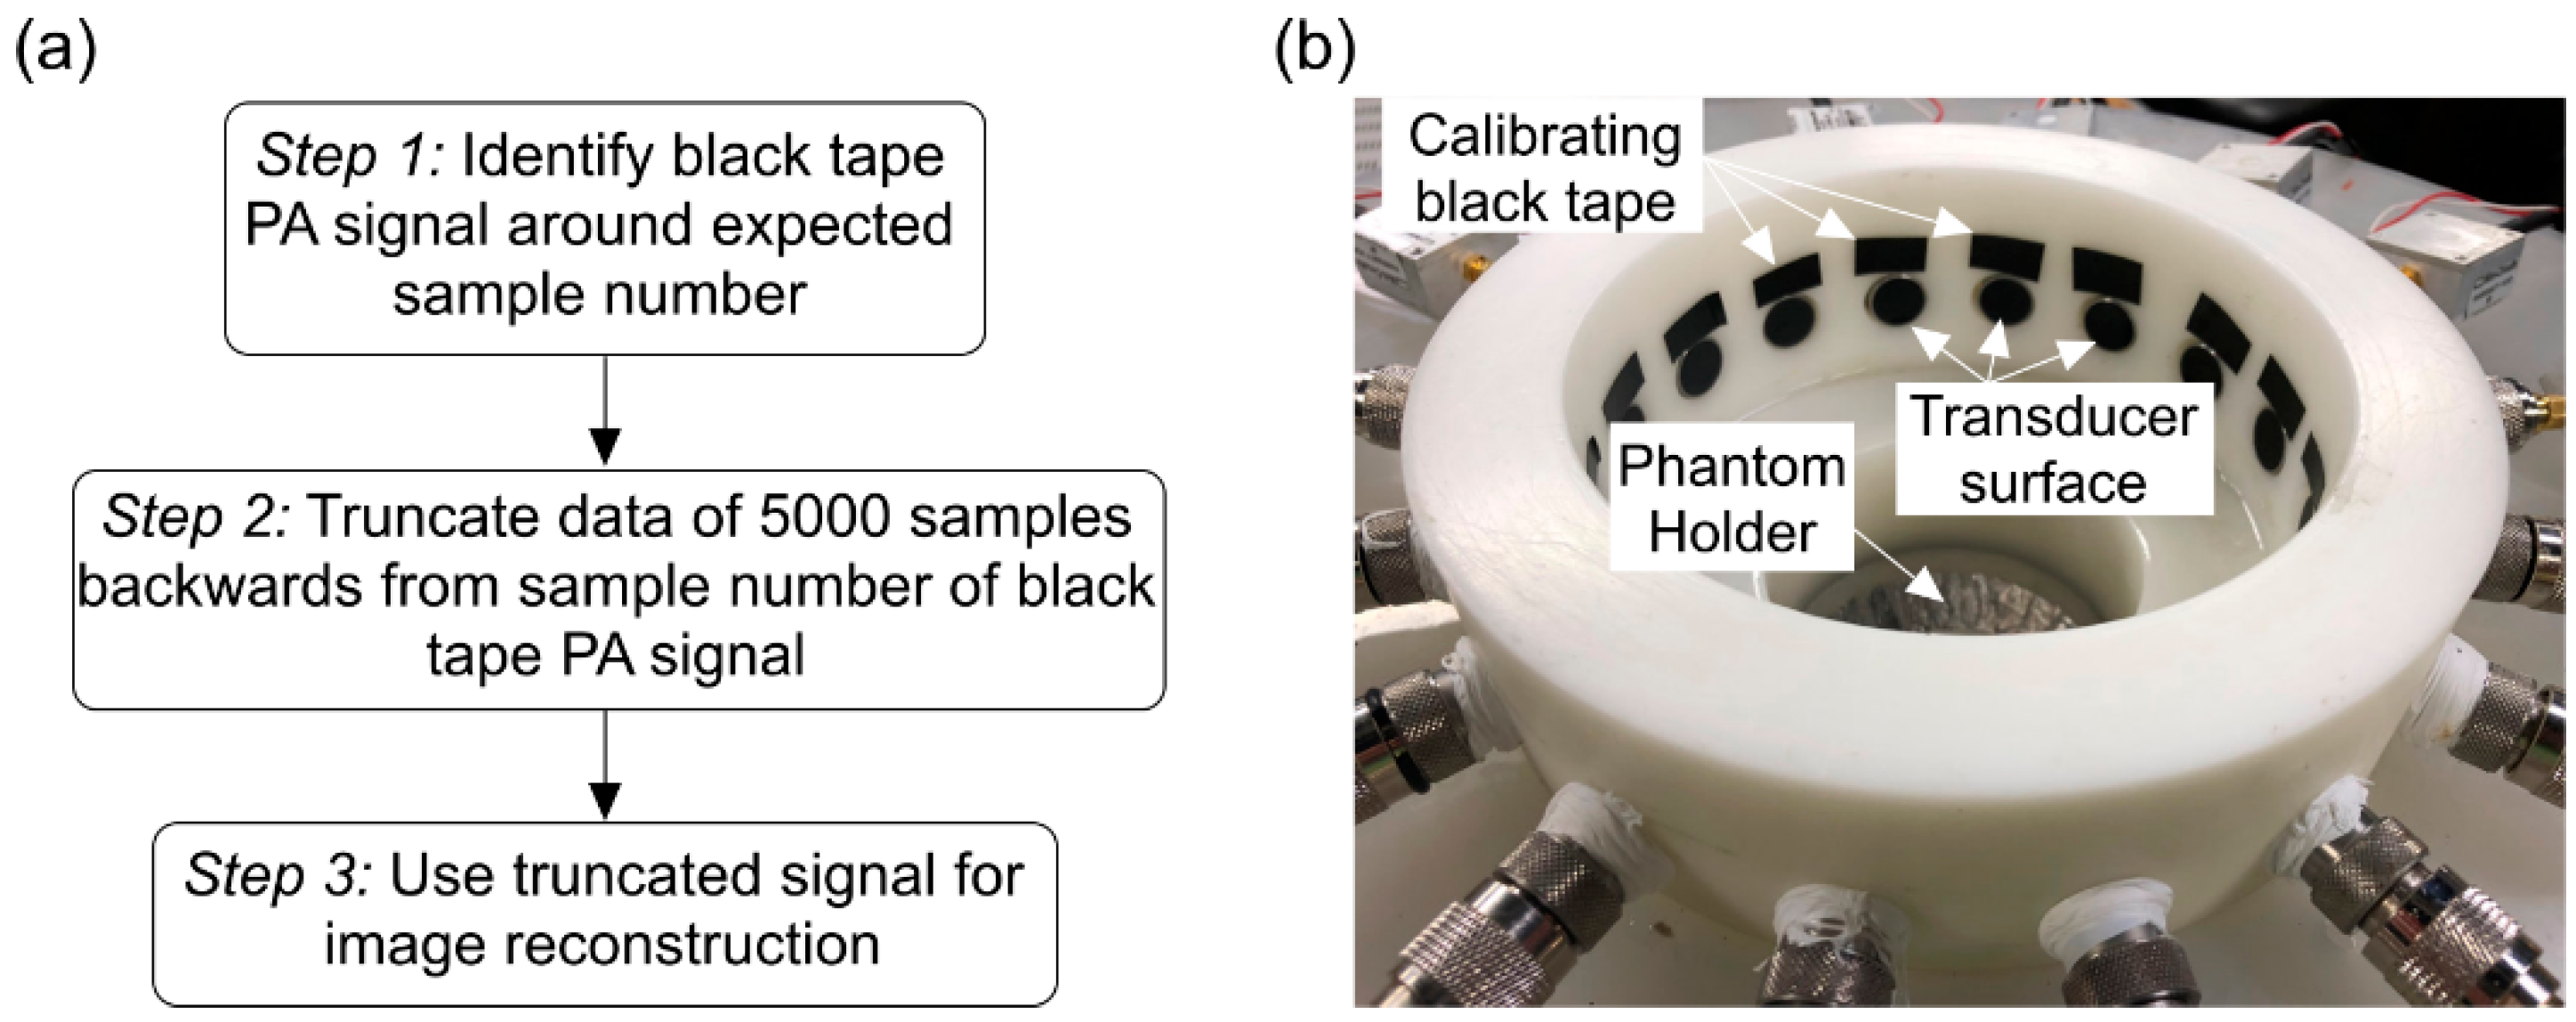
To address this issue and ensure all the transducers are equidistant from the center of the circular ring, a data correction algorithm is used. The flowchart of the correction methodology is provided in Figure 2a. In this method, we image high optical energy absorbent (trimmed homogenous black tape strips made of vinyl). A small piece of black tape is attached on the inner wall of the ring above each of the 16 transducers as shown in Figure 2. While imaging, the output laser from the optical fiber had sufficient energy to produce a distinguishable PA signal from the black tape for calibration. The PA signals generated from the black tape and imaging target do not overlap because they are spatially apart. Each transducer detects a PA signal from the tape that is located 180 degrees away from the transducer. The diameter of the ring, the distance between tape and the opposite transducer, is 15 cm. As a result, the PA signal generated from the tape is supposed to occur at the sample number corresponding to such distance, for all 16 channels.
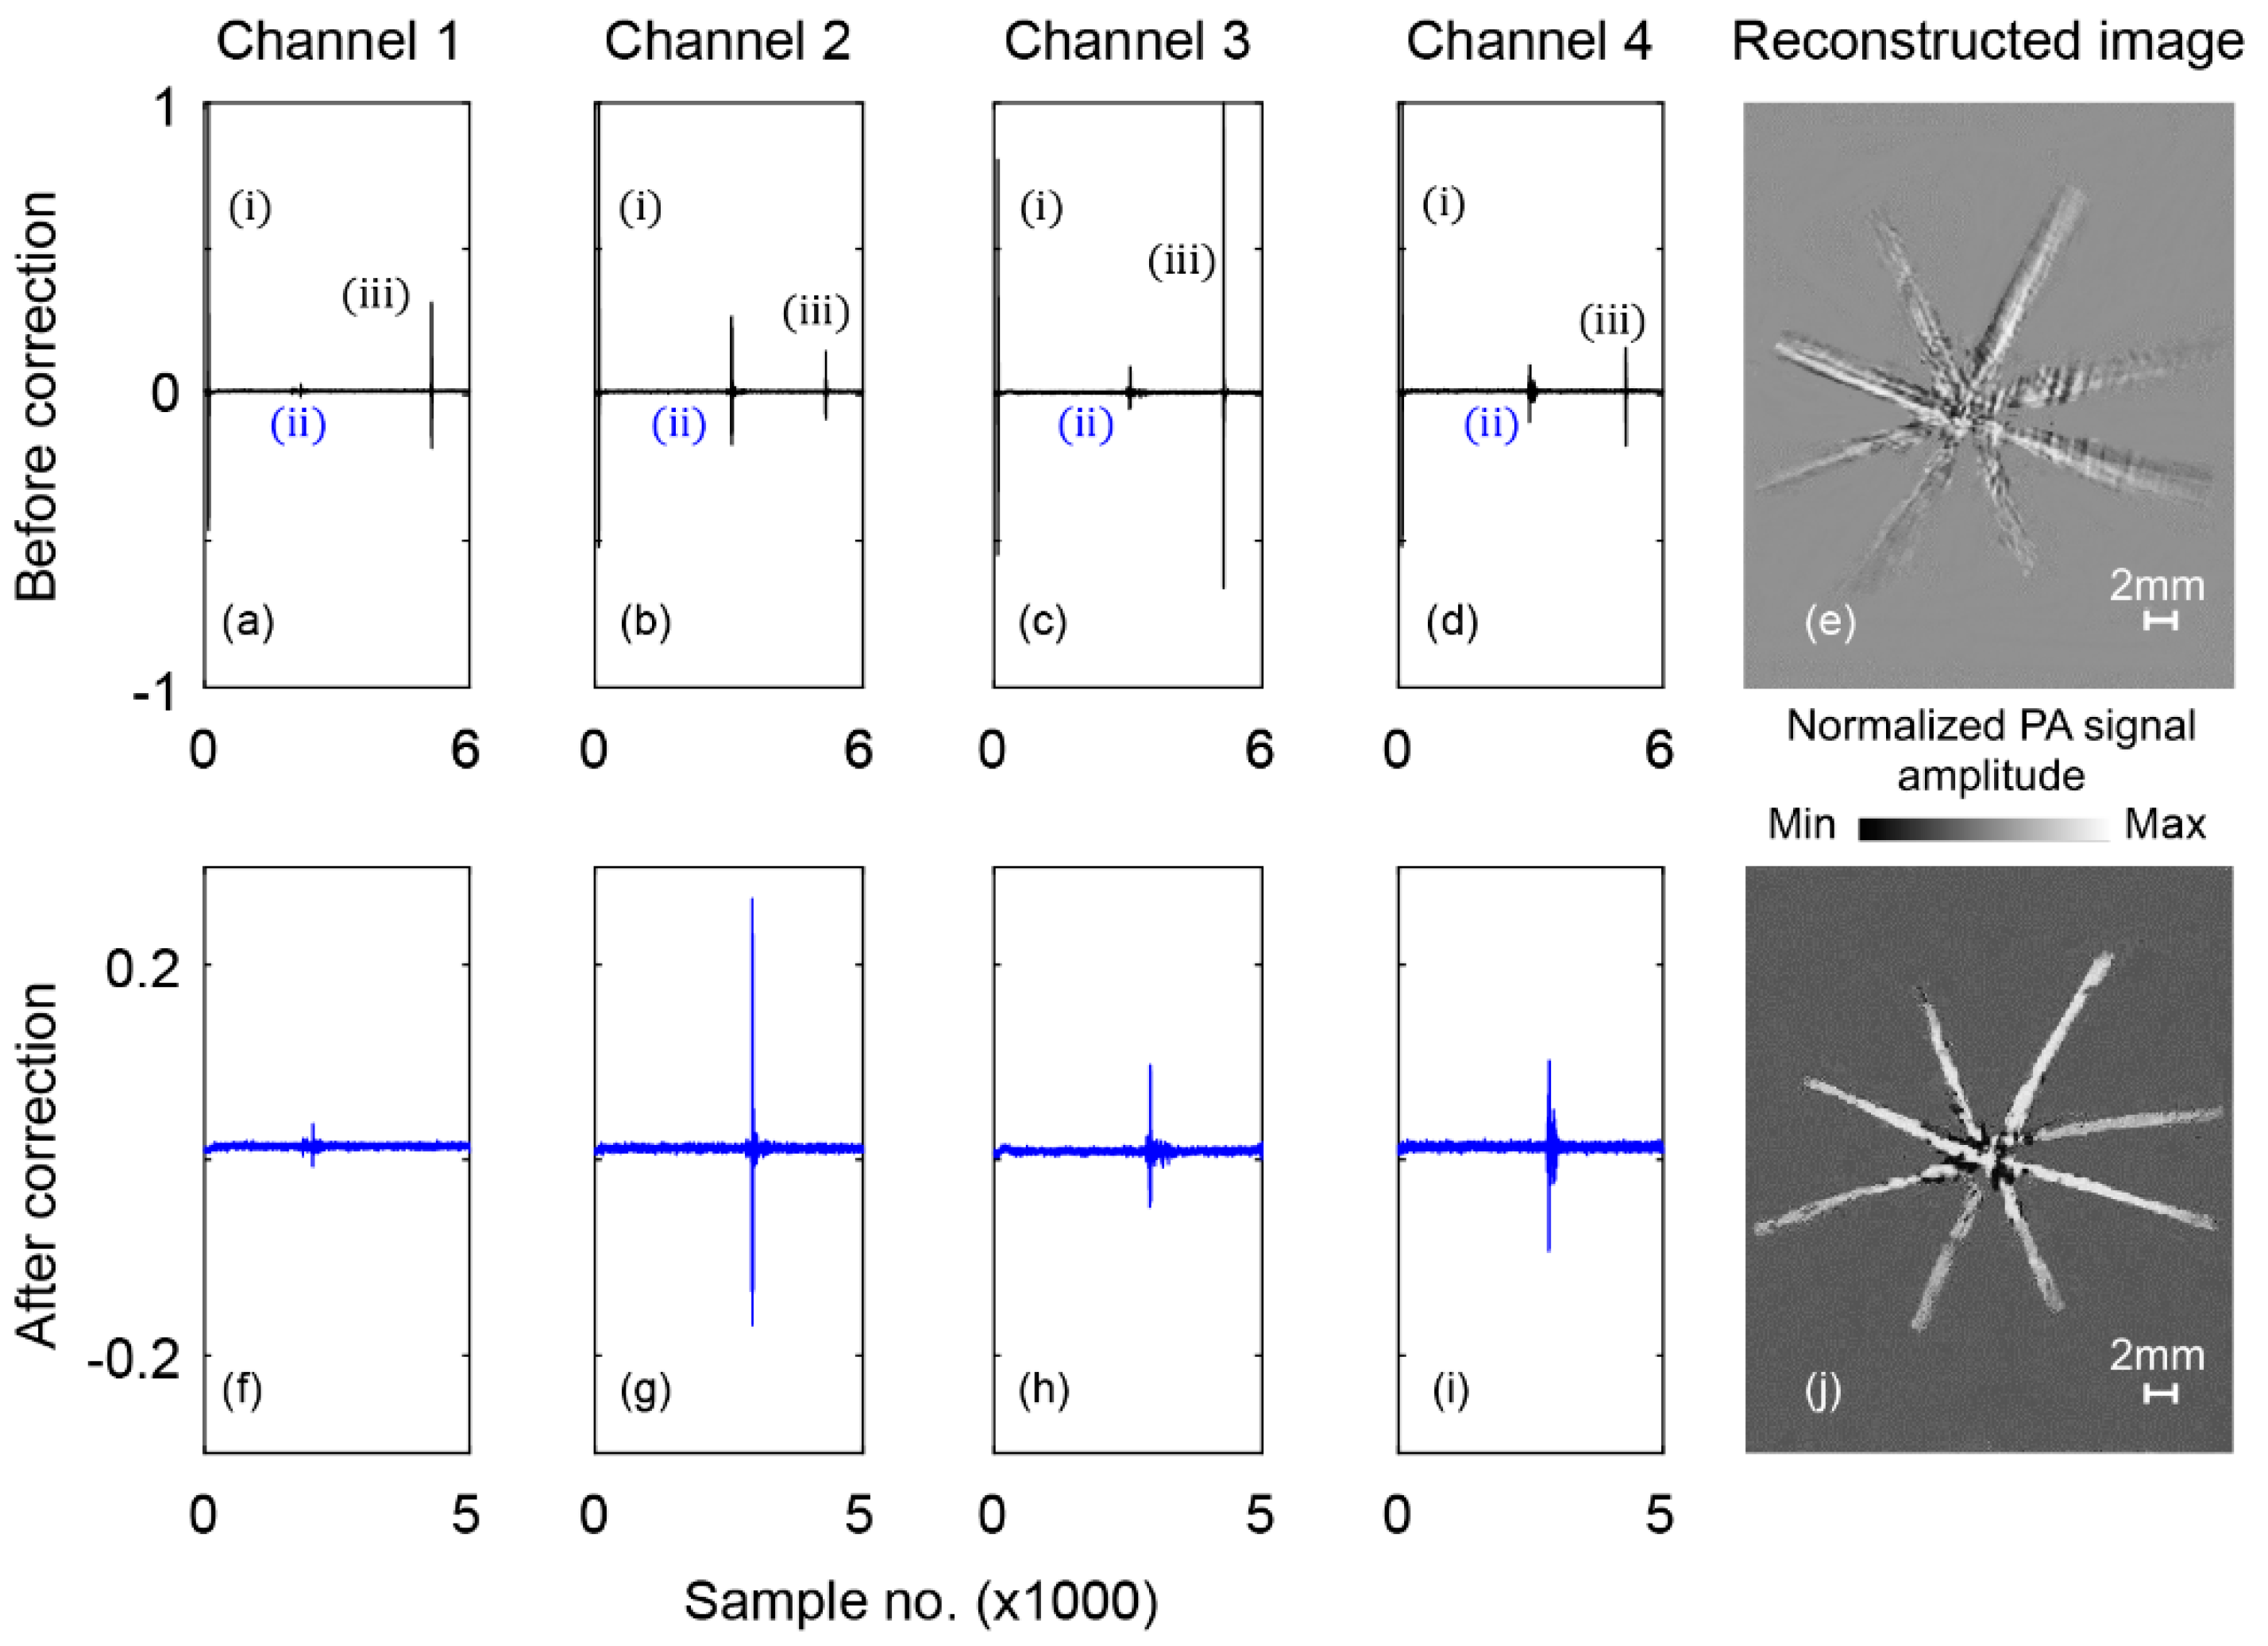
Since the signal shift is the same for both PA signals coming from the tape and the imaging target, the number of samples between the peak of the PA signal from the tape and the imaging target remains the same. To align the data of each channel, the arrays are truncated to the same length (5000 samples) with the last sample being the PA signal of their respective calibration tape. Based on this methodology, a calibration algorithm is developed and applied on each channel data as shown in Figure 3.
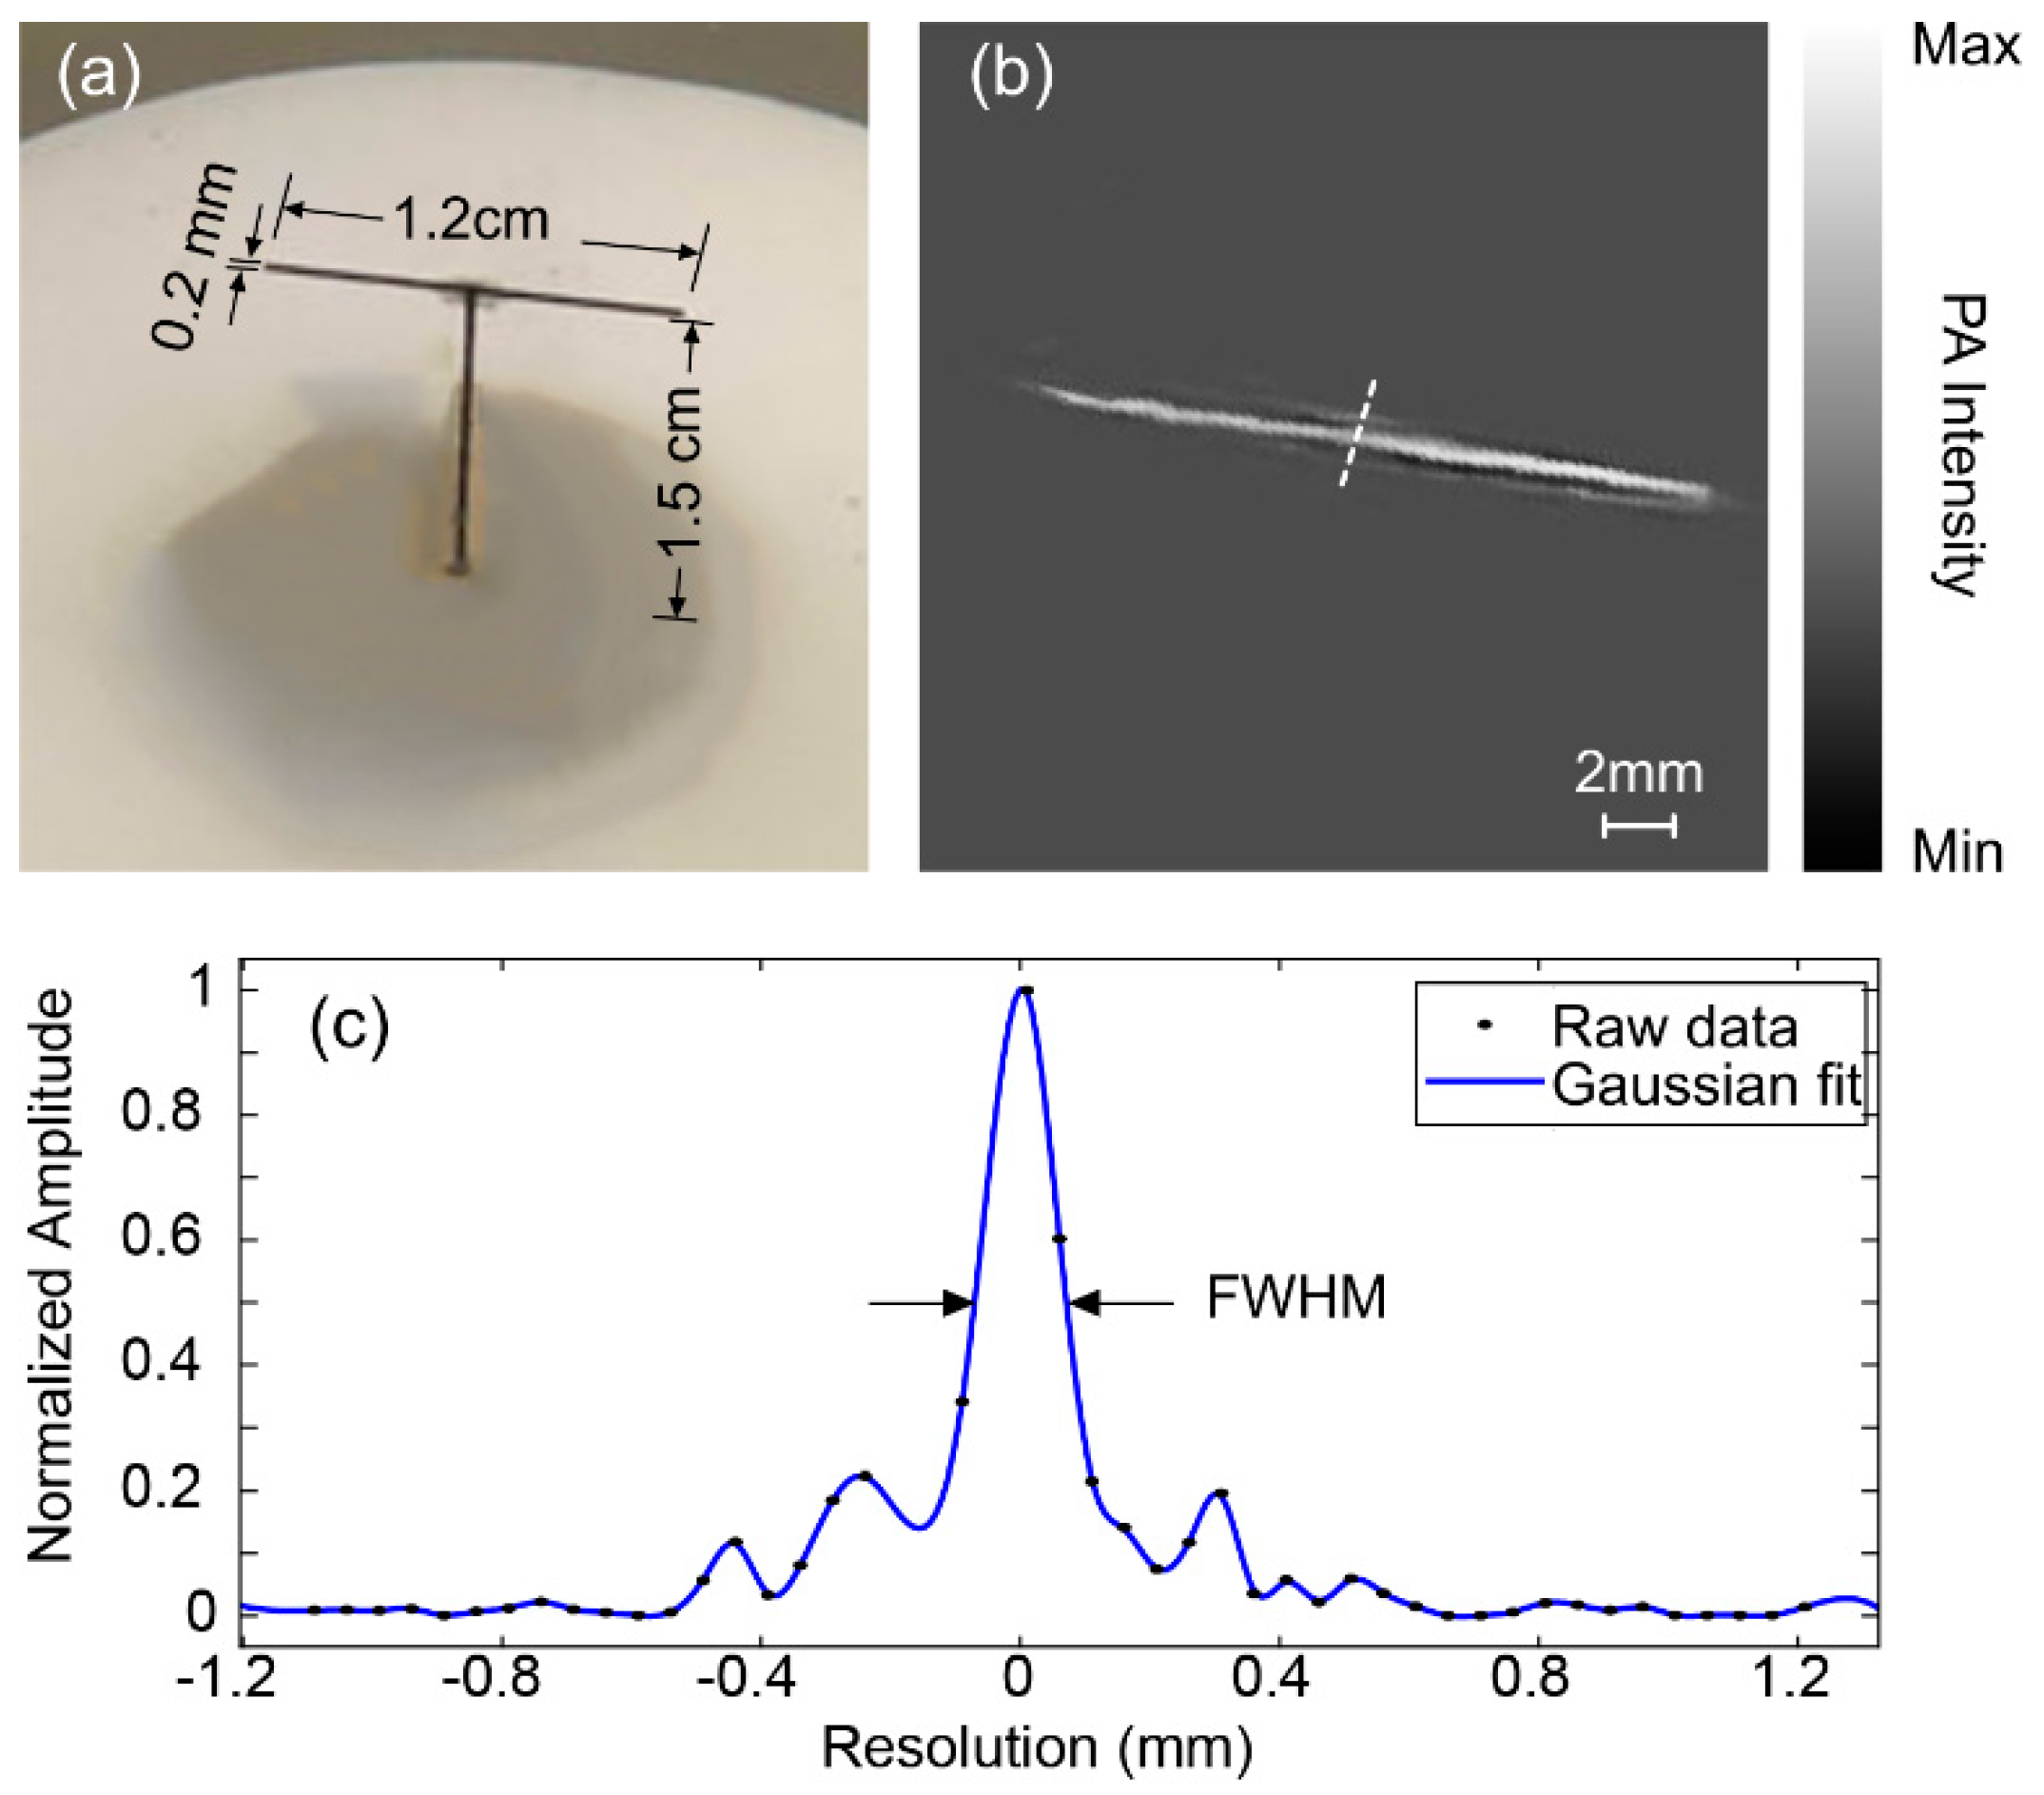
In order to determine the system resolution, a 0.2 mm single lead phantom is made as shown in Figure 4a. This phantom is pivoted onto a white plastic platform using a separate 1.5 cm long lead. Alignment of the phantom with the plane of transducer field of view is performed by a 3-axis translation stage (Thorlabs, MT3 148-811ST). A complex 8-legged 0.5 mm diameter lead phantom is also developed to evaluate the system performance as shown in Figure 5a. The 8 legs of the phantom were held together using transparent non-conductive adhesive glue.

3. Results

Using the calibration algorithm, the PA channel data was corrected before image reconstruction. Four randomly selected channel data are shown in Figure 3. Before calibration, each channel data consists of three reference signals: (i) the signal representing the transducer response, (ii) the PA signal coming from the imaging target and (iii) the PA signal coming from the tape. After calibration (blue solid), the PA signal from the imaging target is aligned. The reason that the PA signals are not located at the same sample number, is due to the non-uniform structure of the phantom. The improvement in the reconstructed image is evident in Figure 3e,j.
We initially performed a resolution analysis on a 2-legged phantom with 0.2 mm diameter lead as shown in Figure 4a. As the diameter of the lead is expected to be below the spatial resolution of the system, the width of the reconstructed image will spread to the resolution of the system. The length of each of the two branches was 6 mm. A 2D reconstructed image of the phantom is shown in Figure 4b. Taking a 1D intensity profile across the diameter of the object followed by a Gaussian fitting to the pixel values and calculating the full width at half maximum (FWHM) approximates the spatial resolution of the system. In Figure 4c, the FWHM is estimated to be 240 µm.
Next, the system was used to image a complex phantom comprised of 0.5 mm diameter lead with 8 branches (~7 mm in length). Figure 5a shows an image of the phantom positioned and aligned at the center of the ring. The phantom dimensions are shown in Figure 5b. The reconstructed image of the phantom is shown in Figure 5c.
Among different configurations of PAI, photoacoustic computed tomography is favored for small animal studies, e.g., hemodynamic brain imaging, whole body imaging, mainly due to its fast image acquisition. However the high-cost of the system has prevented the full establishment and wide utility of the device. Here we introduced a fast, low cost PACT system by replacing the sophisticated expensive ring array with a moving ultrasound sparse array. We demonstrated, by imaging sophisticated phantoms, that the system can produce images with a temporal resolution of 1.5 s and spatial resolution of 240 µm. This system promises a higher sensitivity in comparison to a commercial ring array due to the much larger number of view angles it uses and larger element size of the transducers. The cost of the proposed system compared to a full-ring array PACT is given in the table below (Table 3).

4. Conclusions and Future Work

Although PAI has demonstrated great potential in preclinical and clinical applications, it is still in its early stage of development compared to already established medical imaging modalities such as MRI, CT, PET, and ultrasound imaging. Among several limitations preventing the wide application of PACT, manufacturing cost is the major one. Here, we explained the development of a fast, low-cost PACT system with only 16 single element transducers and a novel mechanical scanning design. Such configuration reduces the cost of the ring array PACT system drastically. A correction algorithm has been developed and applied to the acquired signals to make the transducers’ data equidistant from the imaging target. We have demonstrated that the system can produce images with a temporal resolution of 1.5 s and spatial resolution of 240 µm.
The system developed in this study will eventually be used for functional small animal brain imaging. We are currently developing a new system, using the same concept but smaller in size with 32 transducers, and an amplifier unit, to make a faster, compact PACT system with improved isotropic resolution.

Author Contributions

Conceptualization, M.Z. and M.A.; Methodology, M.Z. and M.A.; Software, M.Z., K.K., and R.M.; Validation, R.M. and K.K.; Formal Analysis, R.M., K.K., and M.Z.; Investigation R.M., K.K., and M.Z.; Writing–Original Draft Preparation, M.Z., and K.K.; Writing–Review and Editing, R.M.; Visualization, R.M.; Supervision, M.A.

Funding

This research was partially funded by the American Cancer Society, Research Grant number 14-238-04-IRG and the Albert and Goldye J. Nelson grant.

Acknowledgments

We are grateful to have constructive discussion with Jun Xia from University of Buffalo, NY regarding the reconstruction algorithm.

Conflicts of Interest

The authors declare no conflict of interest.

References

  1. Wang, L.V. Multiscale photoacoustic microscopy and computed tomography. Nat. Photonics 2009, 3, 503. [Google Scholar] [CrossRef] [PubMed]
  2. Mohammadi-Nejad, A.-R.; Mahmoudzadeh, M.; Hassanpour, M.S.; Wallois, F.; Muzik, O.; Papadelis, C.; Hansen, A.; Soltanian-Zadeh, H.; Gelovani, J.; Nasiriavanaki, M. Neonatal brain resting-state functional connectivity imaging modalities. Photoacoustics 2018, 10, 1–19. [Google Scholar] [CrossRef] [PubMed]
  3. Anwar, R.; Kratkiewicz, K.; Mohammad, R. Avanaki Photoacoustic Imaging: A Promising Alternative to Transcranial Ultrasound. Res. J. Opt. Photonics 2018, 2, 411–420. [Google Scholar]
  4. Wang, L.V. Tutorial on photoacoustic microscopy and computed tomography. IEEE J. Sel. Top. Quantum Electron. 2008, 14, 171–179. [Google Scholar] [CrossRef]
  5. Zhou, Y.; Yao, J.; Wang, L.V. Tutorial on photoacoustic tomography. J. Biomed. Opt. 2016, 21, 061007. [Google Scholar] [CrossRef] [PubMed] [Green Version]
  6. Nasiriavanaki, M.; Xia, J.; Wan, H.; Bauer, A.Q.; Culver, J.P.; Wang, L.V. High-resolution photoacoustic tomography of resting-state functional connectivity in the mouse brain. Proc. Natl. Acad. Sci. USA 2014, 111, 21–26. [Google Scholar] [CrossRef] [PubMed]
  7. Mahmoodkalayeh, S.; Lu, X.; Ansari, M.A.; Li, H.; Nasiriavanaki, M. Optimization of light illumination for photoacoustic computed tomography of human infant brain. In Proceedings of the Photons Plus Ultrasound: Imaging and Sensing, San Francisco, CA, USA, 27 January–1 February 2018; p. 104946U. [Google Scholar]
  8. Manwar, R.; Hosseinzadeh, M.; Hariri, A.; Kratkiewicz, K.; Noei, S.; N Avanaki, M. Photoacoustic Signal Enhancement: Towards Utilization of Low Energy Laser Diodes in Real-Time Photoacoustic Imaging. Sensors 2018, 18, 3498. [Google Scholar] [CrossRef] [PubMed]
  9. Xu, M.; Wang, L.V. Photoacoustic imaging in biomedicine. Rev. Sci. Instrum. 2006, 77, 041101. [Google Scholar] [CrossRef] [Green Version]
  10. Zhou, Y.; Wang, D.; Zhang, Y.; Chitgupi, U.; Geng, J.; Wang, Y.; Zhang, Y.; Cook, T.R.; Xia, J.; Lovell, J.F. A phosphorus phthalocyanine formulation with intense absorbance at 1000 nm for deep optical imaging. Theranostics 2016, 6, 688. [Google Scholar] [CrossRef] [PubMed]
  11. Adabi, S.; Hosseinzadeh, M.; Noei, S.; Conforto, S.; Daveluy, S.; Clayton, A.; Mehregan, D.; Nasiriavanaki, M. Universal in vivo textural model for human skin based on optical coherence tomograms. Sci. Rep. 2017, 7, 17912. [Google Scholar] [CrossRef] [PubMed]
  12. Choma, M.A.; Sarunic, M.V.; Yang, C.; Izatt, J.A. Sensitivity advantage of swept source and Fourier domain optical coherence tomography. Opt. Express 2003, 11, 2183–2189. [Google Scholar] [CrossRef] [PubMed] [Green Version]
  13. Cogliati, A.; Canavesi, C.; Hayes, A.; Tankam, P.; Duma, V.-F.; Santhanam, A.; Thompson, K.P.; Rolland, J.P. MEMS-based handheld scanning probe with pre-shaped input signals for distortion-free images in Gabor-domain optical coherence microscopy. Opt. Express 2016, 24, 13365–13374. [Google Scholar] [CrossRef] [PubMed]
  14. Monroy, G.L.; Won, J.; Spillman, D.R.; Dsouza, R.; Boppart, S.A. Clinical translation of handheld optical coherence tomography: practical considerations and recent advancements. J. Biomed. Opt. 2017, 22, 121715. [Google Scholar] [CrossRef] [PubMed]
  15. Liu, Y.; Nie, L.; Chen, X. Photoacoustic molecular imaging: from multiscale biomedical applications towards early-stage theranostics. Trends Biotechnol. 2016, 34, 420–433. [Google Scholar] [CrossRef] [PubMed]
  16. Hariri, A.; Tavakoli, E.; Adabi, S.; Gelovani, J.; Avanaki, M.R. Functional photoacoustic tomography for neonatal brain imaging: developments and challenges. In Proceedings of the Photons Plus Ultrasound: Imaging and Sensing, San Francisco, CA, USA, 28 January–2 February 2017; p. 100642Z. [Google Scholar]
  17. Mahmoodkalayeh, S.; Jooya, H.Z.; Hariri, A.; Zhou, Y.; Xu, Q.; Ansari, M.A.; Avanaki, M.R. Low temperature-mediated enhancement of photoacoustic imaging depth. Sci. Rep. 2018, 8, 4873. [Google Scholar] [CrossRef] [PubMed]
  18. Meimani, N.; Abani, N.; Gelovani, J.; Avanaki, M.R. A numerical analysis of a semi-dry coupling configuration in photoacoustic computed tomography for infant brain imaging. Photoacoustics 2017, 7, 27–35. [Google Scholar] [CrossRef] [PubMed]
  19. Wang, L.V.; Yao, J. A practical guide to photoacoustic tomography in the life sciences. Nat. Methods 2016, 13, 627. [Google Scholar] [CrossRef] [PubMed]
  20. Laufer, J.; Delpy, D.; Elwell, C.; Beard, P. Quantitative spatially resolved measurement of tissue chromophore concentrations using photoacoustic spectroscopy: application to the measurement of blood oxygenation and haemoglobin concentration. Phys. Med. Biol. 2006, 52, 141. [Google Scholar] [CrossRef] [PubMed]
  21. Stein, E.W.; Maslov, K.I.; Wang, L.V. Noninvasive, in vivo imaging of blood-oxygenation dynamics within the mouse brain using photoacoustic microscopy. J. Biomed. Opt. 2009, 14, 020502. [Google Scholar] [CrossRef] [PubMed] [Green Version]
  22. Wang, X.; Xie, X.; Ku, G.; Wang, L.V.; Stoica, G. Noninvasive imaging of hemoglobin concentration and oxygenation in the rat brain using high-resolution photoacoustic tomography. J. Biomed. Opt. 2006, 11, 024015. [Google Scholar] [CrossRef] [PubMed] [Green Version]
  23. Wang, L.V.; Gao, L. Photoacoustic microscopy and computed tomography: from bench to bedside. Annu. Rev. Biomed. Eng. 2014, 16, 155–185. [Google Scholar] [CrossRef] [PubMed]
  24. Wang, L.V.; Hu, S. Photoacoustic tomography: in vivo imaging from organelles to organs. Science 2012, 335, 1458–1462. [Google Scholar] [CrossRef] [PubMed]
  25. Upputuri, P.K.; Pramanik, M. Performance characterization of low-cost, high-speed, portable pulsed laser diode photoacoustic tomography (PLD-PAT) system. Biomed. Opt. Express 2015, 6, 4118–4129. [Google Scholar] [CrossRef] [PubMed]
  26. Xia, J.; Chatni, M.R.; Maslov, K.; Guo, Z.; Wang, K.; Anastasio, M.; Wang, L.V. Whole-body ring-shaped confocal photoacoustic computed tomography of small animals in vivo. J. Biomed. Opt. 2012, 17, 0505061–0505063. [Google Scholar] [CrossRef] [PubMed]
  27. Xia, J.; Guo, Z.; Maslov, K.; Aguirre, A.; Zhu, Q.; Percival, C.; Wang, L.V. Three-dimensional photoacoustic tomography based on the focal-line concept. J. Biomed. Opt. 2011, 16, 090505. [Google Scholar] [CrossRef] [PubMed] [Green Version]
  28. Gamelin, J.K.; Aquirre, A.; Maurudis, A.; Huang, F.; Castillo, D.; Wang, L.V.; Zhu, Q. Curved array photoacoustic tomographic system for small animal imaging. J. Biomed. Opt. 2008, 13, 024007. [Google Scholar] [CrossRef] [PubMed] [Green Version]
  29. Buxton, R.B.; Wong, E.C.; Frank, L.R. Dynamics of blood flow and oxygenation changes during brain activation: the balloon model. Magn. Reson. Med. 1998, 39, 855–864. [Google Scholar] [CrossRef] [PubMed]
  30. Gamelin, J.; Maurudis, A.; Aguirre, A.; Huang, F.; Guo, P.; Wang, L.V.; Zhu, Q. A fast 512-element ring array photoacoustic imaging system for small animals. In Proceedings of the Photons Plus Ultrasound: Imaging and Sensing, San Jose, CA, USA, 24–29 January 2009; p. 71770B. [Google Scholar]
  31. Li, G.; Xia, J.; Wang, K.; Maslov, K.; Anastasio, M.A.; Wang, L.V. Tripling the detection view of high-frequency linear-array-based photoacoustic computed tomography by using two planar acoustic reflectors. Quant. Imaging Med. Surg. 2015, 5, 57. [Google Scholar] [PubMed]
  32. Kondo, K.; Namita, T.; Yamakawa, M.; Shiina, T. Three-dimensional photoacoustic reconstruction for sparse array using compressed sensing based on k-space algorithm. In Proceedings of the IEEE International Conference on the Ultrasonics Symposium (IUS), Tours, France, 18–21 September 2016; pp. 1–3. [Google Scholar]
  33. Xiao, J.; He, J. Multispectral quantitative photoacoustic imaging of osteoarthritis in finger joints. Appl. Opt. 2010, 49, 5721–5727. [Google Scholar] [CrossRef] [PubMed]
  34. Wang, X.; Pang, Y.; Ku, G.; Xie, X.; Stoica, G.; Wang, L.V. Noninvasive laser-induced photoacoustic tomography for structural and functional in vivo imaging of the brain. Nat. Biotechnol. 2003, 21, 803. [Google Scholar] [CrossRef] [PubMed]
  35. Liu, Y.; Li, D.; Yuan, Z. Photoacoustic tomography imaging of the adult zebrafish by using unfocused and focused high-frequency ultrasound transducers. Appl. Sci. 2016, 6, 392. [Google Scholar] [CrossRef]
  36. Xu, M.; Wang, L.V. Time-domain reconstruction for thermoacoustic tomography in a spherical geometry. IEEE Trans. Med. Imaging 2002, 21, 814–822. [Google Scholar] [PubMed] [Green Version]
  37. Xu, M.; Wang, L.V. Universal back-projection algorithm for photoacoustic computed tomography. Phys. Rev. E 2005, 71, 016706. [Google Scholar] [CrossRef] [PubMed]
  38. Omidi, P.; Zafar, M.; Mozaffarzadeh, M.; Hariri, A.; Haung, X.; Orooji, M.; Nasiriavanaki, M. A novel dictionary-based image reconstruction for photoacoustic computed tomography. Appl. Sci. 2018, 8, 1570. [Google Scholar] [CrossRef]
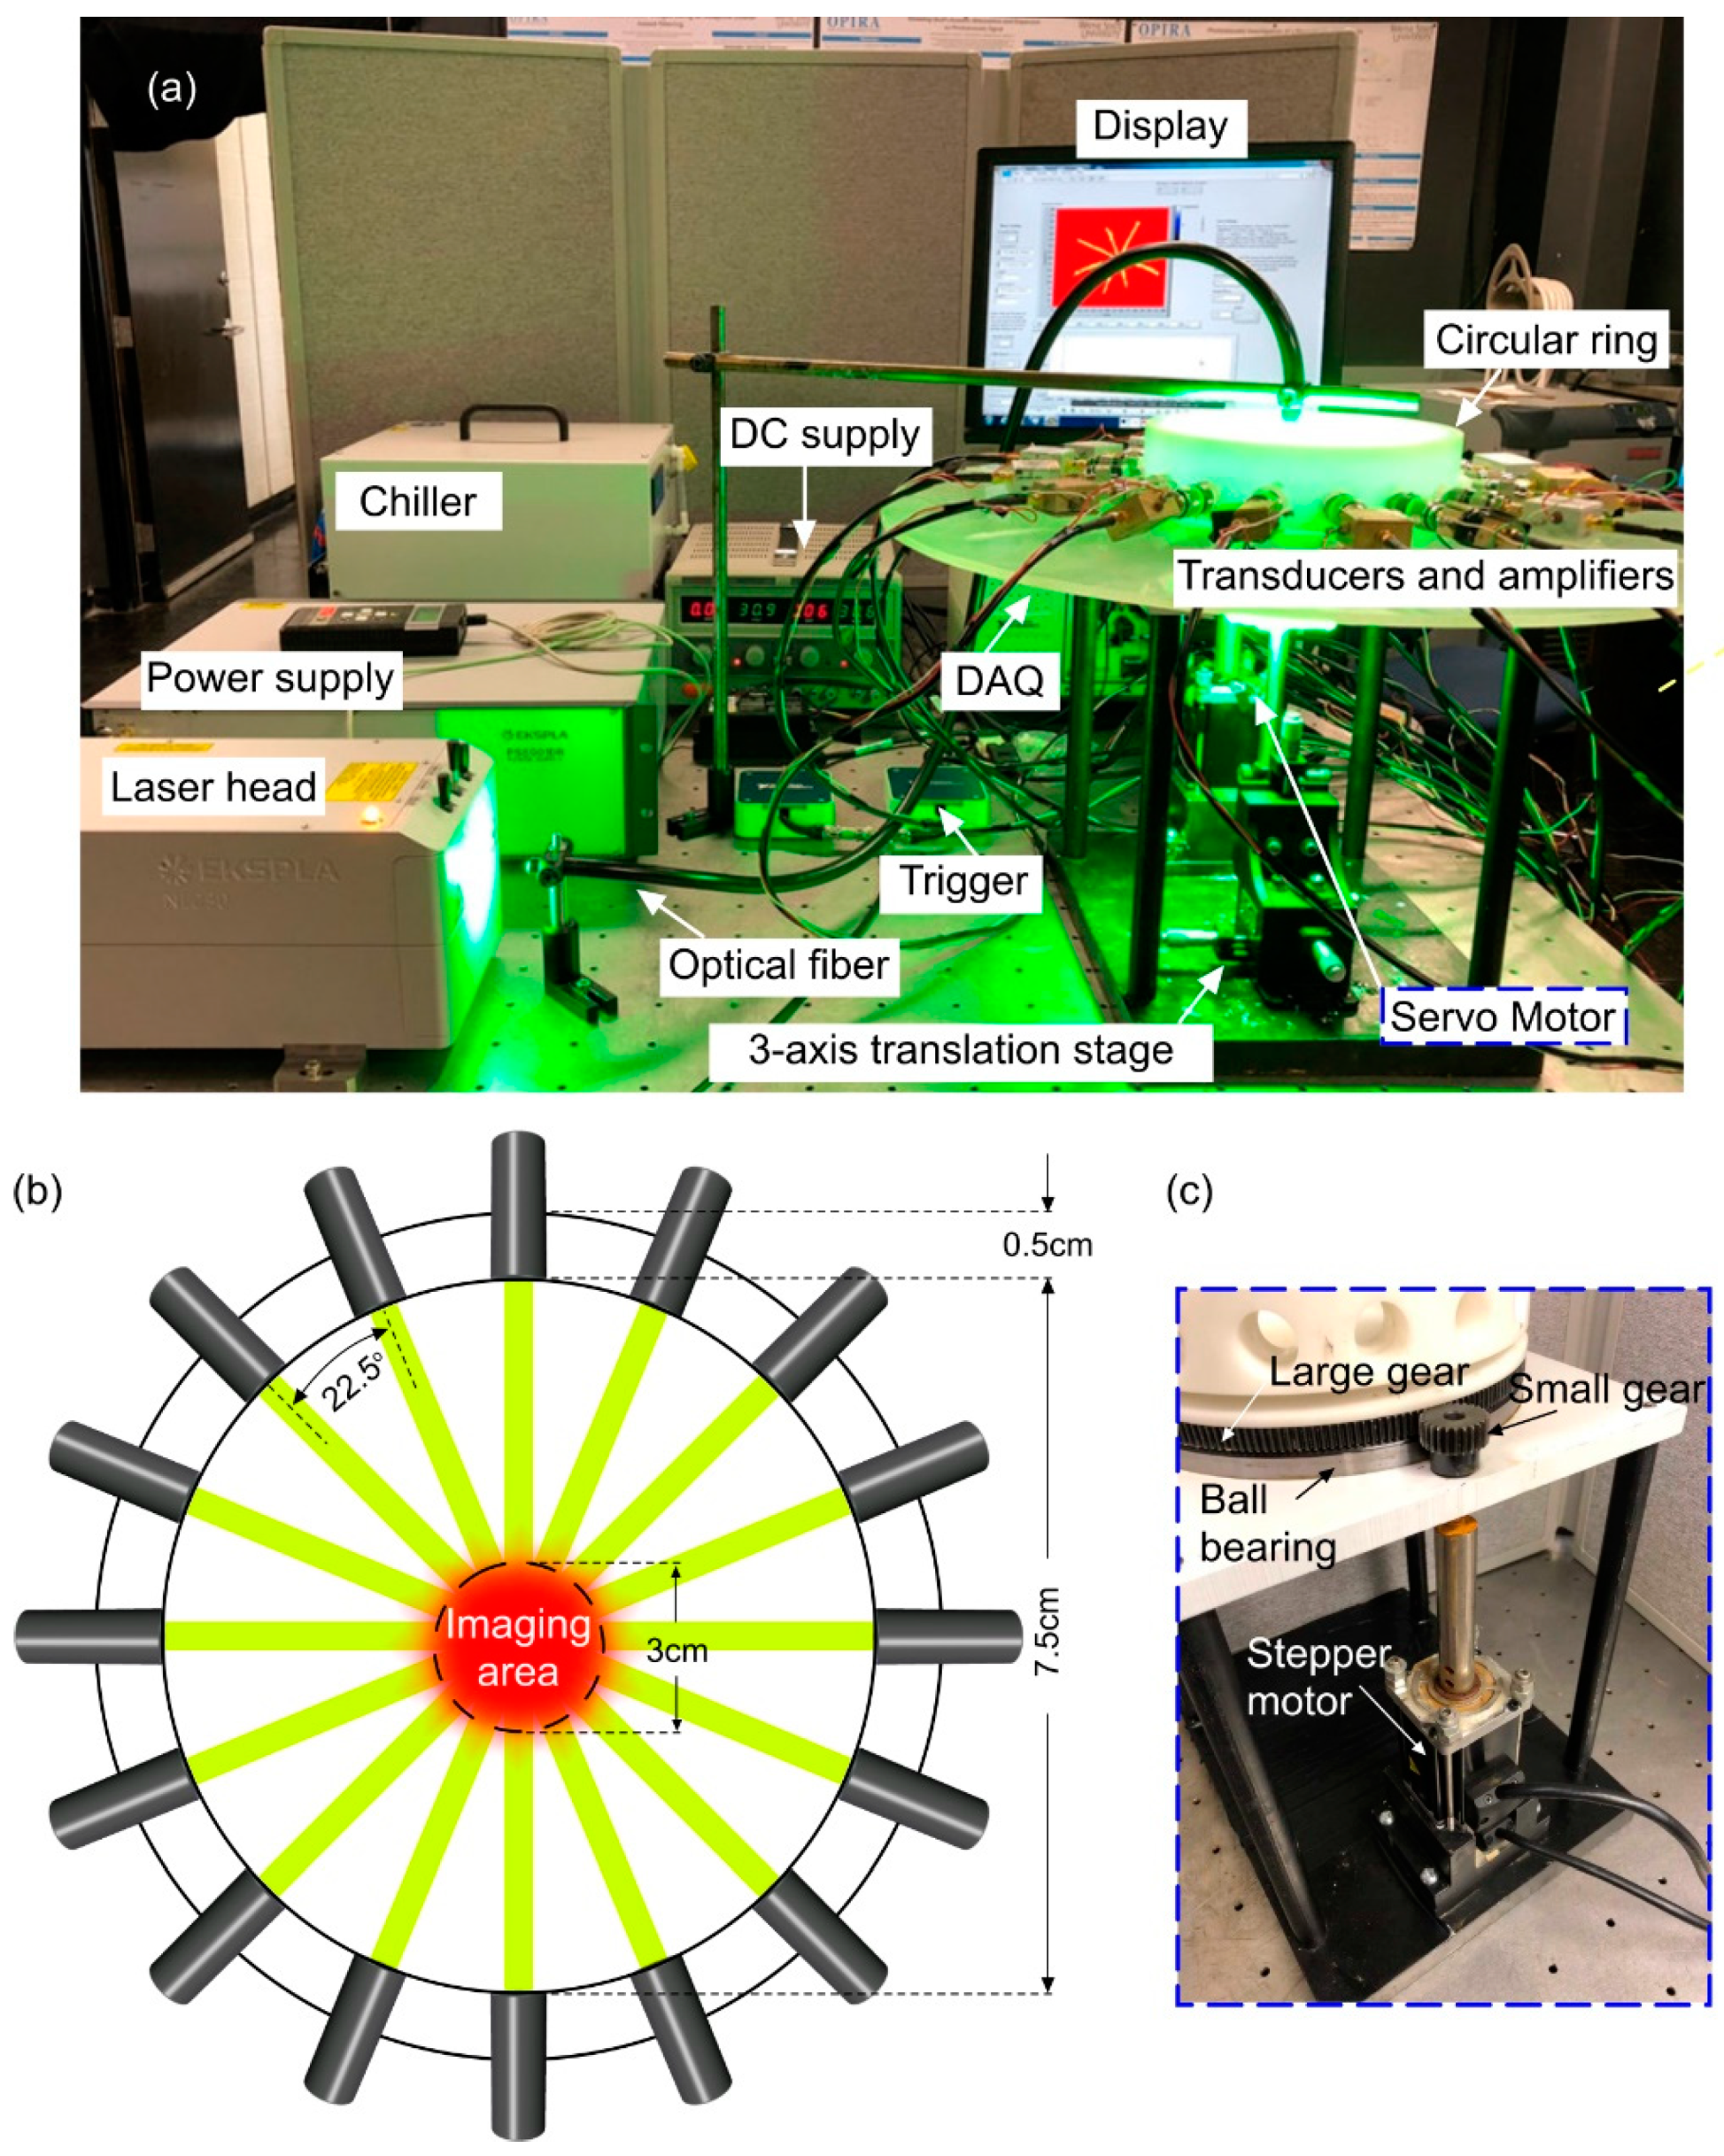
Figure 1. (a) A photograph of our low-cost photoacoustic computed tomography system comprised of EKSPLA laser head, a power supply for the laser, a chiller, a DC power supply for the motor driver, NI DAQ, NI trigger board, servo motor (expanded in (c)), motor gear, 3-axis translation stage for phantom, and 16 transducers and amplifiers, (b) top view of the circular ring showing an imaging area of 3 cm diameter, and (c) servo motor with mechanical gears. DC: Direct Current, NI: National Instrument, DAQ: Data Acquisition Unit.
Applsci 09 00374 g001
Figure 2. (a) Flowchart of the correction technique and (b) calibration setup with black tape targets located above each transducer to acquire calibration PA signal for the alignment of the transducers’ signals.
Applsci 09 00374 g002
Figure 3. PA signal correction based on the calibration algorithm. (ad) PA signals of (i) transducer response, (ii) PA from imaging object, (iii) PA from calibration tape, (e) distorted image before data correction. (fi) PA signals from the imaging object, (j) image after data correction.
Applsci 09 00374 g003
Figure 4. Resolution analysis results. (a) Image of the resolution phantom, (b) reconstructed image, (c) intensity profile across the diameter of the resolution phantom with a Gaussian fit (FWHM = 240 µm).
Applsci 09 00374 g004
Figure 5. Imaging of an 8-leg phantom. (a) Experimental setup. (b) a photograph of the 8-leg phantom, and (c) a 2D reconstructed image of the phantom using 16- element PACT system (image acquired in 1.5 s).
Applsci 09 00374 g005
Table 1. Structural parameters of the circular ring.
ParameterValue
Height, h31 cm
External radius, rext8 cm
Internal radius, rint7.5 cm
Motor weight, mr5 kg
Total weight, mt7.01 kg
Table 2. The values of scanning radius for transducers.
Transducer no.Distance to the Center (cm)
17.61
27.65
37.67
47.69
57.58
67.62
77.64
87.62
97.65
107.67
117.63
127.62
137.64
147.63
157.68
167.68
Table 3. Cost comparison between proposed and full-ring array based PACT system.
ComponentsProposed/Full-Ring ArrayCost ($)
Transducer16 single elements/512 elements~5K/~65K
AmplifiersLow noise 24dB/customized~5K/~25K
Servo MotorServo/NA~250/NA
DAQ16 channel/512 channel (or 64 channel with MUX)~5K/~50 K