1. Introduction
Age-related macular degeneration (AMD) is the leading cause of visual dysfunction and blindness in developed countries and a rising cause in underdeveloped countries. AMD is characterized by progressive degeneration of the macula, causing central field vision loss. The global prevalence of AMD is 8.7% worldwide [
1,
2]. Importantly, at least 1 out of 10 Hispanics have AMD, which is slightly higher than the global rate [
3]. Several studies are focused on the risk factors for European [
4], Asian [
2], and American [
5] non-Hispanic population. Genetic variants, older age, and cigarette smoking are common examples of accepted risk factors [
6].
Age-related cataract is also a frequent eye disorder and the leading cause for reversible blindness. The World Health Organization [
7] current estimates for its prevalence are around 65.2 million persons affected with moderate or severe distance vision impairment or blindness worldwide. As the life expectancy of the population rises, the number of people suffering from AMD is also increasing [
8]. This fact is causing a very expensive health care burden for the states in addition to the deterioration of the quality of life of the people suffering from AMD.
Historically, traditional statistical methods were used to determine high-risk factors of diseases, and predictive models were built to aid the physician in the diagnosis of AMD [
9,
10]. For instance, Chakravarthy et al. [
6] presented a systematic review and a meta-analysis for the selection of risk factors in several populations. In that review, the authors reported previous cataract surgery as a strong risk factor for neovascular AMD. The authors analyzed data from different ethnic groups and they found cataract surgery to be one of the strong and consistent risk factors for late AMD. On the other hand, Klein et al. [
11] conducted some research to detect the associations between cataract and cataract surgery with early and late age-related macular degeneration over the American population. The conclusions of the study were that neither cataract nor cataract surgery were associated with a greater chance of developing early AMD.
Results from several epidemiological studies regarding the association between bilateral cataracts and AMD have been inconsistent [
12,
13,
14]. For this reason, more research will help to conclude whether cataracts and cataract surgery are major risk factors for AMD disease.
In the last decades, machine learning methods and dimensionality reduction techniques have been found to be useful for medical diagnosis and finding high-risk factors, specifically for AMD disease. For example, Spencer et al. [
15] used multifactor dimensionality reduction (MDR) and grammatical evolution of neural networks (GENN), in addition to logistic regression, to predict the risk for individuals of suffering from AMD disease.
In this paper, we present a machine learning approach to analyze the relevance of cataract as a risk factor for AMD, in order to shed light regarding the controversy between inconclusive points of view in this matter. We investigated the association between two polymorphisms in the Complement Factor H (
CFH) gene over the Mexican population. These polymorphisms have been previously investigated in several populations in other studies such as that of Soysal et al. [
16].
The rest of the paper is organized as follows. In
Section 2, we describe the materials used for data collection and procedure used to analyze if cataracts are a risk factors for AMD. In
Section 3, we present the results of our machine learning approach. We discuss our results and findings in
Section 4.
Section 5 concludes the paper and highlights future work.
2. Materials and Methods
In this section, we describe the procedure followed to determine if having cataracts in any eye is a risk factor for AMD. The procedure followed the steps listed bellow: study design, genetic variants selection, DNA extraction, genotyping, database construction, and ML analysis.
2.1. Study Design
We performed a hospital-based case-control study nested in an ongoing cohort to evaluate the effects of bilateral cataracts among Hispanics from Mexico. Our studied population consisted of 256 (146 cataract cases and 110 controls) unrelated Mexican-descended individuals aged 60 or older. Our sample size was calculated in R version 3.5.1 with the “Genetics Design” package, by taking 80% power to detect a significant difference in odds greater than or equal to 1.50, considering the allelic frequency of our SNPs. Participants were enrolled from the outpatient department throughout a routine ophthalmic examination. We recruited controls and cases from the outpatient consultation of Conde de Valenciana Hospital.
For our variable of interest, we included cases with: (i) Age-related or senile cataracts, (ii) aged 60 years or older, (iii) with a Lens Opacities Classification System III (LOCS III) grade nuclear opalescence (NO), (iv) undergoing corrective surgery with phacoemulsification, and (v) without any first-degree relative or past medical history of AMD. The criteria for our independent variable of interest were: (i) Age of 60 years or older, (ii) diagnosed by a retina specialist with AMD clinical Age-Related Maculopathy Staging System (CARMS) with grades 4 or 5 in both eyes or AMD grades 4 or 5 in one eye plus any type of drusen in the fellow eye, (iii) having no other retinal diseases, and (iv) negative history of vitreous-retinal surgery. Of note, all of our cases and some of our controls underwent eye surgery. However, we did not analyze all these procedures. We excluded patients who had diseases that prevented a thorough fundoscopy. Finally, the elimination criterion was the withdrawal of informed consent.
2.2. Genetic Variants Selection
Selection of the genetic variant was based on the genome wide association study (GWAS), which analyzes the contribution to AMD of genetic variations that are common within a population [
17]. We also considered more astringent studies to narrow the regions of the genome that confer more susceptibility to the disease [
6]. Based on those studies, we selected two polymorphisms from the CFH gene, which is an important gene driving increased risk for AMD among several populations.
2.3. Data Collection Procedure
This step of the procedure includes DNA extraction from blood samples and genotyping. Peripheral blood samples were collected in EDTA tubes; genomic DNA was extracted and purified from leukocytes using PureGene whole blood kit (QIAGEN, Germantown, MD, USA) following the manufacturer’s specifications; DNA concentration and purity were quantified using a Multiskan TM GO spectrophotometer (Thermo Fisher Scientific Inc., Wilmington, DE, USA). Additionally, we evaluated DNA integrity with 0.8% agarose (Thermo Fisher Scientific Inc.) gel stained with ethidium bromide.
2.4. Allelic Discrimination Assays
We studied two Single nucleotide polymorphisms (SNPs) in the CFH gene. Allelic discrimination was performed using pre-designed TaqMan probes (Thermo Fisher Scientific Inc., on real-time polymerase chain reaction (RT-PCR) (Piko Real, Thermo Fisher Scientific Inc., Waltham, MA, USA). All PCR amplifications included 6.5 L of Maxima Probe qPCR Master Mix 2X (Thermo Scientific), 0.025 L of primers, 20× probes (Thermo Fisher Scientific), 20 ng of total DNA and nuclease-free water, in a final volume of 10 L. PCR thermal conditions were 10 min at 95 C, followed by 40 cycles at 92 C for 15 s and extended at 60 C for 1 min. We employed conventional RT-PCR melting curve analyses for genotype allocation using the Real-Time PCR System (Thermo Fisher Scientific Inc.). All the assays were carried out in duplicate by blinded experienced laboratory technicians.
2.5. Ethics Statement
We obtained IRB approval from Hospital Conde de Valenciana (IRB CEI-2014-/02/01). Our samples were obtained strictly adhering to the principles of the Declaration of Helsinki [
18] and all patient data was handled as directed by the Health Insurance Portability and Accountability Act (HIPAA).
2.6. Database Construction
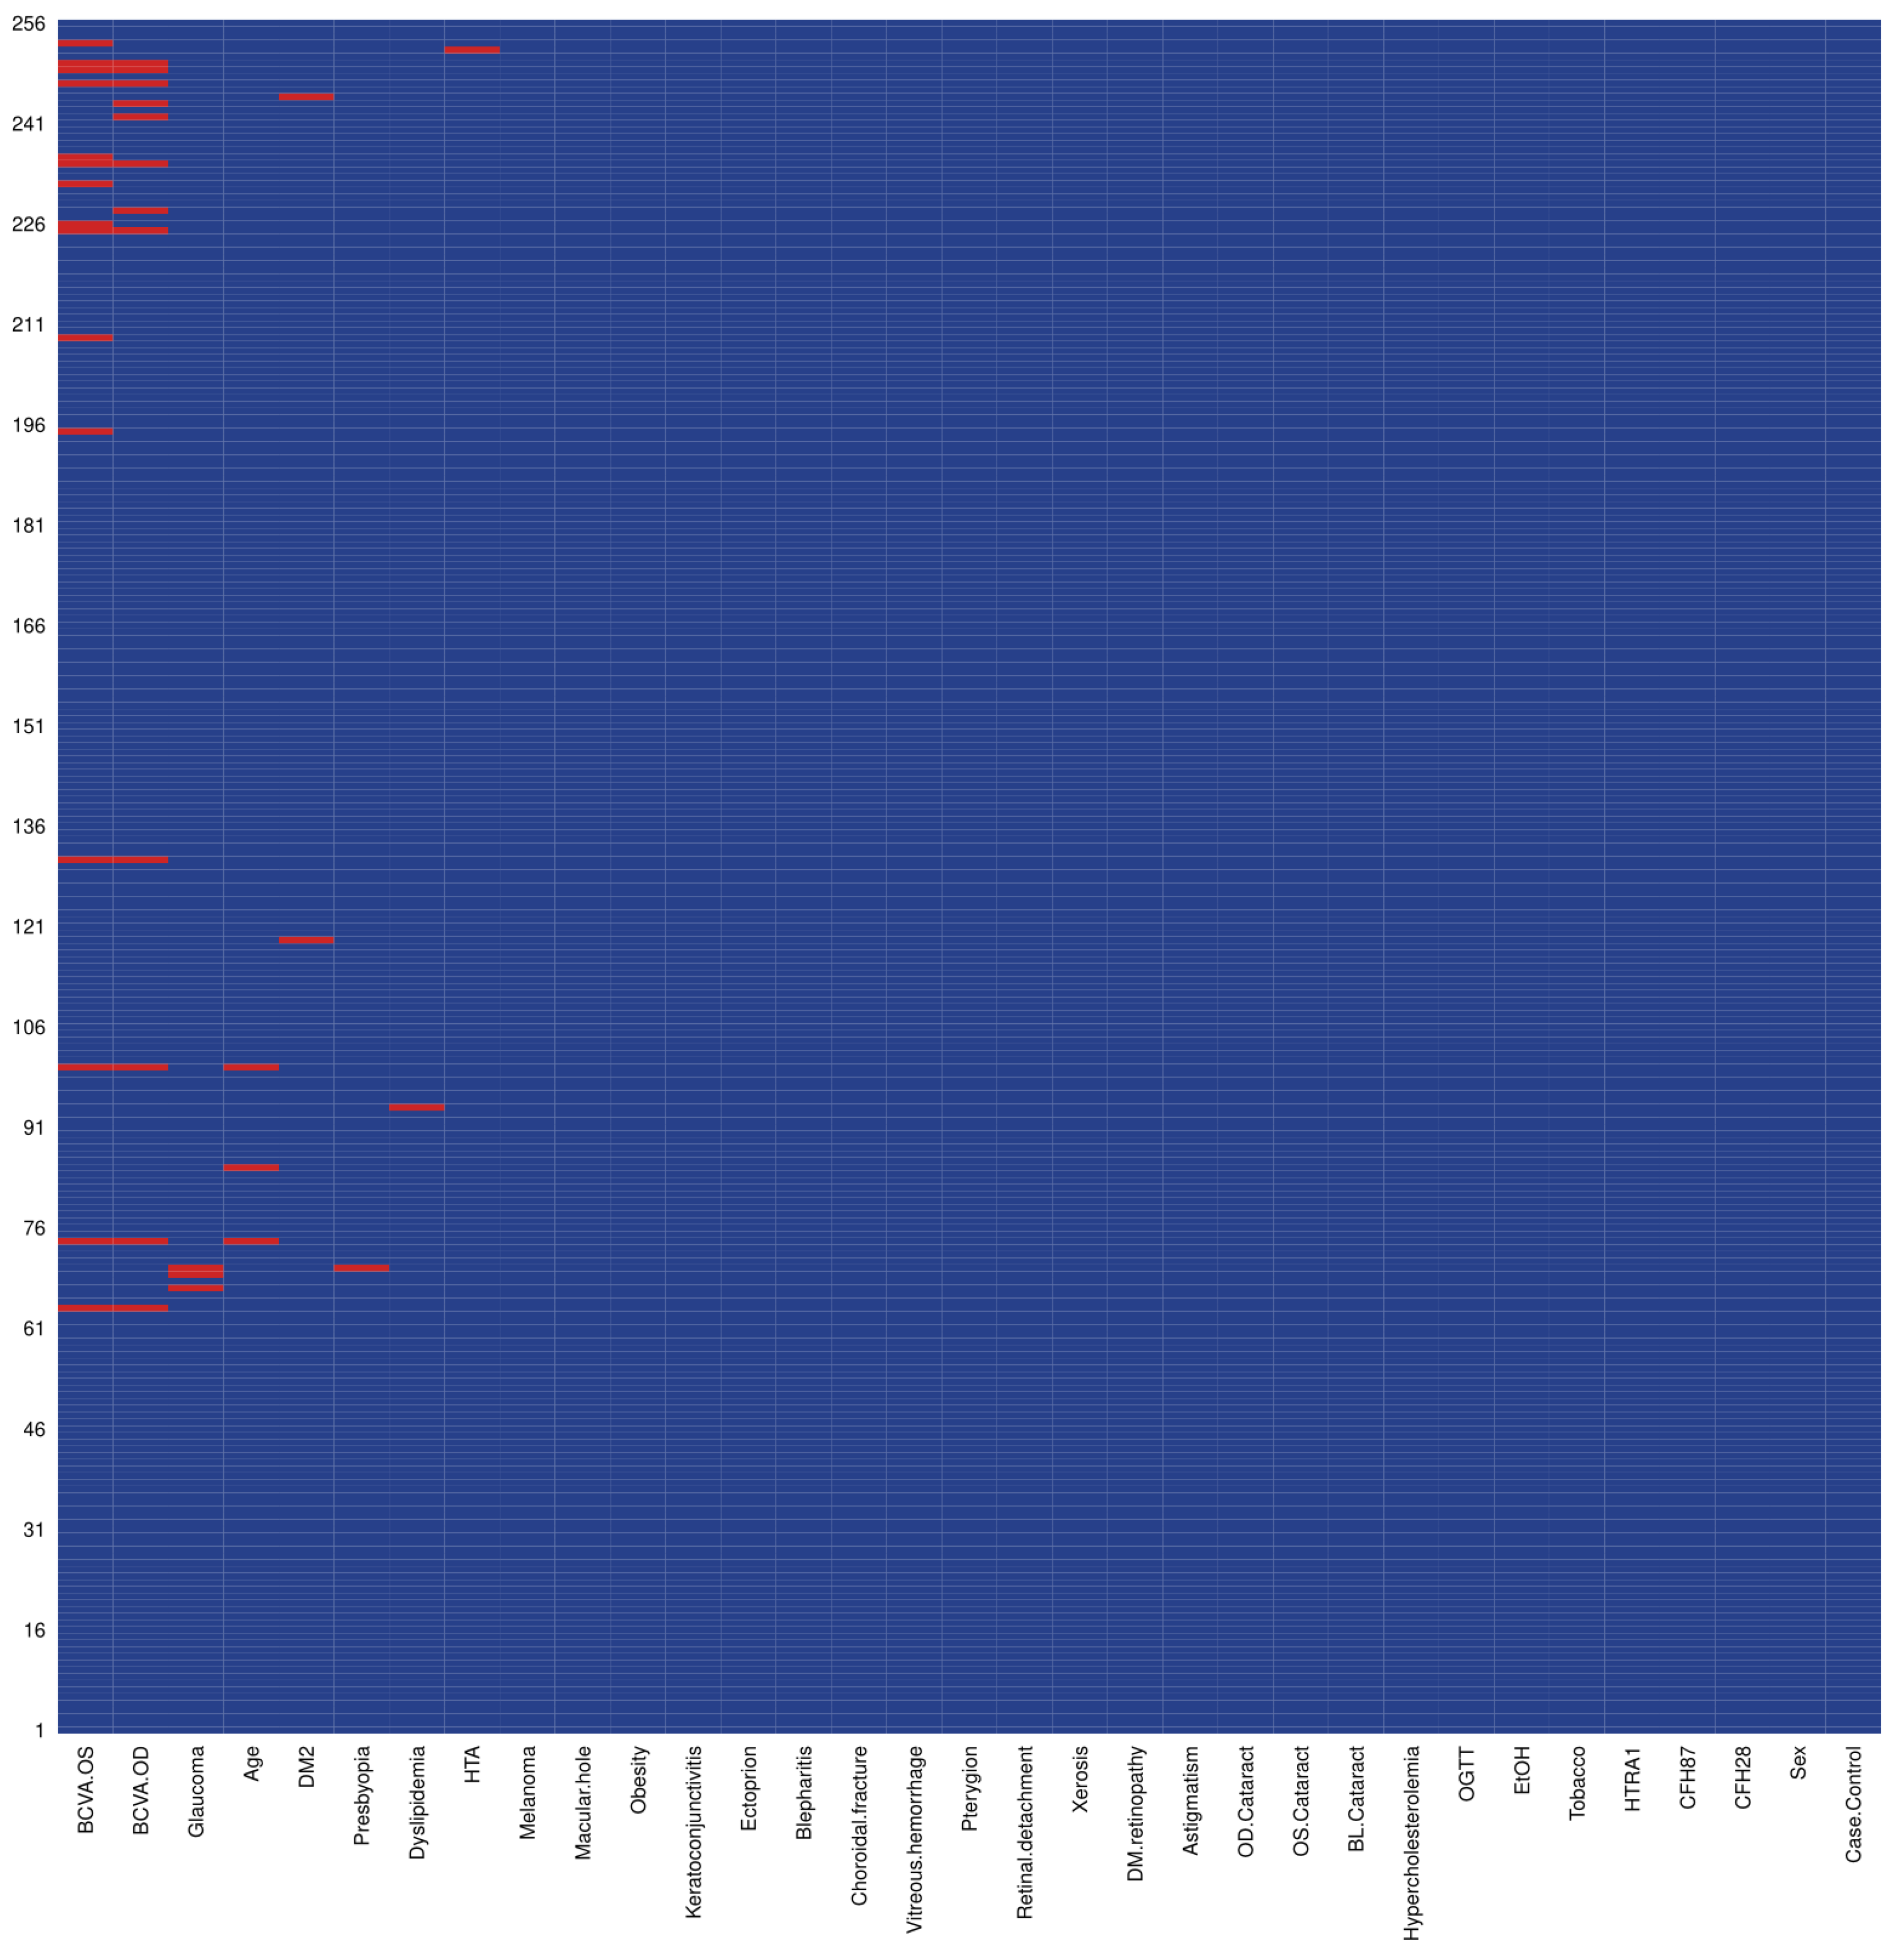
The database was constructed collecting two genetic variants (CFH1, CFH2), and demographic characteristics for AMD obtained from electronic medical records collected in the ophthalmological consultation of the participants. The collected features were: Bilateral cataracts, alcohol intake, pterygium, diabetic retinopathy, impaired glucose, diabetes, vitreous hemorrhage, age, obesity, sex, hypercholesterolemia, xerosis in both eyes, cataract right eye, presbyopia, astigmatism, smoking, macular edema, blepharitis, full posterior vitreous detachment in right eye, choroidal rupture, dyslipidemia, and ectropion. Missing data were handled by imputation, taking the median for continuous and mean for dichotomous variables. We conducted missingness analyses with the “Amelia” package in R v.3.5.1 and found less than 2% of blank data in our study. A missingness plot where we depict all blanks in our dataset is available in
Figure 1. To bolster our approach, we conducted sensitivity analyses and all our results are robust to missingness and our inferences are appropriate as with imputed data.
2.7. Machine Learning Procedure
We used machine learning methods to find the association between AMD and some risk factors, particularly focusing on bilateral cataracts. In order to begin the study and analysis of the data, it was necessary to prepare them. For this purpose, the dataset was preprocessed. The missing data were replaced by the average if they were numerical, and in case of being categorical, they were replaced by the mode.
Next, we conducted four different experiments using machine learning methods. The purpose of the first experiment was dimensionality reduction; analyzing the relevance of each feature with a random forest model. The aim of the second one was analyzing more deeply all features in order to select the fifteen features with more predictive power for the classification of individuals using the mean decrease in the Gini index (MDGI) metric from random forest models. This was done in order to verify if bilateral cataracts are among the most important variables. The third experiment consisted of a comparative analysis of ten different classification methods. The purpose of the classification is to offer diagnostic support to medical experts. Finally, the fourth experiment aims to show in an intelligible way how the results of the classification are reached.
2.7.1. Feature Selection
Once the data was prepared, we applied feature selection algorithms to remove both irrelevant and redundant attributes, and to identify the relevant variables for the classification task. In machine learning terms, a feature or variable is considered relevant or important if it is useful for the classification task. We also analyzed the importance of the variables using two different experiments: Recursive feature elimination (RFE) and the Boruta model.
In the first experiment, we applied the RFE algorithm for the identification of relevant features using RF as the evaluator [
19]. RFE is a recursive process that ranks features measuring their predictive power. Recursion is necessary because the relative importance of each feature can change substantially when they are evaluated on a different subset of features. Using the random forest classification method, uncorrelated and different predictions were made. Each tree uses a reduced sample of the training set. To improve the diversity among the trees, the algorithm works with randomness in the search of the attribute divisions. We assess the importance of each of the variables by means of the MDGI metric. The MDGI metric measures the proportion of incorrectly classified samples when the evaluated feature used to build the model is removed from the dataset [
20].
In the second experiment, we used the Boruta model [
21], in order to analyze in more depth the subset of fifteen best variables according to RFE. Using a small number of features decreases the training time, reduces the complexity of the model, makes it easier to interpret, and improves the accuracy.
Boruta is a heuristic procedure to find the characteristics with the greatest predictive power [
21]. Boruta creates randomly some variables and compares its performance with the real variables using the Z-Score metric. The Z-Score measures the relationship of an element with the class (the group for this dataset). For example, when the Z-Score is zero it means that the element score is the same that the rest of the group.
2.7.2. Classification
In the third experiment, we classified the dataset with the aim of supporting the diagnosis. Ten machine learning models were applied. Models were created with five repetitions and ten partitions. Based on the values obtained, we selected the best model to support the diagnosis of AMD.
Each classification method’s performance was evaluated using seven metrics described in [
22]: Receiver Operating Characteristic (ROC) curve, accuracy, average accuracy, precision, sensitivity, specificity and F
-score, as shown in Equations (
1)–(
6); where
and
are the true positives and true negatives,
and
are the false positives and false negatives and
l is the total number of dataset elements.
Those metrics were used to measure the performance of the models, in order to determine the ability of them to predict properly if a subject suffers from AMD.
From the considered metrics, sensitivity is very important for our problem. This has enormous importance for the medical domain, where models with high sensitivity are desired. Sensitivity is a measure that represents the proportion of people suffering from the disease that was correctly predicted. Thus, people who are ill were actually predicted as such. The higher sensitivity is, the higher number of true positives and the lower number of false negatives is. That is, the number of sick people who were predicted as healthy is less. The implications of predicting a sick person as healthy can involve a lack of attention to a disease, leading to serious conditions or in some circumstances, death. In the case of AMD, a subject detected as a false negative can lead to a lack of ophthalmological attention, worsening the conditions of those suffering from the disease.
The area under ROC curve (AUC) metric is used to determine the model performance. It is a probability curve, that explains how much a model is able to distinguish between classes. The ROC curve is created by plotting the true positive rate (TPR) against the false positive rate (FPR) where TPR is on the y-axis and FPR on the x-axis. While the sensitivity (TPR) measure is used to determine the proportion of actual positive cases, which were predicted correctly, the FPR (1-specificity) measure is used to determine the proportion of actual negative cases predicted correctly.
2.7.3. Interpretability
Interpretability is an important criterion when applying machine learning algorithms to real-world tasks. In the context of ML, interpretability is the ability to explain in an understandable way to a human why a decision was made by a predictive model. It is a subjective concept, and is affected by the knowledge domain in which one is working [
23].
In particular, it not only deals with the question of how a learning task can be solved in an interpretable way, but also how to integrate the trade-off between conflicting goals such as accuracy and interpretability into a single framework [
24].
Interpretability is essential because medical experts need to interpret the results of the model. Ideally, they should trust and understand machine learning results. Moreover, they should not be experts in data science to understand the results. Therefore, showing visual structures and relationships in a dataset generally makes it easier to understand [
25]. The models should provide explanations of why or why not a patient has been diagnosed by a model with a certain disease so that the specialist can verify that it makes sense and be convinced of the results.
The fourth experiment was designed for the purpose of improving the interpretability of our results. We built a decision tree using the three most important variables according to the Boruta method [
21]. The main advantage of the decision tree is that it helps to present the information in a comprehensible manner, which supports the interpretation of the results.
3. Results
In this section, we present the results obtained in data genotyping and in each of the four experiments described above.
3.1. Characteristics of the Study Population and Genotyped Data
We studied 256 individuals, 119 were diagnosed with AMD. The genotype distributions for CFH1, and CFH2 single nucleotide polymorphisms (SNPs) is fully detailed in
Table 1. In this bivariate analysis, the CFH1 SNP is significantly associated with AMD. Nonetheless, the CFH2 SNP is not significantly associated with the disease. To test if any of the clinical characteristics were significantly associated with the case/control status, we performed stratified analyses, portrayed in
Table 1.
Numbers may not sum to total due to missing data, and percentages may not sum to 100% due to rounding.
Table values are mean ± SD for continuous variables and n (column %) for categorical variables.
P-value is for a Student’s T-test (continuous variables) or Chi-square test (categorical variables).
CFH: Complement factor H for probes 1 and 2
3.2. Feature Selection
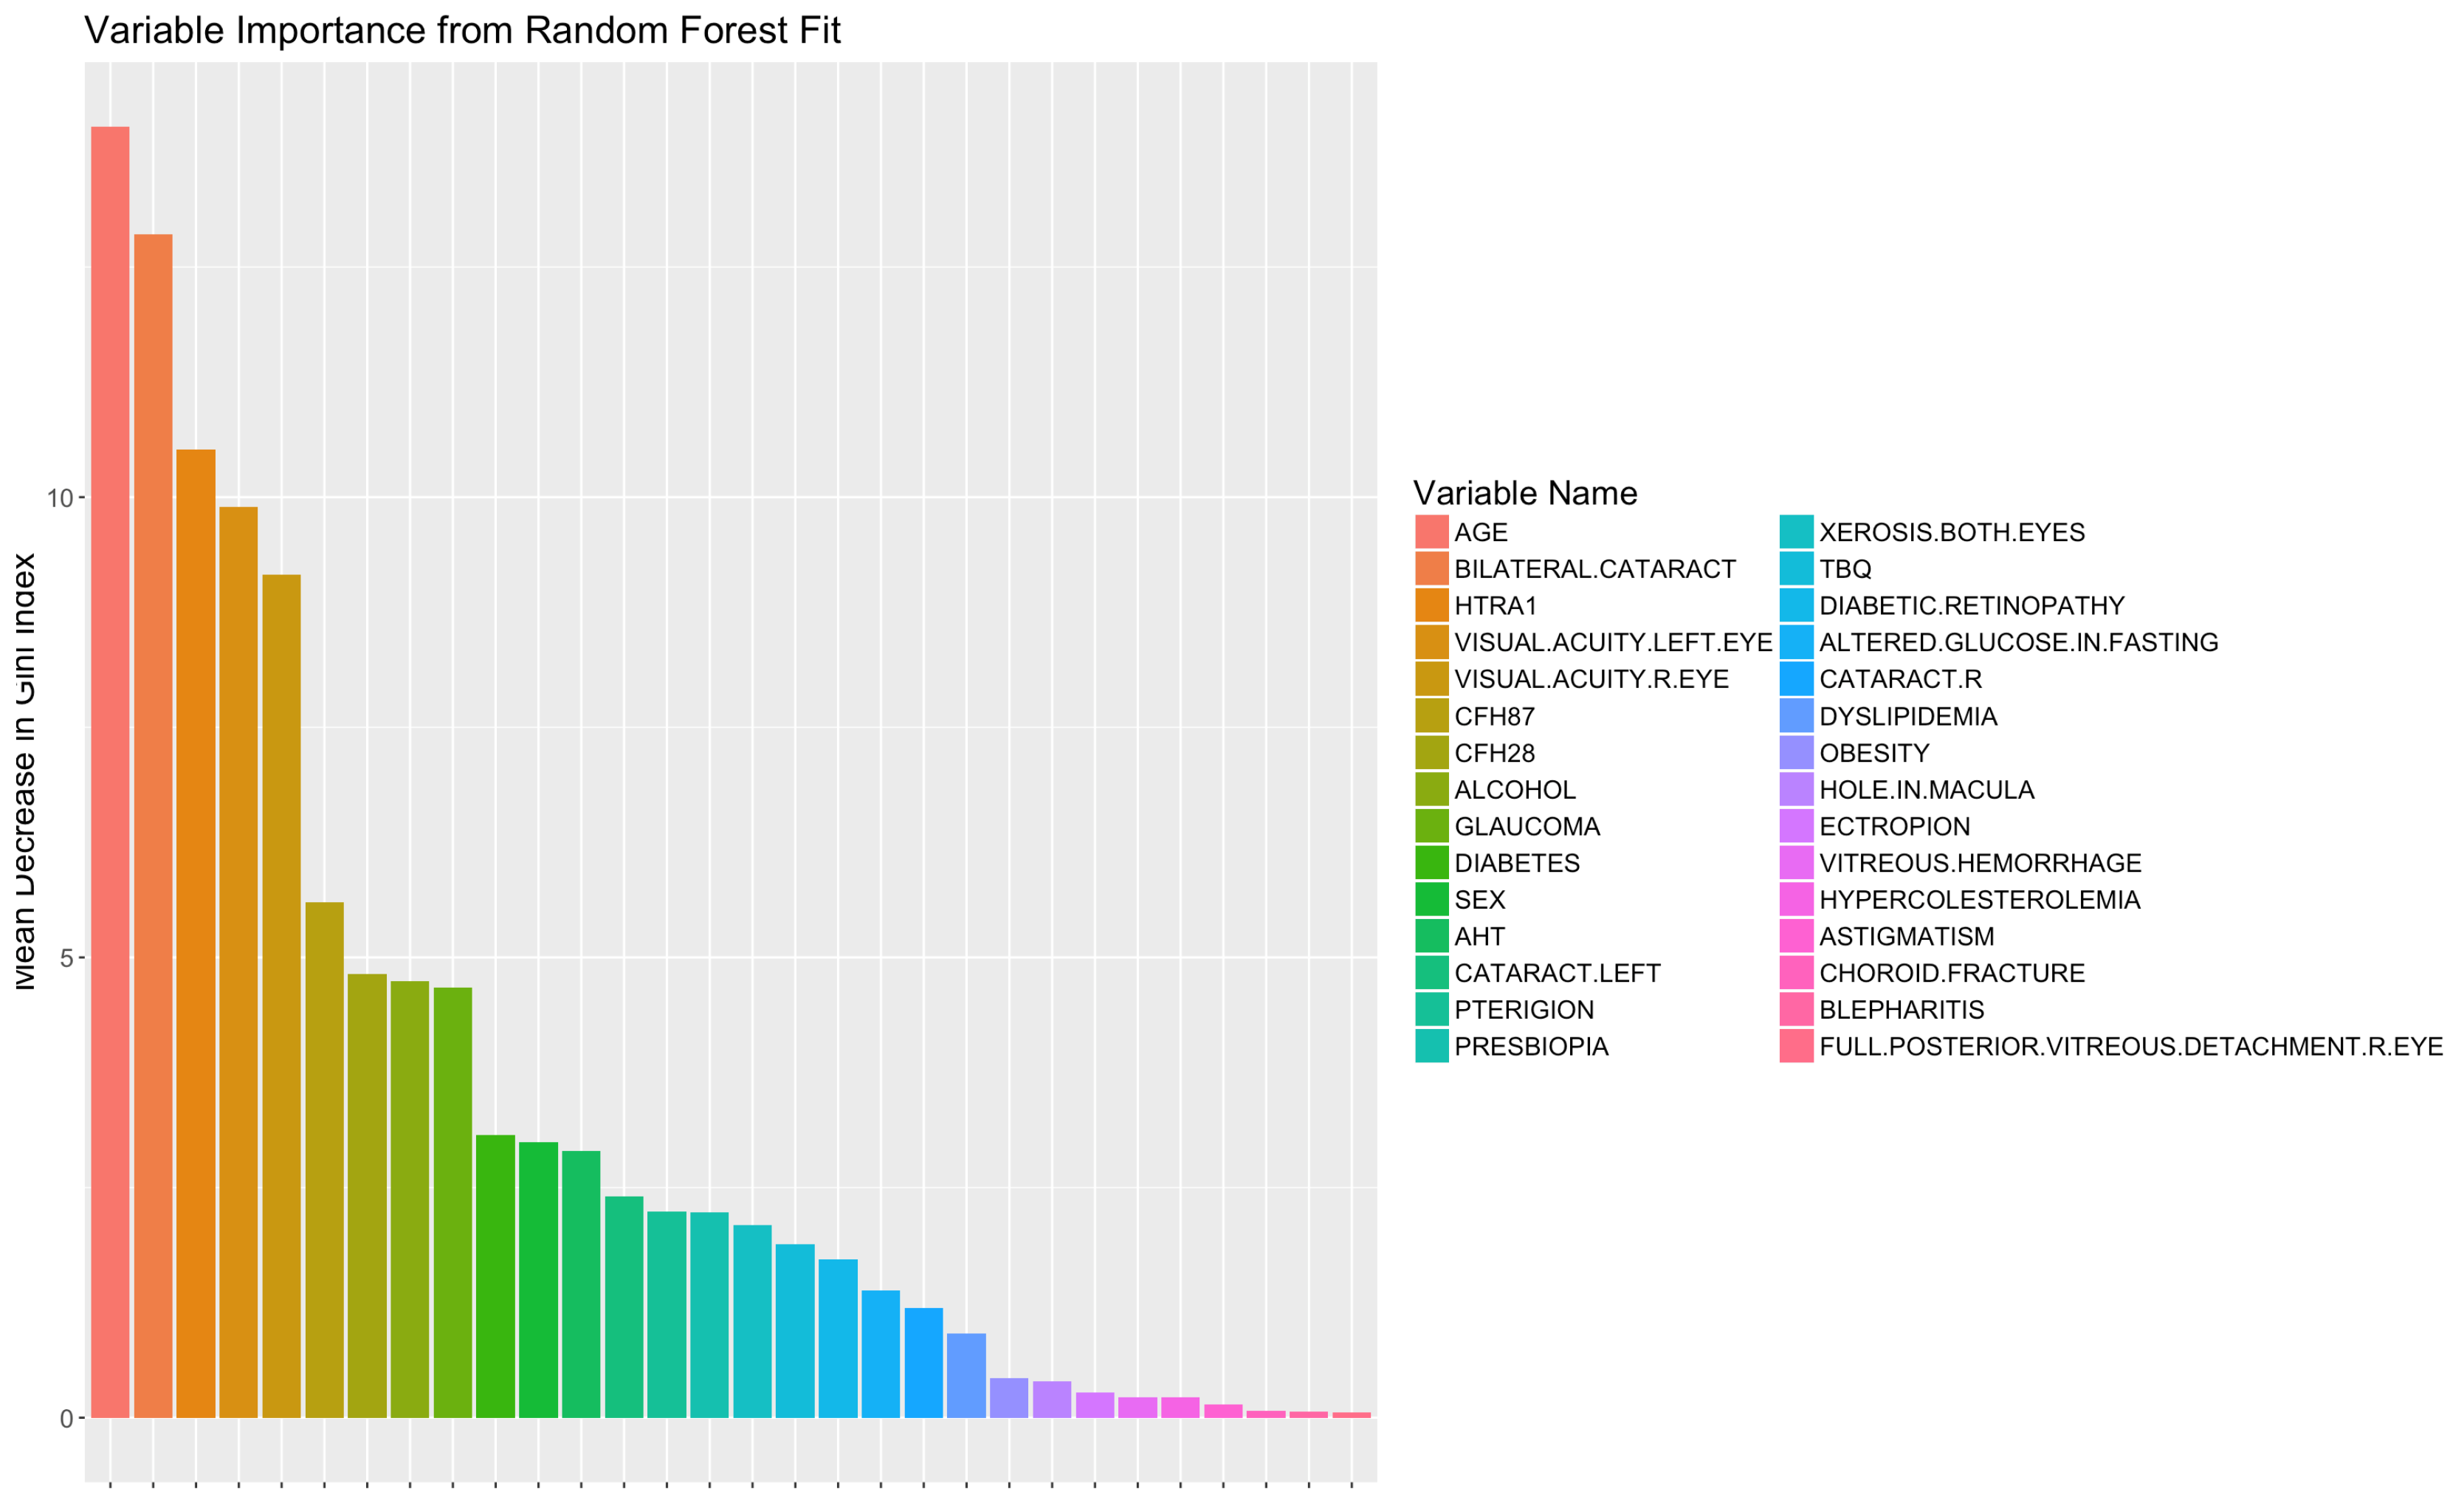
In the first experiment we analyzed the predictive power of the variables for classification using RFE with RF method. According to this method, the fifteen characteristics with the greatest predictive power were: Bilateral cataracts, visual acuity left eye, age, visual acuity right eye, CFH2 genetic variant, history of alcohol use, CFH1 genetic variant, diabetes, glaucoma, pterygium, altered glucose in fasting, cataract left, xerosis, tobacco use, and sex, as shown in
Figure 2. This means that those variables are the ones that have the most impact on the diagnosis of AMD.
In
Figure 2, features are listed from high to low according to their relevance and predictive power. The MDGI value of each variable is scaled in the range [0, 100].
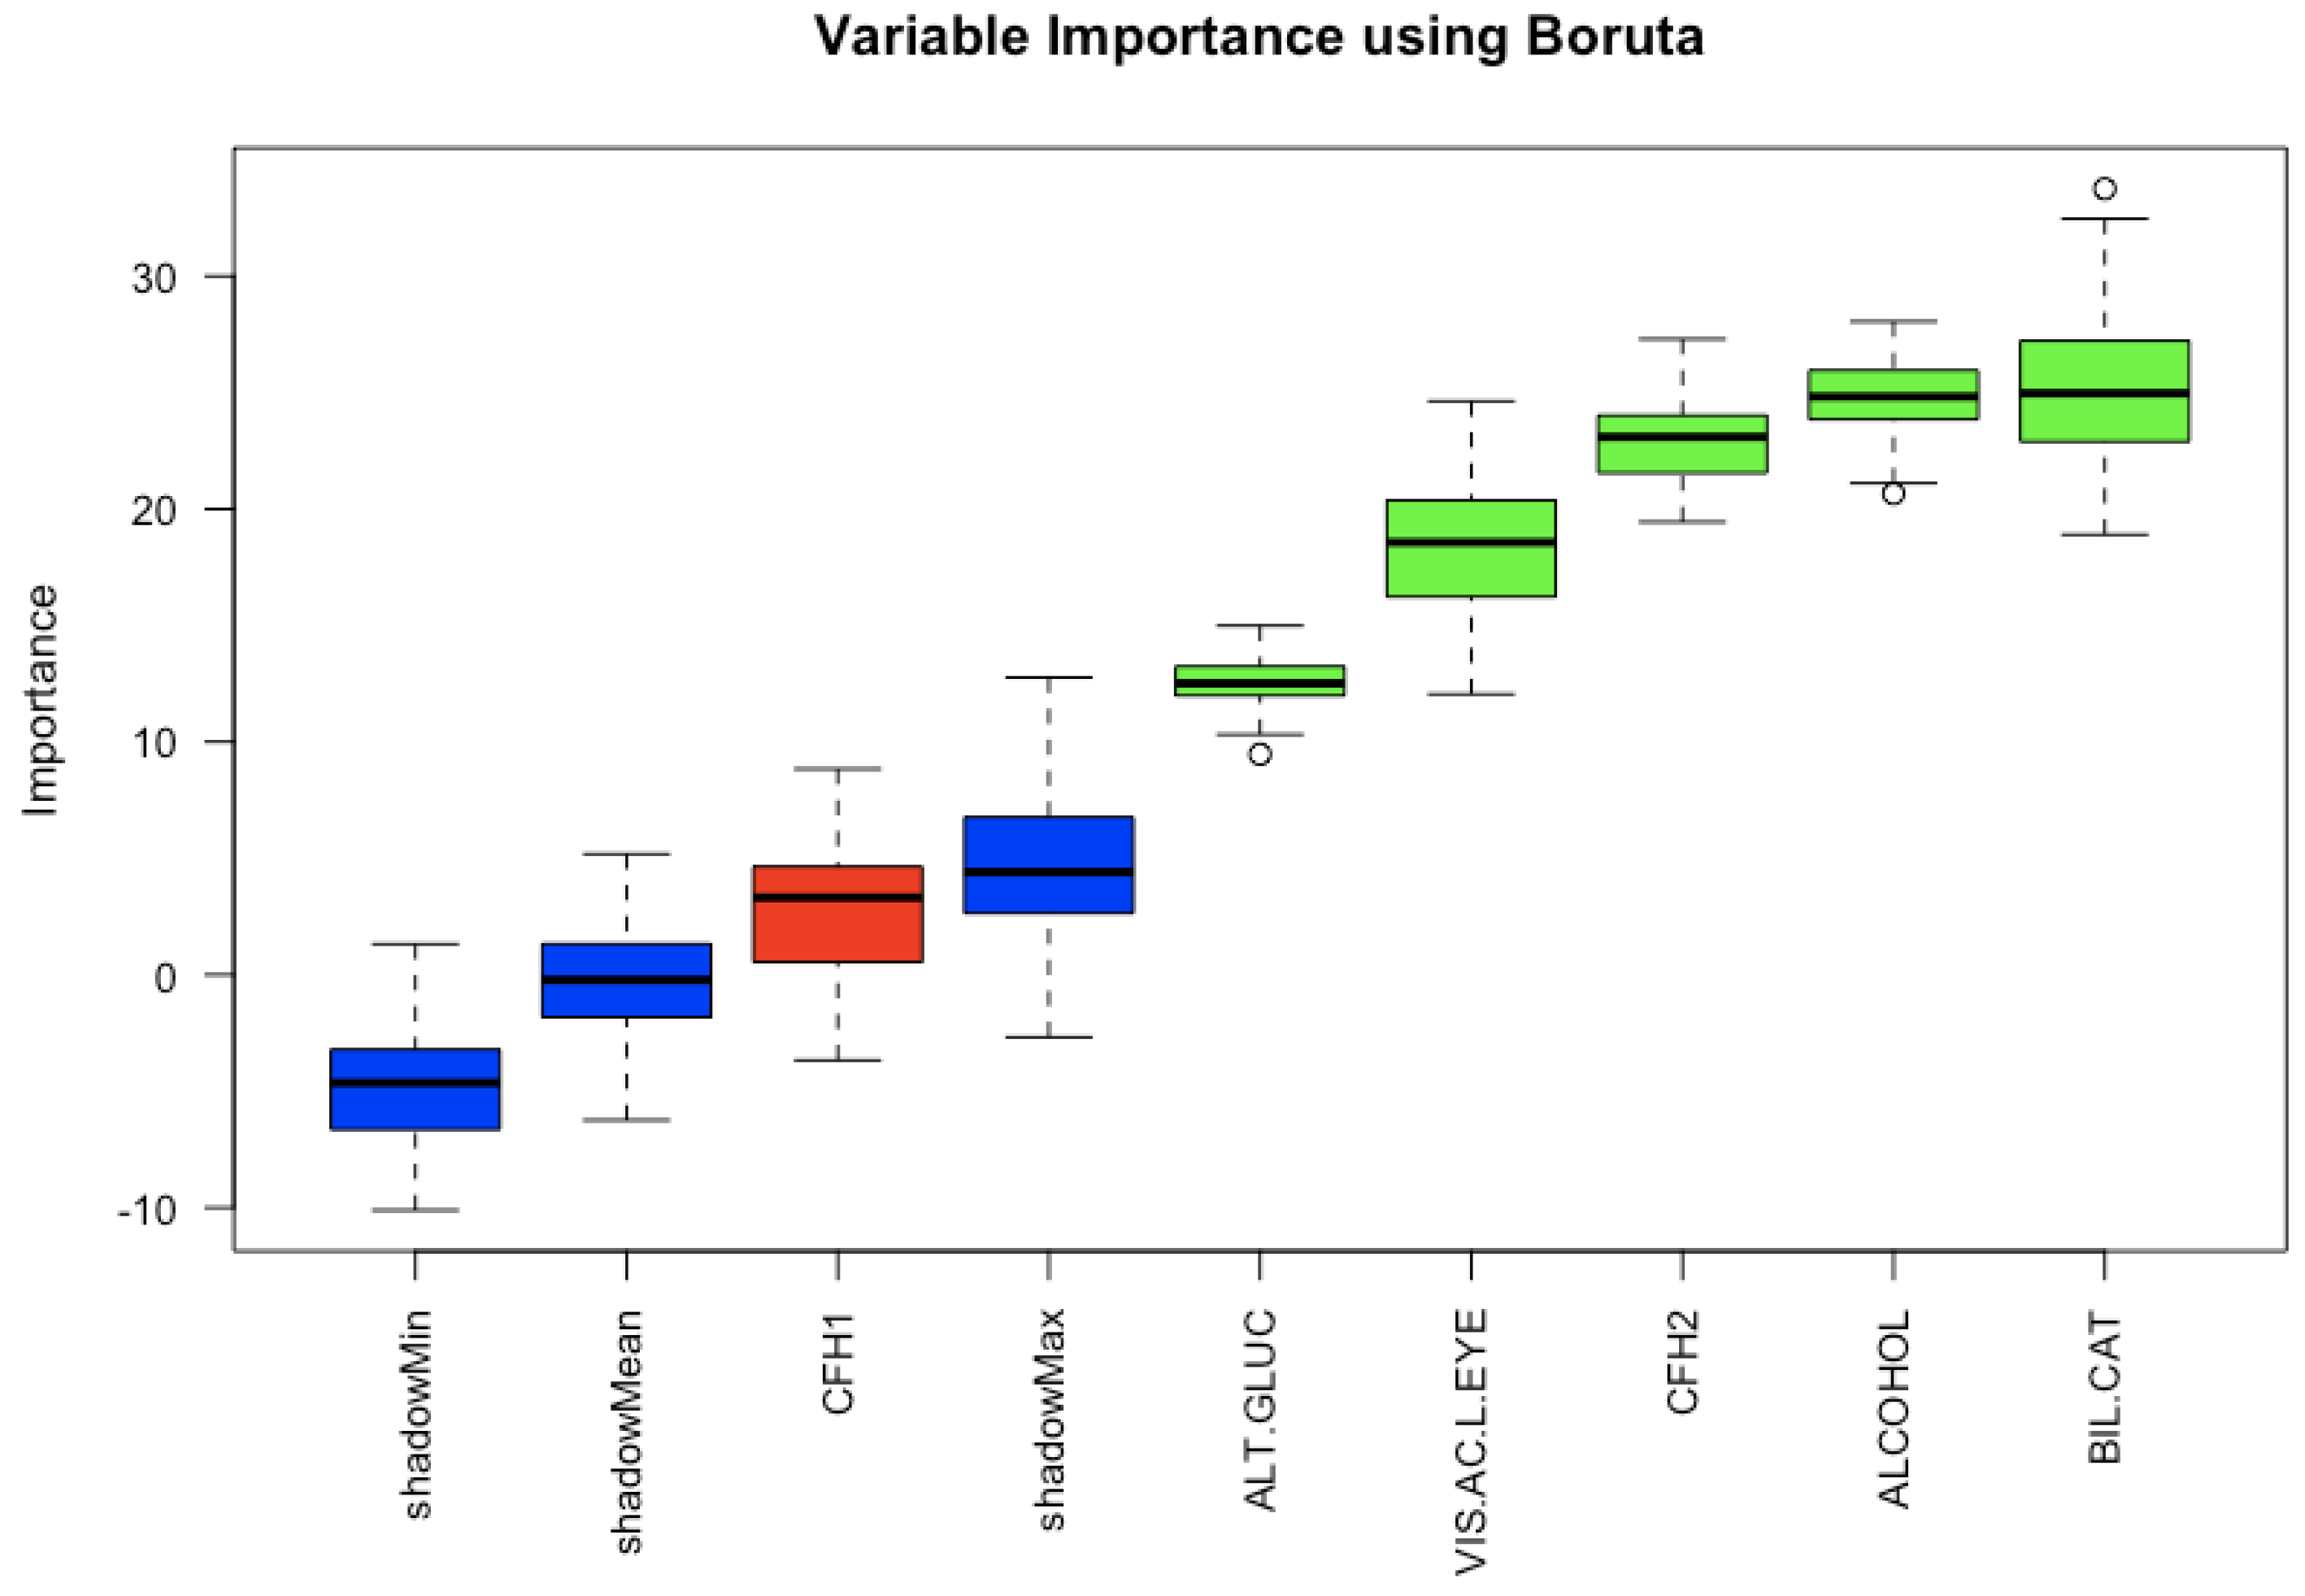
In the second experiment, we performed a deeper analysis for the estimated fifteen most important variables for RFE with the RF method. The analysis was done in greater depth with the Boruta method [
26].
The results of analyzing the fifteen most important variables according to the random forest method using the Boruta method is shown in
Figure 3. The box plots in blue colour represent the Z-score of shadow variables. The red box plot represents the discarded variables, and the green box plot values represent the variables that have been confirmed. According to this analysis of the fifteen variables, bilateral cataracts is the one with the most predictive power to determine if a subject will develop AMD. It is important to notice that this feature results as a good feature to discriminate if a person will have AMD, but this does not mean that bilateral cataracts is a risk factor for the disease.
3.3. Classification
In the third experiment we compared the performance of ten ML classification algorithms to select the one that makes the most appropriate classification.
In general, it is accepted that a probability greater than 0.5 is an adequate value to predict whether the example is part of a class, and if not, it is part of another class. The resulting values for all methods are presented in
Table 2. The best value for the ROC metric was 83.51% with RF and for the sensitivity was 72.90% with K-nearest neighbors. The model with the best performance was K-nearest neighbors which outperforms the other models considering the four metrics.
These results of classification are acceptable given that our dataset has only 256 examples. Learning from a few samples is still one of the most important machine learning challenges, given that ML methods sometimes require tens, hundreds, or thousands of training examples [
27]. Hence, similar results were obtained with other classifiers. In our results, sensitivity presents a relatively high value, especially for the ML methods shrinkage discriminant analysis, neural networks with feature extraction, and random forest. This means that there are a small number of false negatives, which represents that the persons suffering from the disease were correctly classified.
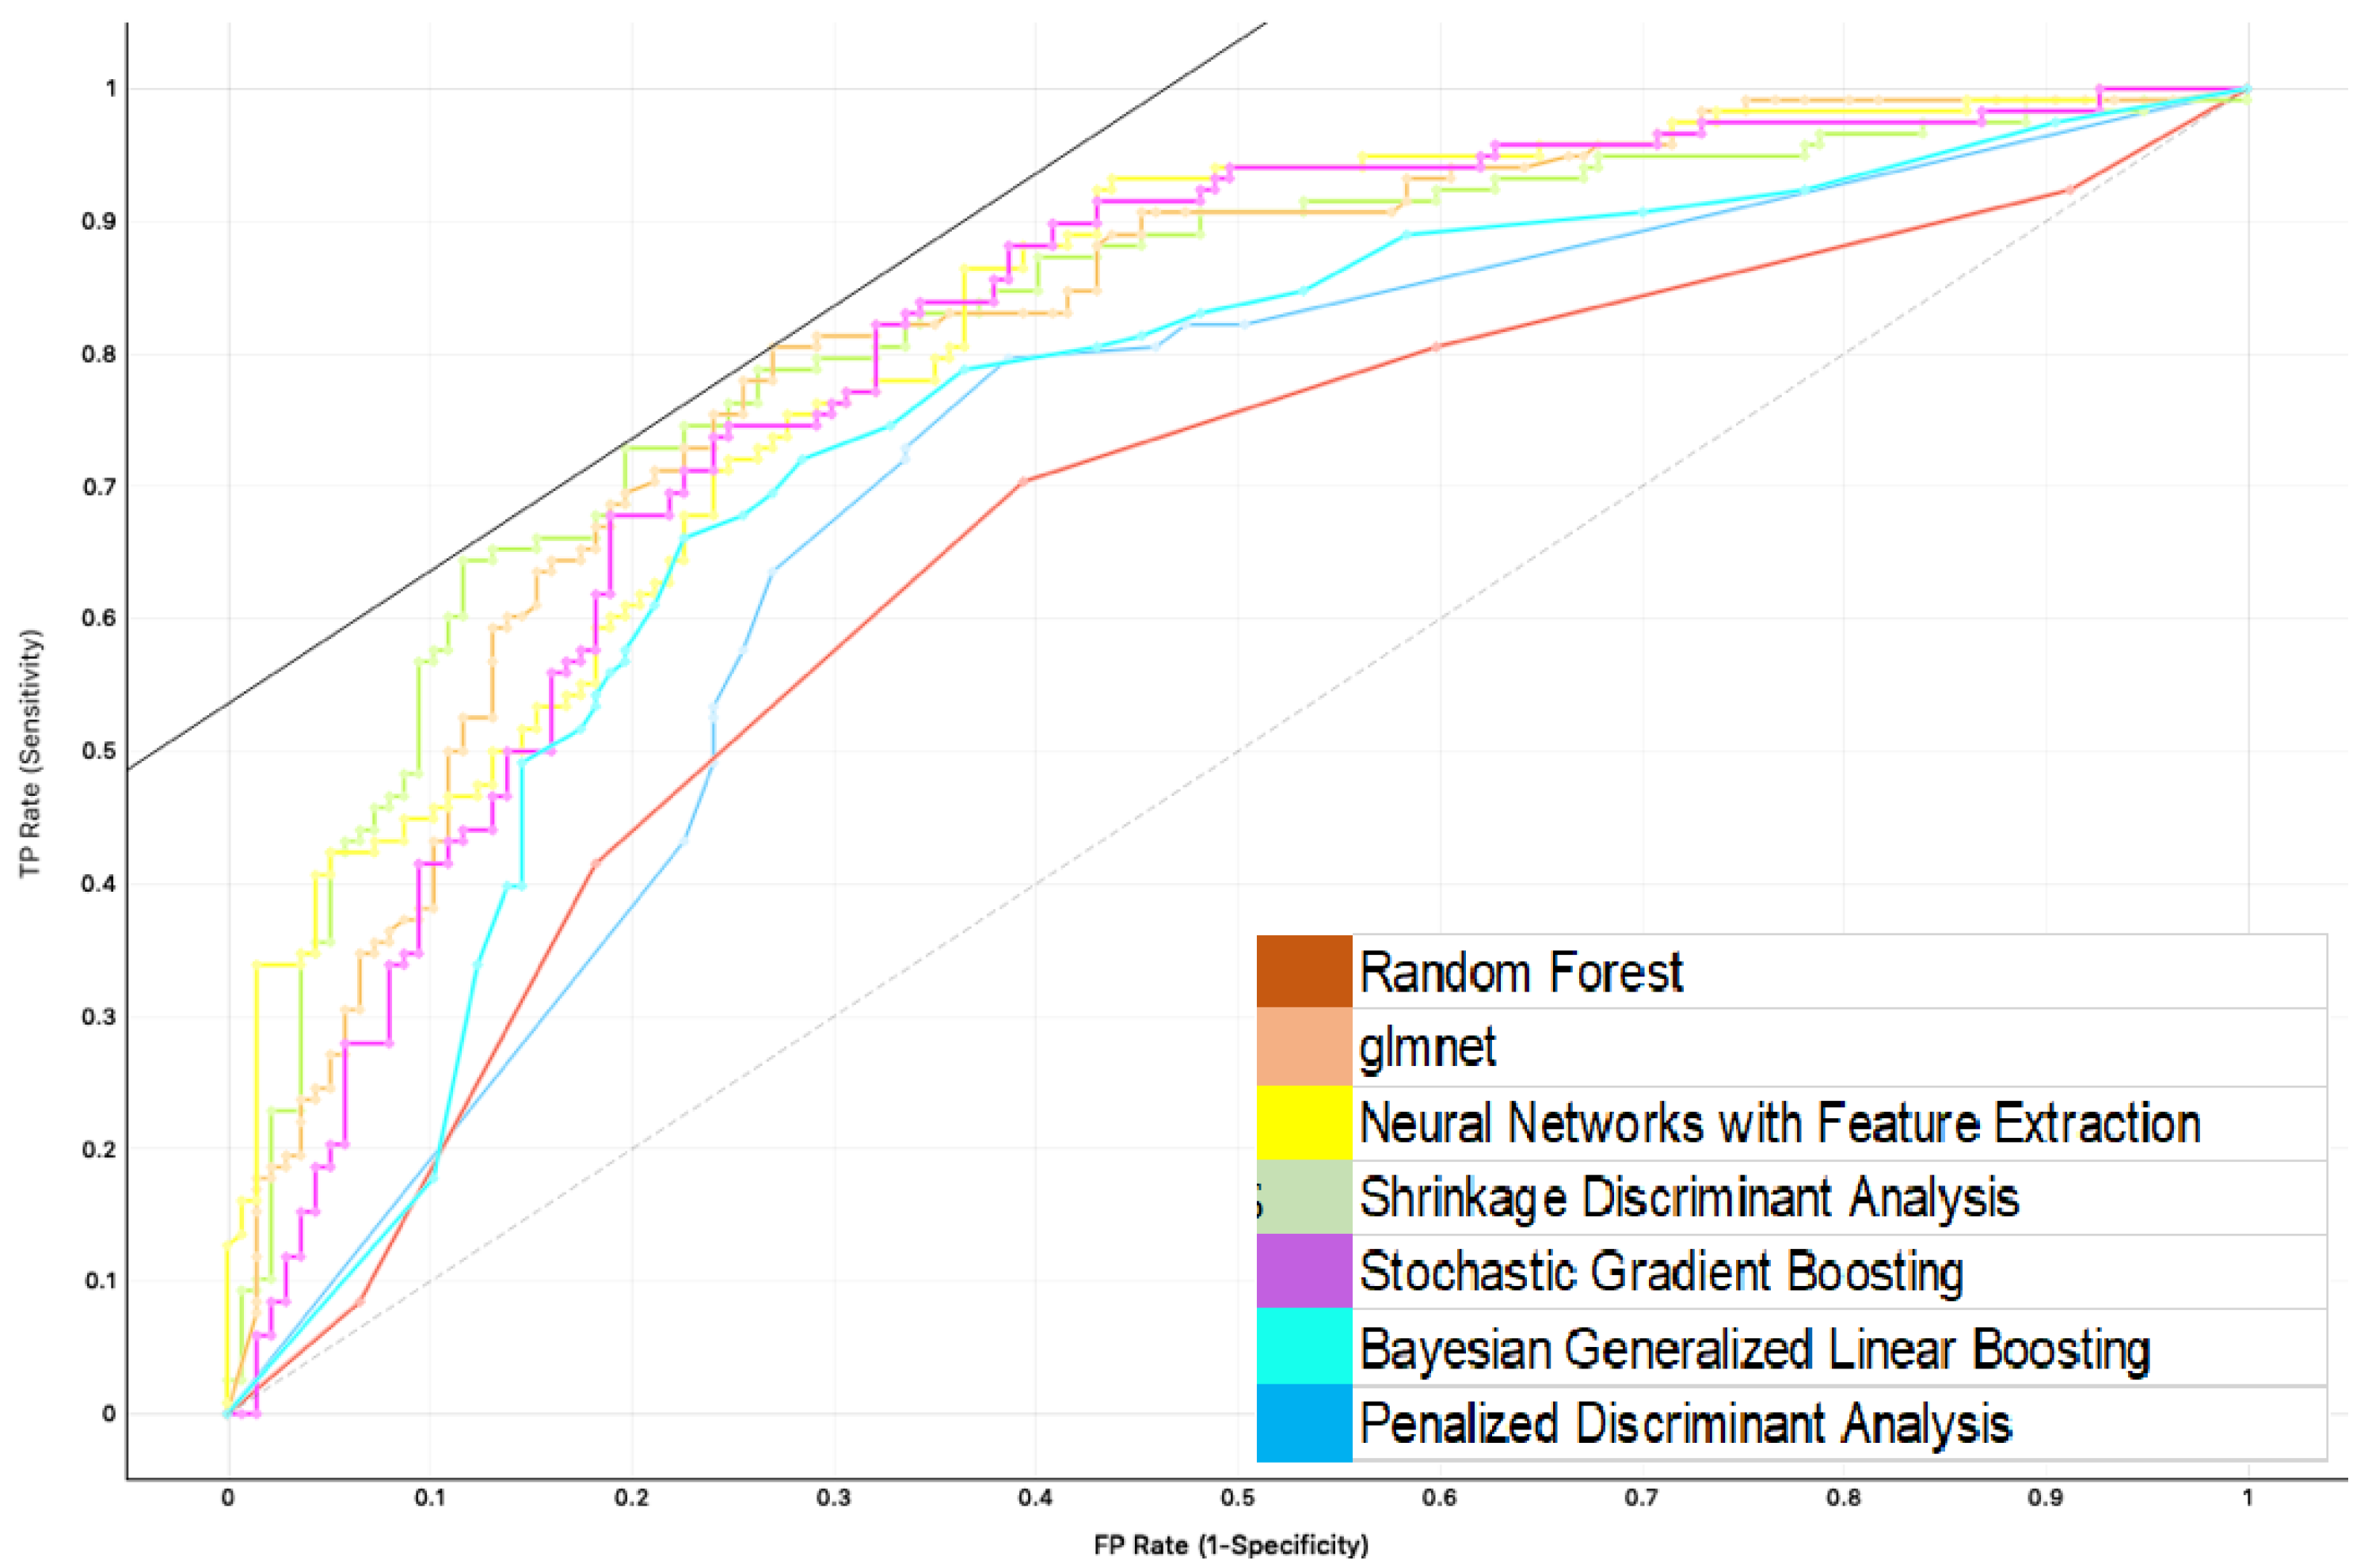
Additionally,
Figure 4 shows the graph corresponding to the ROC metric for the cases in which the class variable was correctly predicted. That is to say, the subject suffers from AMD. The ROC figure represents a scenario with acceptable sensitivity. It shows that the best models for the ROC metric are random forest (0.8351), Glmnet (0.8188), neural networks (0.8185), shrinkage (0.812), stochastic gradient (0.8118), Bayesian generalized linear model (0.8111), penalized discriminant analysis (0.8086).
3.4. Interpretability
In the fourth experiment, we built a decision tree to improve the interpretability using the variables with greater predictive power according to the Boruta method. The main advantage of decision trees is that they clearly show the procedure to achieve the classification results.
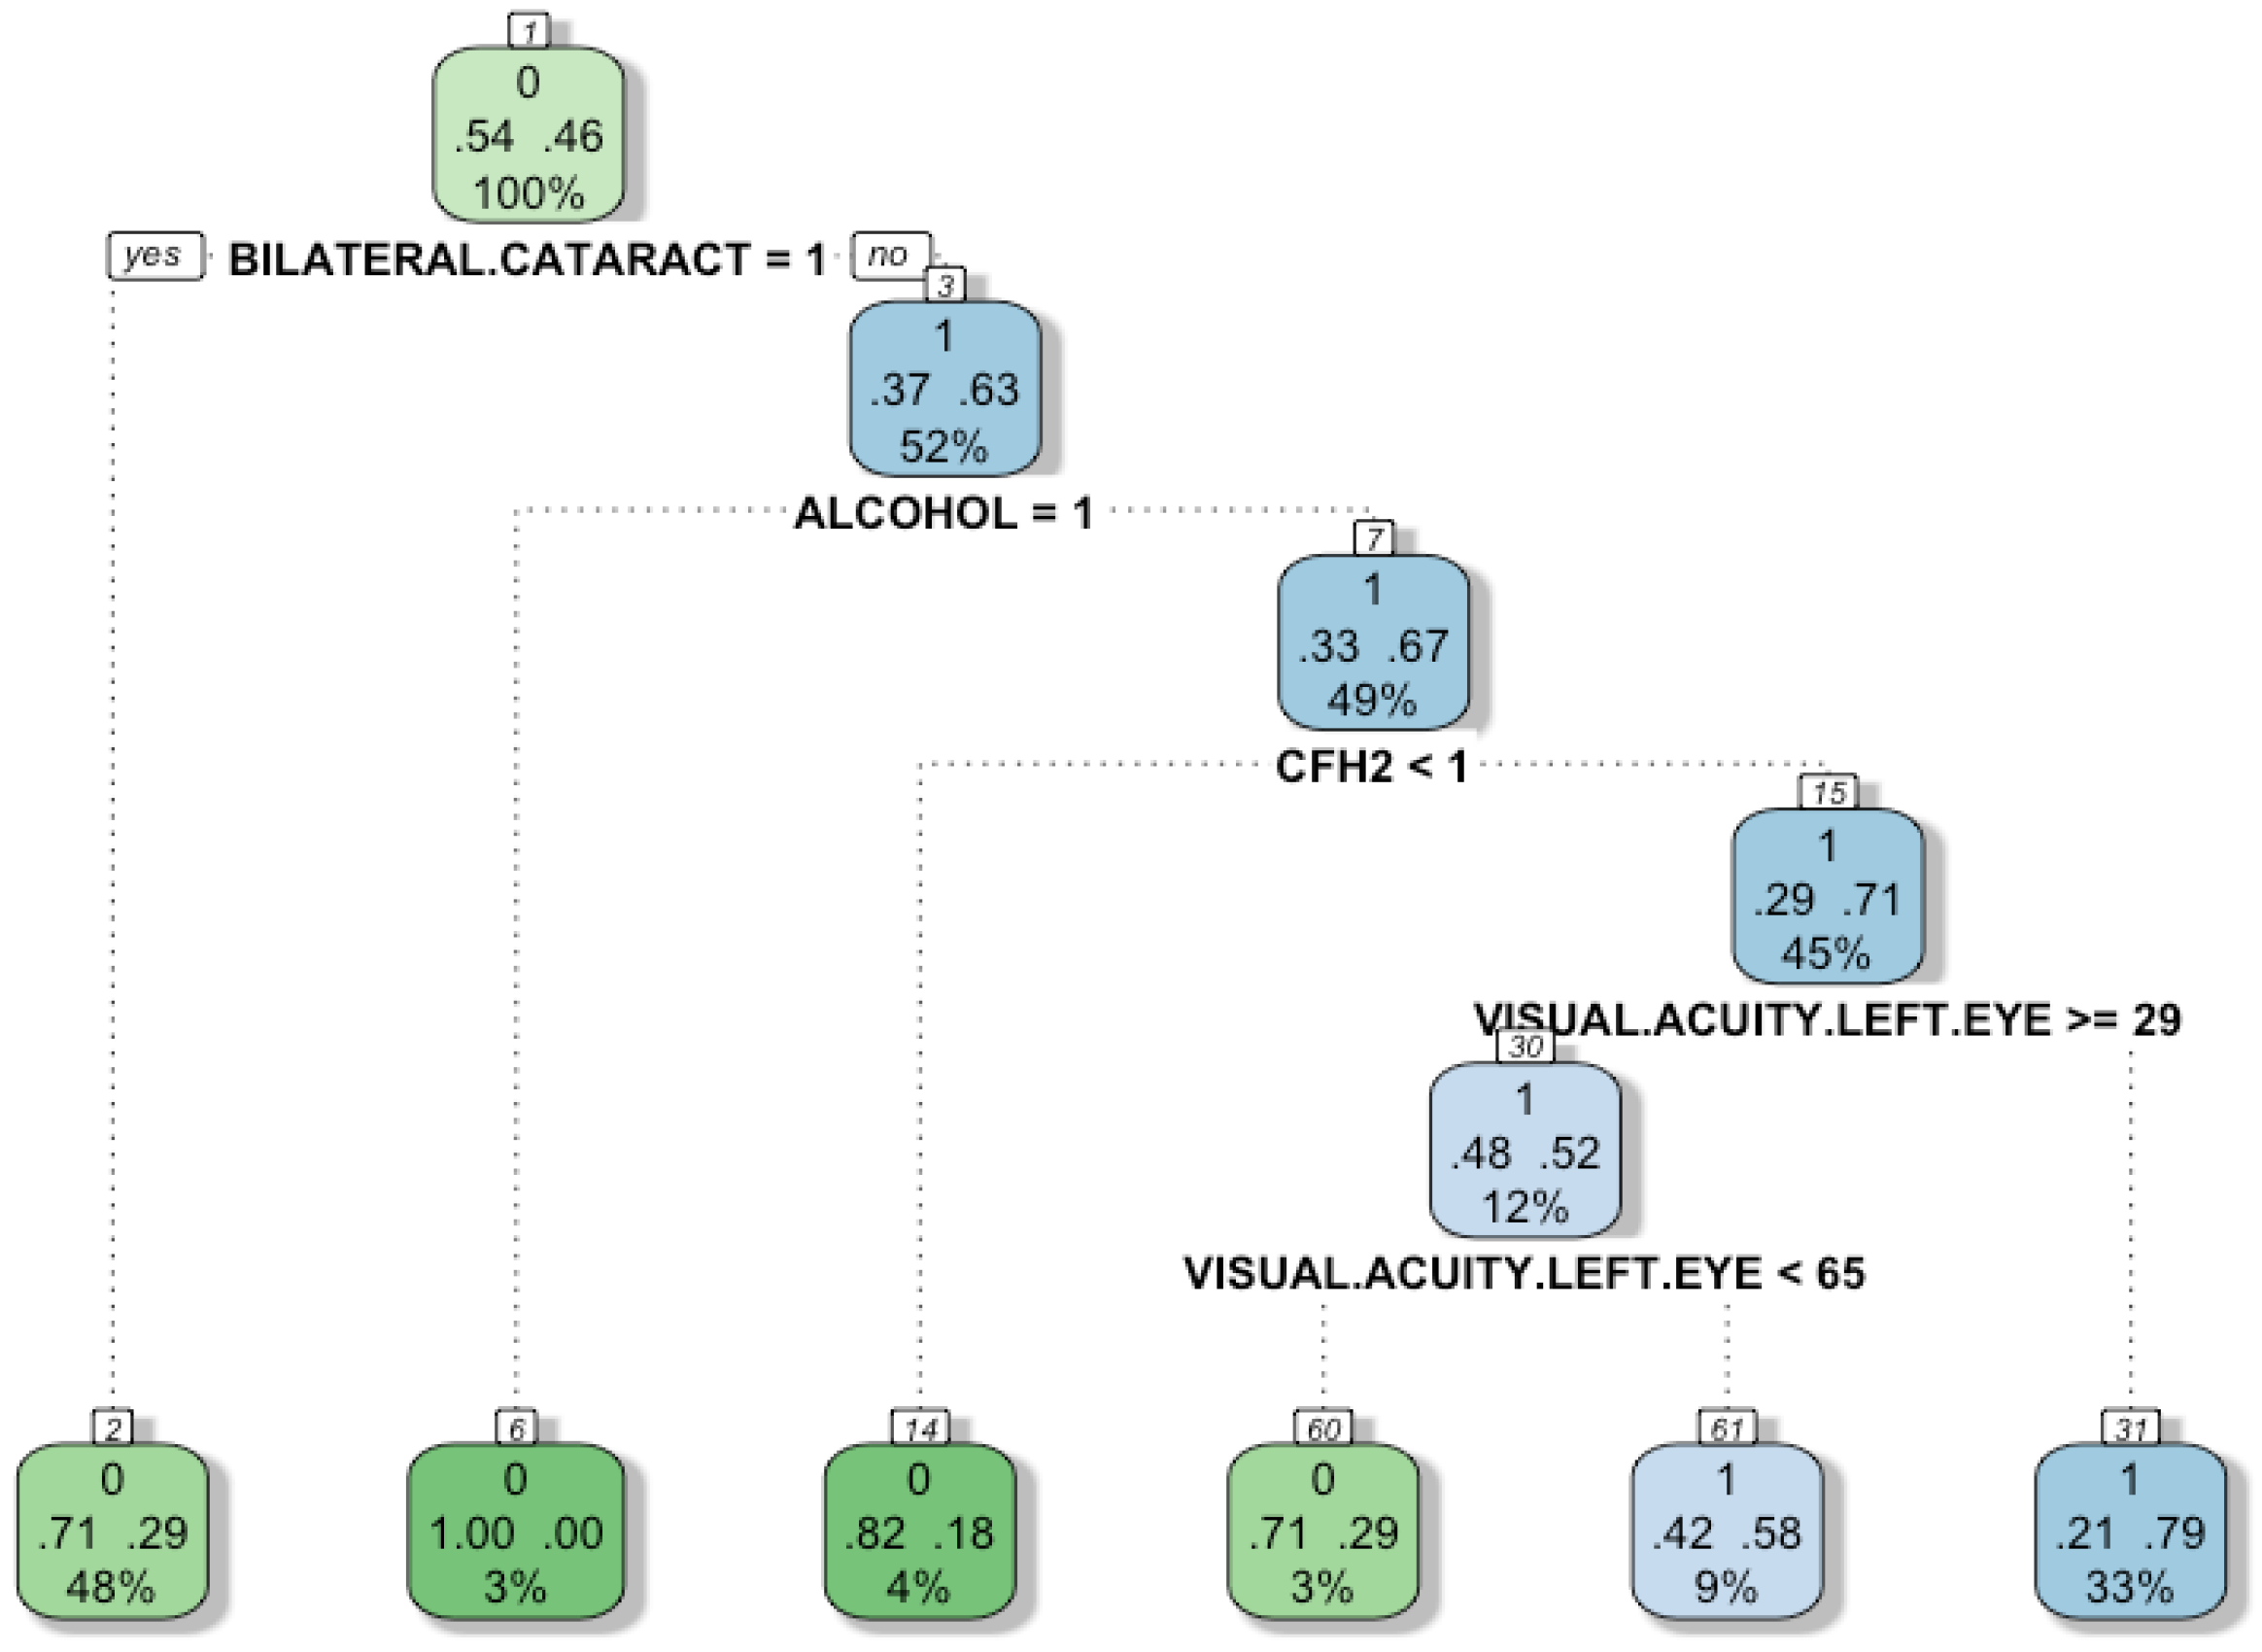
Figure 5 shows a decision tree to classify individuals according to a set of attributes. A decision tree can display visually the rules to classify the subjects, which are very intuitive. Ideally, the decision tree will have a low number of attributes (trying not to compromise the performance of the model), so that users can understand the logic behind the model. There are four characteristics used in the model: Bilateral cataract, alcohol-intake, CFH2, and visual acuity in the left eye. The leaves of the tree (final nodes) represent the group to which each individual belongs. The green colour represents the group “0”, that is, those subjects who do not suffer from the disease. On the other hand, to classify the sick individuals (group “1”) the blue colour is used. Each node has three different rows, the number in the first row indicates the group, the two numbers in the second row indicate the probability of a successful or unsuccessful individual classification (the higher the colour intensity of the node, the greater the probability of correct classification). Finally, the number in the third row represents the proportion of individuals covered by the node. The tree is interpreted as follows: The first node corresponds to the bilateral-cataracts variable, which was found to be the most important variable according to our previous analysis. Then, if the attribute called bilateral-cataracts is equal to 1, the algorithm moves to the left; otherwise, it goes to the right.
In the first node, the left 0.54 represents that 54% of the subjects do not have AMD, and the right 0.46 represents that 46% do have AMD. The instances to which this condition applies have a 0.71 probability of belonging to the group “0” (healthy subject) and 0.29 to group “1” (sick subject).
The first division corresponds to the alcohol-intake feature. If the variable is “1” as is written at the top of the node, 37% of the subjects are not sick. When the alcohol-intake is “0”, 63% of the subjects suffer from the disease. The second split corresponds to the CH2 feature, if its value is “0”, then 33% of the subjects do not have AMD and 67% of them suffer the disease. Next, the division is based on the variable visual acuity left eye, if it is greater than or equal to 29, then 71% subjects suffer from AMD. Otherwise, when the variable is less than 29, and if it is also less than 65, then 48% of the subjects are healthy and 52% have AMD.
An important finding is that although the subject does not suffer Bilateral-cataract, alcohol-intake and CFH2 are risk factors for the disease. The decision tree shows that most of the subjects suffering from AMD do not have bilateral cataracts. This suggests that it is likely that bilateral cataracts will not be a risk factor for the disease. Nevertheless, further experimentation is needed to conclude that the association does not exist given that the dataset is small. While it is not a risk factor, it is still a relevant feature for diagnosis support.
4. Discussion
According to our experiments, there is no association between cataracts and AMD in the Mexican population. This confirms the conclusions of other studies such as that Klein et al. [
28], in which it is claimed that there is no association between cataracts and AMD.
In the feature selection process, we proved the relevance of bilateral cataracts, alcohol-intake, CFH2, visual acuity in the left eye, and CFH1. The obtained results are consistent with previous findings in medical research that determine these same variables as risk factors for AMD [
6,
9].
An important challenge to overcome in the studies made with machine learning is that sometimes health professionals do not trust them because it is not clear to them how the results were obtained [
29]. The higher the interpretability of a model, the easier it is for someone to understand the logic behind the decision models. Regarding interpretability, we present graphic interpretations obtained from the dataset. We present a decision tree based on the four variables with the highest predictive power to guide the process to determine the probability of suffering from AMD.
It is also worth noticing that CFH1 was not categorized as a relevant feature. This fact at first glance can cause conflict given that CFH1 is a well-known AMD risk factor [
30]. Nevertheless, Boruta’s method correctly determines that, out of the fifteen characteristics with the greatest predictive power, for this dataset, the CFH1 feature has the least predictive power.
5. Conclusions
In this work, we considered two genetics variants and electronic medical records to analyze the association between cataracts and AMD. The data to study the relevance of bilateral cataracts in AMD diagnosis was extracted from the Mexican population.
Our results through a machine-learning approach unbiasedly linked age-related macular degeneration with cataracts. The association between these two variables is an ongoing discussion with multiple publications supporting or contradicting these findings. Unsupervised machine-learning could provide novel insights, such as ours, into this discussion. With the results of our study, we agree with the position that cataracts are not a risk factor but confirm that it is an important variable to identify the disease.
The external validity of our study is applicable for Hispanics from Mexico. We included cases and controls from an ongoing cohort that is representative of our population since Conde de Valenciana hospital is a tertiary care facility which treats patients from all states from our country. The pathologies we assessed here are in the same proportion to those reported in the Mexican NHANES study (ENSANUT).
Further studies are suggested in order to conclusively determine the association between cataract and AMD. In particular, an analysis of the influence of cataract surgery in the development of AMD is needed. It is also important to enhance the number of samples in different ethnic groups to be able to generalize the knowledge about the association of cataract and AMD.
Author Contributions
Conceptualization, L.M.-V., A.M.-V., A.C.P.-O.; methodology, L.M.-V., A.M.-V., J.C.Z., F.J.E.-M., A.C.P.-O.; validation, L.M.-V., A.M.-V., F.J.E.-M., A.C.P.-O.; formal analysis, L.M.-V., A.M.-V., A.C.P.-O., L.M.-P.; investigation, L.M.-V., A.M.-V., A.C.P.-O.; resources, L.M.-V., J.C.Z., F.J.E.-M.; data curation, A.M.-V., A.C.P.-O.; writing—original draft preparation, L.M.-V., A.M.-V., A.C.P.-O.; writing—review and editing, L.M.-V., A.M.-V., A.C.P.-O.; project administration, L.M.-V.
Funding
This research received no external funding.
Conflicts of Interest
The authors declare no conflict of interest.
References
- Franco, R.; García Roa, M.; Morales, V.; Membrillo, M.; Lorenzo, X. Assessing Dry Age-Related Macular Degeneration in a Mexican Population with Fundus Autofluorescence and Spectral Domain Optical Coherence Tomography. J. Clin. Exp. 2018, 9, 754. [Google Scholar]
- Wong, W.L.; Su, X.; Li, X.; Cheung, C.M.G.; Klein, R.; Cheng, C.Y.; Wong, T.Y. Global prevalence of age-related macular degeneration and disease burden projection for 2020 and 2040: A systematic review and meta-analysis. Lancet Glob. Health 2014, 2, e106–e116. [Google Scholar] [CrossRef] [Green Version]
- Klein, R.; Chou, C.F.; Klein, B.E.K.; Zhang, X.; Meuer, S.M.; Saaddine, J.B. Prevalence of age-related macular degeneration in the US population. Arch. Ophthalmol. 2011, 129, 75–80. [Google Scholar] [CrossRef] [PubMed] [Green Version]
- Colijn, J.M.; Buitendijk, G.H.; Prokofyeva, E.; Alves, D.; Cachulo, M.L.; Khawaja, A.P.; Cougnard-Gregoire, A.; Merle, B.M.; Korb, C.; Erke, M.G.; et al. Prevalence of age-related macular degeneration in Europe: The past and the future. Ophthalmology 2017, 124, 1753–1763. [Google Scholar] [CrossRef] [PubMed] [Green Version]
- Rudnicka, A.R.; Kapetanakis, V.V.; Jarrar, Z.; Wathern, A.K.; Wormald, R.; Fletcher, A.E.; Cook, D.G.; Owen, C.G. Incidence of late-stage age-related macular degeneration in American whites: Systematic review and meta-analysis. Am. J. Ophthalmol. 2015, 160, 85–93. [Google Scholar] [CrossRef] [Green Version]
- Chakravarthy, U.; Wong, T.Y.; Fletcher, A.; Piault, E.; Evans, C.; Zlateva, G.; Buggage, R.; Pleil, A.; Mitchell, P. Clinical risk factors for age-related macular degeneration: A systematic review and meta-analysis. BMC Ophthalmol. 2010, 10, 31. [Google Scholar] [CrossRef]
- World Health Organization. Blindness and Vision Impairment. Available online: https://www.who.int/news-room/fact-sheets/detail/blindness-and-visual-impairment (accessed on 15 November 2019).
- Mitchell, P.; Liew, G.; Gopinath, B.; Wong, T.Y. Age-related macular degeneration. Lancet 2018, 392, 1147–1159. [Google Scholar] [CrossRef]
- Sundaresan, P.; Vashist, P.; Ravindran, R.D.; Shanker, A.; Nitsch, D.; Nonyane, B.A.; Smeeth, L.; Chakravarthy, U.; Fletcher, A.E. Polymorphisms in ARMS2/HTRA1 and Complement Genes and Age-Related Macular Degeneration in India: Findings from the INDEYE StudyCFH and ARMS/HTRA1 Polymorphisms in India. Investig. Ophthalmol. Vis. Sci. 2012, 53, 7492–7497. [Google Scholar] [CrossRef]
- Klein, R.; Klein, B.E.; Jensen, S.C.; Mares-Perlman, J.A.; Cruickshanks, K.J.; Palta, M. Age-related maculopathy in a multiracial United States population: The National Health and Nutrition Examination Survey III. Ophthalmology 1999, 106, 1056–1065. [Google Scholar] [CrossRef]
- Klein, B.E.; Howard, K.P.; Lee, K.E.; Iyengar, S.K.; Sivakumaran, T.A.; Klein, R. The relationship of cataract and cataract extraction to age-related macular degeneration: The Beaver Dam Eye Study. Ophthalmology 2012, 119, 1628–1633. [Google Scholar] [CrossRef] [Green Version]
- Wang, J.J.; Klein, R.; Smith, W.; Klein, B.E.; Tomany, S.; Mitchell, P. Cataract surgery and the 5-year incidence of late-stage age-related maculopathy: Pooled findings from the Beaver Dam and Blue Mountains eye study. Ophthalmology 2003, 110, 1960–1967. [Google Scholar] [CrossRef]
- Klein, R.; Klein, B.E.; Wong, T.Y.; Tomany, S.C.; Cruickshanks, K.J. The association of cataract and cataract surgery with the long-term incidence of age-related maculopathy: The Beaver Dam eye study. Arch. Ophthalmol. 2002, 120, 1551–1558. [Google Scholar] [CrossRef] [PubMed] [Green Version]
- Casparis, H.; Lindsley, K.; Kuo, I.C.; Sikder, S.; Bressler, N.M. Surgery for cataracts in people with age-related macular degeneration. Cochrane Database Syst. Rev. 2017, CD006757. [Google Scholar] [CrossRef] [PubMed]
- Spencer, K.L.; Olson, L.M.; Schnetz-Boutaud, N.; Gallins, P.; Agarwal, A.; Iannaccone, A.; Kritchevsky, S.B.; Garcia, M.; Nalls, M.A.; Newman, A.B.; et al. Using genetic variation and environmental risk factor data to identify individuals at high risk for age-related macular degeneration. PLoS ONE 2011, 6, e17784. [Google Scholar] [CrossRef] [Green Version]
- Soysal, Y.; Inan, Ü.Ü.; Küsbeci, T.; Imirzalioğlu, N. Age-related macular degeneration and association of CFH Y402H and LOC387715 A69S polymorphisms in a Turkish population. DNA Cell Biol. 2012, 31, 323–330. [Google Scholar] [CrossRef]
- Black, J.R.; Clark, S.J. Age-related macular degeneration: Genome-wide association studies to translation. Genet. Med. 2016, 18, 283–289. [Google Scholar] [CrossRef] [Green Version]
- Association, W.M. Declaration of Helsinki: Ethical principles for medical research involving human subjects. J. Am. Coll. Dent. 2014, 81, 14. [Google Scholar]
- Khalid, S.; Khalil, T.; Nasreen, S. A Survey of Feature Selection and Feature Extraction Techniques in Machine Learning. In Proceedings of the Science and Information Conference, London, UK, 27–29 August 2014. [Google Scholar]
- Louppe, G.; Wehenkel, L.; Sutera, A.; Geurts, P. Understanding variable importances in forests of randomized trees. In Proceedings of the Advances in Neural Information Processing Systems, Lake Tahoe, NV, USA, 5–10 December 2013; pp. 431–439. [Google Scholar]
- Kursa, M.B.; Rudnicki, W.R. Feature selection with the Boruta package. J. Stat. Softw. 2010, 36, 1–13. [Google Scholar] [CrossRef] [Green Version]
- Sokolova, M.; Lapalme, G. A systematic analysis of performance measures for classification tasks. Inf. Process. Manag. 2009, 45, 427–437. [Google Scholar] [CrossRef]
- Lipton, Z.C. The mythos of model interpretability. arXiv 2016, arXiv:1606.03490. [Google Scholar] [CrossRef]
- Rüping, S. Learning Interpretable Models. Ph.D. Thesis, Universität Dortmund, Dortmund, Germany, 2006. [Google Scholar]
- Hall, P.; Phan, W.; Ambati, S.S. Ideas on Interpreting Machine Learning. 2017. Available online: http://on-demand.gputechconf.com/gtcdc/2017/presentation/dc7212-patrick-hall-interpretable-ai-not-just-for-regulators.pdf (accessed on 17 December 2019).
- Vanderbeek, B.L.; Zacks, D.N.; Talwar, N.; Nan, B.; Musch, D.C.; Stein, J.D. Racial differences in age-related macular degeneration rates in the United States: A longitudinal analysis of a managed care network. Am. J. Ophthalmol. 2011, 152, 273–282. [Google Scholar] [CrossRef] [PubMed] [Green Version]
- Wang, Y.X.; Hebert, M. Learning to learn: Model regression networks for easy small sample learning. In European Conference on Computer Vision; Springer: Amsterdam, The Netherlands, 2016; pp. 616–634. [Google Scholar]
- Klein, R.; Klein, B.E.; Wang, Q.; Moss, S.E. Is age-related maculopathy associated with cataracts? Arch. Ophthalmol. 1994, 112, 191–196. [Google Scholar] [CrossRef] [PubMed]
- Ribeiro, M.T.; Singh, S.; Guestrin, C. Model-Agnostic Interpretability of Machine Learning. In Proceedings of the 2016 CHI Conference Human Factors Computing Systems (CHI ’16), San Jose, CA, USA, 7–12 May 2016; pp. 5686–5697. [Google Scholar]
- Vavvas, D.G.; Small, K.W.; Awh, C.C.; Zanke, B.W.; Tibshirani, R.J.; Kustra, R. CFH and ARMS2 genetic risk determines progression to neovascular age-related macular degeneration after antioxidant and zinc supplementation. Proc. Natl. Acad. Sci. USA 2018, 115, E696–E704. [Google Scholar] [CrossRef] [PubMed] [Green Version]
| Sample Availability: Since this data comes from a multicenter study, access can be granted by submitting a research proposal to all Institutional Review Board and Ethics Committees from Instituto de Oftalmología FAP Conde de Valenciana ( https://unidaddeinvestigacion.org) headed by Federico Graue Wiechers, Hospital Fundación Nuestra Señora de la Luz ( http://hospitaldelaluz.org/docencia-e-investigacion/) headed by Jaime Lozano Alcazar, and at Universidad Panamericana, Faculty of Health Sciences ( https://www.up.edu.mx/es/comision-investigacion) headed by Antonio Romero Villa (Scientific Committee) and María de Lourdes Gonzalez del Rincón (Bioethics Committee). |
© 2019 by the authors. Licensee MDPI, Basel, Switzerland. This article is an open access article distributed under the terms and conditions of the Creative Commons Attribution (CC BY) license (http://creativecommons.org/licenses/by/4.0/).

 ,
, 


