A Computer-Aided Detection System for the Detection of Lung Nodules Based on 3D-ResNet

Abstract
:1. Introduction
2. Data
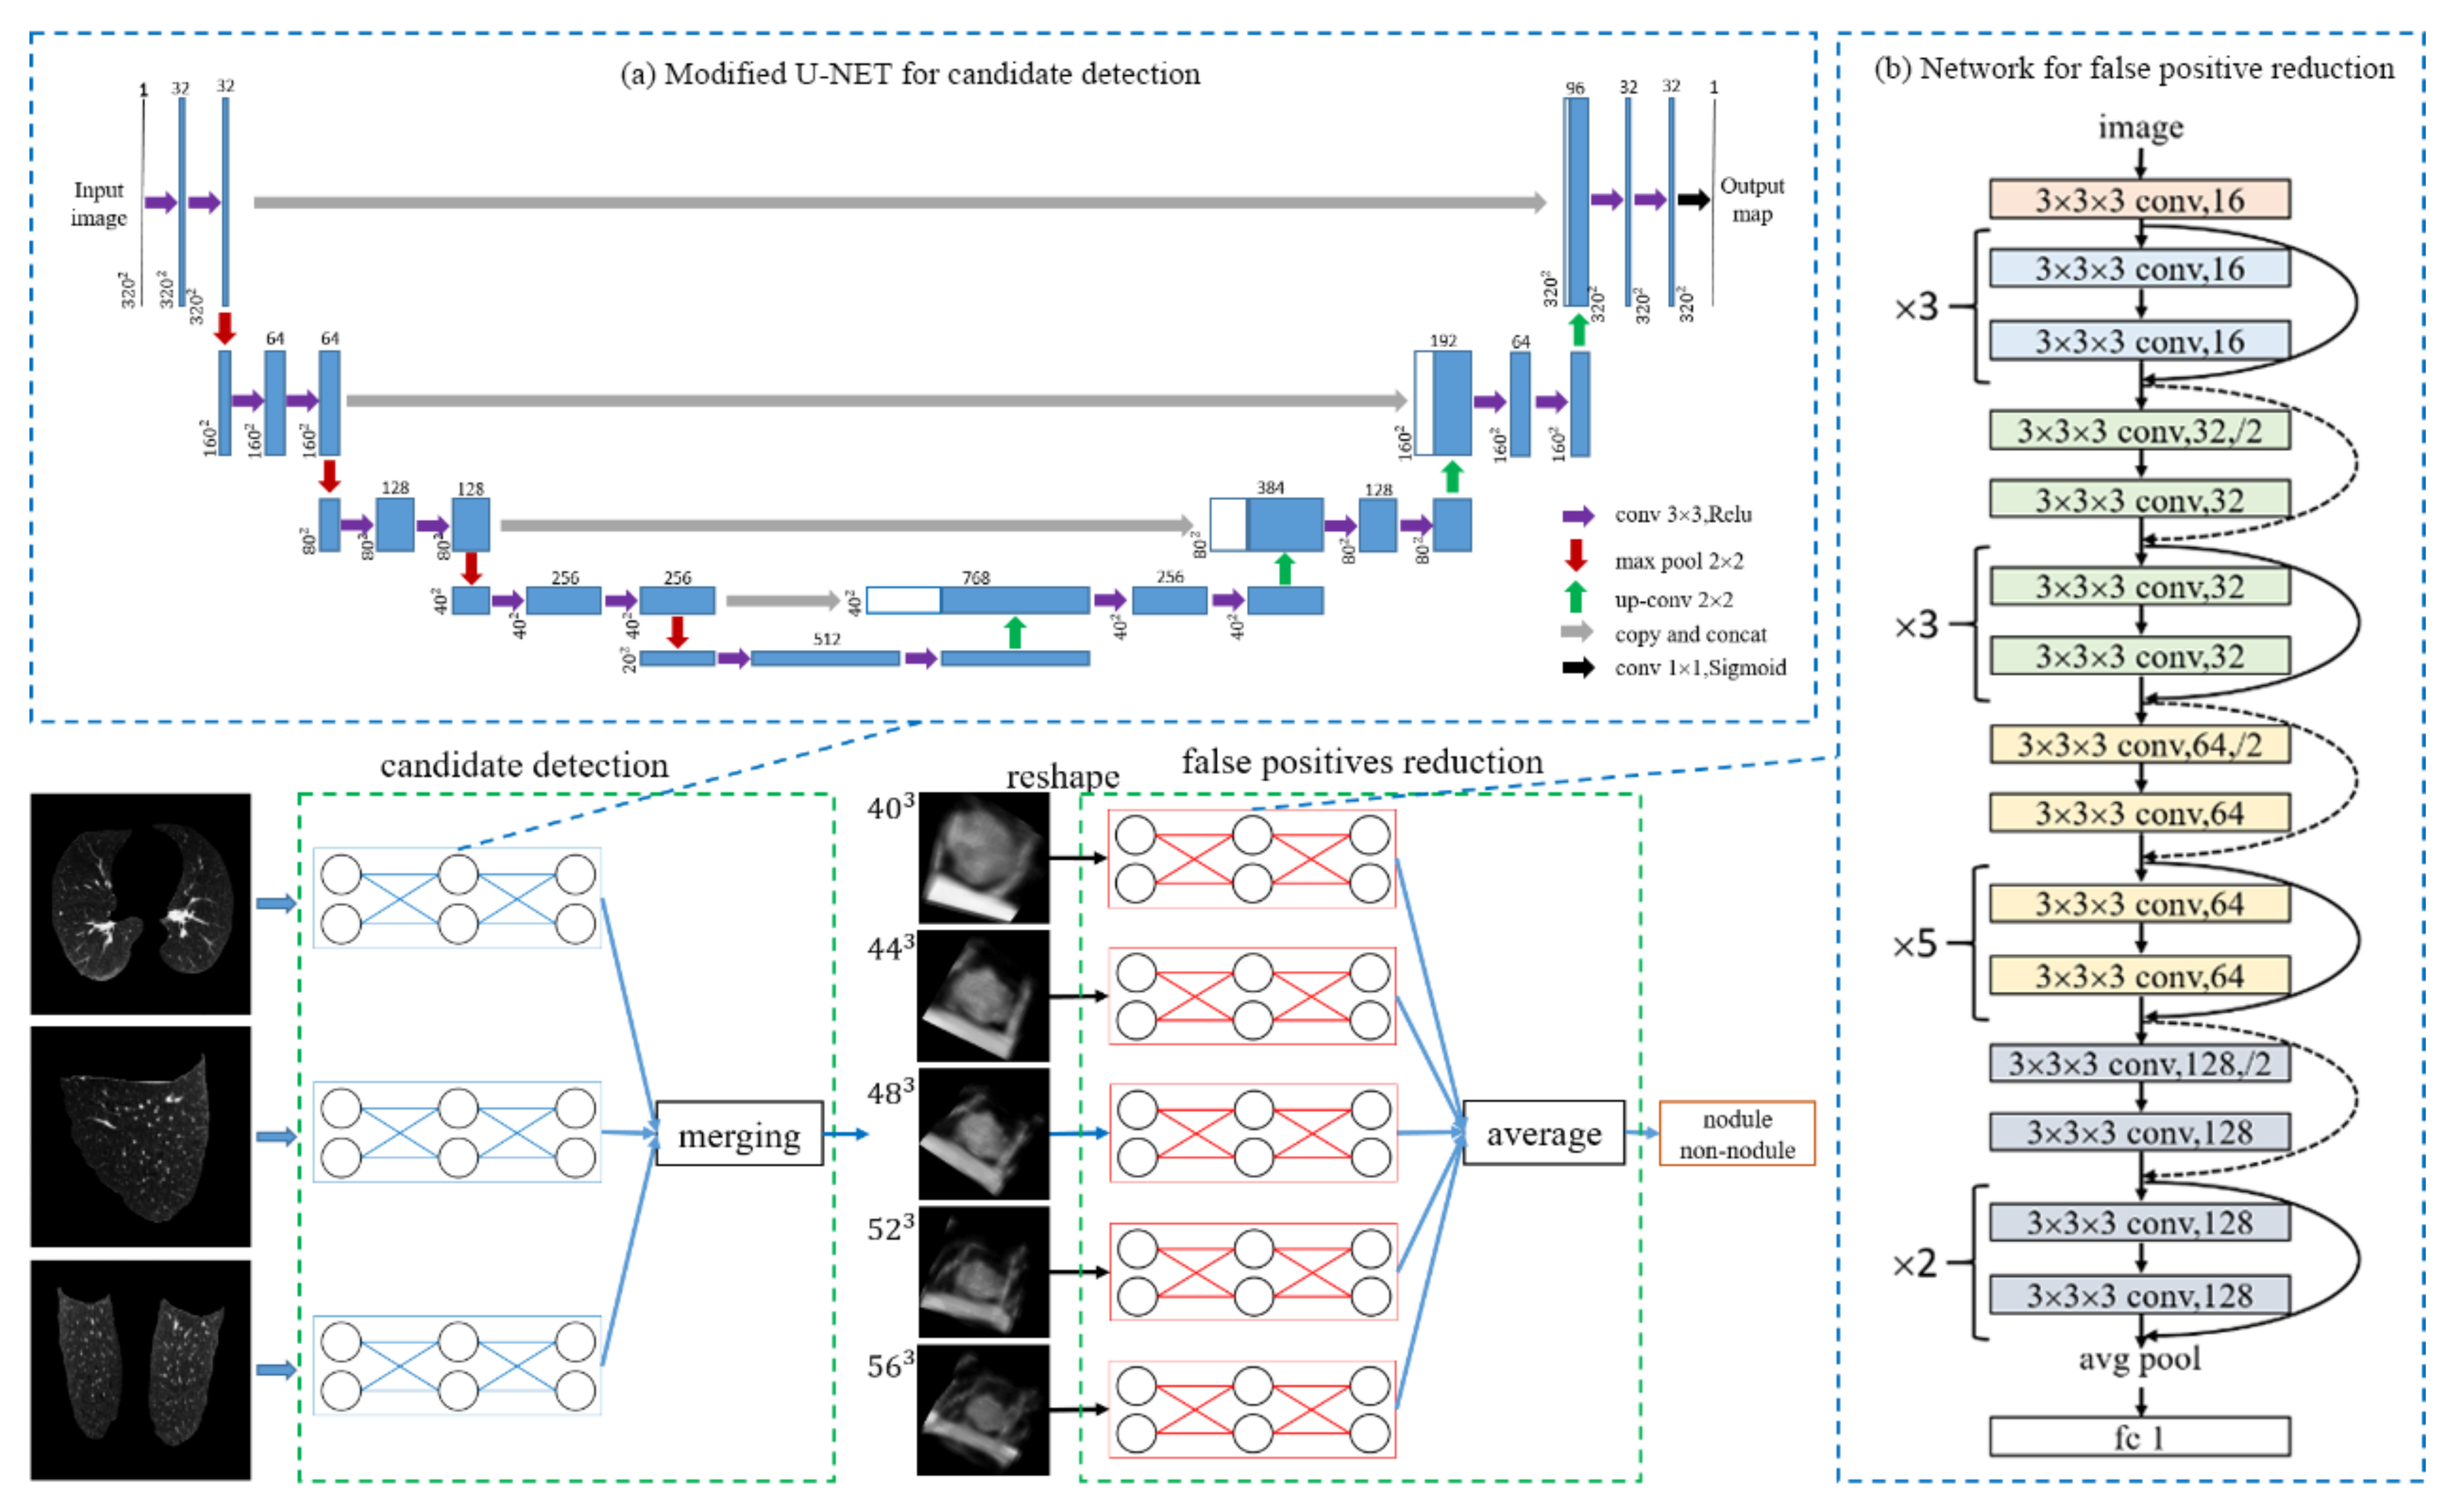
3. Method
3.1. Candidate Detection
3.2. 3D Sample Extraction
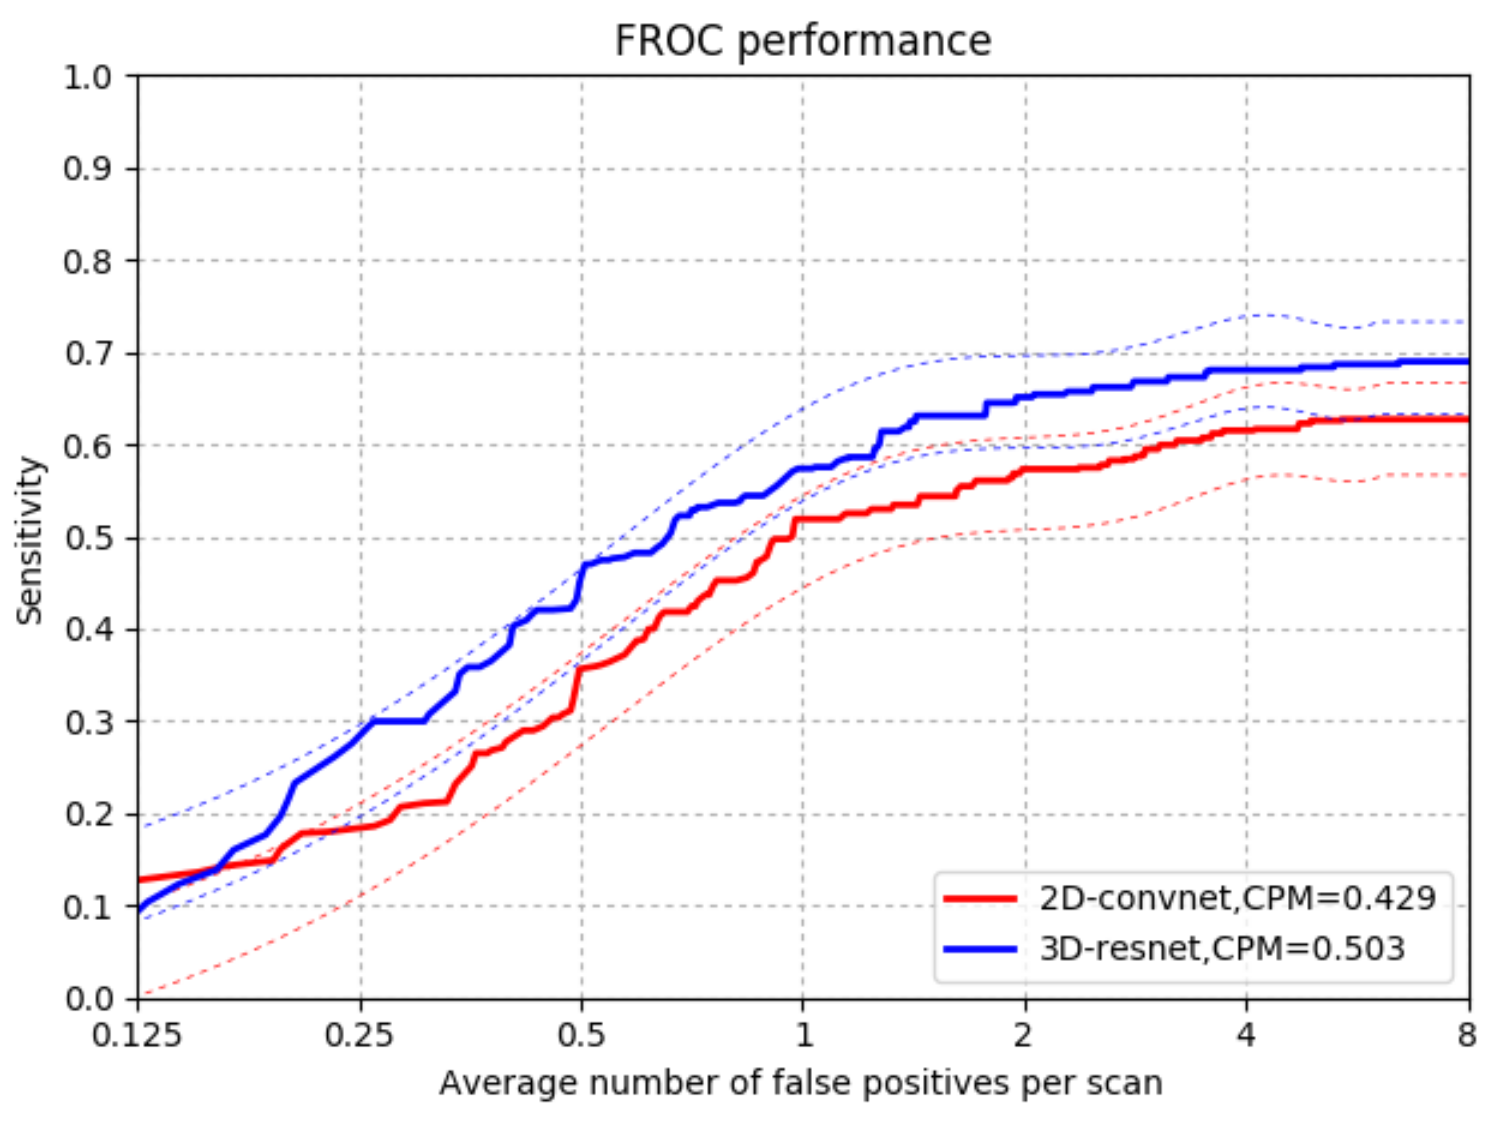
3.3. False-Positive Reduction: 3D Depth Residual Network
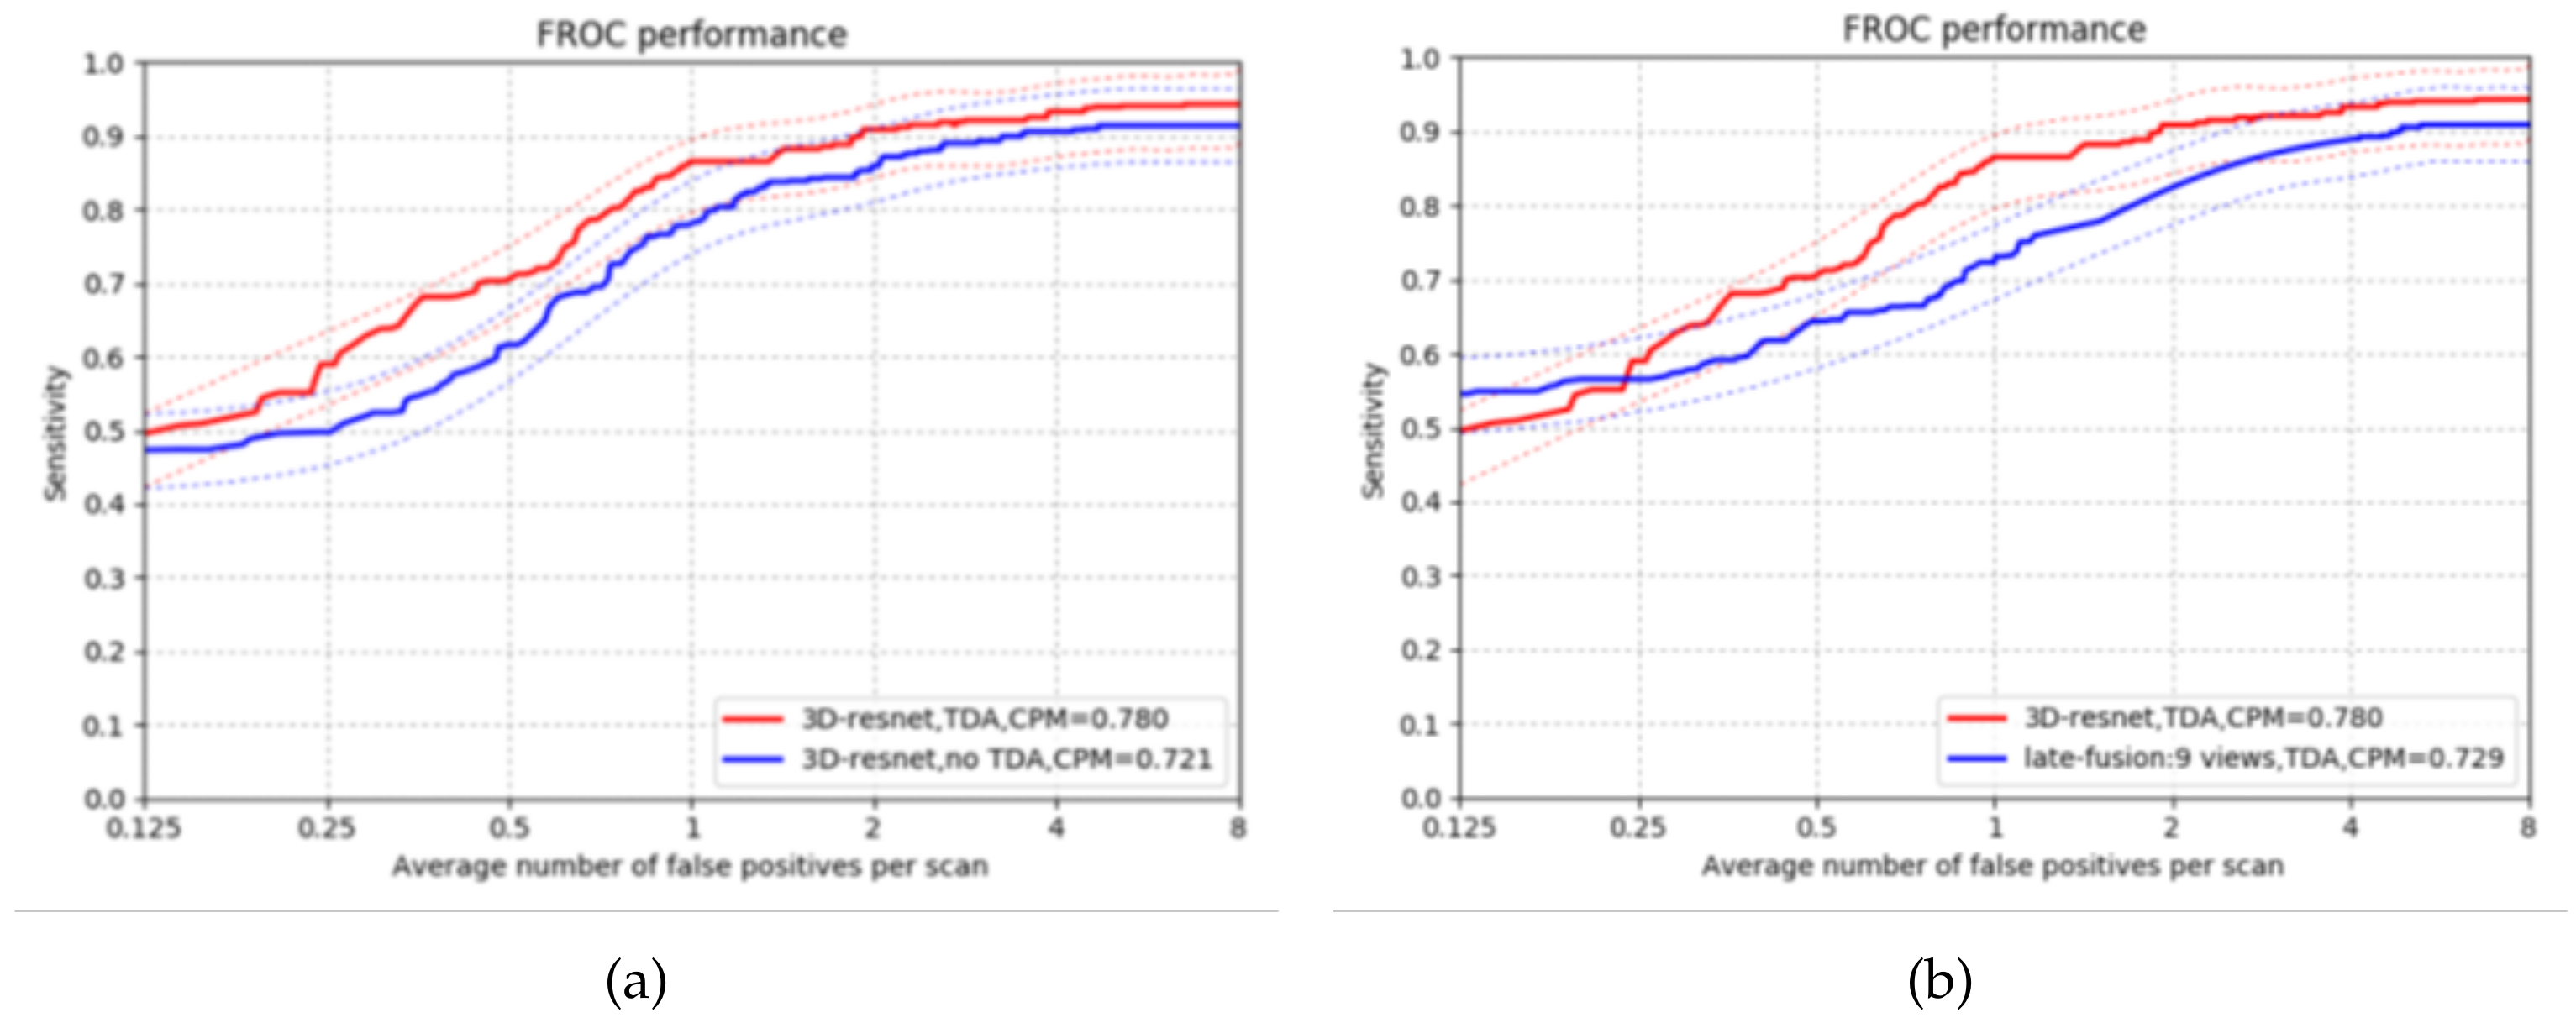
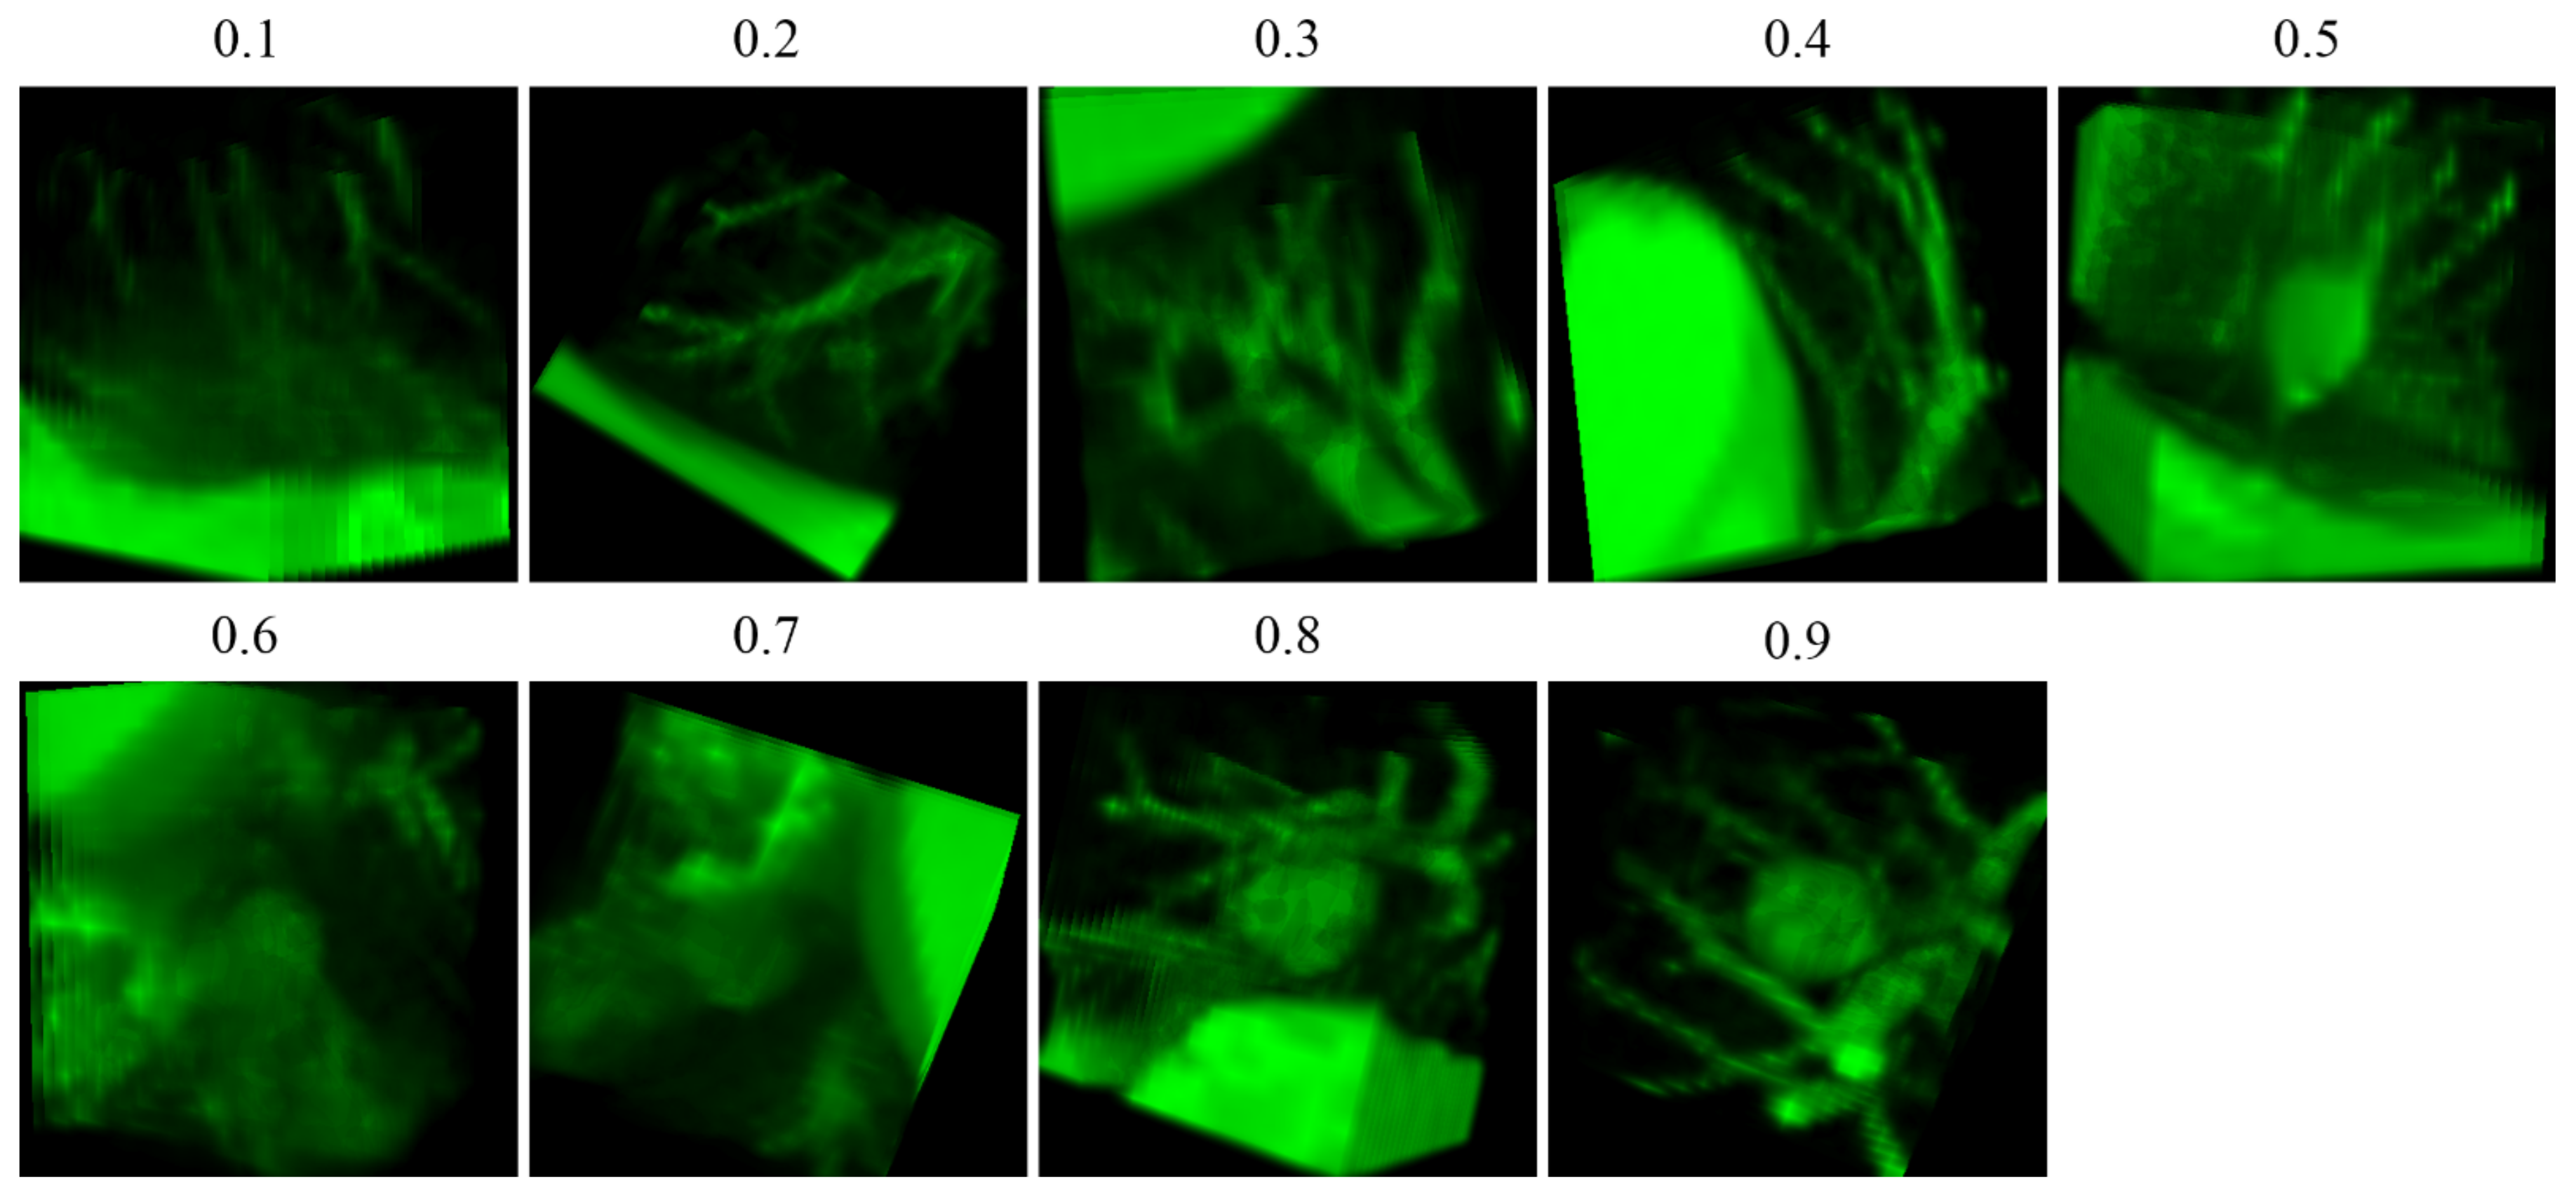
3.4. Data Augmentation
3.5. Evaluation
4. Experimental Results
4.1. Candidates Detection
4.2. False Positives Reduction
4.3. Comparison with Existing CAD Systems
4.3.1. Comparison with 2DConvNet-CAD in CUMedVis
4.3.2. Comparison with Ohter CAD Systems that Use LIDC-IDRI Data Sets
5. Conclusions
Author Contributions
Funding
Acknowledgments
Conflicts of Interest
References
- Siegel, R.L.; Miller, K.D.; Fedewa, S.A.; Ahnen, D.J.; Meester, R.G.; Barzi, A.; Jemal, A. Colorectal cancer statistics, 2017. CA Cancer J. Clin. 2017, 67, 177–193. [Google Scholar] [CrossRef] [PubMed]
- National Lung Screening Trial Research Team; Aberle, D.R.; Adams, A.M.; Berg, C.D.; Black, W.C.; Clapp, J.D.; Fagerstrom, R.M.; Gareen, I.F.; Gatsonis, C.; Marcus, P.M.; et al. Reduced lung-cancer mortality with low-dose computed tomographic screening. N. Engl. J. Med. 2011, 365, 395–409. [Google Scholar] [CrossRef] [PubMed] [Green Version]
- Bergtholdt, M.; Wiemker, R.; Klinder, T. Pulmonary nodule detection using a cascaded SVM classifier. In Proceedings of the Medical Imaging 2016: Computer-Aided Diagnosis: International Society for Optics and Photonics, San Diego, CA, USA, 28 February–2 March 2016. [Google Scholar]
- Brown, M.S.; Lo, P.; Goldin, J.G.; Barnoy, E.; Kim, G.H.J.; McNitt-Gray, M.F.; Aberle, D.R. Toward clinically usable CAD for lung cancer screening with computed tomography. Eur. Radiol. 2014, 24, 2719–2728. [Google Scholar] [CrossRef] [PubMed]
- Jacobs, C.; van Rikxoort, E.M.; Twellmann, T.; Scholten, E.T.; de Jong, P.A.; Kuhnigk, J.M.; Oudkerk, M.; de Koning, H.J.; Prokop, M.; Schaefer-Prokop, C.; et al. Automatic detection of subsolid pulmonary nodules in thoracic computed tomography images. Med. Image Anal. 2014, 18, 374–384. [Google Scholar] [CrossRef]
- Choi, W.J.; Choi, T.S. Automated pulmonary nodule detection system in computed tomography images: A hierarchical block classification approach. Entropy 2013, 15, 507–523. [Google Scholar] [CrossRef] [Green Version]
- Pehrson, L.M.; Nielsen, M.B.; Ammitzbøl Lauridsen, C. Automatic pulmonary nodule detection applying deep learning or machine learning algorithms to the LIDC-IDRI database: A systematic review. Diagnostics 2019, 9, 29. [Google Scholar] [CrossRef] [Green Version]
- Li, R.; Wang, S.; Gu, D. Ongoing Evolution of Visual SLAM from Geometry to Deep Learning: Challenges and Opportunities. Cogn. Comput. 2018, 10, 875–889. [Google Scholar] [CrossRef]
- Liu, H.; Fang, J.; Xu, X.; Sun, F. Surface material recognition using active multi-modal extreme learning machine. Cogn. Comput. 2018, 10, 937–950. [Google Scholar] [CrossRef]
- Nasrullah, N.; Sang, J.; Alam, M.S.; Xiang, H. Automated detection and classification for early stage lung cancer on CT images using deep learning. Proc SPIE 2019, 10995, 109950S. [Google Scholar]
- Zhu, W.; Liu, C.; Fan, W.; Xie, X. Deeplung: Deep 3d dual path nets for automated pulmonary nodule detection and classification. In Proceedings of the 2018 IEEE Winter Conference on Applications of Computer Vision (WACV), Lake Tahoe, NV, USA, 12–15 March 2018; pp. 673–681. [Google Scholar]
- Setio, A.A.A.; Ciompi, F.; Litjens, G.; Gerke, P.; Jacobs, C.; Van Riel, S.J.; Wille, M.M.W.; Naqibullah, M.; Sánchez, C.I.; van Ginneken, B. Pulmonary nodule detection in CT images: False positive reduction using multi-view convolutional networks. IEEE Trans. Med. Imaging 2016, 35, 1160–1169. [Google Scholar] [CrossRef]
- Van Ginneken, B.; Setio, A.A.; Jacobs, C.; Ciompi, F. Off-the-shelf convolutional neural network features for pulmonary nodule detection in computed tomography scans. In Proceedings of the 2015 IEEE 12th International Symposium on Biomedical Imaging (ISBI), Brooklyn, NY, USA, 16–19 April 2015; pp. 286–289. [Google Scholar]
- Roth, H.R.; Lu, L.; Seff, A.; Cherry, K.M.; Hoffman, J.; Wang, S.; Liu, J.; Turkbey, E.; Summers, R.M. A new 2.5 D representation for lymph node detection using random sets of deep convolutional neural network observations. In Proceedings of the International Conference on Medical Image Computing and Computer-Assisted Intervention, Boston, MA, USA, 14–18 September 2014; pp. 520–527. [Google Scholar]
- Ronneberger, O.; Fischer, P.; Brox, T. U-net: Convolutional networks for biomedical image segmentation. In Proceedings of the International Conference on Medical image computing and computer-assisted intervention, Munich, Germany, 5–9 October 2015; pp. 234–241. [Google Scholar]
- Armato, S.G., III; McLennan, G.; Bidaut, L.; McNitt-Gray, M.F.; Meyer, C.R.; Reeves, A.P.; Zhao, B.; Aberle, D.R.; Henschke, C.I.; Hoffman, E.A.; et al. The lung image database consortium (LIDC) and image database resource initiative (IDRI): A completed reference database of lung nodules on CT scans. Med. Phys. 2011, 38, 915–931. [Google Scholar] [PubMed]
- Tianchi Medical AI Competition. Available online: https://tianchi.aliyun.com/competition/entrance/231601/information (accessed on 1 February 2019).
- Kazerooni, E.A.; Austin, J.H.; Black, W.C.; Dyer, D.S.; Hazelton, T.R.; Leung, A.N.; McNitt-Gray, M.F.; Munden, R.F.; Pipavath, S. ACR–STR practice parameter for the performance and reporting of lung cancer screening thoracic computed tomography (CT): 2014 (Resolution 4). J. Thorac. Imaging 2014, 29, 310–316. [Google Scholar] [CrossRef] [PubMed] [Green Version]
- Moira, B.; Robbert van der, G.; Michael de, K.; Jeroen, M.; Guido, Z. ZNET-Lung Nodule Detection. Available online: https://www.github.com/gzuidhof/LUNA16/ (accessed on 1 November 2018).
- Srivastava, N.; Hinton, G.; Krizhevsky, A.; Sutskever, I.; Salakhutdinov, R. Dropout: A simple way to prevent neural networks from overfitting. J. Mach. Learn. Res. 2014, 15, 1929–1958. [Google Scholar]
- Cogswell, M.; Ahmed, F.; Girshick, R.; Zitnick, L.; Batra, D. Reducing overfitting in deep networks by decorrelating representations. arXiv 2015, arXiv:1511.06068. [Google Scholar]
- Glorot, X.; Bordes, A.; Bengio, Y. Deep sparse rectifier neural networks. In Proceedings of the Fourteenth International Conference on Artificial Intelligence and Statistics, Ft. Lauderdale, FL, USA, 11–13 April 2011; pp. 315–323. [Google Scholar]
- Simonyan, K.; Zisserman, A. Very deep convolutional networks for large-scale image recognition. arXiv 2014, arXiv:1409.1556. [Google Scholar]
- He, K.; Zhang, X.; Ren, S.; Sun, J. Deep residual learning for image recognition. In Proceedings of the IEEE Conference on Computer Vision and Pattern Recognition, Las Vegas, NV, USA, 27–30 June 2016; pp. 770–778. [Google Scholar]
- Kingma, D.P.; Ba, J. Adam: A method for stochastic optimization. arXiv 2014, arXiv:1412.6980. [Google Scholar]
- Ioffe, S.; Szegedy, C. Batch normalization: Accelerating deep network training by reducing internal covariate shift. arXiv 2015, arXiv:1502.03167. [Google Scholar]
- Glorot, X.; Bengio, Y. Understanding the difficulty of training deep feedforward neural networks. In Proceedings of the Thirteenth International Conference on Artificial Intelligence and Statistics, Sardinia, Italy, 13–15 May 2010; pp. 249–256. [Google Scholar]
- Niemeijer, M.; Loog, M.; Abramoff, M.D.; Viergever, M.A.; Prokop, M.; van Ginneken, B. On combining computer-aided detection systems. IEEE Trans. Med. Imaging 2010, 30, 215–223. [Google Scholar] [CrossRef]
- Murphy, K.; van Ginneken, B.; Schilham, A.M.; De Hoop, B.; Gietema, H.; Prokop, M. A large-scale evaluation of automatic pulmonary nodule detection in chest CT using local image features and k-nearest-neighbour classification. Med. Image Anal. 2009, 13, 757–770. [Google Scholar] [CrossRef]
- Setio, A.A.; Jacobs, C.; Gelderblom, J.; van Ginneken, B. Automatic detection of large pulmonary solid nodules in thoracic CT images. Med. Phys. 2015, 42, 5642–5653. [Google Scholar] [CrossRef]
- Dou, Q.; Chen, H.; Yu, L.; Qin, J.; Heng, P.A. Multilevel contextual 3-D CNNs for false positive reduction in pulmonary nodule detection. IEEE Trans. Biomed. Eng. 2016, 64, 1558–1567. [Google Scholar] [CrossRef] [PubMed]
- Lopez Torres, E.; Fiorina, E.; Pennazio, F.; Peroni, C.; Saletta, M.; Camarlinghi, N.; Fantacci, M.E.; Cerello, P. Large scale validation of the M5L lung CAD on heterogeneous CT datasets. Med. Phys. 2015, 42, 1477–1489. [Google Scholar] [CrossRef] [PubMed]
- Tan, M.; Deklerck, R.; Cornelis, J.; Jansen, B. Phased searching with NEAT in a time-scaled framework: Experiments on a computer-aided detection system for lung nodules. Artif. Intell. Med. 2013, 59, 157–167. [Google Scholar] [CrossRef] [PubMed]
- Teramoto, A.; Fujita, H. Fast lung nodule detection in chest CT images using cylindrical nodule-enhancement filter. Int. J. Comput. Assist. Radiol. Surg. 2013, 8, 193–205. [Google Scholar] [CrossRef] [PubMed]
- Cascio, D.; Magro, R.; Fauci, F.; Iacomi, M.; Raso, G. Automatic detection of lung nodules in CT datasets based on stable 3D mass–spring models. Comput. Biol. Med. 2012, 42, 1098–1109. [Google Scholar] [CrossRef] [PubMed] [Green Version]
- Guo, W.; Li, Q. High performance lung nodule detection schemes in CT using local and global information. Med. Phys. 2012, 39, 5157–5168. [Google Scholar] [CrossRef]
- Li, C.; Zhu, G.; Wu, X.; Wang, Y. False-positive reduction on lung nodules detection in chest radiographs by ensemble of convolutional neural networks. IEEE Access 2018, 6, 16060–16067. [Google Scholar] [CrossRef]

| Candidate Dection | Sensitivity (%) | FPs per Scan |
|---|---|---|
| Z-order | 91.5 | 46.9 |
| Y-order | 80.3 | 21.9 |
| X-order | 84.4 | 46.4 |
| Combined set | 95.2 | 81.6 |
| Solid | 85.7 | 329.3 |
| Sub-solid | 36.1 | 287.2 |
| Large solid | 31.8 | 47.1 |
| Reduced set | 93.3 | 269.2 |
| CAD Systems | Year | #Scans | Slice Thickness | Nodule Size (mm) | Agreement Levels | Nodules | Sensitivity (%) /FPs/Scan |
|---|---|---|---|---|---|---|---|
| 3D-ResNet | - | 888 | ≥2.5 | ≥3 | at least 3 | 1186 | 92.3/4.0 86.5/1.0 |
| CUMedVis [31] | 2016 | 888 | ≥2.5 | ≥3 | at least 3 | 1186 | 90.7/4.0 84.8/1.0 |
| DIAG_CONVNET [12] | 2016 | 888 | ≥2.5 | ≥3 | at least 3 | 1186 | 90.1/4.0 85.4/1.0 |
| LungCAM [32] | 2015 | 949 | - | ≥3 | at least 3 | 1749 | 80.8/8.0 |
| Van Ginneken et al. [13] | 2015 | 865 | ≥2.5 | ≥3 | at least 3 | 1147 | 76.0/4.0 73.0/1.0 |
| Brown et al. [4] | 2014 | 108 | 0.5–3 | ≥4 | at least 3 | 68 | 75.0/2.0 |
| Choi and Choi [6] | 2013 | 58 | 0.5–3 | 3–30 | at least 1 | - | 95.3/2.3 |
| Tan et al. [33] | 2013 | 360 | - | ≥3 | at least 4 | - | 83.0/4.0 |
| Teramoto and Fujita [34] | 2013 | 84 | 0.5–3 | 5–20 | at least 1 | 103 | 80.0/4.2 |
| Cascio et al. [35] | 2012 | 84 | 1.25–3 | ≥3 | at least 1 | 148 | 97.0/6.1 88.0/2.5 |
| Guo and Li [36] | 2012 | 85 | 1.25–3 | ≥3 | at least 3 | 111 | 80.0/7.4 75.0/2.8 |
| 3D MixNet [10] | 2019 | 89 | 1.25–3 | ≥3 | at least 3 | 127 | 88.83/3.5 |
| Li et al. [37] | 2018 | 85 | 1.25–3 | ≥3 | at least 3 | 119 | 86.0/2.4 |
© 2019 by the authors. Licensee MDPI, Basel, Switzerland. This article is an open access article distributed under the terms and conditions of the Creative Commons Attribution (CC BY) license (http://creativecommons.org/licenses/by/4.0/).
Share and Cite
Ning, J.; Zhao, H.; Lan, L.; Sun, P.; Feng, Y. A Computer-Aided Detection System for the Detection of Lung Nodules Based on 3D-ResNet. Appl. Sci. 2019, 9, 5544. https://doi.org/10.3390/app9245544
Ning J, Zhao H, Lan L, Sun P, Feng Y. A Computer-Aided Detection System for the Detection of Lung Nodules Based on 3D-ResNet. Applied Sciences. 2019; 9(24):5544. https://doi.org/10.3390/app9245544
Chicago/Turabian StyleNing, Jiaxu, Haitong Zhao, Lei Lan, Peng Sun, and Yunfei Feng. 2019. "A Computer-Aided Detection System for the Detection of Lung Nodules Based on 3D-ResNet" Applied Sciences 9, no. 24: 5544. https://doi.org/10.3390/app9245544
APA StyleNing, J., Zhao, H., Lan, L., Sun, P., & Feng, Y. (2019). A Computer-Aided Detection System for the Detection of Lung Nodules Based on 3D-ResNet. Applied Sciences, 9(24), 5544. https://doi.org/10.3390/app9245544