Pattern Discovery in White Etching Crack Experimental Data Using Machine Learning Techniques


Abstract
1. Introduction
2. Data and Methods
2.1. Data Description
2.2. Methods Overview
2.3. Random Forests
- Sample size: the size of the sample selected from the total number of oils to be the training data for each tree in the random forest. Decreasing this value will most likely result in less accurate predictions by the individual trees. However, increasing this value can also result in overfitting, where the RF achieves significantly higher performance on the training data, but performs poorly on the test data, i.e., new oil compositions with unknown risk levels.
- Number of tried features at each split (from here on referred to as ftry): the number of randomly selected candidate variables, in this case compound IDs, for each split in a given decision tree in the RF when growing it. A split in a decision tree is every point when a given oil either follows a right or left path. For example, in Figure 1, the first split is performed according to the percentage of c9 in the oil. If two variables are tried with an ftry = 2, then the variable that best splits high and low risk oil compositions is selected. For example, if c1 and c2 are tried and c1 results in a split with the right side of the split containing only high risk oils and the left side containing only low risk oils, and c2 results in a mixture of high and low risk oils on both sides of the split, then c1 is chosen. This is because the split according to the percentage of c1 in the oils, in this example, results in a purer separation of high and low risk oils compared to c2. If ftry is equal to 3, then three compound IDs are instead evaluated at each split. Similar to sample size, decreasing ftry results in worse performance by the individual trees, but increasing it can result in overfitting. Much like the case with sample size, the right balance needs to be found where the highest performance by the RF is reached.
- Node size: the minimum number of oils in a terminal node of any tree in the RF. Without going into more details, the typically used value for classification problems is 1, which was the value chosen for developing the RF in this investigation since it generally provides good results [32]. When attempted, increasing the node size did not lead to higher accuracy.
- Splitting the 679 available oil compositions randomly into two smaller datasets: 70% of oils are selected as the training set and 30% are selected as the test set.
- Hyperparameter tuning: different combinations of sample size and ftry are used to train a random forest model using the training set. Ten-fold cross validation is used to estimate the classification performance of each resulting random forest model. The combination resulting in the top performance is identified as the optimal combination.
- Developing a tuned RF classifier: the optimal hyperparameter combination is used to develop an RF classifier, trained using the training set.
- Testing the tuned RF classifier: the developed tuned RF classifier is tested on the test set to verify its accuracy on unseen data.
- Reaching a more representative estimate of model accuracy: use the optimal hyperparameter pair to perform 10-fold cross validation on all 679 oils. This is done to reach an estimate of accuracy that involves testing every available oil rather than only the 30% of the available oils in the testing set.
2.4. Artificial Neural Networks
2.5. Association Rule Mining
- Support: the proportion of oils in the dataset that contain all the compounds in a given association rule. For example, the support of rule number 1 from Table 3 is calculated by dividing the number of oils containing both c16 and c12 in the dataset (36 oils) by the total number of oils in the dataset (679 oils); 36/679 = 0.0530.
- Confidence: the proportion of oils that contain the compound(s) on the left hand side (LHS) of an association rule divided by the support of the rule. Using rule number 2 from Table 3 as an example, confidence is calculated by dividing the proportion of oils in the dataset that contain both c8 and c9 (0.0133) by the support of the rule (0.0133), which would equal 1. This essentially means that all oils that contain both c8 and c9 also contain c12.
- Lift: the confidence of a rule divided by the proportion of oils in the dataset that contain the compound(s) on the right hand side (RHS) of an association rule. This metric indicates how surprising an association rule is given the expected probability of finding the RHS compound(s) in an oil in the dataset. For instance, rule number 3 from Table 3 has a lift of almost 1, which indicates that the probability of finding c16 in any oil in the dataset is almost identical to the probability of finding c16 in an oil that already contains c3. This means that the association suggested by rule number 3 is weak. In contrast, rule number 2 from Table 3 has a lift of 5.853, which indicates that the association indicated by the rule is strong. For rule number 1, the lift value is below 1, which means that it is more likely not to find c12 in an oil that contains c16 than it is to find c12 in an oil that contains c16.
- Count: the number of oils in the dataset that contain all the compounds in a given association rule. Using rule number 2 from Table 3 as an example, the count is 9, which means that the number of oils in the dataset that contain the combination of c8, c9, and c12 is 9.
3. Results
3.1. Random Forests
3.2. Artificial Neural Networks
3.3. Association Rule Mining
4. Discussion
5. Conclusions
- It is possible to converge findings from multiple experiments using the presented ML models to discover patterns and conduct root-cause analyses on WECs using only historic data from previous experiments.
- It is possible to reach said patterns via ML models while maintaining transparency into the drivers of accuracy of the ML models using the techniques presented in this paper.
- The presented techniques are able to identify patterns to classify a given oil composition as high- or low-risk with respect to WECs with high accuracy using data from previous experiments.
- The presented techniques are able to identify influential oil compounds on WEC risk using data from previous experiments.
- NN-based FS was developed and applied during this investigation as a method of feature selection based on neural networks. Since this is the first application of the method, the authors aim to test its capabilities with different datasets before releasing a more detailed publication of the method.
Author Contributions
Funding
Acknowledgments
Conflicts of Interest
References
- Gould, B.; Greco, A. Investigating the Process of White Etching Crack Initiation in Bearing Steel. Tribol. Lett. 2016, 62, 26. [Google Scholar] [CrossRef]
- Evans, M.-H. White structure flaking (WSF) in wind turbine gearbox bearings: Effects of ‘butterflies’ and white etching cracks (WECs). Mater. Sci. Technol. Ser. 2013, 28, 3–22. [Google Scholar] [CrossRef]
- Spinato, F.; Tavner, P.; van Bussel, G.; Koutoulakos, E. Reliability of wind turbine subassemblies. IET Renew. Power Gen. 2009, 3, 387–401. [Google Scholar] [CrossRef]
- Sheng, S. Wind Turbine Gearbox Reliability Database, Condition Monitoring, and Operation and Maintenance Research Update. In Proceedings of the National Renewable Energy Laboratory (NREL), Drivetrain Reliability Collaborative Workshop, Golden, CO, USA, 16–17 February 2016. [Google Scholar]
- Haque, T.; Korres, S.; Carey, J.T.; Jacobs, P.W.; Loos, J.; Franke, J. Lubricant Effects on White Etching Cracking Failures in Thrust Bearing Rig Tests. Tribol. Trans. 2018, 61, 979–990. [Google Scholar] [CrossRef]
- Grabulov, A.; Petrov, R.; Zandbergen, H. EBSD investigation of the crack initiation and TEM/FIB analyses of the microstructural changes around the cracks formed under Rolling Contact Fatigue (RCF). Int. J. Fatigue 2010, 32, 576–583. [Google Scholar] [CrossRef]
- Harada, H.; Mikami, T.; Shibata, M.; Sokai, D.; Yamamoto, A.; Tsubakino, H. Microstructural Changes and Crack Initiation with White Etching Area Formation under Rolling/Sliding Contact in Bearing Steel. ISIJ Int. 2005, 45, 1897–1902. [Google Scholar] [CrossRef]
- Greco, A.; Sheng, S.; Keller, J.; Erdemir, A. Material wear and fatigue in wind turbine Systems. Wear 2013, 302, 1583–1591. [Google Scholar] [CrossRef]
- Evans, M.-H. An updated review: White etching cracks (WECs) and axial cracks in wind turbine gearbox bearings. Mater. Sci. Technol. Ser. 2016, 32, 1133–1169. [Google Scholar] [CrossRef]
- Franke, J.; Carey, J.T.; Korres, S.; Haque, T.; Jacobs, P.W.; Loos, J.; Kruhoeffer, W. White Etching Cracking—Simulation in Bearing Rig and Bench Tests. Tribol. Trans. 2018, 61, 403–413. [Google Scholar] [CrossRef]
- Iso, K.; Yokouchi, A.; Takemura, H. Research Work for Clarifying the Mechanism of White Structure Flaking and Extending the Life of Bearings, SAE Technical Paper 2005-01-1868. In Proceedings of the SAE 2005 World Congress & Exhibition, Detroit, MI, USA, 11–14 April 2005. [Google Scholar]
- Loos, J.; Bergmann, I.; Goss, M. Influence of Currents from Electrostatic Charges on WEC Formation in Rolling Bearings. Tribol. Trans. 2016, 59, 865–875. [Google Scholar] [CrossRef]
- Garabedian, N.T.; Gould, B.J.; Doll, G.L.; Burris, D.L. The Cause of Premature Wind Turbine Bearing Failures: Overloading or Underloading? Tribol. Trans. 2018, 61, 850–860. [Google Scholar] [CrossRef]
- Errichello, R.; Budny, R.; Eckert, R. Investigations of Bearing Failures Associated with White Etching Areas (WEAs) in Wind Turbine Gearboxes. Tribol. Trans. 2013, 56, 1069–1076. [Google Scholar] [CrossRef]
- Evans, M.-H.; Richardson, A.; Wang, L.; Wood, R. Serial sectioning investigation of butterfly and white etching crack (WEC) formation in wind turbine gearbox bearings. Wear 2013, 302, 1573–1582. [Google Scholar] [CrossRef]
- Arnaud, R.D.C. Tribological Analysis of White Etching Crack (WEC) Failures in Rolling Element Bearings. Ph.D. Thesis, INSA de Lyon, Villeurbanne, France, 2014. [Google Scholar]
- Evans, M.-H.; Walker, J.; Ma, C.; Wang, L.; Wood, R. A FIB/TEM study of butterfly crack formation and white etching area (WEA) microstructural changes under rolling contact fatigue in 100Cr6 bearing steel. Mater. Sci. Eng. A 2013, 570, 127–134. [Google Scholar] [CrossRef]
- Gegner, J.; Nierlich, W. The Bearing Axial Cracks Root Cause Hypothesis of Frictional Surface Crack Initiation and Corrosion Fatigue Driven Crack Growth. In Proceedings of the NREL 2011 Wind Turbine Tribology Seminar, Broomfield, CO, USA, 15–17 November 2011. [Google Scholar]
- Grabulov, A.; Ziese, U.; Zandbergen, H. TEM/SEM investigation of microstructural changes within the white etching area under rolling contact fatigue and 3-D crack reconstruction by focused ion beam. Scripta Mater. 2007, 57, 635–638. [Google Scholar] [CrossRef]
- Uyama, H.; Yamada, H.; Hidaka, H.; Mitamura, N. The Effects of Hydrogen on Microstructural Change and Surface Originated Flaking in Rolling Contact Fatigue. Tribol. Online 2011, 6, 123–132. [Google Scholar] [CrossRef]
- Richardson, A.D.; Evans, M.-H.; Wang, L.; Wood, R.J.K.; Ingram, M.; Meuth, B. The Evolution of White Etching Cracks (WECs) in Rolling Contact Fatigue-Tested 100Cr6 Steel. Tribol. Lett. 2017, 66, 6. [Google Scholar] [CrossRef]
- Holweger, W.; Wolf, M.; Merk, D.; Blass, T.; Goss, M.; Loos, J.; Barteldes, S.; Jakovics, A. White Etching Crack Root Cause Investigations. Tribol. Trans. 2015, 58, 59–69. [Google Scholar] [CrossRef]
- Gould, B.; Greco, A. The Influence of Sliding and Contact Severity on the Generation of White Etching Cracks. Tribol. Lett. 2015, 60, 29. [Google Scholar] [CrossRef]
- Gould, B.; Demas, N.; Pollard, G.; Rydel, J.J.; Ingram, M.; Greco, A. The Effect of Lubricant Composition on White Etching Crack Failures. Tribol. Lett. 2019, 67, 7. [Google Scholar] [CrossRef]
- Wang, L.; Holweger, W. White Etching Cracks (WECs) in Wind Turbine Bearings. In Proceedings of the World Tribology Congress 2017, Beijing, China, 17–22 September 2017. [Google Scholar]
- Paladugu, M.; Lucas, D.R.; Hyde, R.S. Effect of lubricants on bearing damage in rolling-sliding conditions: Evolution of white etching cracks. Wear 2018, 398–399, 165–177. [Google Scholar] [CrossRef]
- Kruhöffer, W.; Loos, J. WEC Formation in Rolling Bearings under Mixed Friction: Influences and “Friction Energy Accumulation as Indicator. Tribol. Trans. 2017, 60, 516–529. [Google Scholar] [CrossRef]
- Azzam, B.; Harzendorf, F.; Schelenz, R.; Holweger, W.; Jacobs, G. White Etching Crack Bearing Failure: Identification of High Risk Lubricant Compounds using Artificial Neural Networks. In Proceedings of the International Conference on Gears 2019, Garching bei München, Germany, 18–19 September 2019. [Google Scholar]
- Brandt, J.M.; Benedek, M.; Guerin, J.S.; Fliege, J. Industrial Analytics-based Bearing Risk Classification Systems investigated with Advanced Mathematical Models. IoT - Eng. Cyber Phys. Hum. Syst. (under review).
- Japkowicz, N. The class imbalance problem: Significance and strategies. In Proceedings of the Int’l Conf. on Artificial Intelligence, Las Vegas, NV, USA, 15 May 2000. [Google Scholar]
- Breiman, L. Random Forests. Mach. Learn. 2001, 45, 5–32. [Google Scholar] [CrossRef]
- Probst, P.; Wright, M.; Boulesteix, A.-L. Hyperparameters and Tuning Strategies for Random Forest. arXiv 2018, arXiv:1804.03515. [Google Scholar] [CrossRef]
- Probst, P.; Boulesteix, A.-L. To tune or not to tune the number of trees in random forest? arXiv 2017, arXiv:1705.05654. [Google Scholar]
- Meyer, D.; Dimitriadou, E.; Hornik, K.; Weingessel, A.; Leisch, F. e1071: Misc Functions of the Department of Statistics, Probability Theory Group (Formerly: E1071), TU Wienl; R Package Version 1.7-0. Available online: https://CRAN.R-project.org/package=e1071 (accessed on 22 November 2018).
- Kursa, M.B.; Rudnicki, W.R. Feature Selection with the Boruta Package. J. Stat. Softw. 2010, 1, 1–13. [Google Scholar]
- Ng, A. Feature Selection, L1 vs. L2 Regularization, and Rotational Invariance. In Proceedings of the 21st International Conference on Machine Learning, Banff, AB, Canada, 4–8 July 2004. [Google Scholar]
- Glorot, X.; Bengio, A.B.U.Y. Deep Sparse Rectifier Neural Networks. In Proceedings of the 14th International Conference on Artificial Intelligence and Statistics, Fort Lauderdale, FL, USA, 11–13 April 2011. [Google Scholar]
- Kingma, D.; Ba, J.L. ADAM: A Method for Stochastic Optimization. In Proceedings of the International Conference on Learning Representations, San Diego, CA, USA, 7–9 May 2015. [Google Scholar]
- Bridle, J.S. Probabilistic Interpretation of Feedforward Classification Network Outputs, with Relationships to Statistical Pattern Recognition. In Neurocomputing; Springer: Berlin/Heidelberg, Germany, 1990; pp. 227–236. [Google Scholar]
- Schmidhuber, J. Deep learning in neural networks: An overview. Neural Netw. 2015, 61, 85–117. [Google Scholar] [CrossRef]
- Agrawal, R.; Mannila, H.; Srikant, R.; Toivonen, H.; Verkamo, A. Fast discovery of association rules. In Advances in Knowledge Discovery and Data Mining; AAAI Press: Menlo Park, CA, USA, 1996; pp. 307–328. [Google Scholar]
- Hahsler, M.; Grün, B.; Hornik, K. arules—A Computational Environment for Mining Association Rules and Frequent Item Sets. J. Stat. Softw. 2005, 1, 1–25. [Google Scholar] [CrossRef]
- Allaire, J.; Chollet, F. keras: R Interface to ‘Keras’; R Package Version 2.2.0. 2018. Available online: https://CRAN.R-project.org/package=keras (accessed on 22 November 2018).
- Hahsler, M.; Buchta, C.; Grün, B.; Hornik, K. arules: Mining Association Rules and Frequent Itemsets; R Package Version 1.6-2. 2018. Available online: https://CRAN.R-project.org/package=arules (accessed on 9 January 2019).
- Tamada, K.; Tanaka, H. Occurence of brittle flaking on bearings used for automotive electrical instruments and auxiliary devices. Wear 1996, 199, 245–252. [Google Scholar] [CrossRef]


| Oil | c6 | c11 | c16 | Risk |
|---|---|---|---|---|
| 195 | 0% | 98% | 2% | Low |
| 196 | 0.5% | 99% | 0.5% | High |
| Rule No. | Association Rules |
|---|---|
| 1 | {c16} ≥ {c12} |
| 2 | {c8,c9} ≥ {c12} |
| Rule No. | Association Rules | Support | Confidence | Lift | Count |
|---|---|---|---|---|---|
| 1 | {c16} ≥ {c12} | 0.0530 | 0.136 | 0.798 | 36 |
| 2 | {c8,c9} ≥ {c12} | 0.0133 | 1 | 5.853 | 9 |
| 3 | {c3} ≥ {c16} | 0.0177 | 0.4 | 1.029 | 12 |
| Rules | Confidence |
|---|---|
| {c15} ≥ {c12} | 1 |
| {c17,c21} ≥ {c16} | 1 |
| {c19,c21} ≥ {c16} | 1 |
| {c3,c16} ≥ {c6} | 1 |
| {c3,c6} ≥ {c16} | 1 |
| {c4,c16} ≥ {c6} | 1 |
| {c4,c6} ≥ {c16} | 1 |
| {c5,c16} ≥ {c6} | 1 |
| {c5,c6} ≥ {c16} | 1 |
| {c6,c10} ≥ {c16} | 1 |
| {c8,c9} ≥ {c12} | 1 |
| {c9,c17} ≥ {c6} | 1 |
| {c9,c19} ≥ {c6} | 1 |
| {c9,c18} ≥ {c6} | 0.82 |
| Method | Important Compounds |
|---|---|
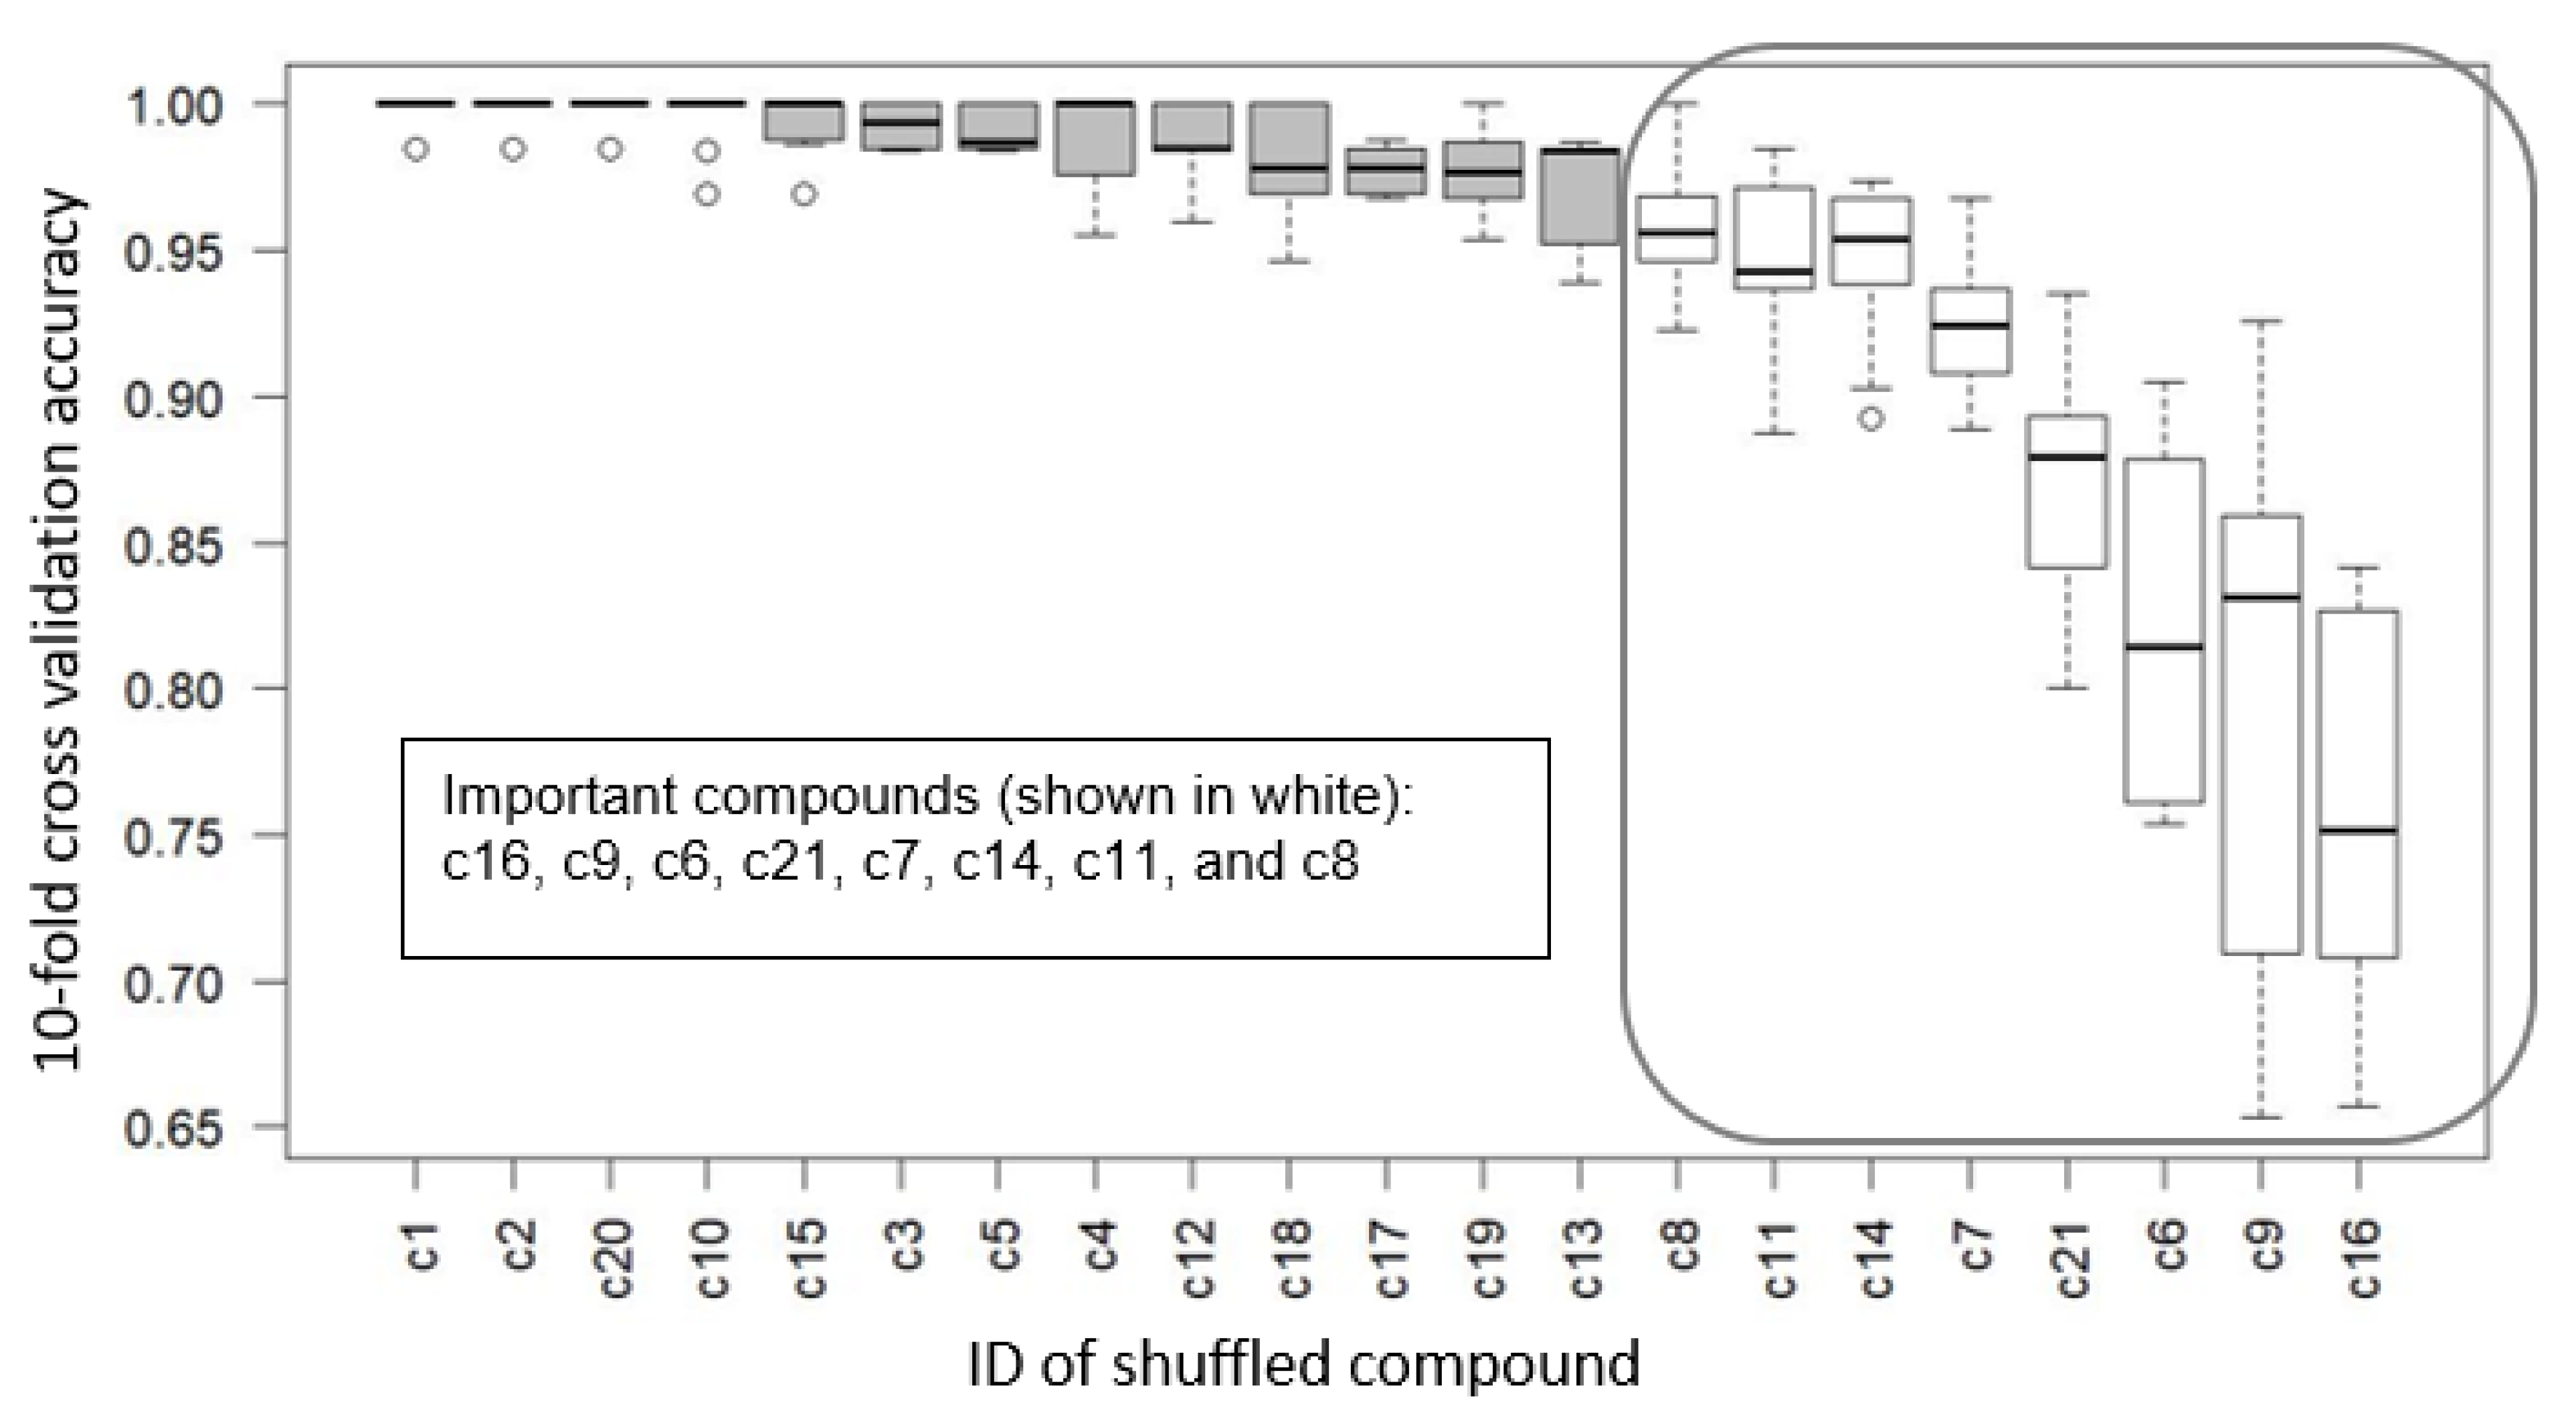
| Neural Network-based Feature Selection (NN-based FS) | c16, c9, c6, c21, c7, c14, c11, c8 |
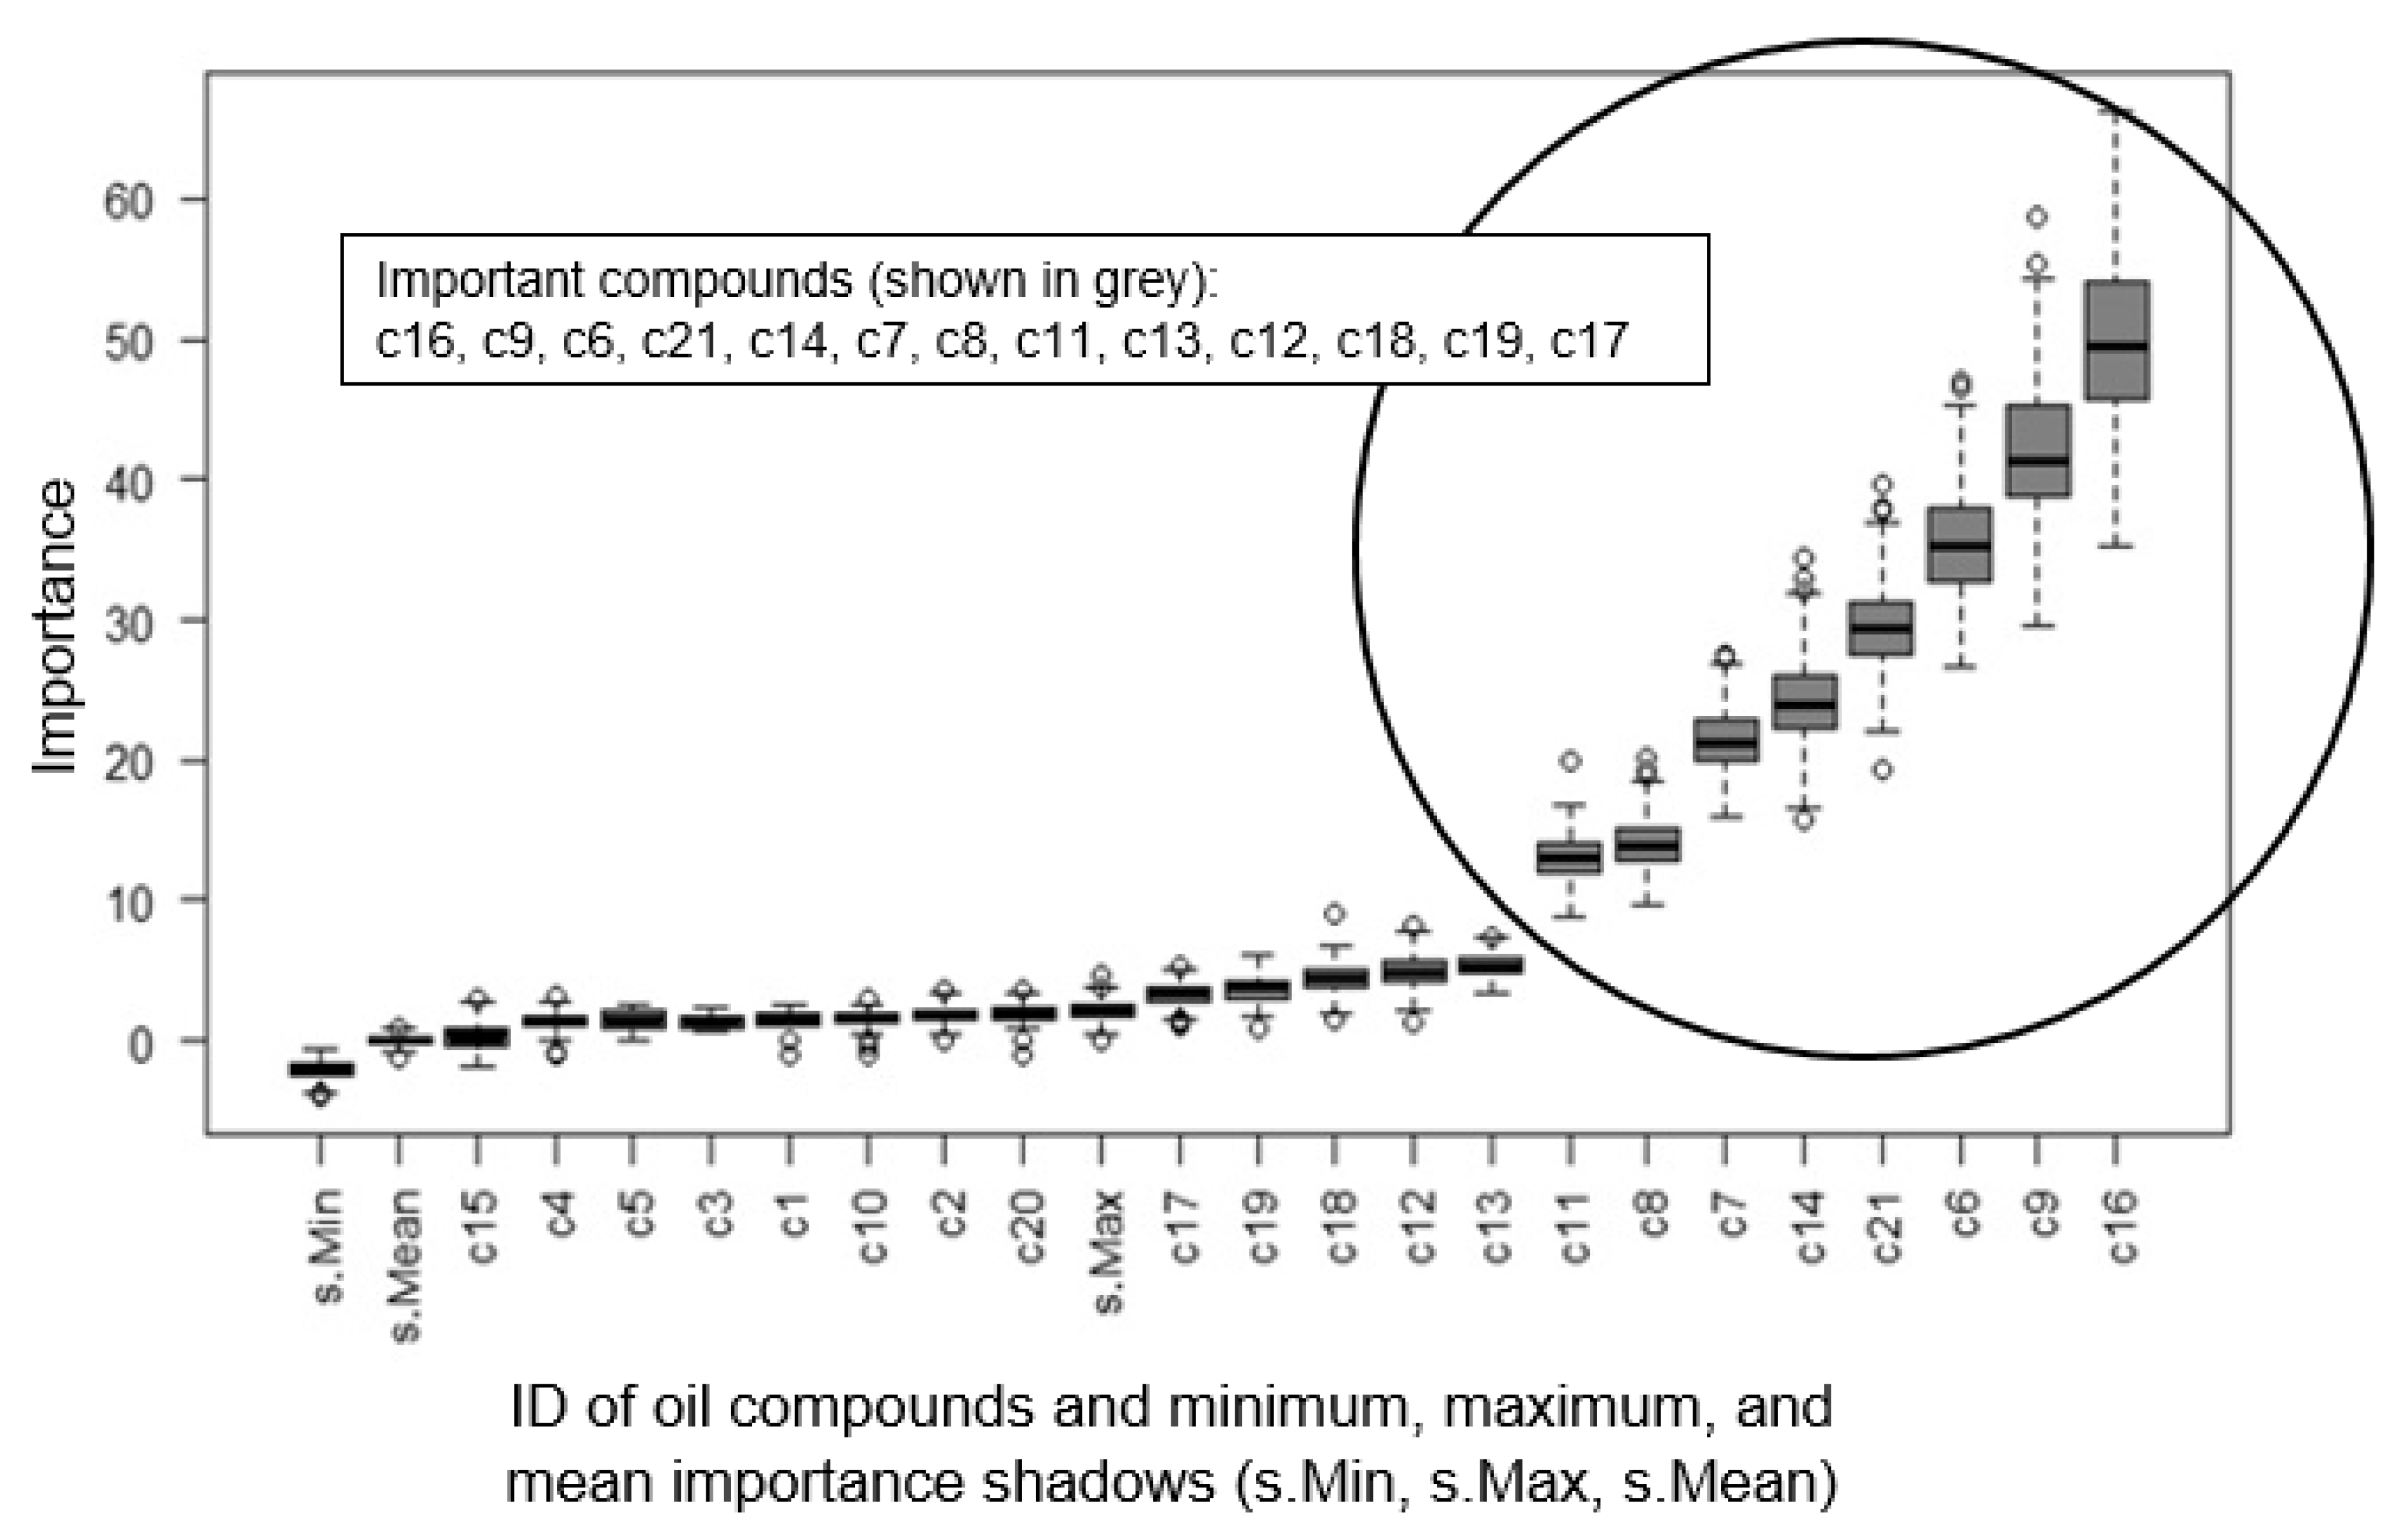
| Boruta [35] | c16, c9, c6, c21, c14, c7, c8, c11 |
© 2019 by the authors. Licensee MDPI, Basel, Switzerland. This article is an open access article distributed under the terms and conditions of the Creative Commons Attribution (CC BY) license (http://creativecommons.org/licenses/by/4.0/).
Share and Cite
Azzam, B.; Harzendorf, F.; Schelenz, R.; Holweger, W.; Jacobs, G. Pattern Discovery in White Etching Crack Experimental Data Using Machine Learning Techniques. Appl. Sci. 2019, 9, 5502. https://doi.org/10.3390/app9245502
Azzam B, Harzendorf F, Schelenz R, Holweger W, Jacobs G. Pattern Discovery in White Etching Crack Experimental Data Using Machine Learning Techniques. Applied Sciences. 2019; 9(24):5502. https://doi.org/10.3390/app9245502
Chicago/Turabian StyleAzzam, Baher, Freia Harzendorf, Ralf Schelenz, Walter Holweger, and Georg Jacobs. 2019. "Pattern Discovery in White Etching Crack Experimental Data Using Machine Learning Techniques" Applied Sciences 9, no. 24: 5502. https://doi.org/10.3390/app9245502
APA StyleAzzam, B., Harzendorf, F., Schelenz, R., Holweger, W., & Jacobs, G. (2019). Pattern Discovery in White Etching Crack Experimental Data Using Machine Learning Techniques. Applied Sciences, 9(24), 5502. https://doi.org/10.3390/app9245502