1. Introduction
The continuous development of laser technology has enabled its widespread application in the communication, medical, and manufacturing fields. Laser paint removal, which is an efficient paint layer treatment method, is a new application. Compared to the traditional physical and chemical paint removal methods, laser paint removal has several advantages: (1) non-contact cleaning with small impact on the substrate; (2) less environmental pollution, and easy disposal of the resultant waste; (3) high cleaning efficiency with low costs; and (4) good controllability. This technology can be used to remove paint off the surface of buildings, bridges, aircraft, vehicles, and various mechanical equipment. Although it has been widely studied, its physical mechanism is complicated, proving to be a challenge for researchers.
Laser paint removal involves a series of complex processes, such as melting, evaporation, and combustion. Watkins [
1] summarized and classified the laser cleaning mechanism into six kinds of action mechanisms: ablation, rapid heating and cooling caused by vibration waves, selective vaporization, light pressure, gasification pressure, and plasma burst. Research by Tsunemi [
2] and Zhou [
3] portrayed the laser process as an ablation effect. Bloisi [
4] and Kim [
5] highlighted the application of a thermoelastic vibration model in laser cleaning. Yang [
6] investigated the influence of thermal stress during the laser paint removal process and found that paint absorbed laser energy, formed a large temperature gradient, and was finally removed by thermal stress. A study by Autric et al. [
7] showed that ablation and thermo-mechanical actions were the main mechanisms used for the absorption medium and transparent medium, respectively. Luo et al. [
8] studied laser paint removal behavior using a high-power continuous CO
2 laser. They found that the paint removal mechanism was not an independent action, but one that included thermal stress, laser soft ablation, and plasma effects. Several factors—such as the physical and chemical properties of the attachment, physical parameters of the substrate materials and the laser beam, and the cleaning environment—determine which mechanism is dominant.
All of these findings provide important references to study laser paint removal. We found that the use of functional groups and elemental valence changes to study this technology was relatively low.
The experiment performed in this paper aimed at investigating the laser mechanism of paint removal. A finite element model of mobile pulse laser cleaning was established by using COMSOL Multiphysics software. The calculation of temperature fields during laser cleaning was used to aid the analysis. A cleaning experiment was also carried out. Furthermore, to determine the decomposition process, the chemical and physical characteristics of the surface cleaned by the laser were analyzed by XPS. By analyzing changes in the functional groups and chemical valence of C, O, N, Al, and Ti on the surface of the sample before and after cleaning, as well as SEM images of the cleaning surface and the collected particles, the laser paint removal mechanism was comprehensively studied; a high repetition frequency fiber laser was used for the study.
2. Materials and Methods
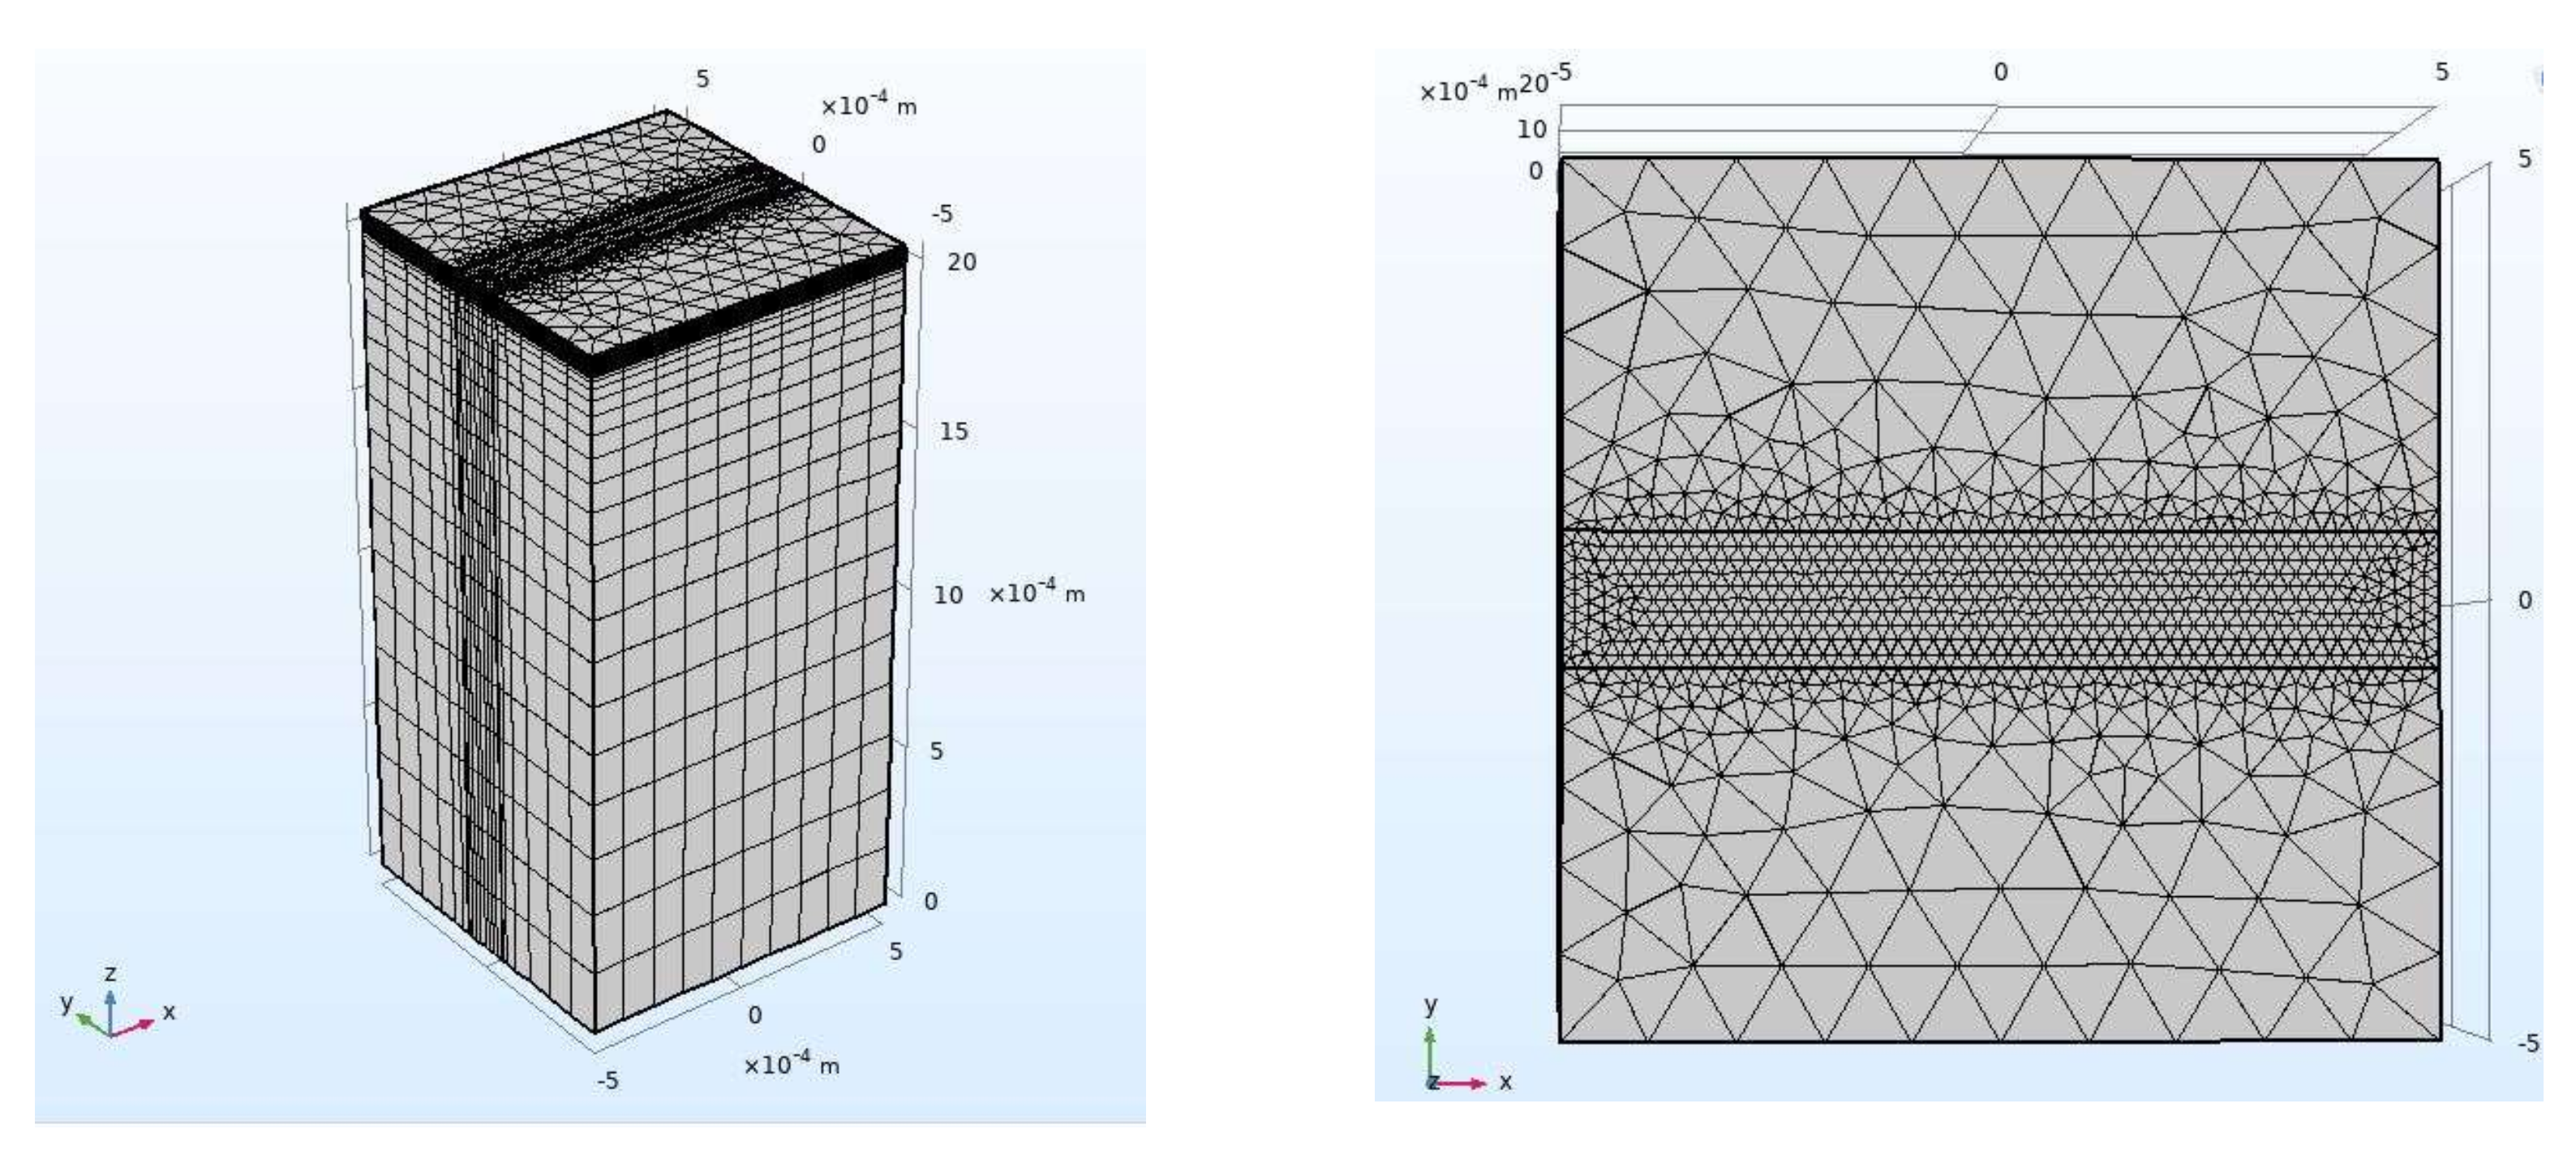
Figure 1 shows a finite element model for laser cleaning. To replicate the actual materials, the model was made of an LY12 aluminum alloy substrate measuring 1 mm × 1 mm × 2 mm, an oxide layer with thickness of 7 μm, and a 50 μm polyacrylate resin base paint layer. The moving pulse laser scans the sample in a single pass in the positive direction along the X-axis. The paint layer directly absorbs the laser energy during the cleaning process, and heat is thermally transferred to the oxide layer and the surface of the substrate. By referring to the pre-experiment and experimental equipment conditions, a simulation calculation was carried out using a set of parameters with a fixed wavelength of 1064 nm, pulse width 1 μs, energy density 17.26 J/cm
2, spot diameter 78 μm, laser repetition frequency 20 kHz, and scanning speed 600 mm/s.
Laser cleaning experiments were carried out using a fiber laser with the same parameters. The beam was in Gaussian mode, and spot diameter after pulse laser focusing was about 78 μm. The base material used was LY12 aluminum alloy with size of 15 mm × 15 mm × 2 mm. A yellow polyacrylate resin base (polyisocyanate resin curing agent with a nanoparticle additive such as TiO
2, Al
2O
3) paint layer on an aluminum alloy surface with thickness of 50 μm was used for the experiment. The surface of the aluminum alloy was anodized to form an oxide layer with thickness of about 7 μm.
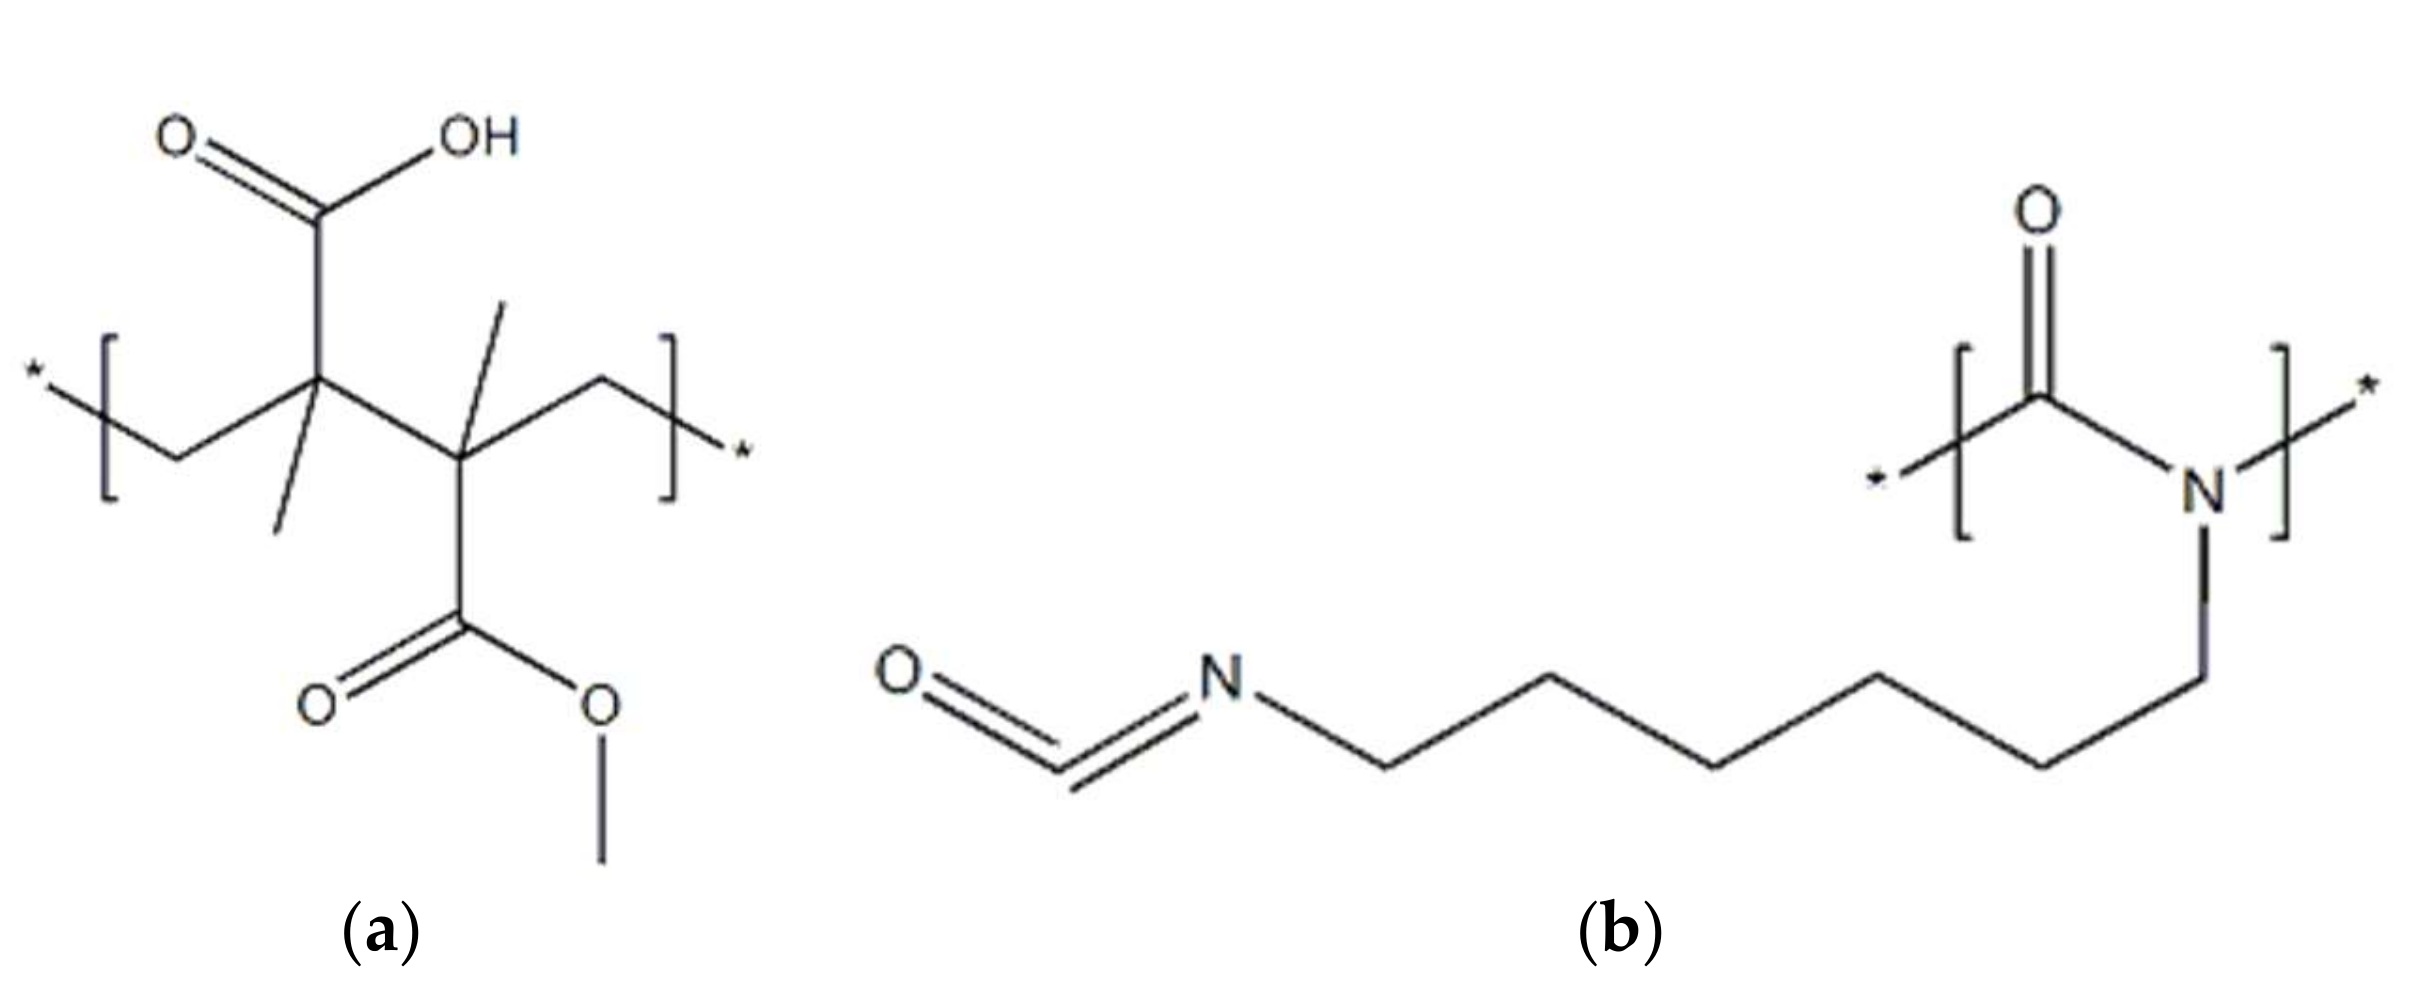
Table 1 shows the composition of the paint layer, the oxide layer, and the aluminum alloy. The molecular structure of polyacrylate resin and polyisocyanate resin is shown in
Figure 2. A silicon wafer was used as the substrate to collect particles, measuring 2 mm × 2 mm, approximately 17 mm from the sample, and parallel to the surface of the sample, facing the ablation port. The silicon wafer was ultrasonically cleaned in an ethanol solution for 5 min to remove surface contaminants.
The surface of the paint layer on the 2 mm thick aluminum alloy plate was placed on the laser focal plane. With oscillation of the X and Y axis galvanometers in the scanning galvanometer system, an orderly laser pattern was applied to the paint layer. The surface of the paint layer was scanned once to remove the paint layer. The laser beam emitted by the fiber laser was in the form of a series of discrete circular spots, distributed at a given frequency.
Fourier transform infrared spectroscopy (FT-IR, Nicolet 5700) and X-ray photoelectron spectroscopy (XPS, ESCALAB 250xi) were used to evaluate the functional groups and the chemical valence of C, O, N, Al, and Ti. Scanning electron microscopy (SEM) was used to observe and analyze particle morphology and the morphology of the cleaning surface and the original surface.
3. Results and Discussion
3.1. Finite Element Simulation Analysis
Figure 3 shows the dynamic change in temperature field distribution of the model during the laser cleaning process. The pulsed laser heat source moved at a speed of 600 mm/s in the X direction, and temperature field distribution appeared as a comet with a tail. The temperature in the center of the pulsed spot was the highest, the edge gradually decreased, and the temperature field conformed to a Gaussian distribution. The uncooled temperature field that was formed by the previous pulse remained on the scanning path. The reason for this is that the temperature field formed by each pulse was connected at a certain overlap rate.
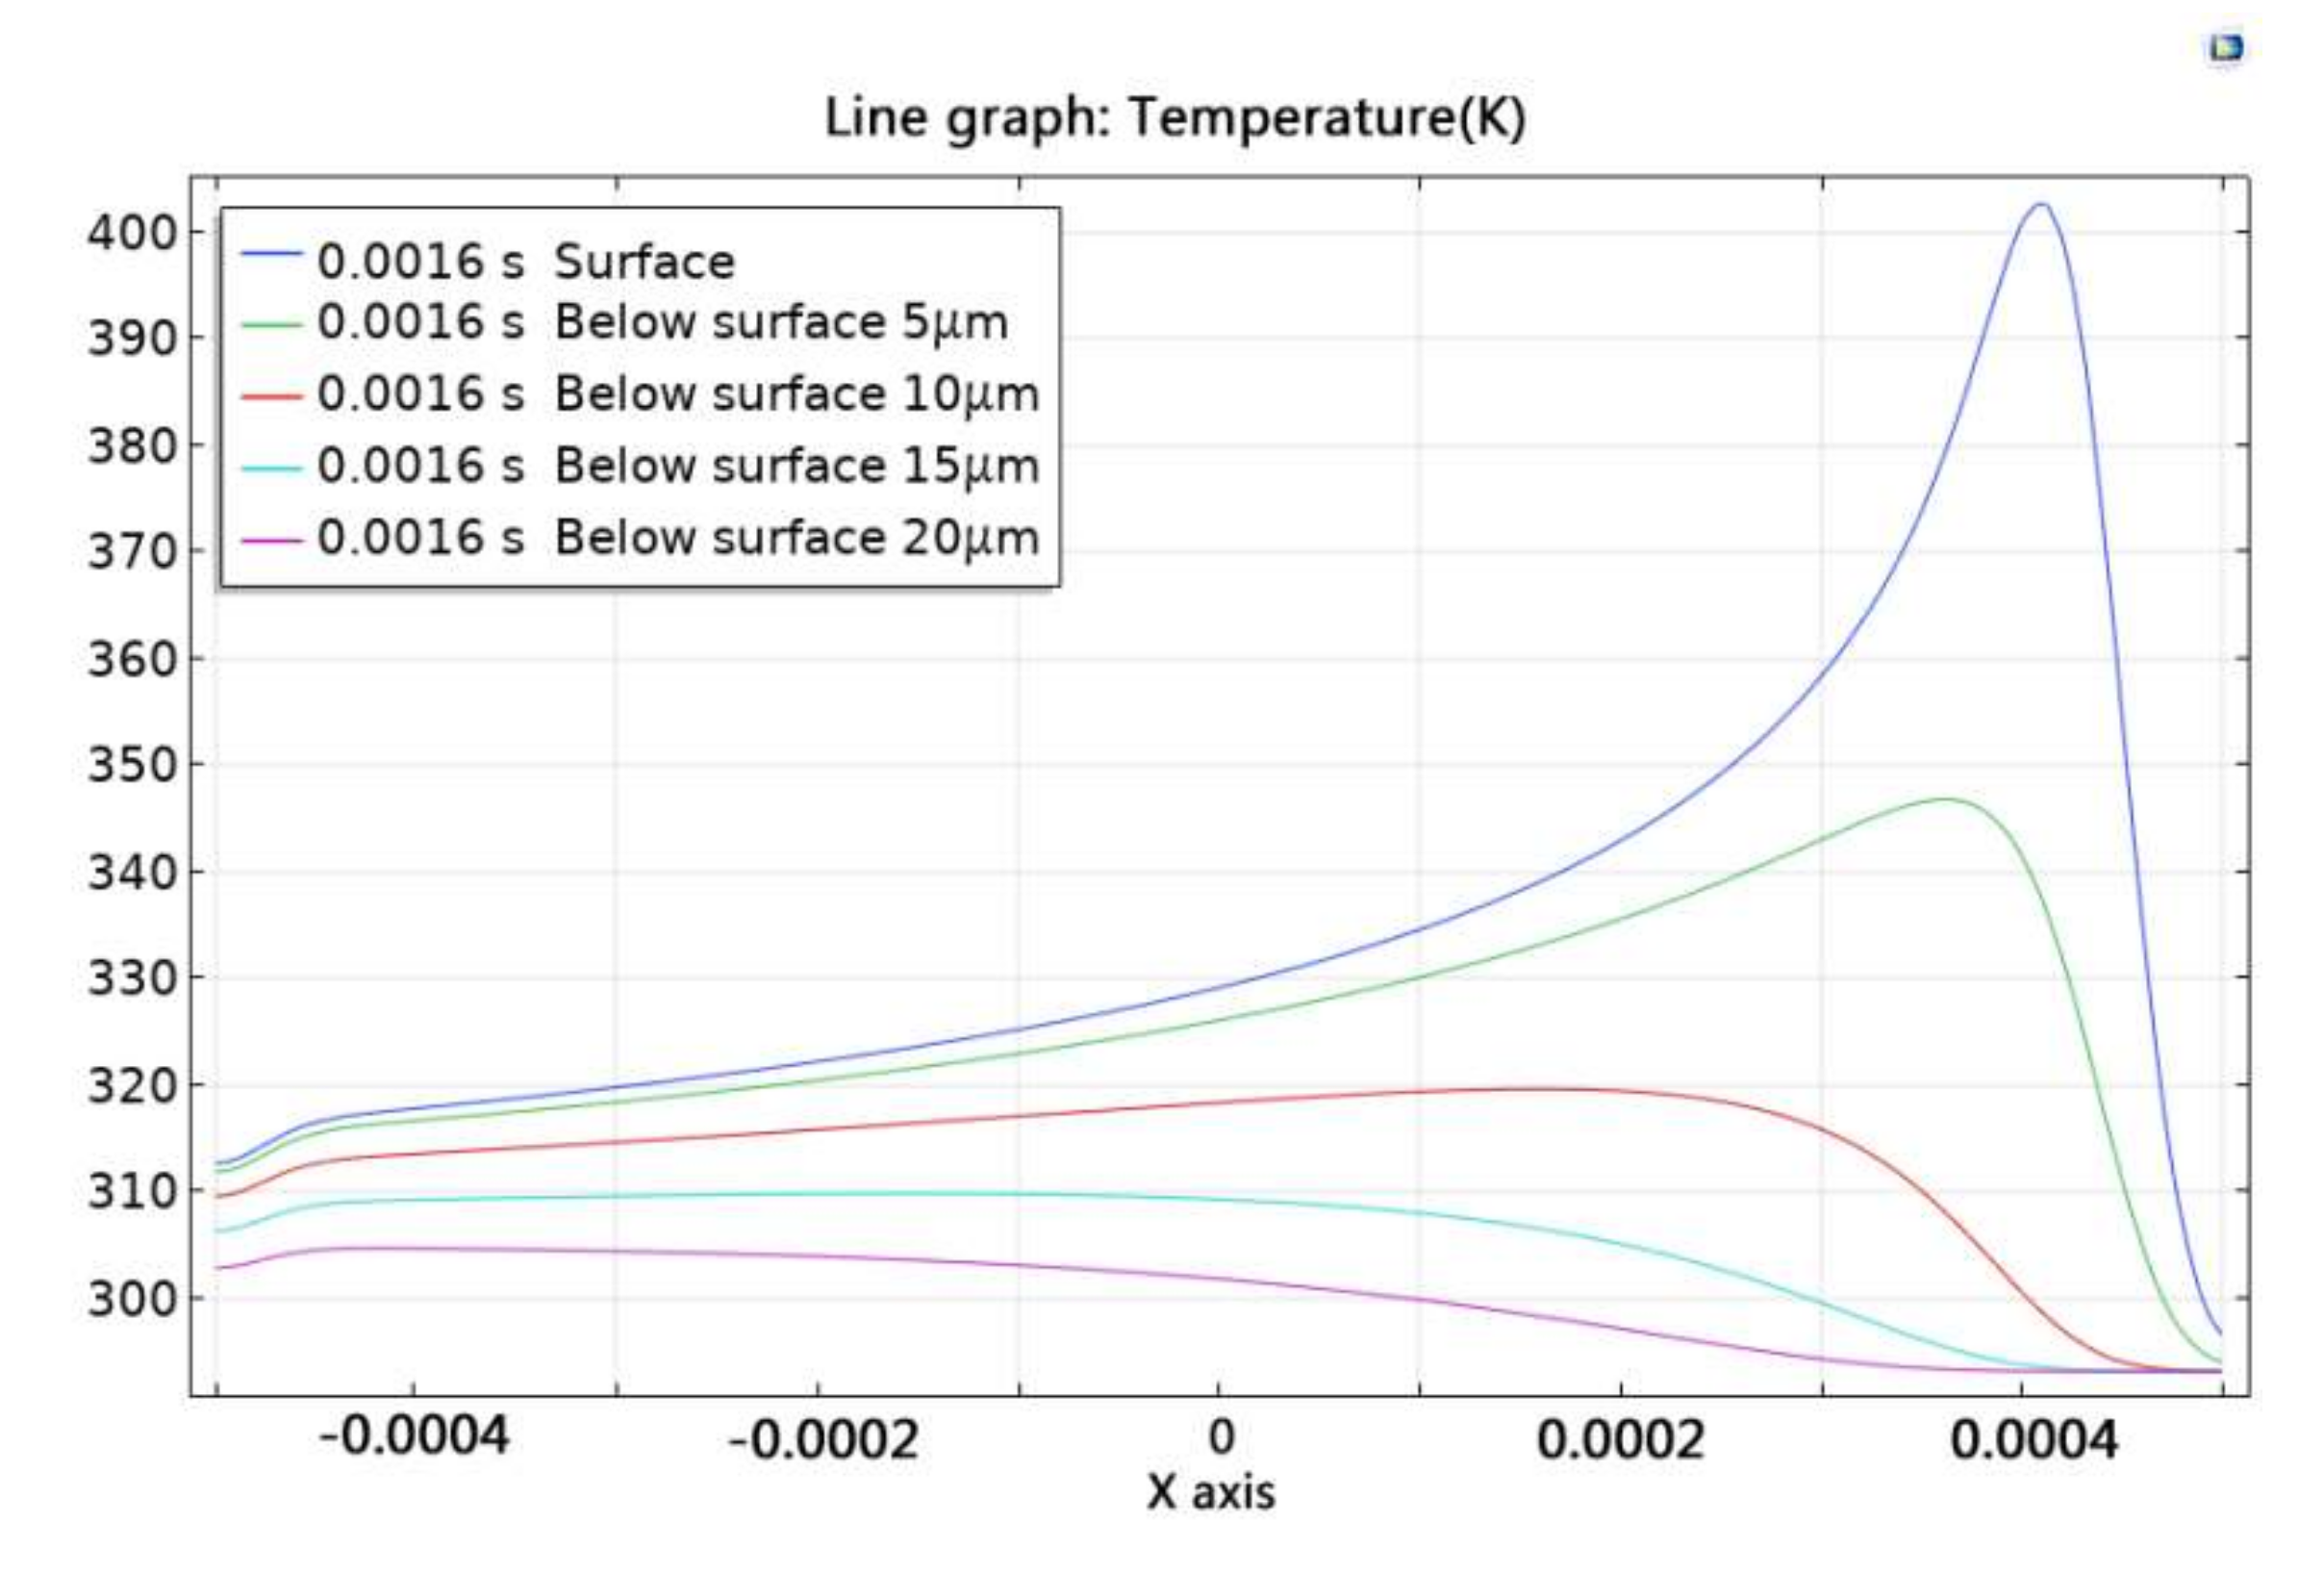
Figure 4 shows the temperature change curve at different positions in the x-axis direction at t = 0.0016 s. It can be seen that temperature change of the material is mainly concentrated near the pulse spot irradiation area during the laser cleaning process. The temperature of the paint below surface 15 μm did not change, which indicated that the depth affected by the laser was about 15 μm. When x < 0.0035, the temperature of the paint at different depths increased, which also indicated that there was overlap in the temperature field formed by each pulse, causing an energy accumulation effect.
With irradiation of the pulse laser (with high repetition frequency), the paint layer absorbed a large amount of laser energy in a short time, and the surface temperature of the paint layer rose rapidly.
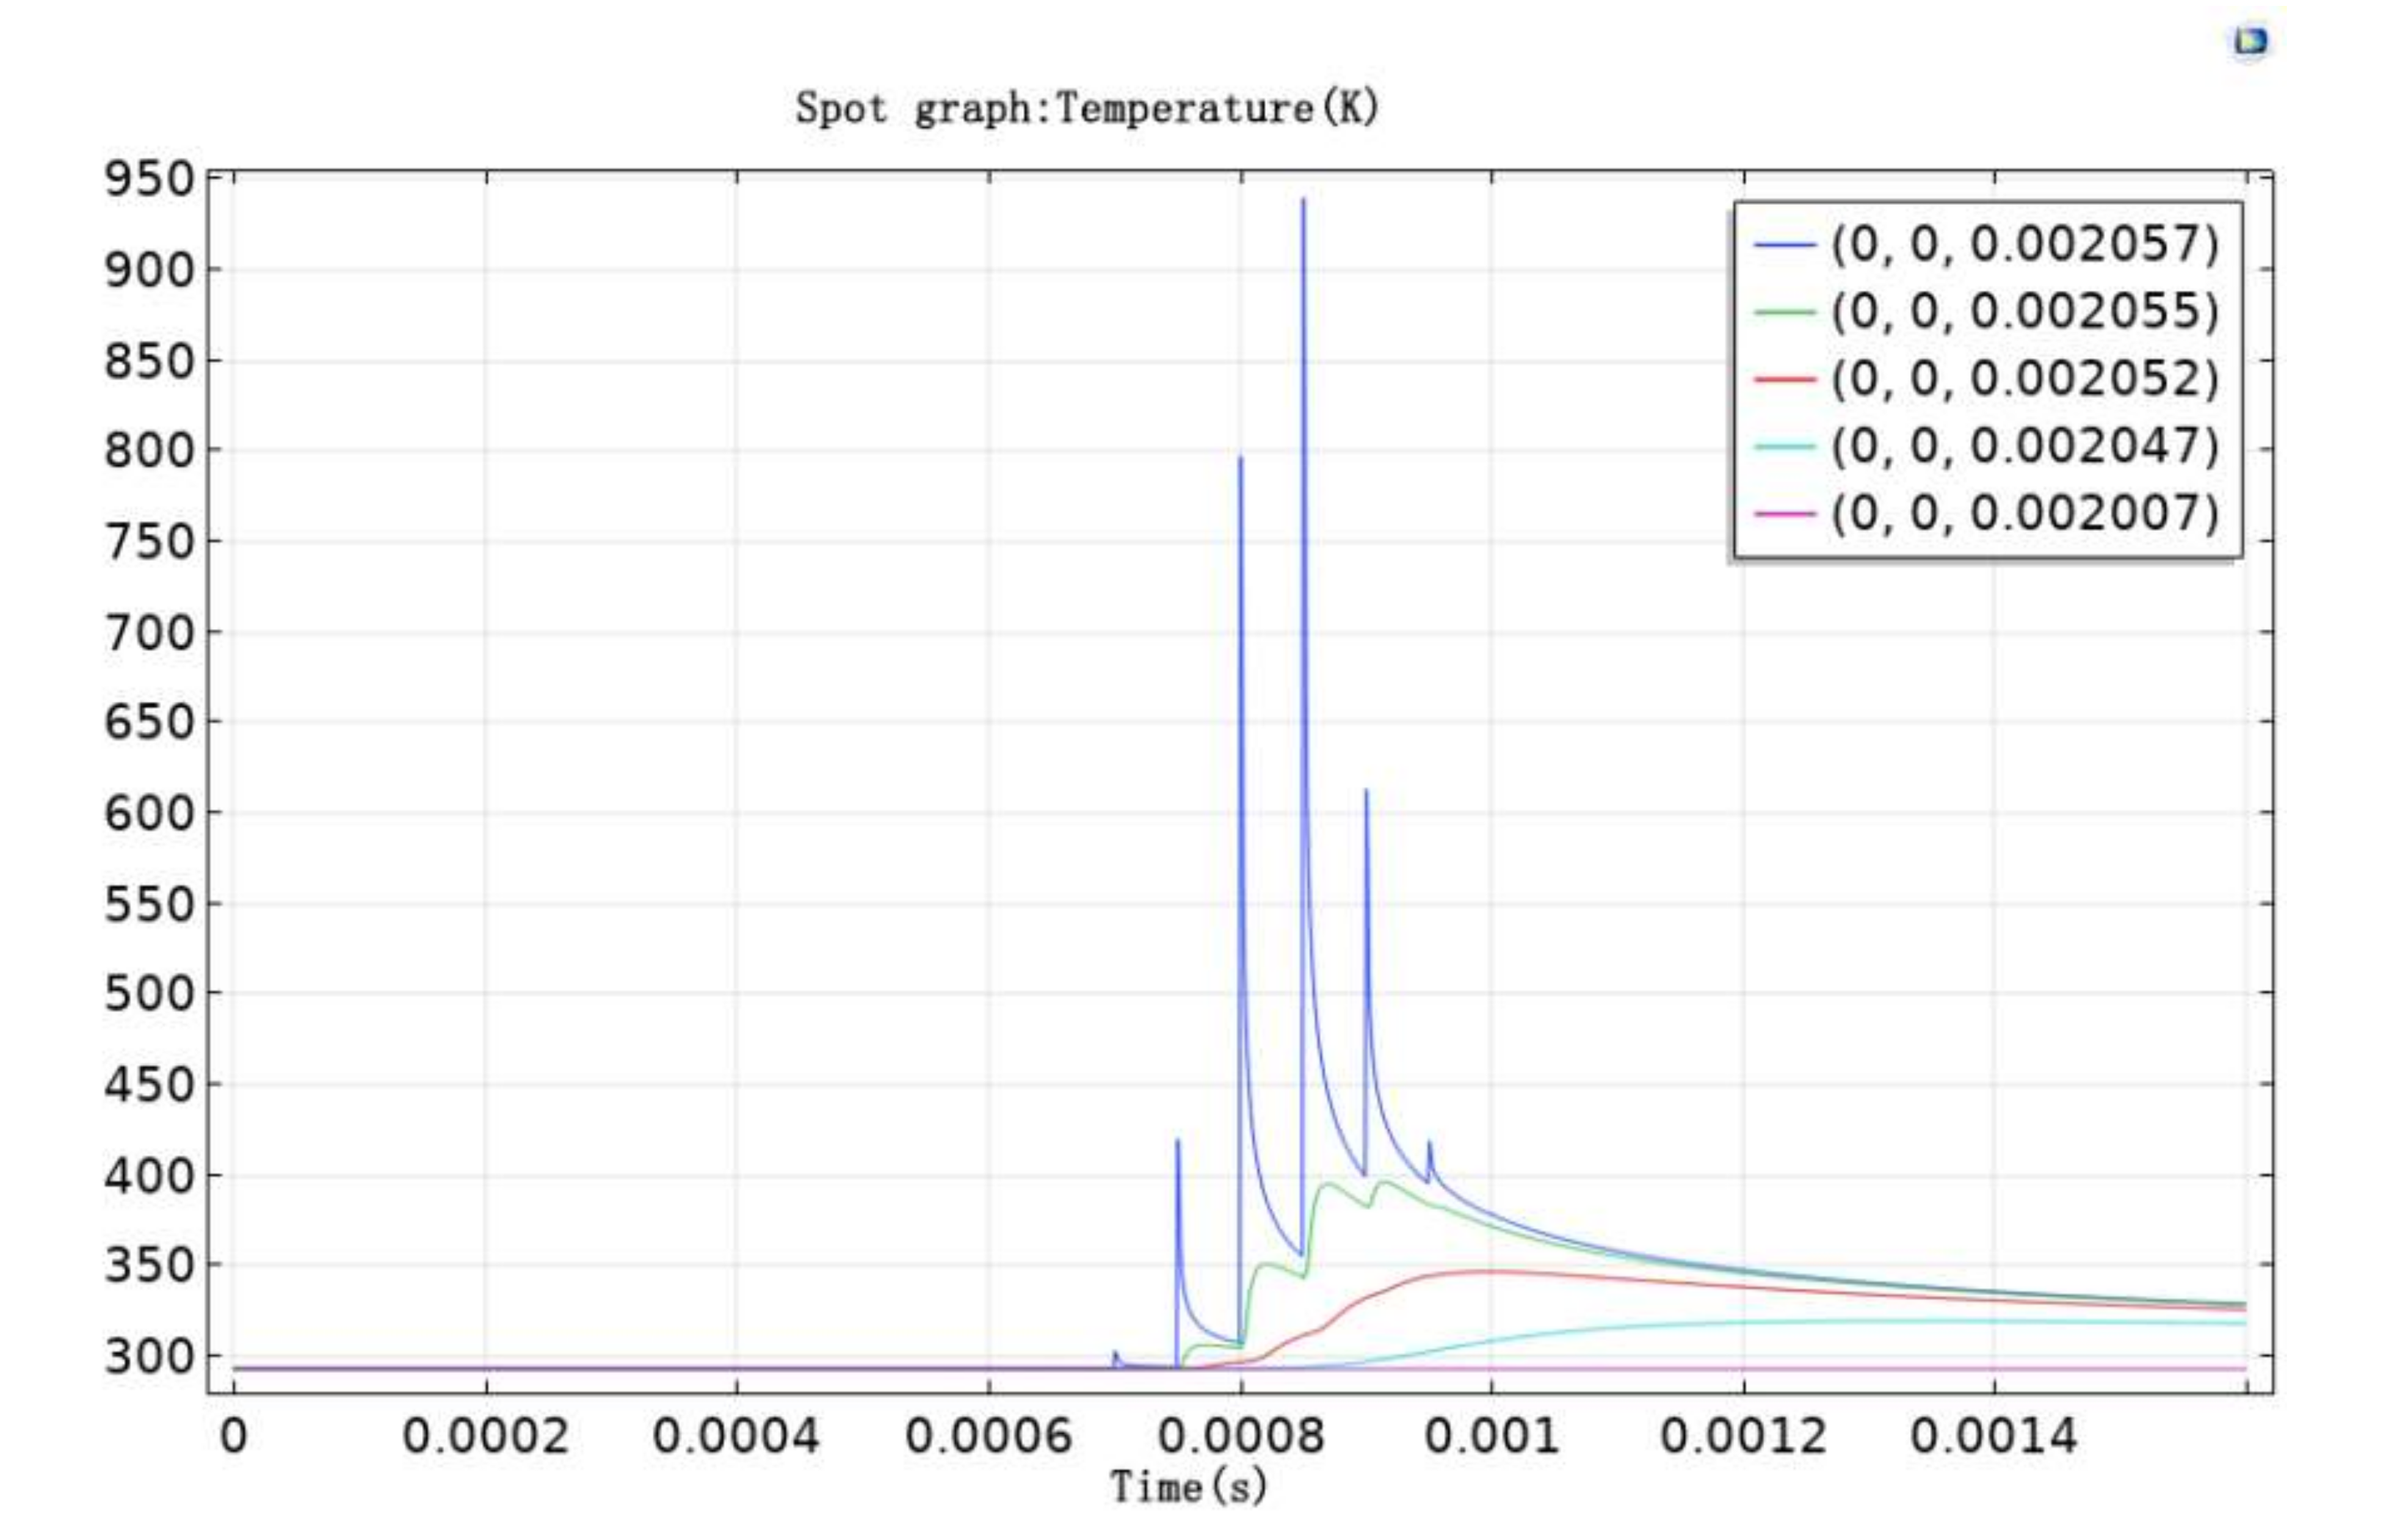
Figure 5 shows the temperature change in the direction of depth. At z = 0 μm, the range of temperature change was the largest, which reached maximum value at t = 0.000851 s. The temperature of some parts of the paint layer exceeded the gasification threshold and were eliminated by vaporization and combustion. The pulse laser, however, was t = 0.00083 s. This difference shows that there was an energy accumulation effect on the surface of the paint layer during the cleaning process. Temperature changes at z = 0 μm were found to be zigzag because of the pulsed laser. In addition, an intermittent time pattern was seen during the laser processing. Compared to the z = 0 μm position, it is evident that it took time for the temperature to reach maximum value. This is due to the hysteresis of the maximum temperature caused by thermal conduction in the material.
3.2. FT-IR Analysis
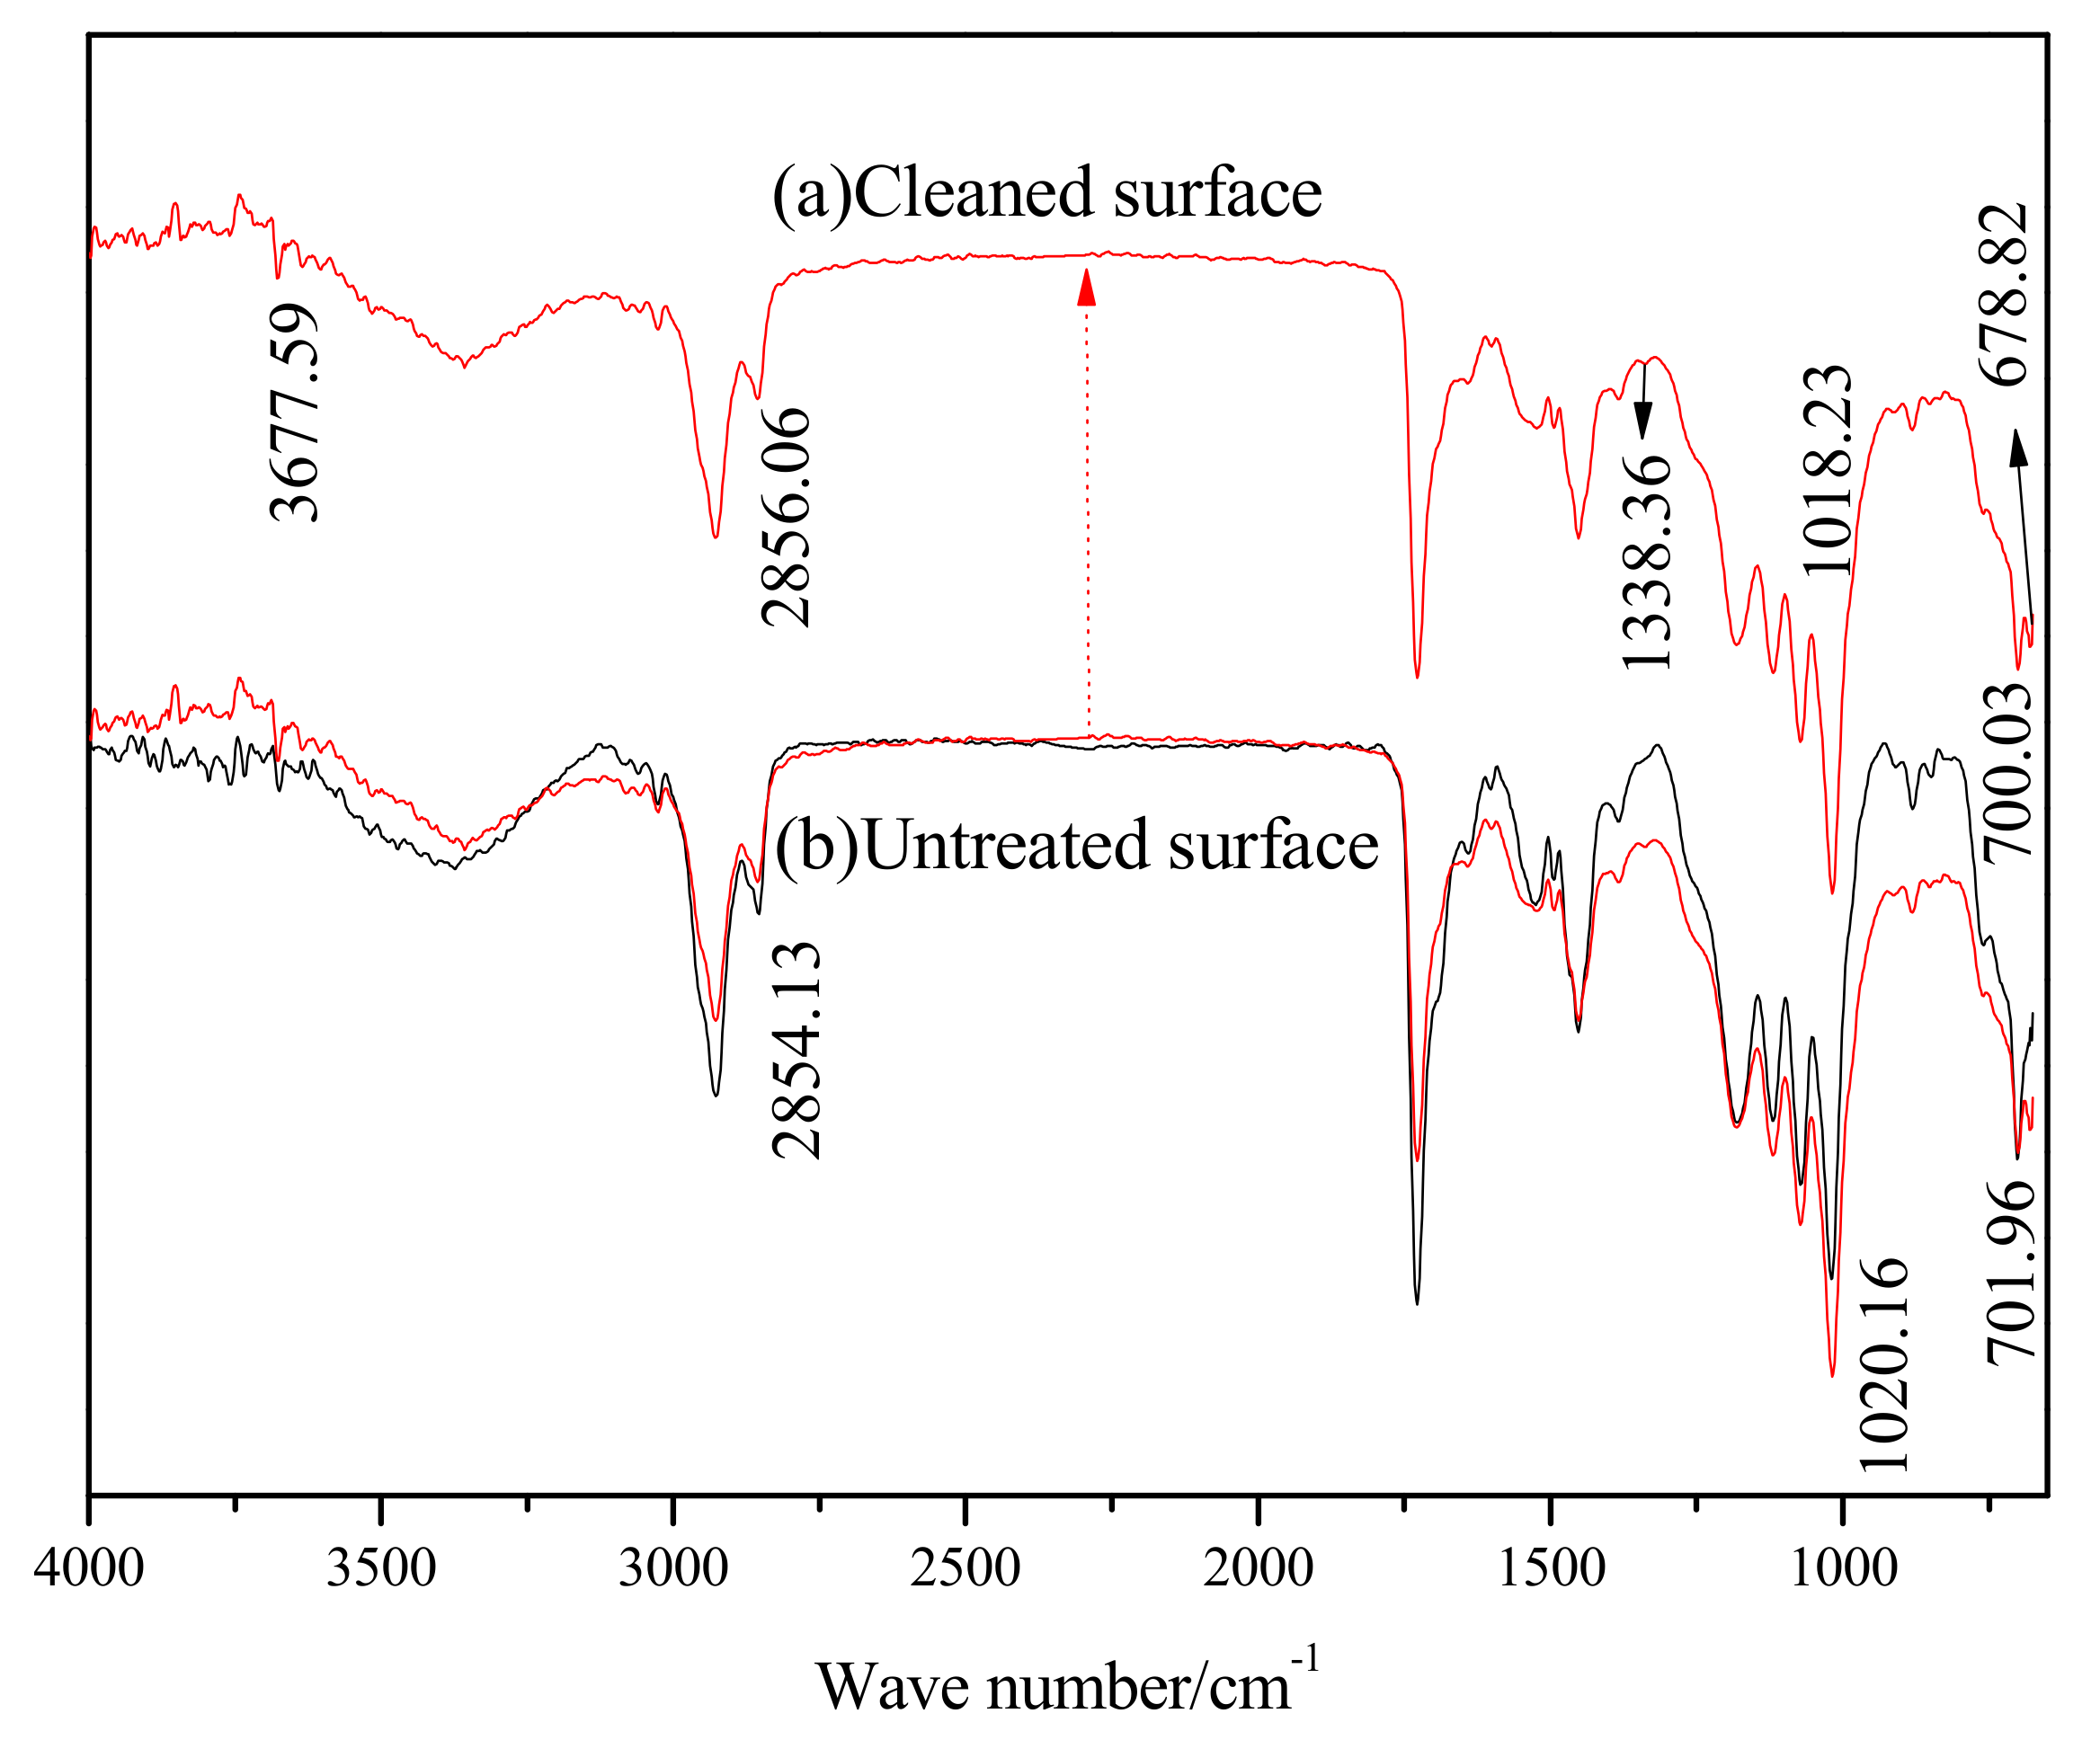
Figure 6 shows the FT-IR spectra of the sample, before and after laser cleaning. The main peaks in the infrared spectrum of the original paint sample are listed in
Table 2.
After cleaning with the pulsed laser, the FT-IR spectra of the cleaning surface was found to have two additional absorption peaks at 1383.36 cm−1 and 678.82 cm−1, which are the absorption peaks of C-H single bond vibration in -C(-)- and N-H single bond vibration, respectively. The cleavage of chemical bonds such as C-C and C-H was present during the laser cleaning process. The sharp absorption band at 3677.59 cm−1 was the stretching vibration absorption peak of the free O-H bond. This peak shows that as the surface roughness of the laser cleaning and the surface area increases, the adsorption amount and strength of the absorption peak of the -OH rises. The peak at 1018.23 cm−1 is the absorption peak of the vibration of the C-C single bond skeleton, which increased in strength and had a blue shift. As a result, the C-C single bond skeleton on the cleaning surface increased, and the structure of the polymer was found to be stable. The absorption peak of C-C at 700.03 cm−1 in the long carbon chain saturated hydrocarbon was found to have a blue shift and a decrease in strength, indicating that the content of C-C in carbon chain saturated hydrocarbons was reduced. Intensity of the other absorption peaks on the cleaning surface also decreased, which show that the content of -OH, -C=O, -CH3, -CH2-, and C-H in the polymer decreased separately. The absorption peak of C-H at 2856.06 cm-1 in -CH2- had a red shift, indicating a reduction in the number of electron-withdrawing matrices, such as –C=O, -C-O, -COOH, in the molecular chain. Thus, the electron cloud in the molecular chain shifted and enabled a red shift in the characteristic absorption peak. The above analysis shows that breakage and rearrangement of chemical bonds occur in laser cleaning processes, resulting in new polymers or monomers.
3.3. XPS Analysis
The changes in the surface composition of the paint after laser cleaning were determined by XPS.
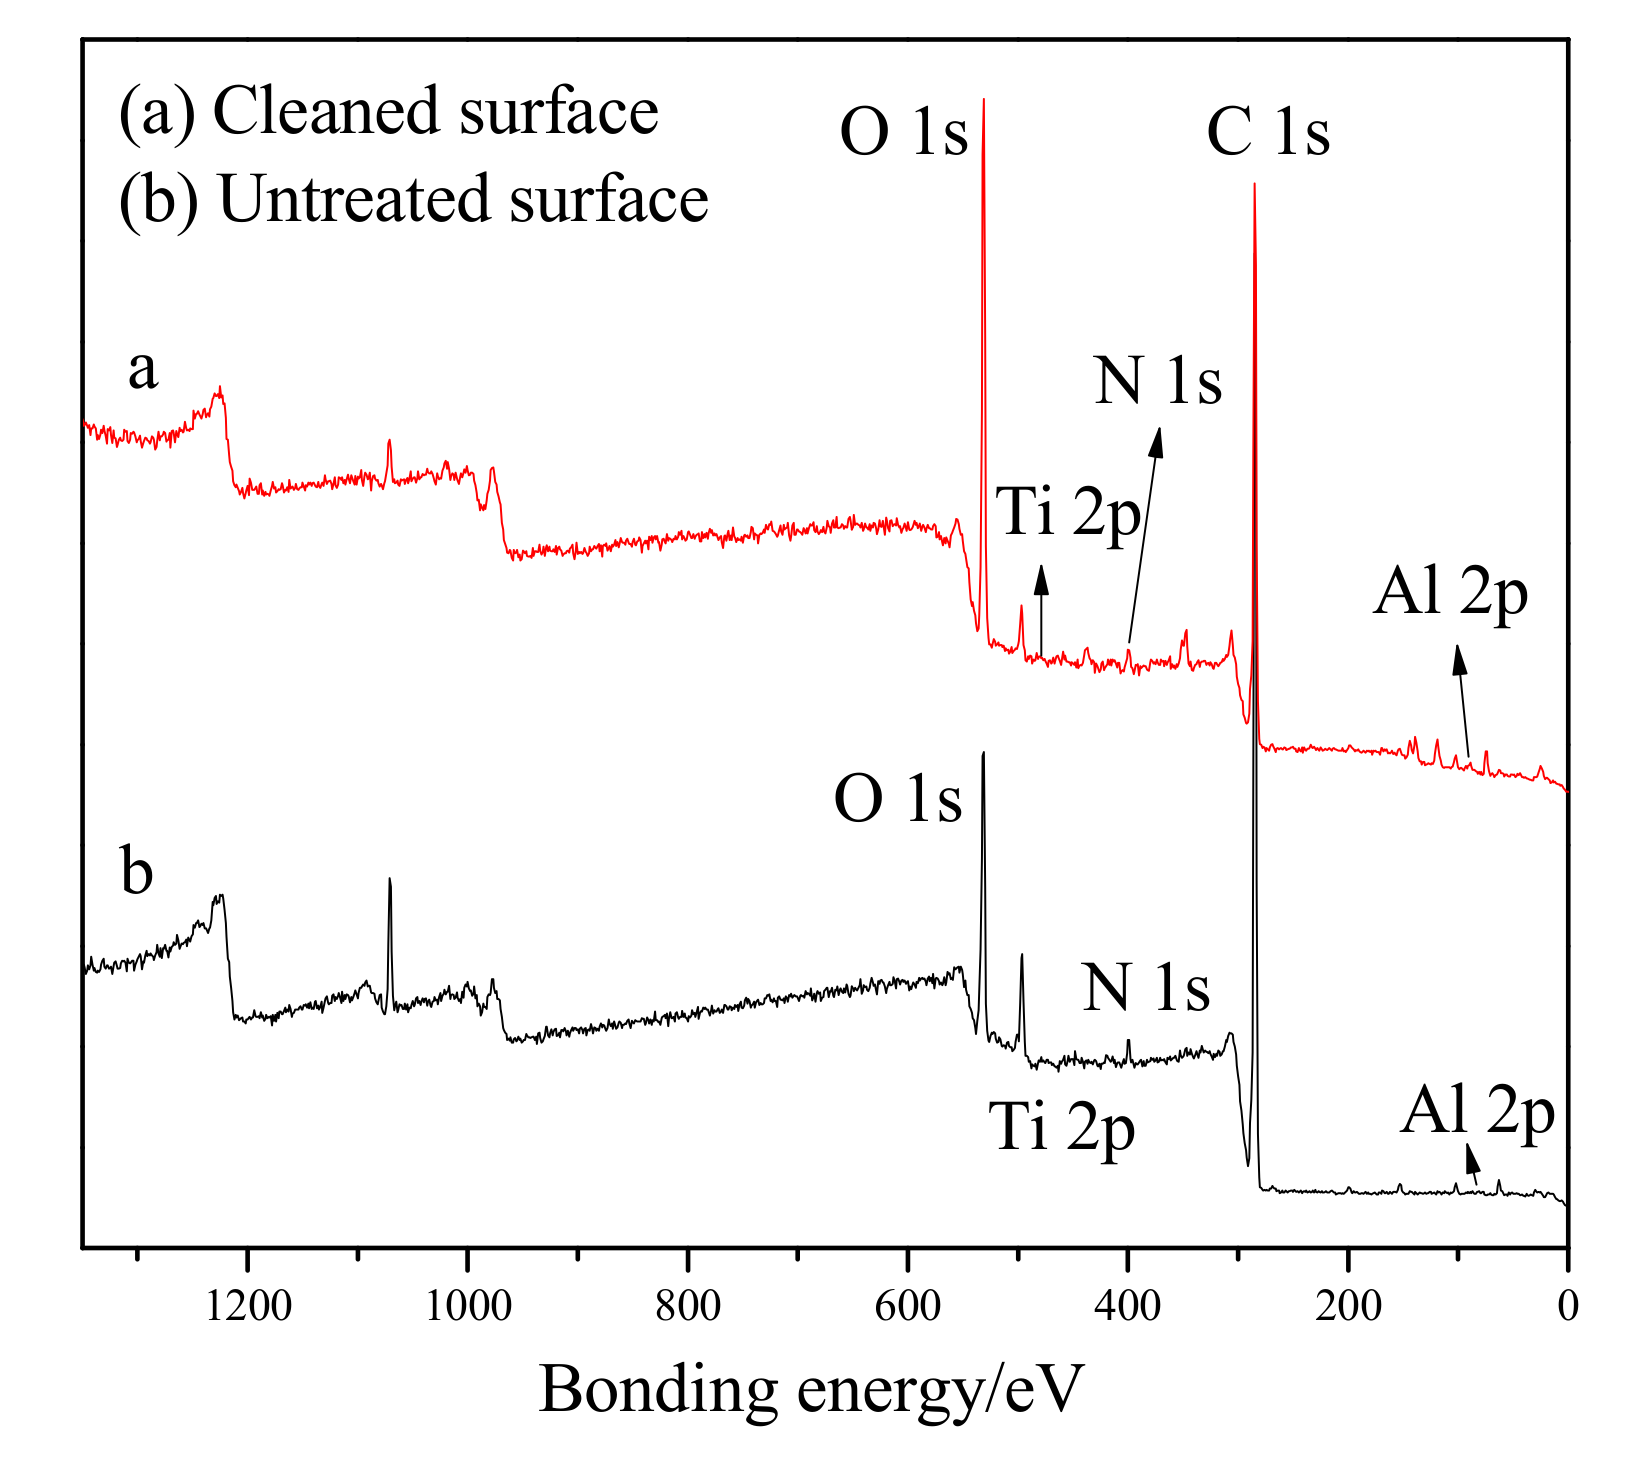
Figure 7 presents the spectra of (a) the cleaned surface and (b) the untreated surface. Peaks of 1s core level of C, O, N and 2p core level of Ti, Al are clearly visible, and the peaks of C, O, and N were found to have changed significantly before and after the cleaning. The results show that the peaks of C and N in the cleaned surface had decreased, while the peak of O had increased. The reason for this difference is most likely due to the following analysis: The surface of the residual paint layer was no longer smooth, and the surface area had obviously increased. In addition, nanoparticle additives such as TiO
2 and Al
2O
3 were found exposed on the surface. The polymer molecular chain was thermally decomposed and burned by absorbing laser energy, illustrating that the paint had released C and N atoms as simple gas or volatile species of CO and NO
2 during the cleaning process. The peaks of C, N were found to be lower on the cleaning surface and the intensity of the peak of O was enhanced. This is probably due to chemical reactions taking place while the pulsed laser was removing the paint.
The electronic state and existing forms of C, O, N, Ti, and Al can be further studied by examining the fine spectra of each element on the surface of the paint layer before and after laser cleaning. The profiles of the C1s, O1s, N1s, Ti2p and Al2p spectra on the surface of the paint layer before and after laser cleaning are shown in
Figure 8,
Figure 9,
Figure 10 and
Figure 11, respectively.
3.3.1. C1s XPS Analysis
The curv—fitted XPS spectra of C1s obtained from the cleaned and untreated surfaces reveals four peaks (
Figure 8). The components of C1s spectra for various binding energy values are listed in
Table 3. The new components for C1s—C, C
96.8O
3.2, C
93.1O
6.9, (-CH
2CH(C(O)OCH
3)-)
n, (-CH
2CH(C(O)OH)-)
n, (-CH
2CHC(CH
3)CH
2-)
n, (-CH
2C(CH
3)(C(O)OCH2CH
3)-)
n, and (-CH
2C(CH
3)(C(O)OC(CH
3)
3-)
n—were detected and analyzed. The presence of C, C
96.8O
3.2, C
93.1O
6.9 indicates that the high laser energy caused the paint to undergo carbonization and combustion during the cleaning process. The content of (-CH
2CH(C(O)OCH
3)-)
n, (-CH
2CH(C(O)OH)-)
n, (-CH
2CHC(CH
3)CH
2-)
n were found to be up to 49.72%, which indicates that a large number of polymer molecular chains were decomposed during the process, such as the breakage of C-C chemical bonds and the rearrangement of C-H chemical bonds. In addition, the presence of (-CH
2C(CH
3)(C(O)OCH
2CH
3)-)
n, (-CH
2C(CH
3)(C(O)OC(CH
3)
3-)
n indicated that the O-H and C-H chemical bonds were broken and the C-O and C-C chemical bonds were rearranged [
9].
Compared with the spectra for the untreated surface, the C1s binding energy of the cleaned surface was found to have a shift, and an increase in binding energy. This was due to breakage of C-H chemical bonds in the polymer molecular chain during the laser cleaning process. The density of the electron clouds around the C atom also reduced, increasing the binding ability of the nucleus to the extranuclear electrons, subsequently resulting in an increase in binding energy.
3.3.2. O1s XPS Analysis
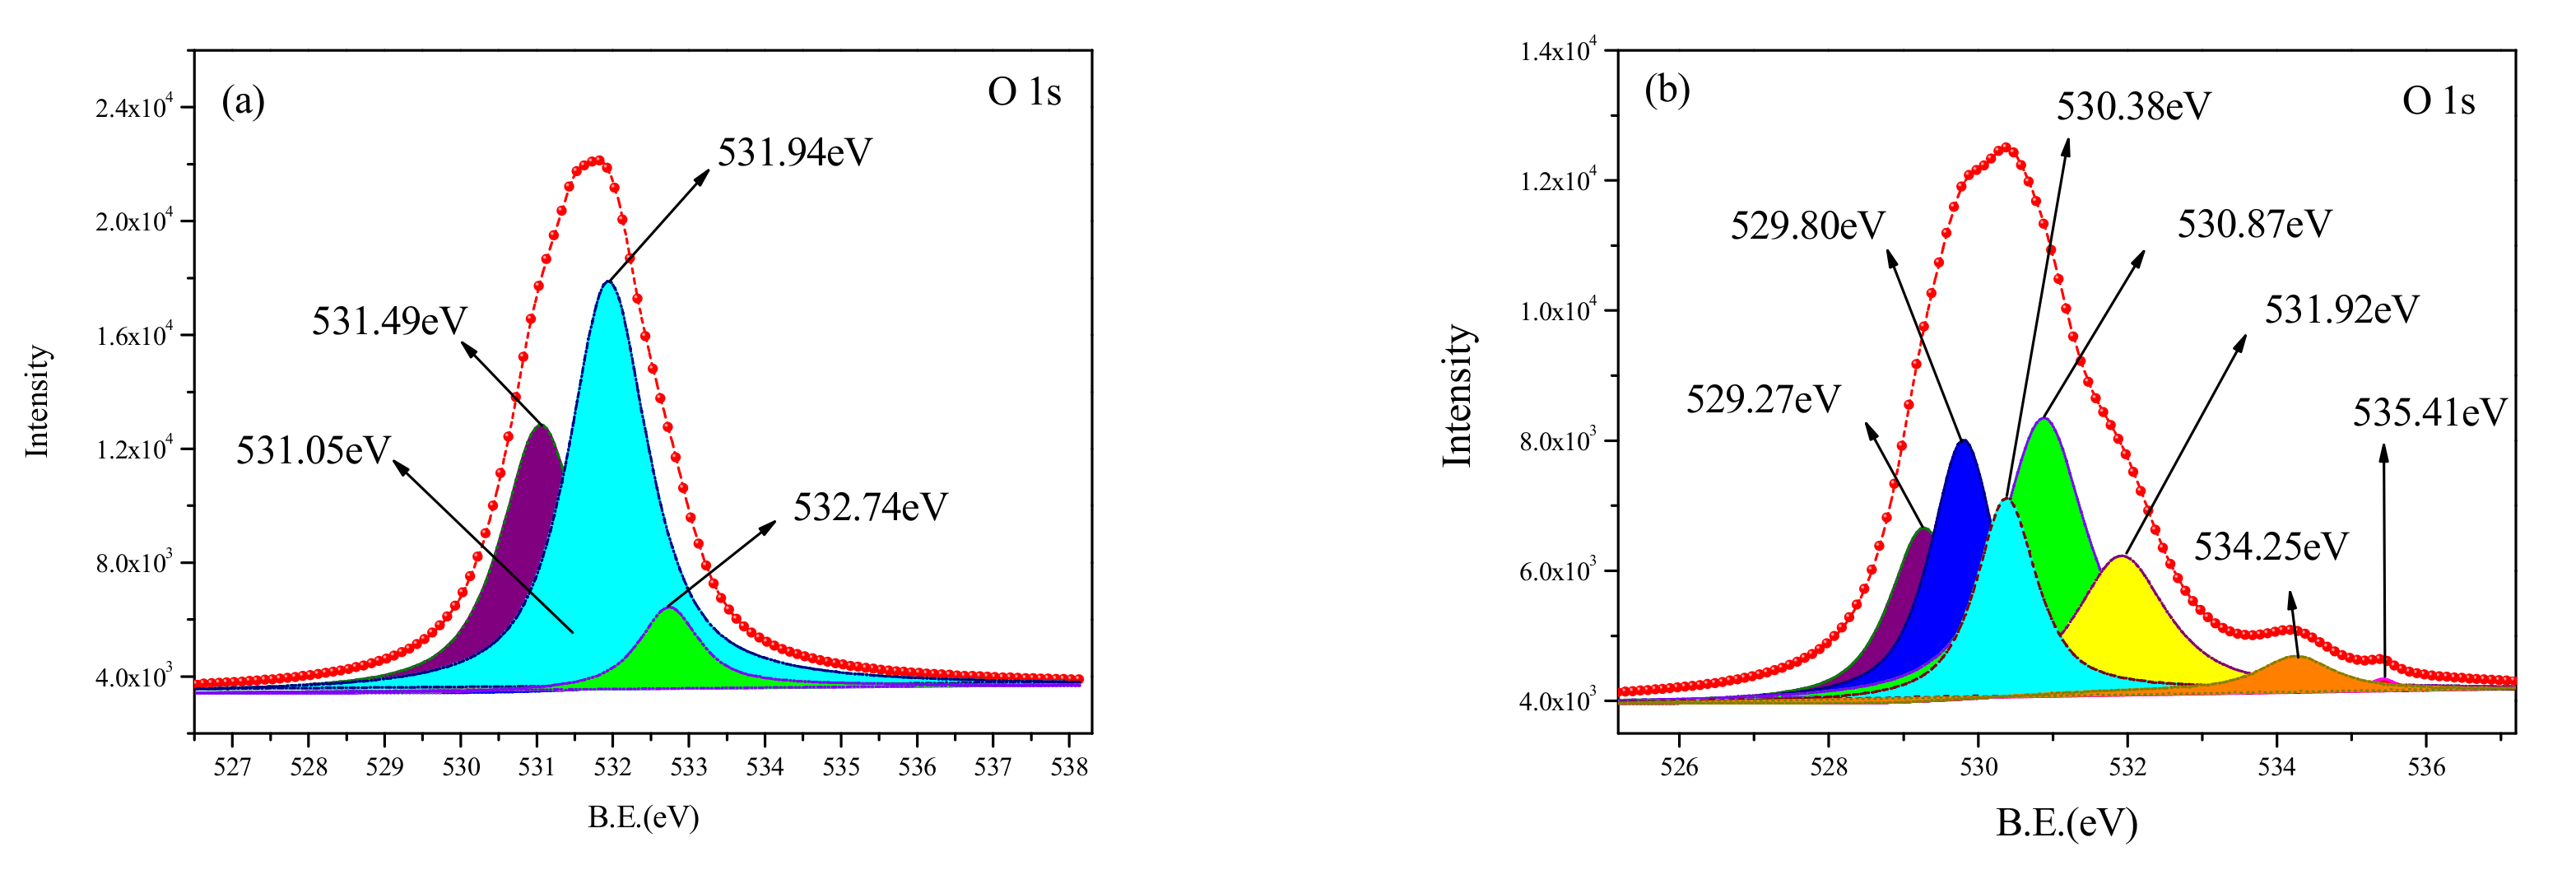
The curve-fitted O1s XPS spectra, obtained from the untreated and cleaned samples, are shown in
Figure 9. The components of the O1s spectra for various binding energy values are listed in
Table 4. It can be seen from
Figure 9b and
Table 4 that the O element on the surface of the untreated sample is mainly in the form of metal oxide and oxygen-containing functional group such as O = C, -OH, -COOC-. The relative content of the oxygen-containing functional group is only 17.83%. Compared with the spectra for the untreated surface, the peak of the C1s spectrum obtained from the cleaned sample shows four peaks at 531.05 eV, 531.49 eV, 531.94 eV, and 532.74 eV, respectively. The presence of O element on the surface of the cleaned sample was more complicated. The new metal oxide was found to have complex forms such as TiO
1.65, Al
2Si
2O
7, SiO
2(Al
2O
3)
0.22, indicating that the nano-added particles in the polymer had complicated physicochemical reactions during the cleaning process. At the same time, some nanoparticles were lost. Two new oxygen-containing functional groups appeared at 531.94 eV, 532.74 eV for the O1s spectra, which were related to the (-CH
2C(CH
3)(C(O)O(CH
2)
3CH
3)-)
n, (-CH
2CH(C(O)OH)-)
n groups, respectively. The emergence of oxygen-containing functional groups can be because free radicals were generated from the chemical bond and stabilized by oxidation. This demonstrates that after the pulsed laser cleaning, the chemical bonds of C-C, C-O, and C-H in the chemical molecular chains broke and were rearranged. The number of organic molecular chains increased, and the relative content was found to be up to 50%.
3.3.3. N1s XPS Analysis
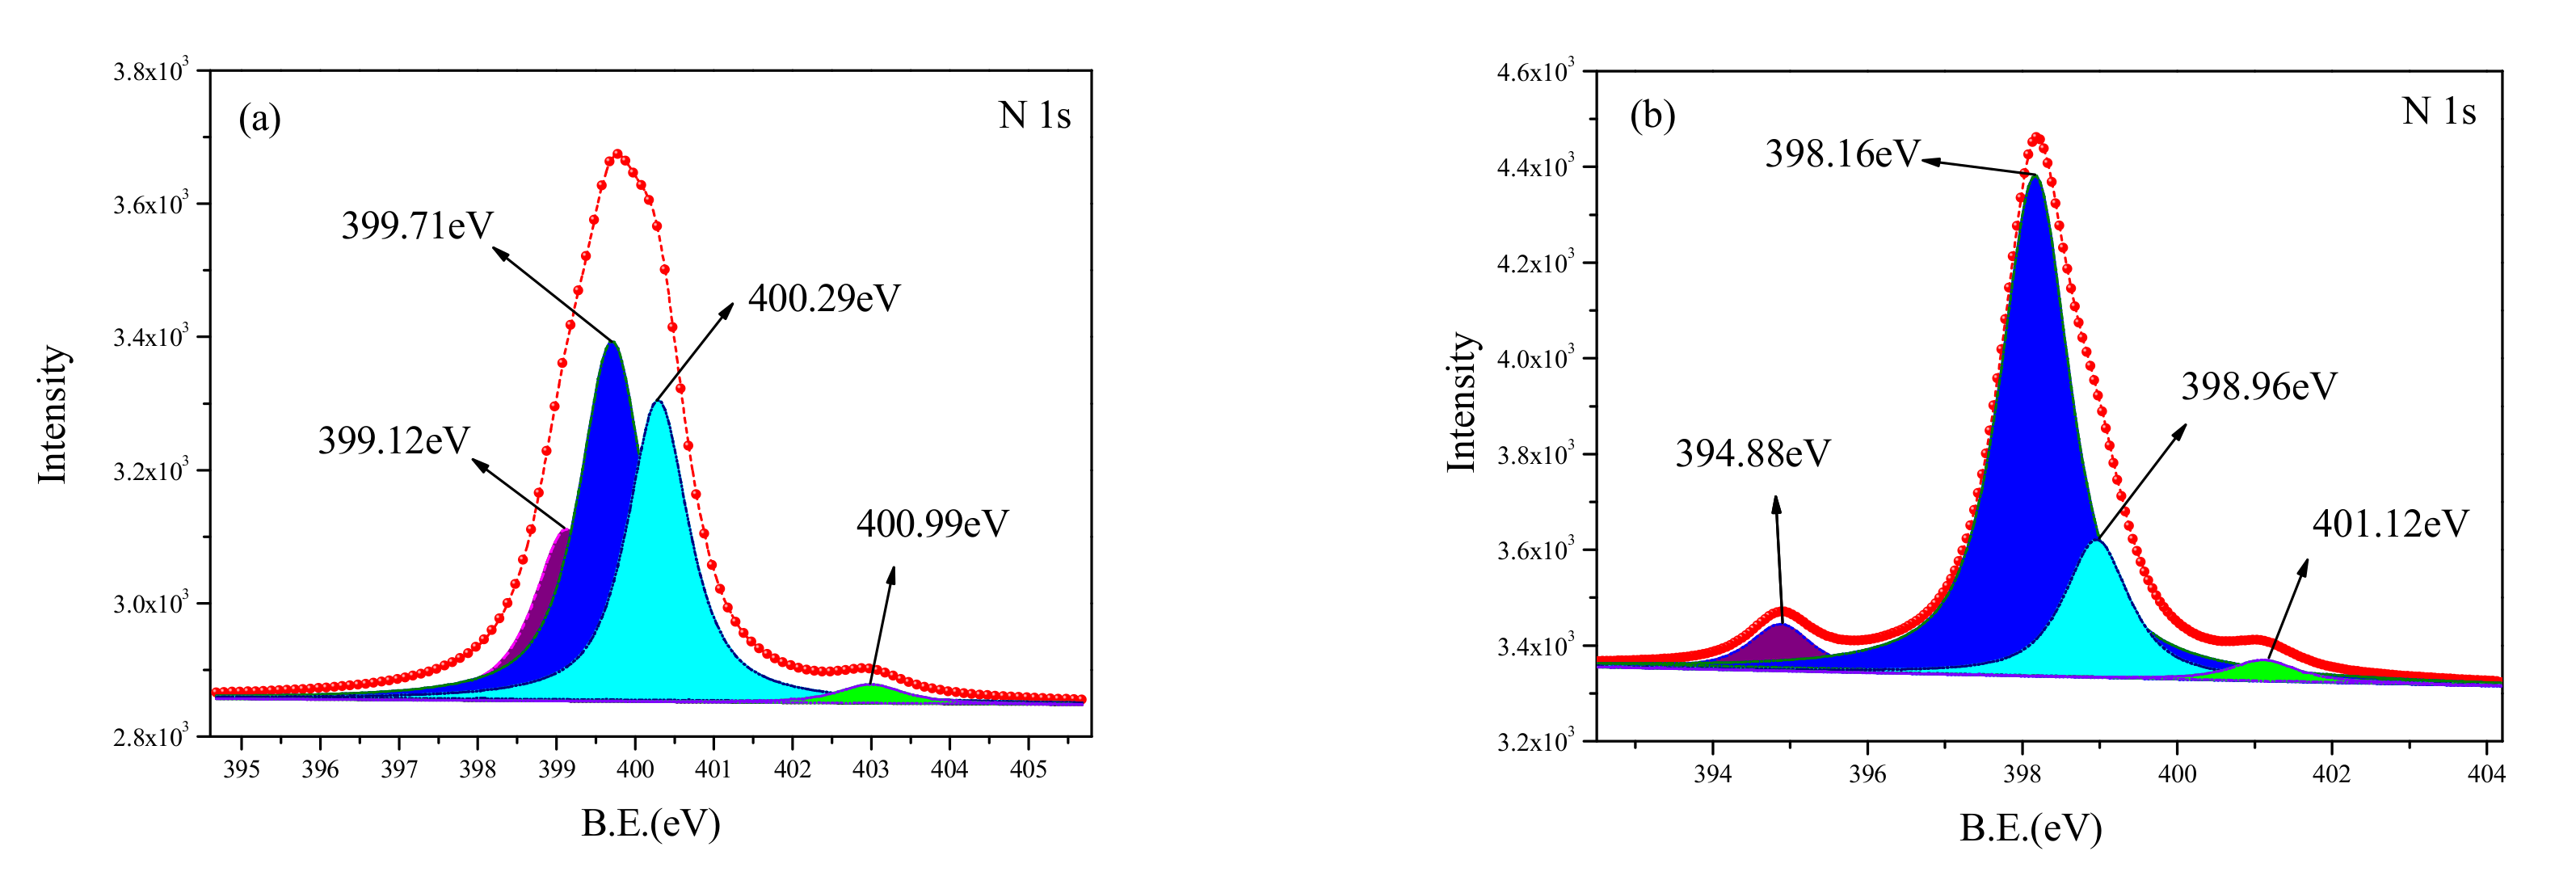
Figure 10 shows the curve-fitted XPS spectra of N1s obtained from the untreated surface and the cleaned surface. The corresponding binding energy and relative content are shown in
Table 5. Four peaks were observed for the N1s spectrum from the cleaned sample. However, the components on the two surfaces were found to be different. The N element in the untreated sample existed in the chemical bonds of C-N and C=N, and the ratio of the peak areas of the two bonds was 4:1. Some new components were observed on the cleaned surface; they include the N-H chemical bond, AlN, [Mg(C
9H
6NO)
2], and C
36H
46N
4. The N-H chemical bond at 399.12 eV and 399.71 eV was a result of the separation of C-H, C-N, C=N. In addition, the presence of other substances indicated that the N from the C-N, C=N chemical bonds had a reaction with other elements, forming new compounds.
3.3.4. Al2p, Ti2p XPS Analysis
The curve-fitted XPS spectra in the Al2p, Ti2p regions of the cleaned surface are shown in
Figure 11; four peaks are visible. The corresponding binding energy and relative content are shown in
Table 6, which also show Al, Ti on the surface of the cleaned layer. Al, Ti were found to have complicated forms—oxides, mixtures with other compounds, and complex compounds with other elements. Al
2O
3, SiO
2(Al
2O
3)
0.22, and TiO
2 are consistent with the result of the O1s analysis, indicating that the high energy of the laser causes complex physicochemical changes to Al, Ti during the laser cleaning process.
3.4. The Surface Morphology Analysis
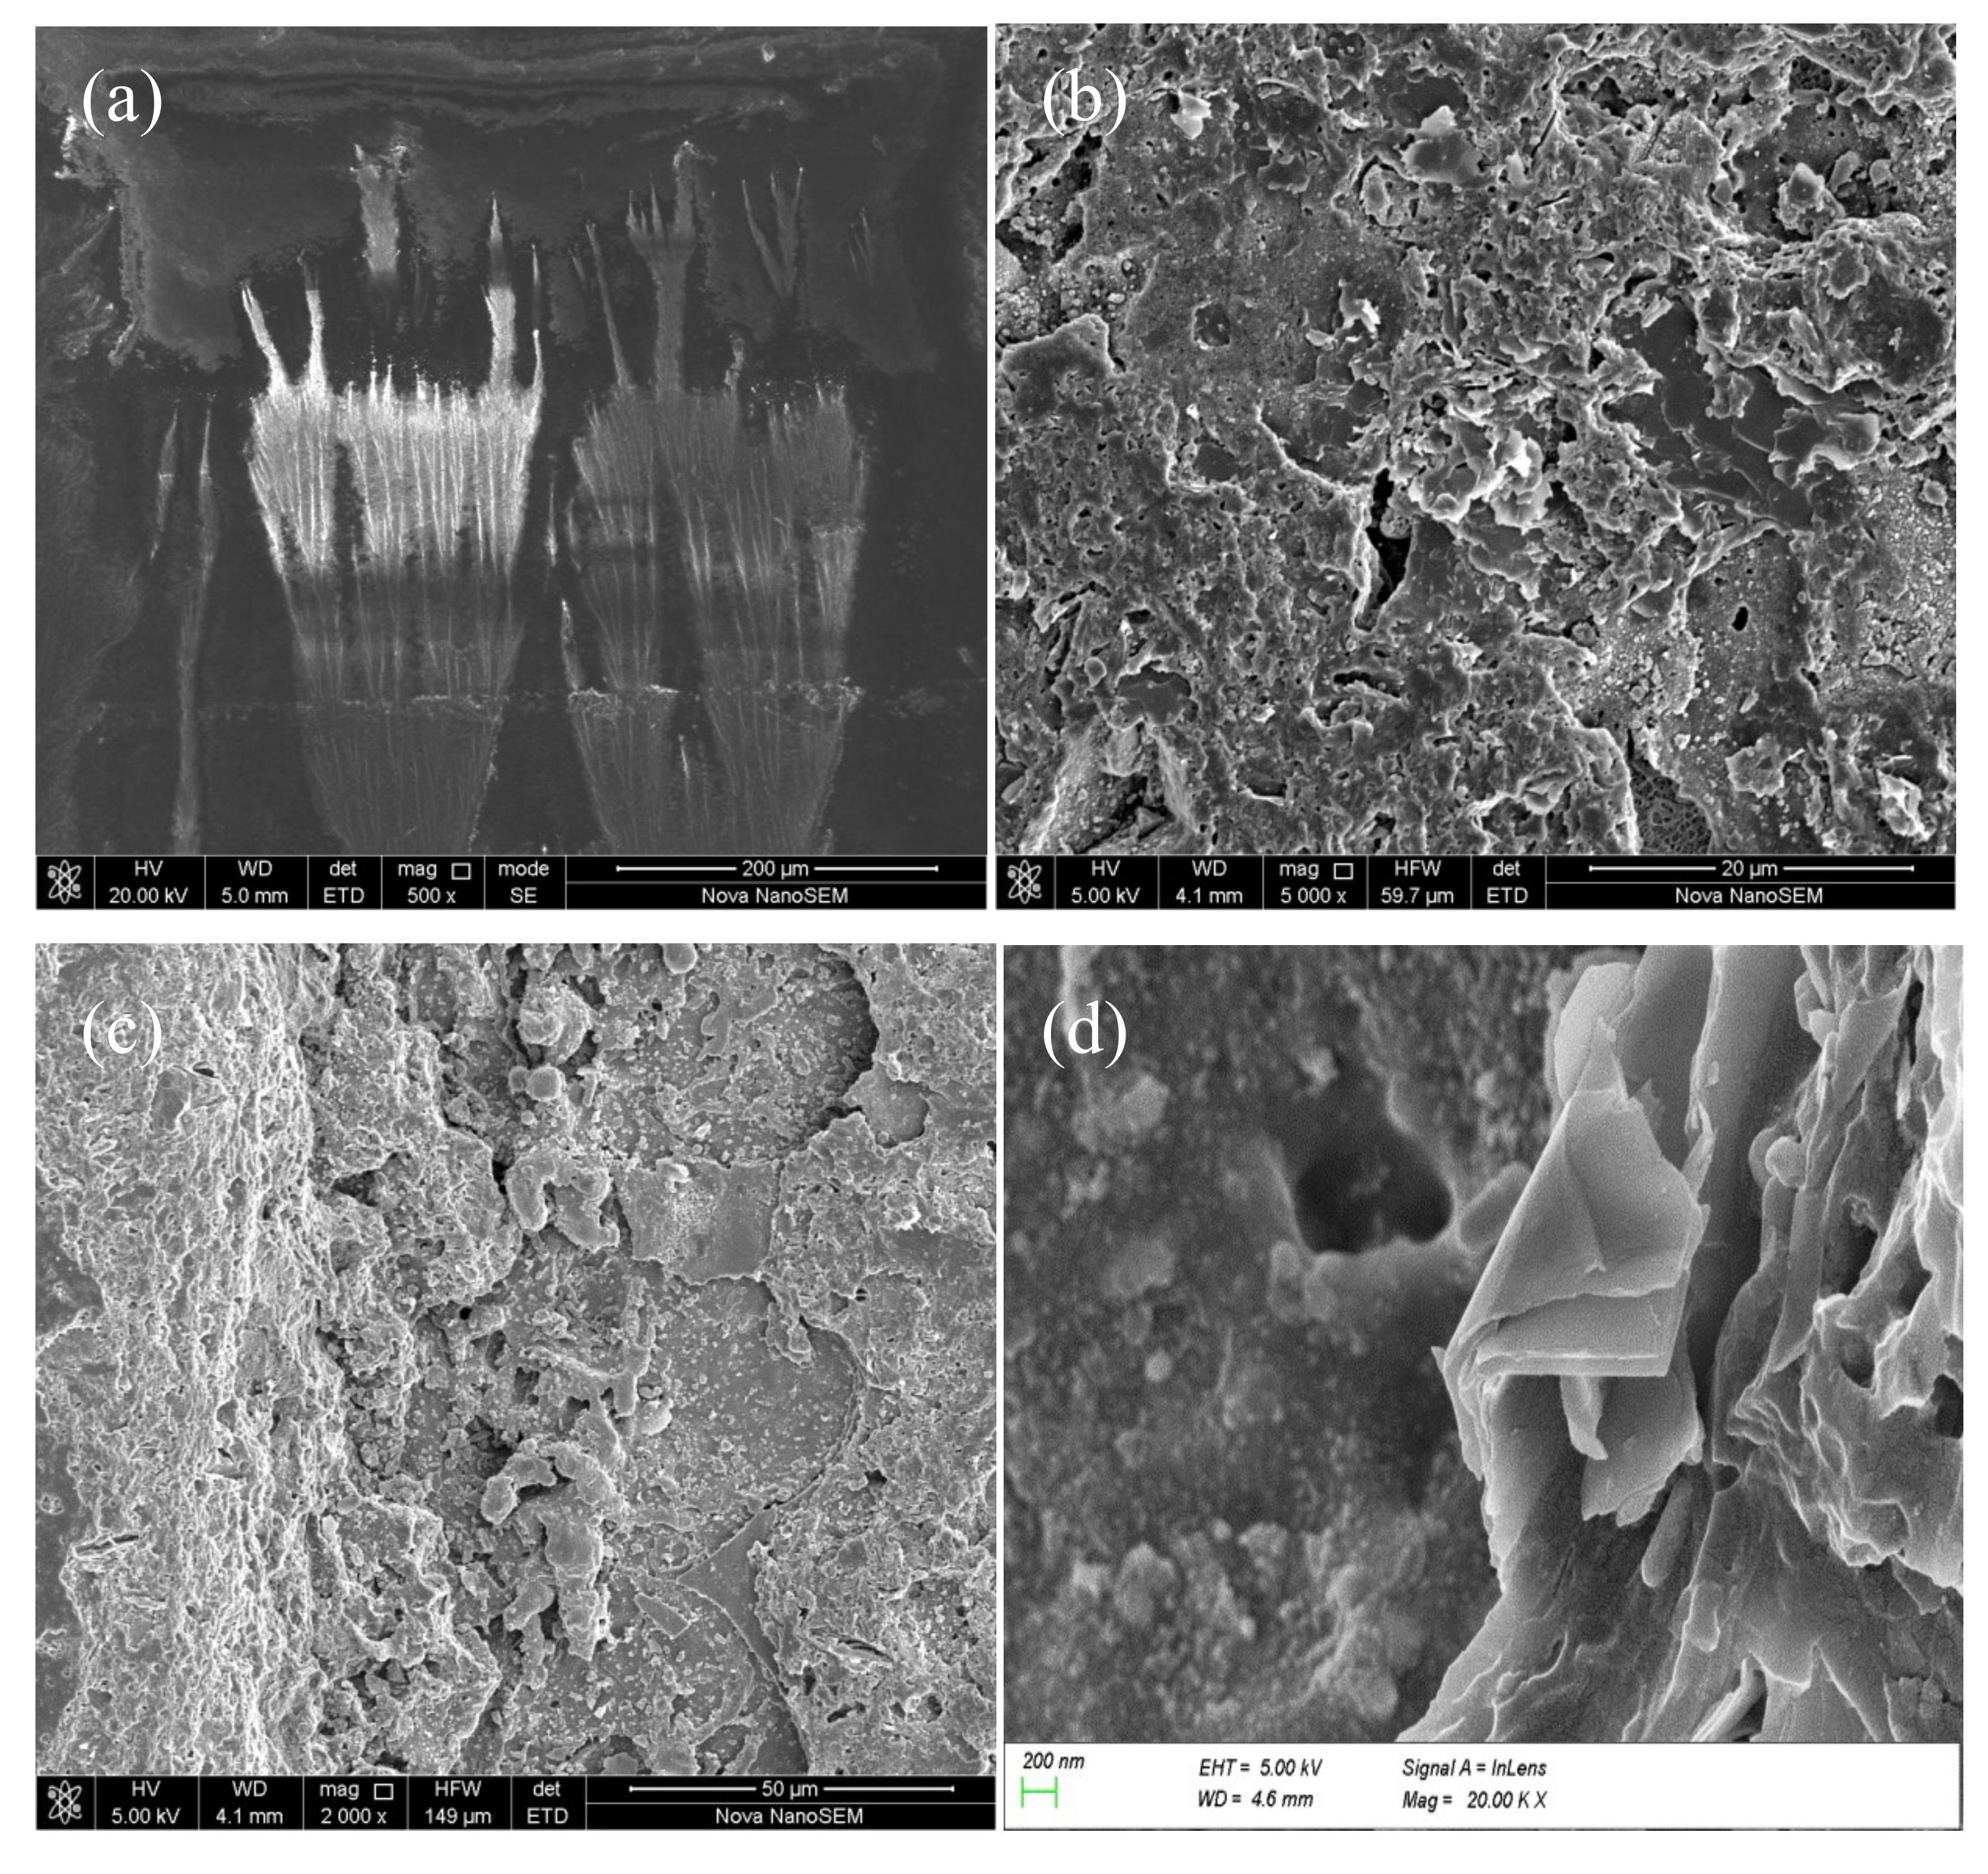
Morphology of the surface and fracture cross-section produced by the pulsed laser are shown in
Figure 12a–d, respectively. It can be seen from
Figure 12b,c that there were a large number of cracks and sheets on the cleaning surface, and the fracture cross-section of the residual paint layer had a “cliff-like” shape. There were some regular craters in the bottom of the cleaned areas of the fracture section, as shown in
Figure 12c, which are usually observed in laser ablation of metals and organic materials [
10]. The craters were a result of mechanical shock. A distinct layered structure was formed inside the paint layer, as shown in
Figure 12d. The sheets were folded in the opposite direction of the pulsed laser action, which was a typical plane showing dynamic tensile damage trace of the material. Mechanical action along the direction of the folded sheets was also seen. Stress concentration and whitening of the fracture edge of the sheet layer was also visible.
3.5. Morphology Analysis of Collected Particles during the Cleaning Process
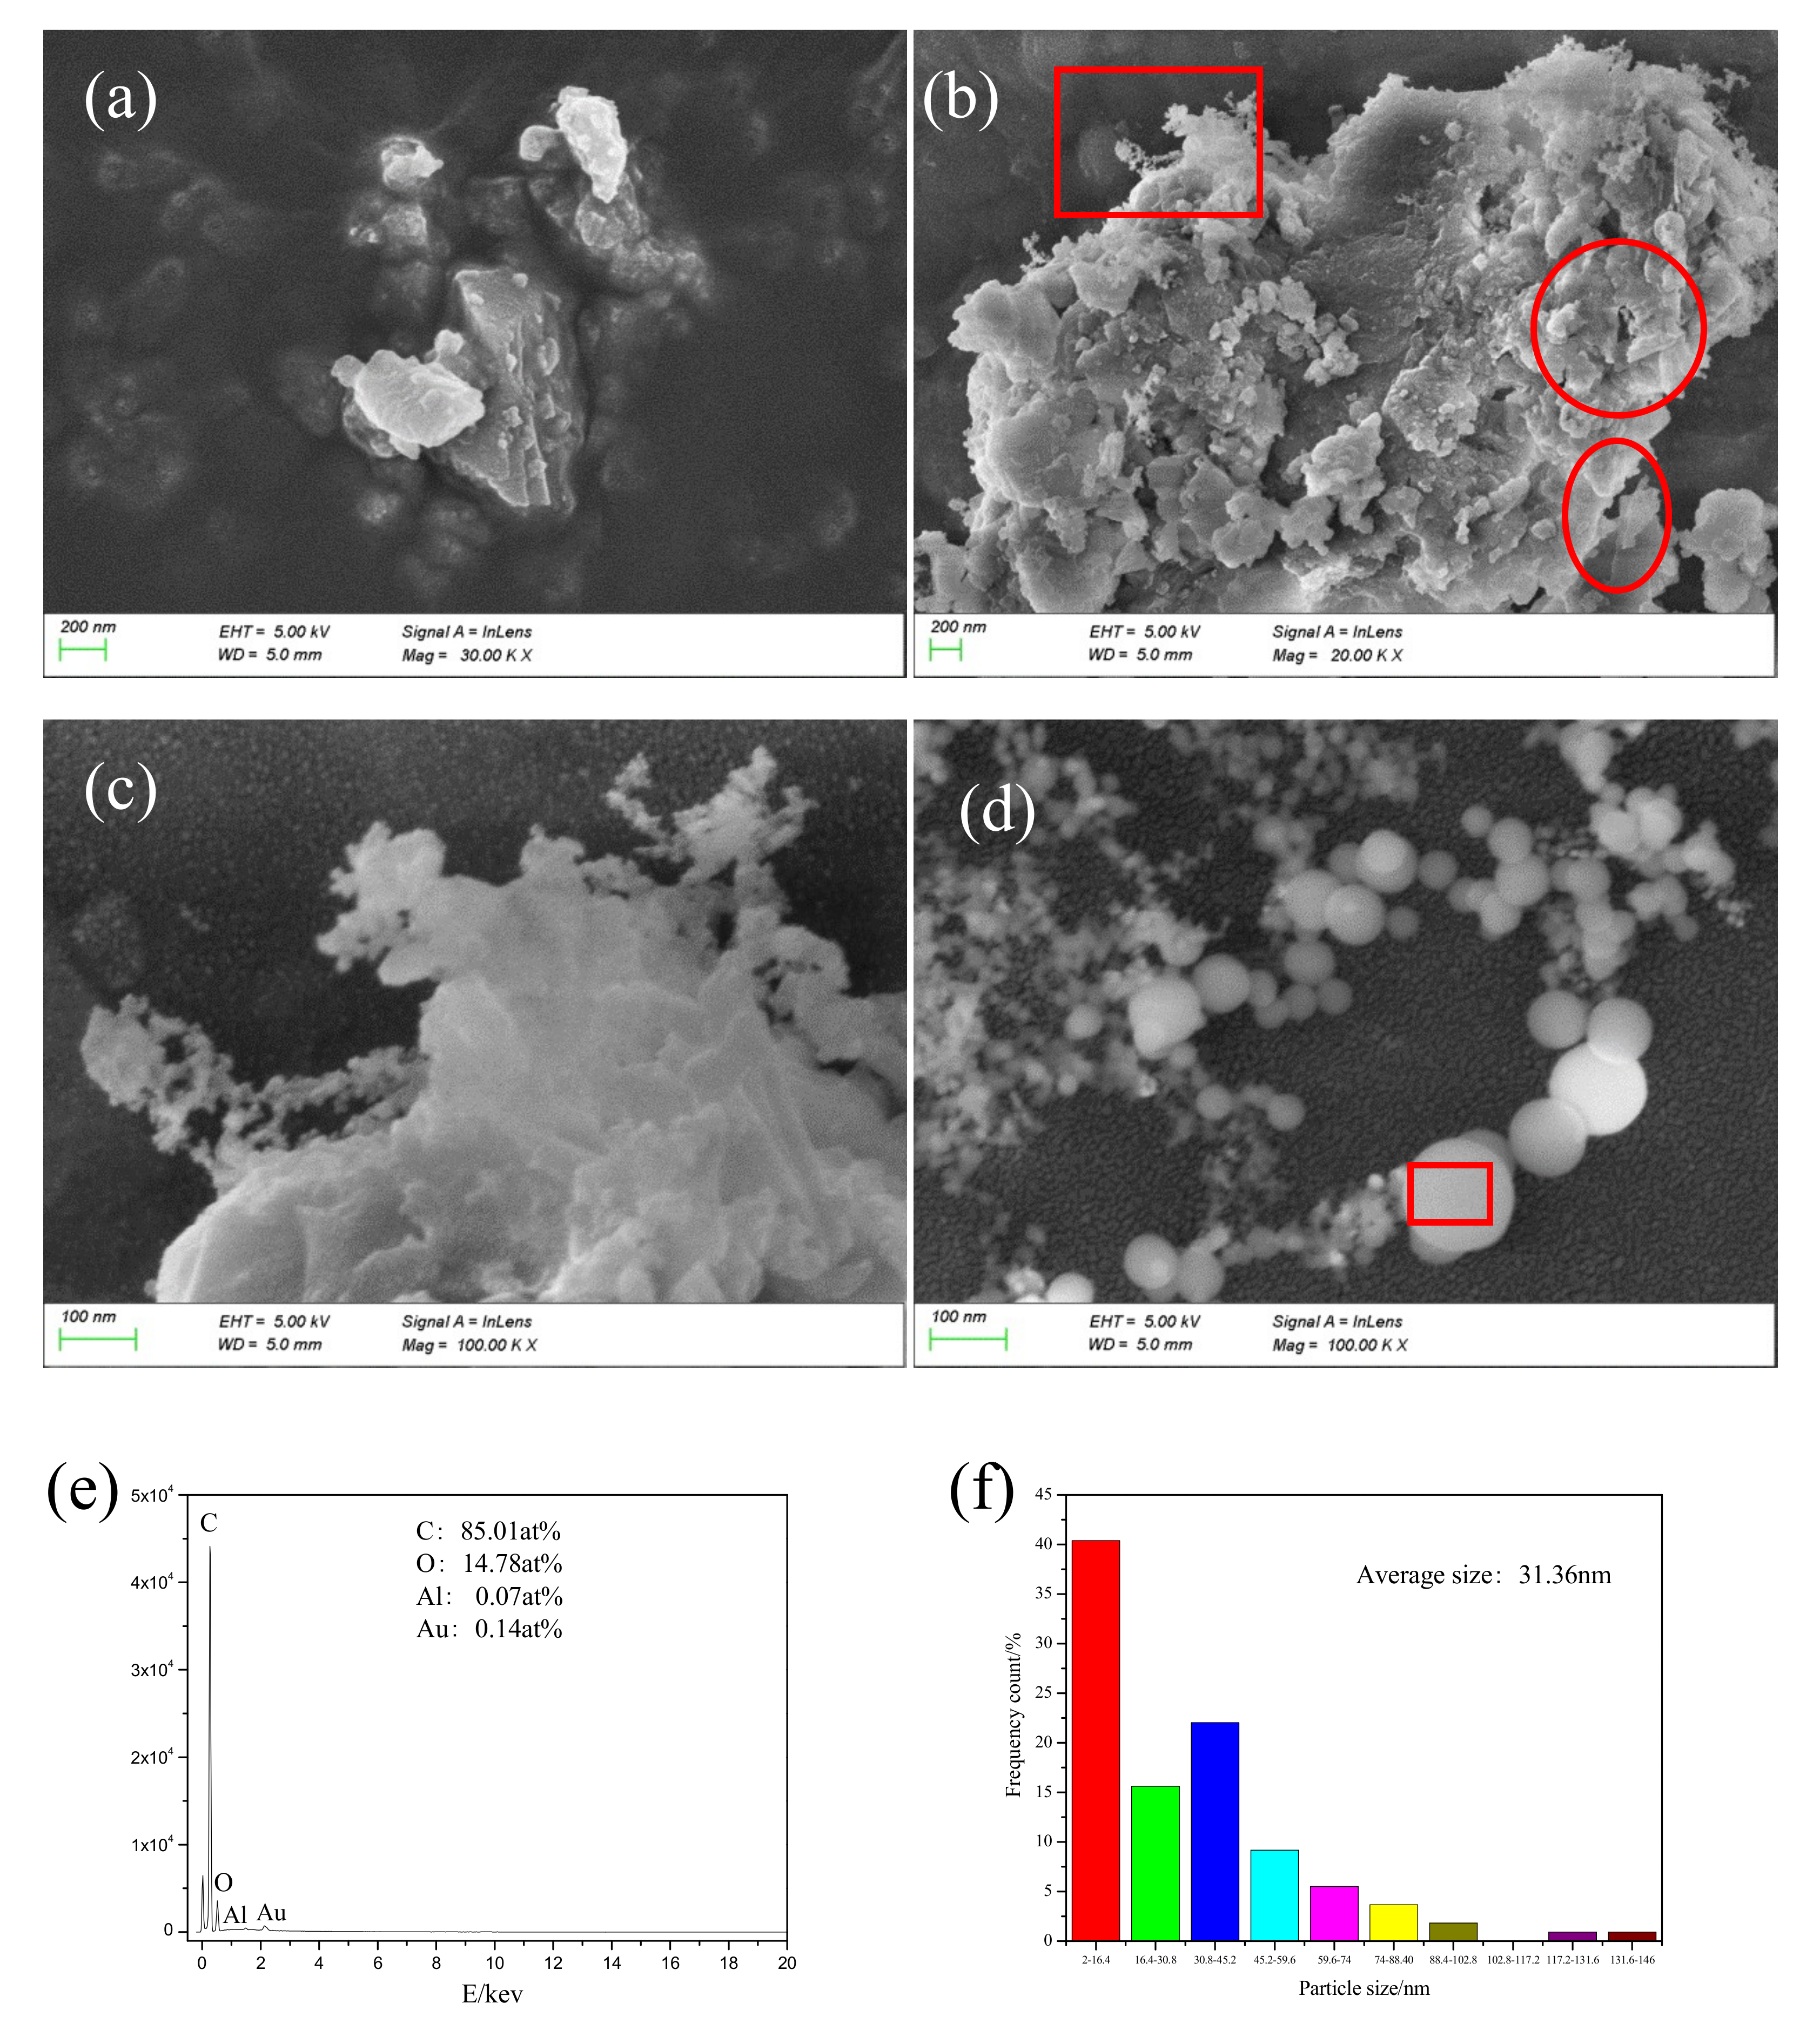
A micrograph of particles collected during the laser cleaning process is shown in
Figure 13.
Figure 13c is a magnified image of the boxed area in
Figure 13b. The collected particles were of different sizes (micrometer, submicron, and nanometer). The nanoparticles were irregular in shape and had uneven edges, as shown in
Figure 13a. The circular area, as shown in
Figure 13b, shows obvious mechanical tear marks and a lamellar structure. The elliptical region from
Figure 13b shows a transparent and pleated paint sheet with thickness of about several nanometers. This special structure was due to the cracking that occurred inside the paint layer during the laser cleaning process. As the delamination progressed, the paint layer was finally stripped off the paint base.
Figure 13c shows a network structure at the edge of the particle, formed by the incomplete condensation of vaporous material. Spherical nanoparticles (average size of 31.36 nm) of uniform shape are shown in
Figure 13d. Particle distribution is shown in
Figure 12f: the relatively large particles were about 146 nm, the particles in the network structure were 2 nm in size or smaller, and particles in the 2–16.4 nm range were found to be the most abundant.
The percentage of C element in the uncleaned paint layer was found to be 68.17 at%, and fraction of C element in spherical particles was 85.01 at%, indicating that spherical particles were generated due to bond cleavage of the polymer. The paint layer absorbed a large amount of laser energy, resulting in a breakage of chemical bonds such as C-C, C-H, and C-O from the molecular chain. A large amount of C atoms was continuously generated and assembled in the high-energy environment. Combustion also took place during the process and a large number of C atoms formed uniform nanoparticles because they came into contact with cold air and were assimilated into droplets during the ascending process. This process indicated a chemical bond breaking combustion mechanism during laser paint removal, which is consistent with the analysis in
Figure 5.
3.6. Discussion
Paint removal using laser technology is a complex process. Laser beams are used to work on the paint layer with photons as the energy carrier. The photons transfer energy to the surface of the paint layer, causing a series of physical and chemical changes. The paint layer absorbs most of the laser energy, activating and converting the molecules or atomic groups in the paint to thermal energy. Instantaneous expansion and vaporization, among other processes, occur on the surface of the paint. In this experiment, the photon energy of the fiber laser with wavelength of 1064 nm was found to be 1.16 eV. The laser energy absorbed by the paint surface is transmitted and accumulated in the paint. The area closest to the laser beam’s focus shows the fastest response and a rapid rise in temperature.
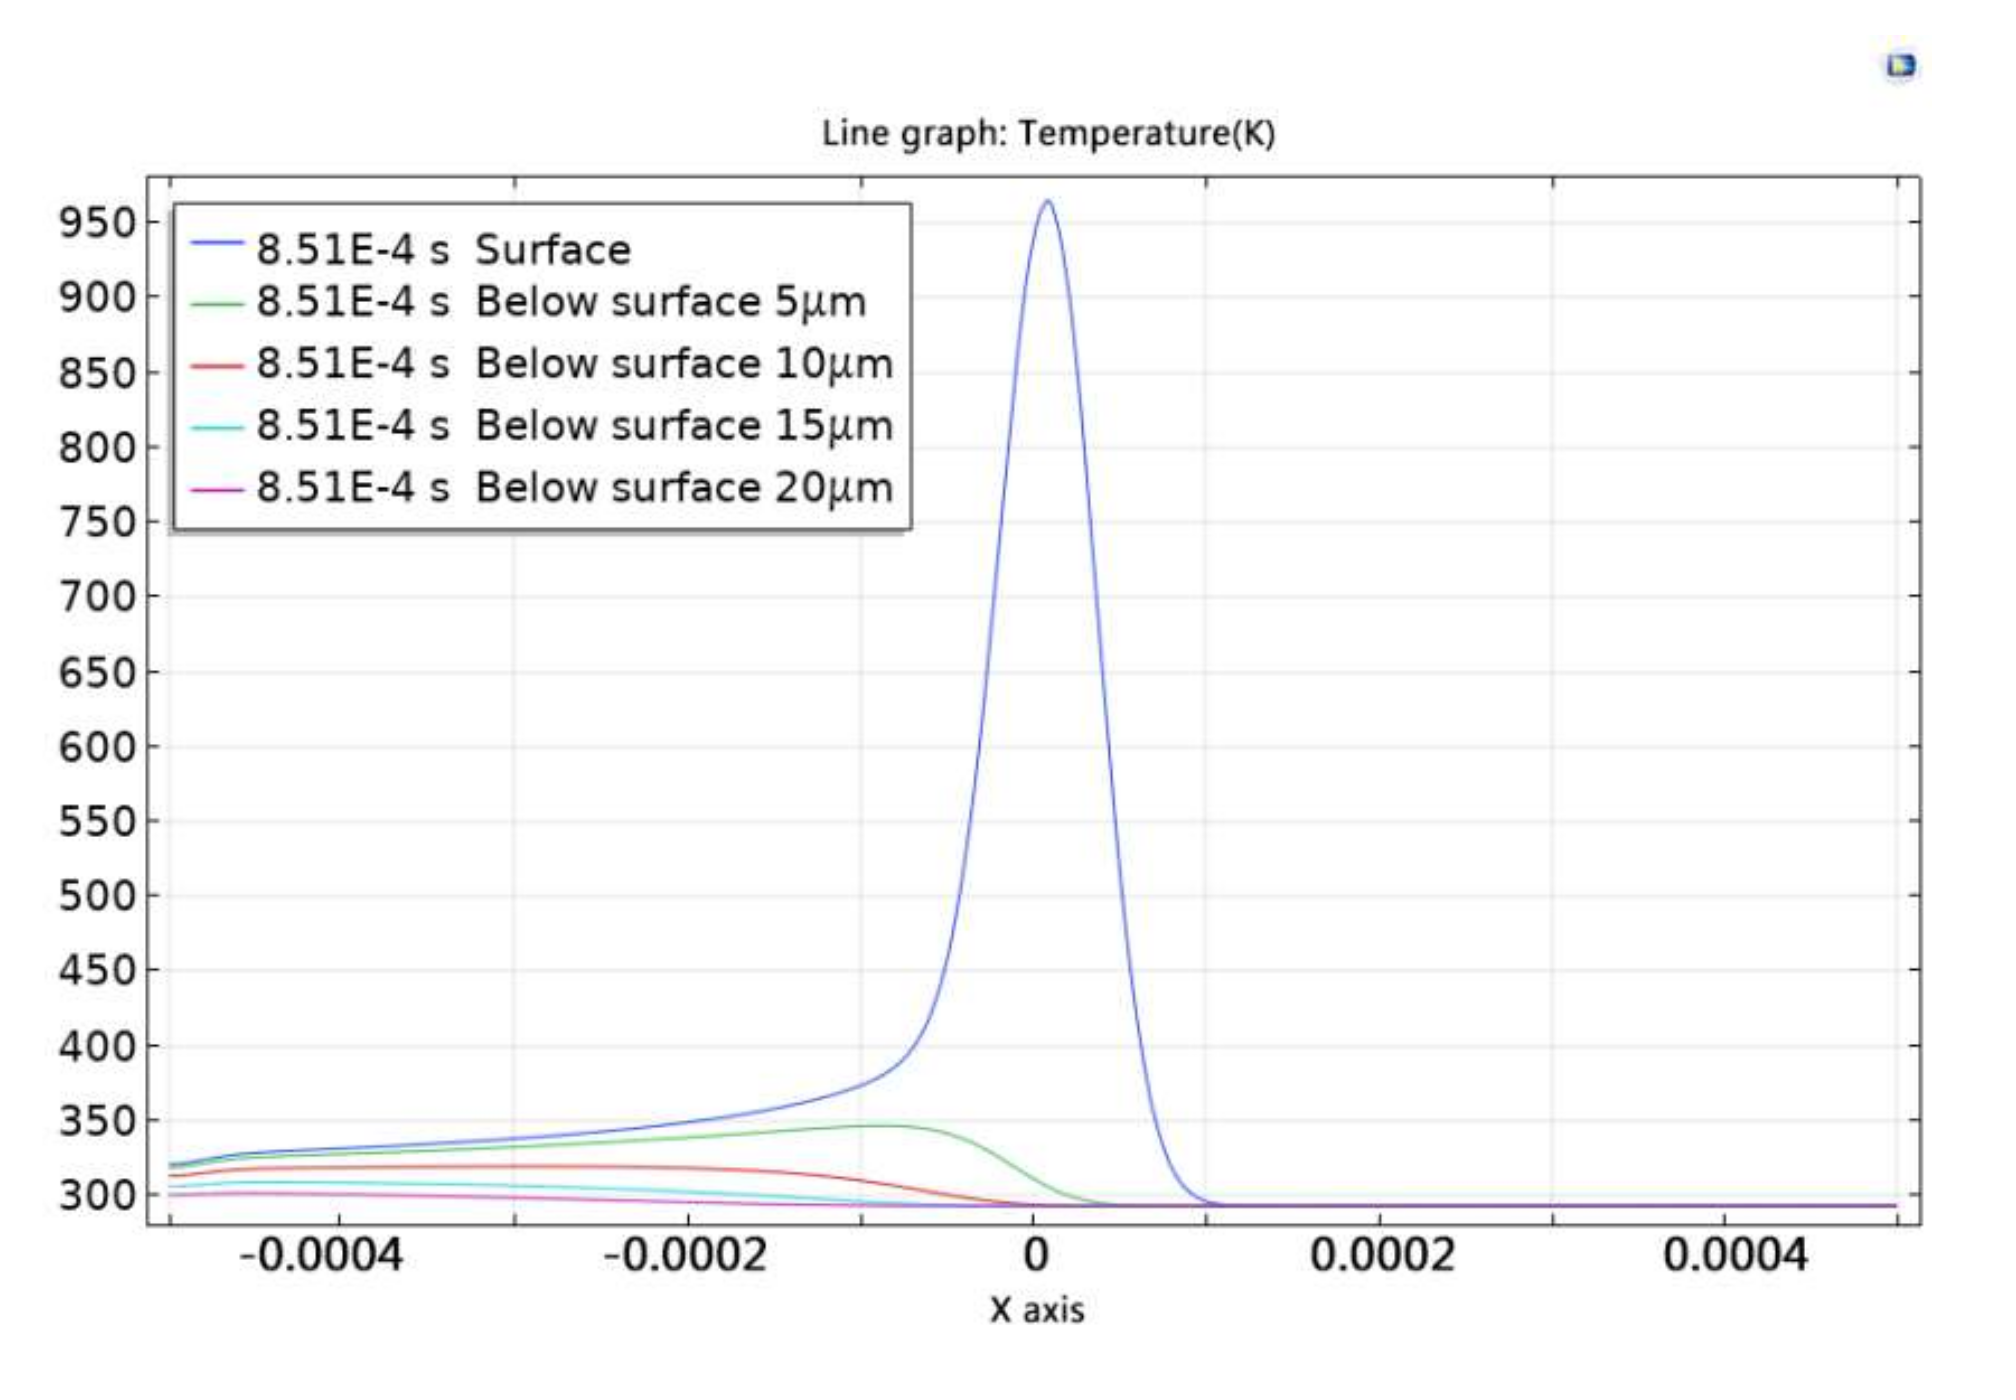
Figure 14 shows the temperature change curves at different depths in the x-axis direction at t = 0.000851 s. The temperature of the paint layer was found to decrease rapidly with increase in depth, as shown in
Figure 14. Compared with the temperature of the paint surface, the temperature below surface 5 μm was lower than 600 °C.
When the temperature of the paint rises to a certain level, the chemical bonds thermally crack [
11,
12,
13]. The cleavage of chemical bonds, such as C-C, C-H, C-O, and C-N, generate free radicals, which then became intermediates for subsequent chemical reactions. The reaction between activated free radicals and free radicals with oxygen in the air formed new organic compounds, such as (-CH
2CH(C(O)OCH
3)-)
n, (-CH
2CH(C(O)OH)-)
n, (-CH
2CHC(CH
3)CH
2-)
n, (-CH
2C(CH
3)(C(O)OCH
2CH
3)-)
n, (-CH
2C(CH
3)(C(O)OC(CH
3)
3-)
n, and (-CH
2CH
2NH-)
n; oxides such as C
96.8O
3.2, and C
93.1O
6.9; and other substances containing N, such as [Mg(C
5H
4NCOO)
2] and C
48H
26N
8 on the laser cleaning surface. The little molecular gas substance generated during the cleaning process became volatile [
14,
15,
16,
17]. A large number of C atoms from the gaseous substances formed uniform nanoparticles when they encountered cold air, as shown in
Figure 13c,d. The paint removal mechanism is primarily a chemical bond breaking combustion method.
As laser energy is continuously absorbed, as shown in
Figure 3, the breaking speed of chemical bonds in the polymer is accelerated. At the same time, gaseous products, such as CO
2, CO, and H
2, above the surface of the paint layer, gradually increase. The large amount of steam that is generated strongly absorb the laser energy, and a laser plasma is formed by physical processes such as nuclear collisions and target electron excitation in high-energy gases. This process is accompanied by outward expansion, which produces shock waves that directly act on and generate impact damage on the paint layer [
13], as shown in
Figure 12a,b. The large amount of bond cleavage causes a gradual increase in electron density and energy in the laser plasma. The high-input energy thus results in a rise in temperature of the electron in the plasma, which is high enough to exceed the Vander Waals force and the chemical bond energy in the polymer. This further promotes the cracking of the inside of the polymer and the breaking of the chemical bond, resulting in destruction of the polymer structure [
18,
19].
4. Conclusions
The mechanism of pulsed laser paint removal is studied in this paper from a microscopic angle by means of Fourier transform infrared spectroscopy, X-ray photoelectron spectroscopy, and scanning electron microscopy. Compared with the untreated surface, the infrared spectrum had two additional absorption peaks of 1383.36 cm−1 and 678.82 cm−1 on the surface of the paint layer cleaned with the pulsed laser. The profile of the C 1s, O1s, and N1s peaks in the cleaned surface indicate that chemical bonds such as C-C, C-H, C-O, C-N are broken and rearranged, resulting in the emergence of new organics and complex compounds. Traces of the impact of plasma was found on the cleaned surface. The removal process produced paint particles of varying sizes and shapes, caused primarily by plasma impact damage. The X-ray photoelectron spectroscopy conducted showed that C element content decreased and that of the O element increased after the cleaning. Smaller amounts of Al and Ti were detected on the cleaning surface, as compared to the untreated area. This means that the paint released nano additives containing metal Al and Ti during the cleaning process. Deconvolution of the Al2p, Ti2p spectra resulted in the formation of new components, such as SiO2(Al2O3)0.22, MgAl2.7O5.3/SiO2, Al6Si2O13, TiO0.3S1.5, and Ti2S3. These results suggest the oxidation of paint and nano additives in air during the laser cleaning process. The formation of spherical nanoparticles is a result of photothermal ablation of the paint, caused by combustion of chemical bonds.
