Article

A Simplified Analytical Approach for Optimal Planning of Distributed Generation in Electrical Distribution Networks

1
Department of Electrical and Computer Engineering, Birzeit University, Birzeit-PO Box 14, Palestine
2
Dipartimento di Ingegneria, Università di Palermo, 90128 Palermo, Italy
*
Author to whom correspondence should be addressed.
Appl. Sci. 2019, 9(24), 5446; https://doi.org/10.3390/app9245446
Submission received: 23 October 2019 / Revised: 26 November 2019 / Accepted: 9 December 2019 / Published: 12 December 2019
(This article belongs to the Special Issue Sustainable Energy Systems: Optimization and Efficiency)

Abstract

:
DG-integrated distribution system planning is an imperative issue since the installing of distributed generations (DGs) has many effects on the network operation characteristics, which might cause significant impacts on the system performance. One of the most important characteristics that mostly varies because of the installation of DG units is the power losses. The parameters affecting the value of the power losses are number, location, capacity, and power factor of the DG units. In this paper, a new analytical approach is proposed for optimally installing DGs to minimize power loss in distribution networks. Different parameters of DG are considered and evaluated in order to achieve a high loss reduction in the electrical distribution networks. The algorithm of the proposed approach has been implemented using MATLAB software and has been tested and investigated on 12-bus, 33-bus, and 69-bus IEEE distribution test systems. The results show that the proposed approach can provide an accurate solution via simple algorithm without using exhaustive process of power flow computations.

1. Introduction

The increase on load demand and the global concerns about the environment as well as the enormous technologies for connecting renewable energy resources (RES) all played an important role in the distribution networks planning. DGs have considerable effects on the electric network design, construction, analysis, operation, and maintenance [1]. A comprehensive survey and analysis must be done before DG integration to ensure the judicious and efficient use of energy and hence maximize the benefits [2]. Location, capacity, and power factor of the DGs are the three main factors that affect the power system network. These three factors have significant impact on the protection system, reliability, stability, power losses, voltage profile, and power quality [3,4,5,6,7]. Recent studies and optimization techniques have been employed to find the optimal location, capacity, and power factor of DGs being added to the network to improve the network characteristics; one of the most important characteristic is the power losses. For many utilities, reducing these losses has become one of the significant challenges. DG units may be used in distribution networks for this goal. This is achieved by placing the DG in a proper location with a proper capacity and proper power factor to provide minimum power losses. These proper values of the DG parameters that minimize the total power losses in the distribution networks are referred to in this paper as optimal parameters of the interconnected DG unit. As shown in [6,7,8,9,10,11], the variation of the DG settings to a condition beyond the optimal parameters, decreases the power losses in the network and then it rapidly increases them again.
DG planning has attracted the interest of many researchers and numerous publications can be found on this subject [8,9,10,11]. Several methods have recently been proposed in order to minimize the power losses in the DG-integrated distribution networks. These methods can be classified into three main categories: (1) numerical-based category, (2) heuristic-based category, (3) analytical-based category [12].
Regarding the numerical-based category, there are many algorithms proposed and the most common algorithms are exhaustive search, gradient search, OPF (optimal power flow), and linear programming [13,14,15,16,17]. These algorithms have demonstrated to be effective for obtaining the optimal DG capacities at certain locations or the optimal DG location for a given DG capacity. Therefore, these algorithms did not succeed in accurately representing an optimization problem aiming at simultaneously optimizing DG capacity and location. On the other hand, heuristic-based category methods are based on employing advanced computational intelligence algorithms, such as genetic algorithms [18,19], particle swarm optimization algorithms [20], harmony search algorithms [21], tabu search algorithms [22], and Dragonfly algorithm [23]. It is valuable to mention that the main feature of these techniques is that they can provide near-optimal solutions thanks to their computational robustness but, at the same time, they need intensive computational capabilities.
Analytical-based methods attract active research interests, as they are easy to implement and fast. Analytical-based methods often follow various techniques to simplify the optimization problem. Within this category, different techniques and methodologies have been developed in order to achieve maximum possible losses reduction. Some of these methods were concerned with installing a single DG unit such as a method in [24], which is based on power stability index (PSI) and the method in [25], which is based on power loss sensitivity (PLS) index. When these methods were applied for multiple DG units, they were efficient only when installing the DG units sequentially one-by-one. Moreover, in [26], the optimum location-capacity pair of a single DG unit was obtained using an analytical approach. In [27] different load models have been introduced and studied in order to achieve minimum active and reactive power losses in the network. In [28] an analytical method has been introduced to minimize the power losses and improve the system profiles based on the available specific scenarios. In [29] optimum location of a single DG with unity power factor has been studied. In [30] the authors proposed an analytical approach for losses minimization for DGs allocation, but this method is depended on installing DG units sequentially one-by-one.
In [31,32], the authors proposed an analytical approach for losses minimization indicating the optimal sizing and siting for single DG unit with non-generated reactive power. However, in [33], the authors produced a new method which can be used to determine the optimal sittings for multiple DG units which are non-generative of the reactive power without determining the optimal capacities of these DG units. In [34], the authors produced an approach which can be used to determine the optimal capacities and sittings for multiple DG units which also consume the reactive power. In [35], the authors produced an algorithm to determine the optimal sizing and sitting for any type of the DG unit, but it cannot be used for multiple DG units. Also, in [7] the authors produced an analytical approach to determine the optimal capacity and location for a single DG unit for known power factor.
In [36], the authors suggested a new hybridized method which is a combination of analytical approach and heuristic search which was proposed to find the optimal locations of multiple DGs of multiple types. The authors of [37] have proposed an approach to allocate a DG unit with unity power factor. Later on, this approach has been extended in order to involve allocating a single DG that is capable to generate real and reactive power, this approach is named as an improved analytical (IA) method [38]. After that, the IA method has been upgraded to involve the case of multiple DG interconnection [39]. It is worthy to mention that the solutions obtained by those methods have been compared with the proposed approach in this paper.
The above review clearly shows that considerable researches have been done for optimally planning of DGs; however, in some methods it is assumed that DG power factors are not state variables but specified values. Moreover, some methods are not able to provide the optimal solution for the allocation of a number of DGs. Furthermore, some algorithms represent the DG optimization problem correctly but these algorithms did not succeed to deal with number, location, capacity, and power factor of the DG units simultaneously. On the other hand, many researches proposed methods that successfully represent DG optimization problem, but these methods need intensive computational capabilities.
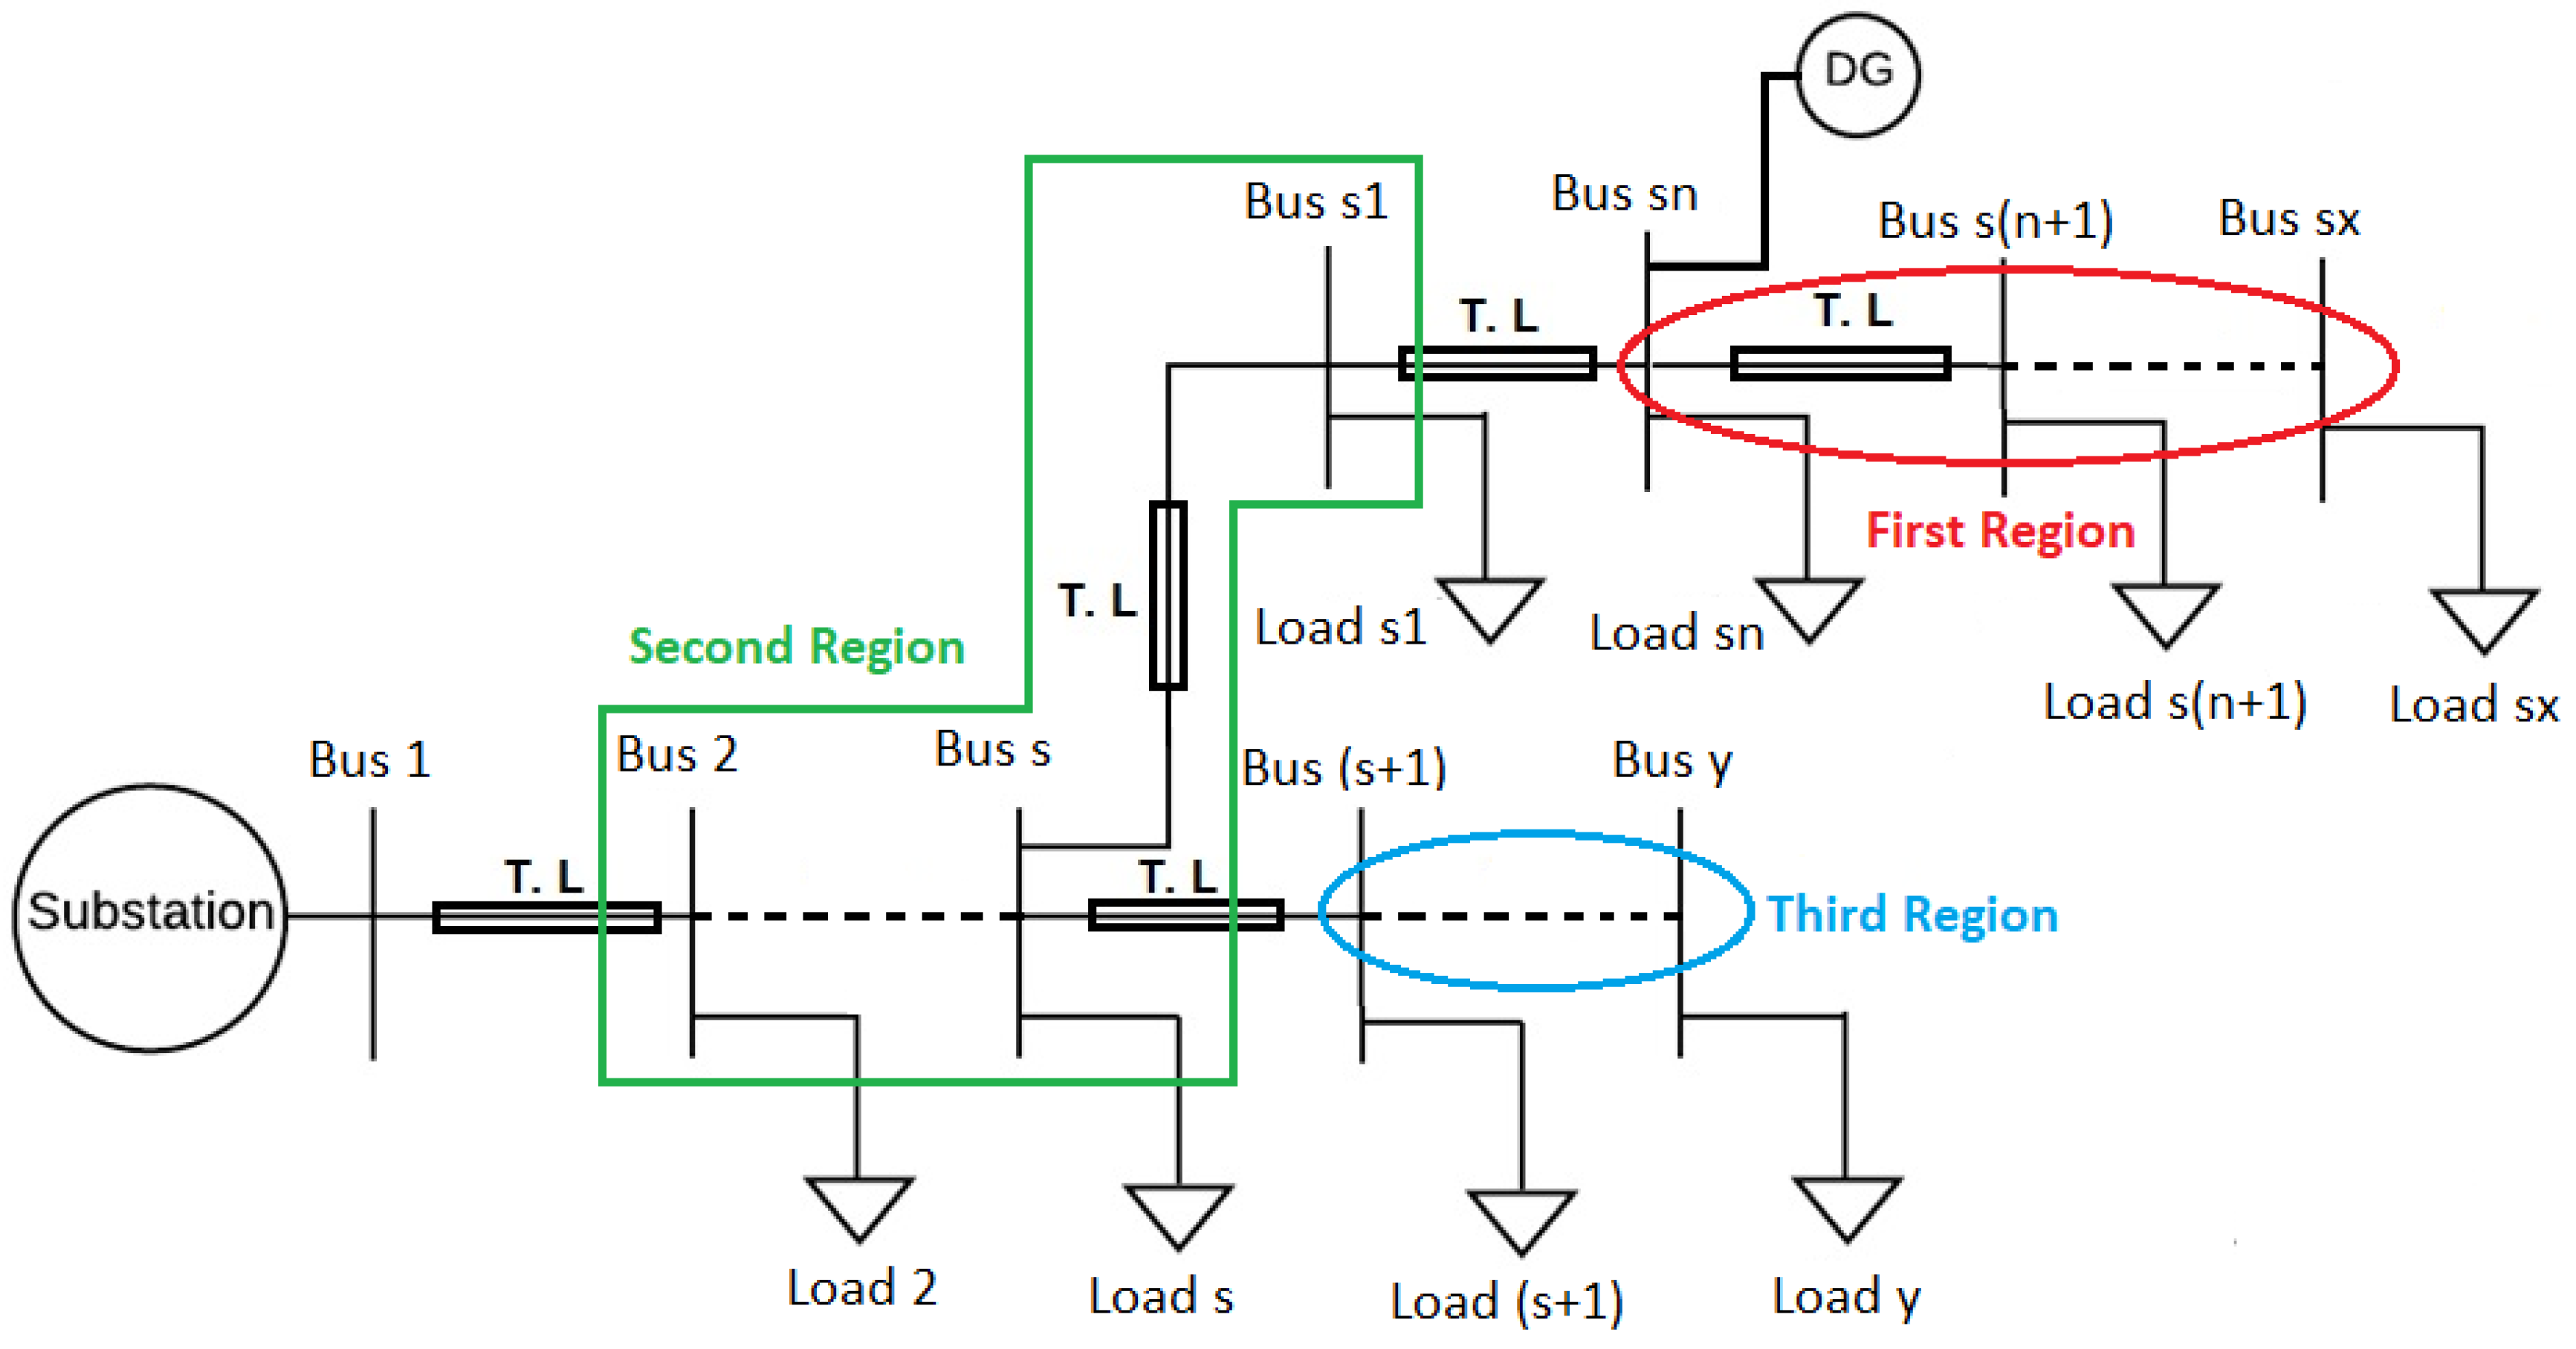
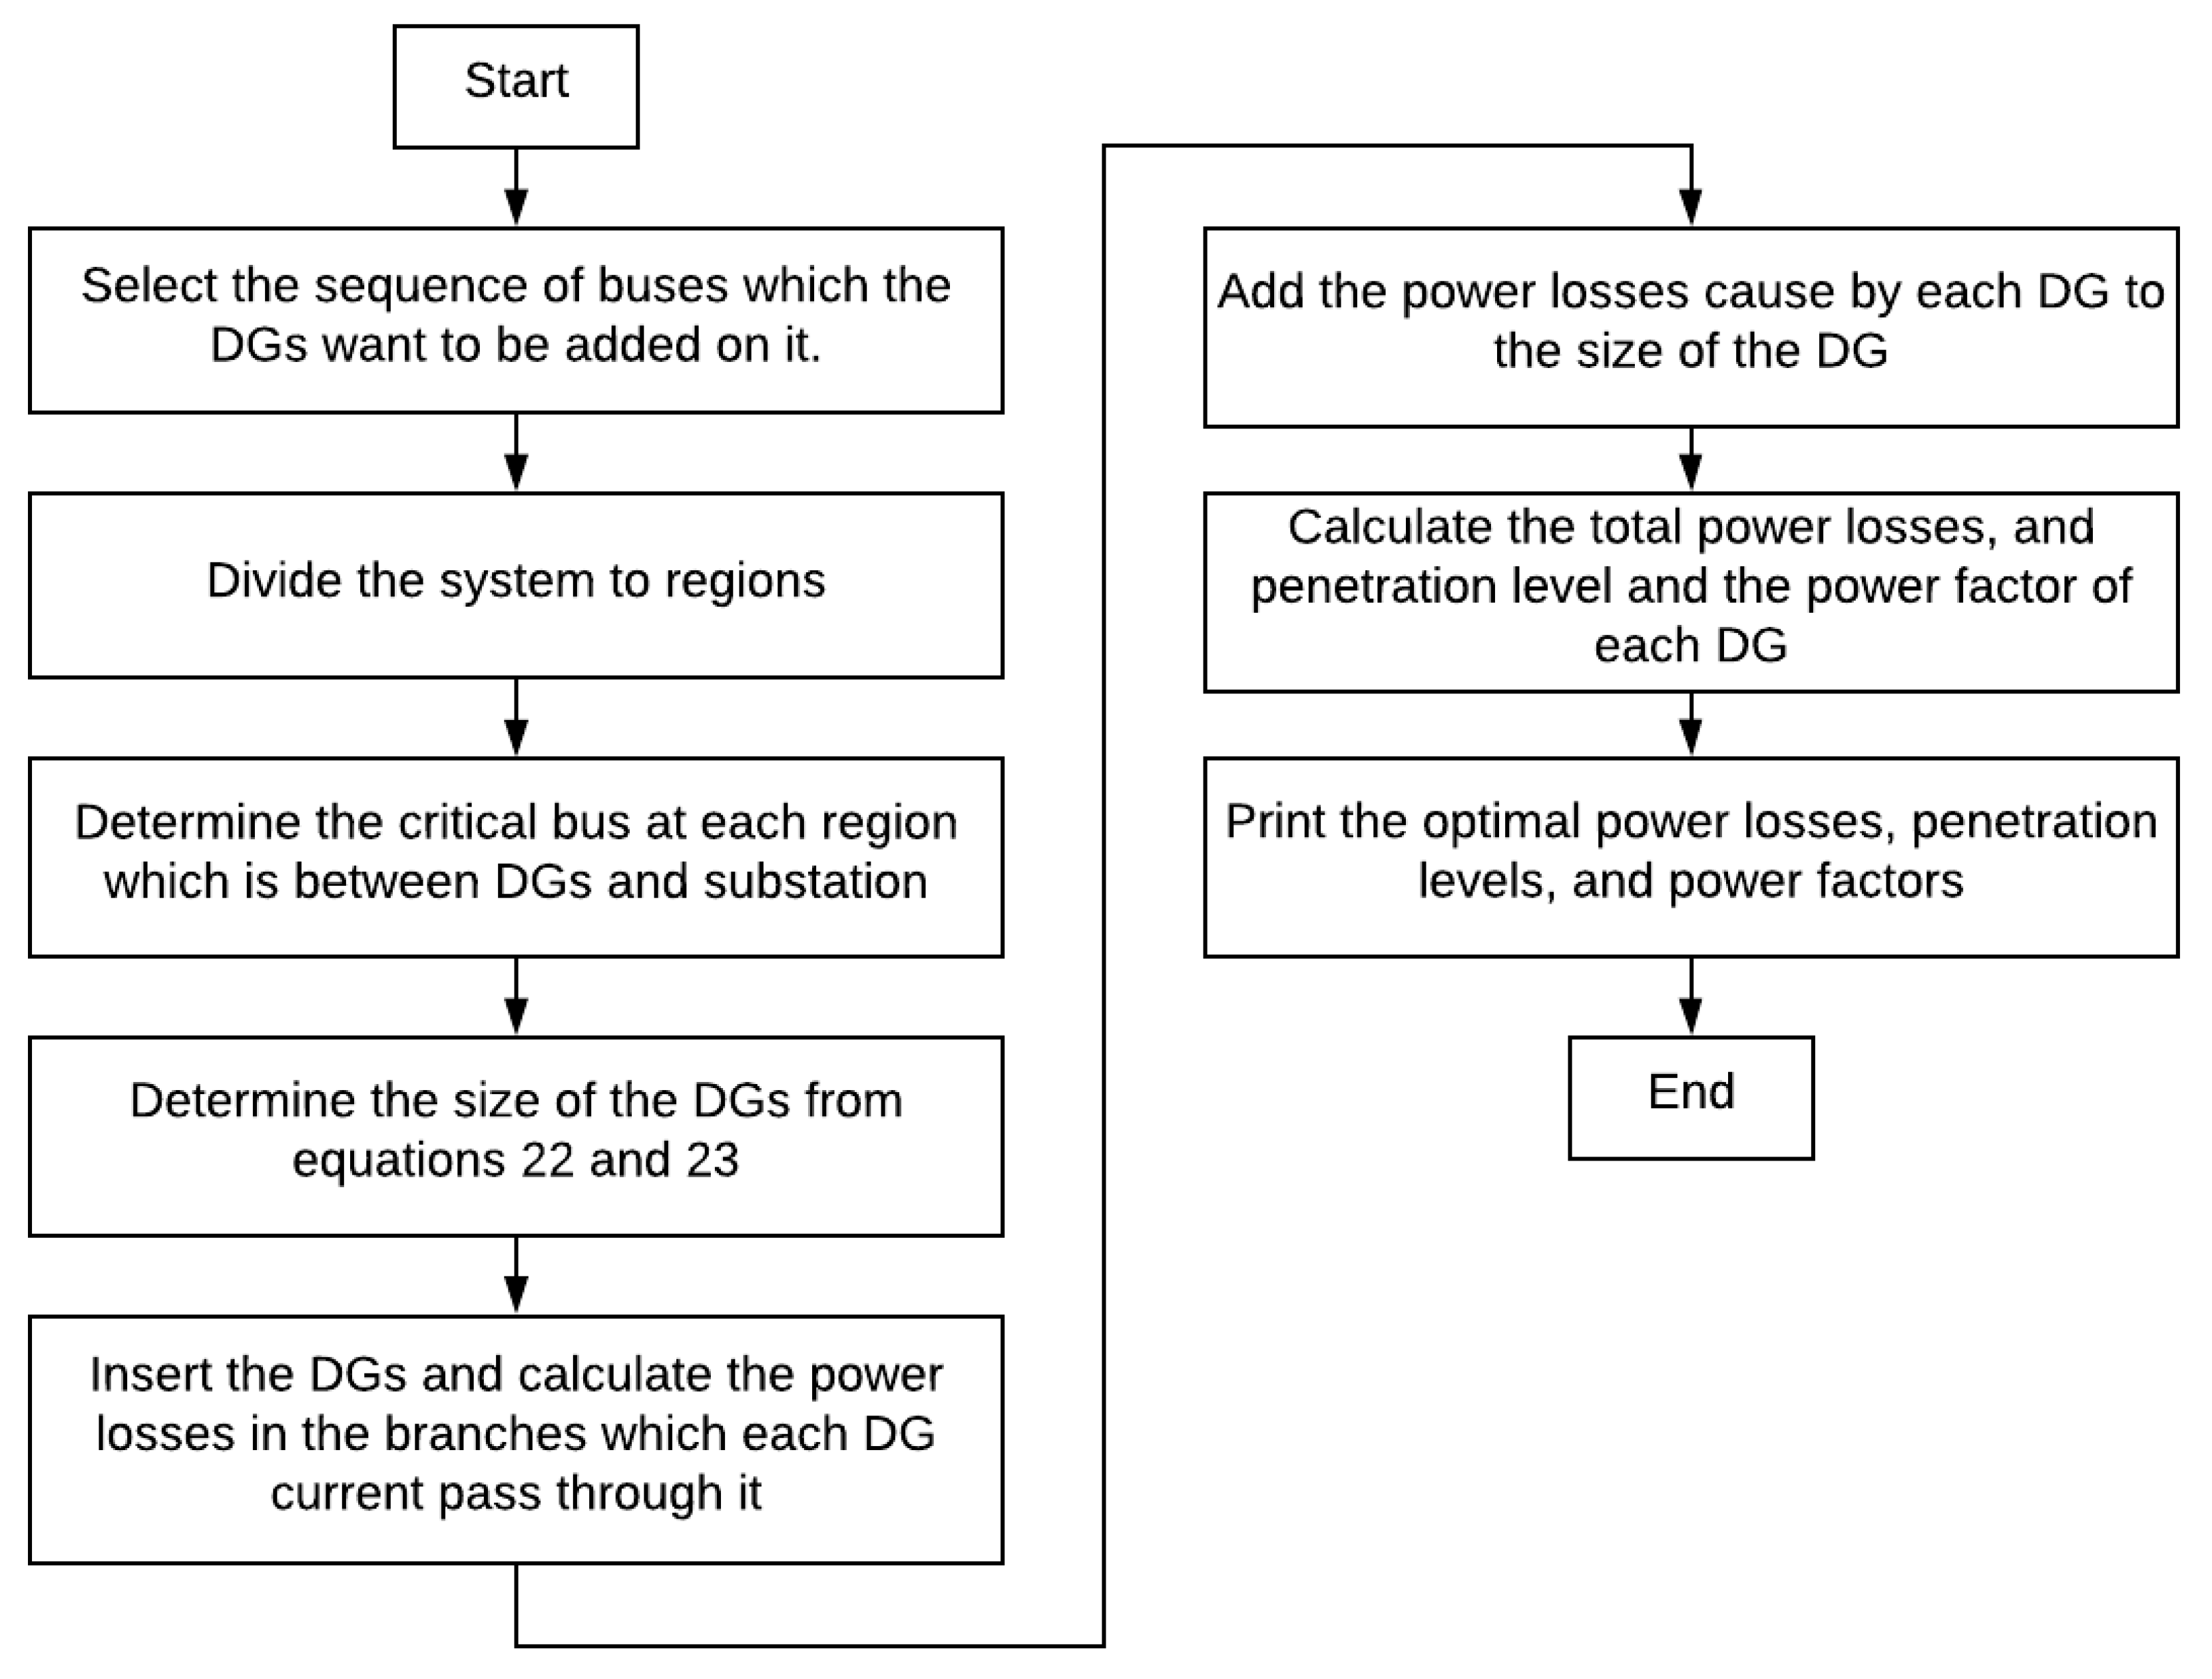
The main contribution of this paper is to develop a new analytical method for optimally planning of DGs in order to minimize the power loss in distribution networks. The proposed method developed analytical expressions that has been initiated, formulated, and solved in a simplified manner by finding the optimal capacities, locations, and power factors of the DG units added to the system by referring to the resistances of the distribution lines in which the current pass through and hence efficiently provides an accurate optimal solution without using intensive computational capabilities. On the other hand, the proposed method is based on simple algorithm via basic mathematical models. Therefore, it can be easily extended to consider the load variation and intermittent nature of RES-based DGs.
This paper is organized in five sections and the rest of the paper is prepared as follows: Section 2 gives a brief introduction about DG technology; this section includes a grid interconnection pros and cons. In addition, major DG types and capacity are addressed in this section. Section 3 introduces the mathematical representation and present detailed descriptions of the proposed approach. 
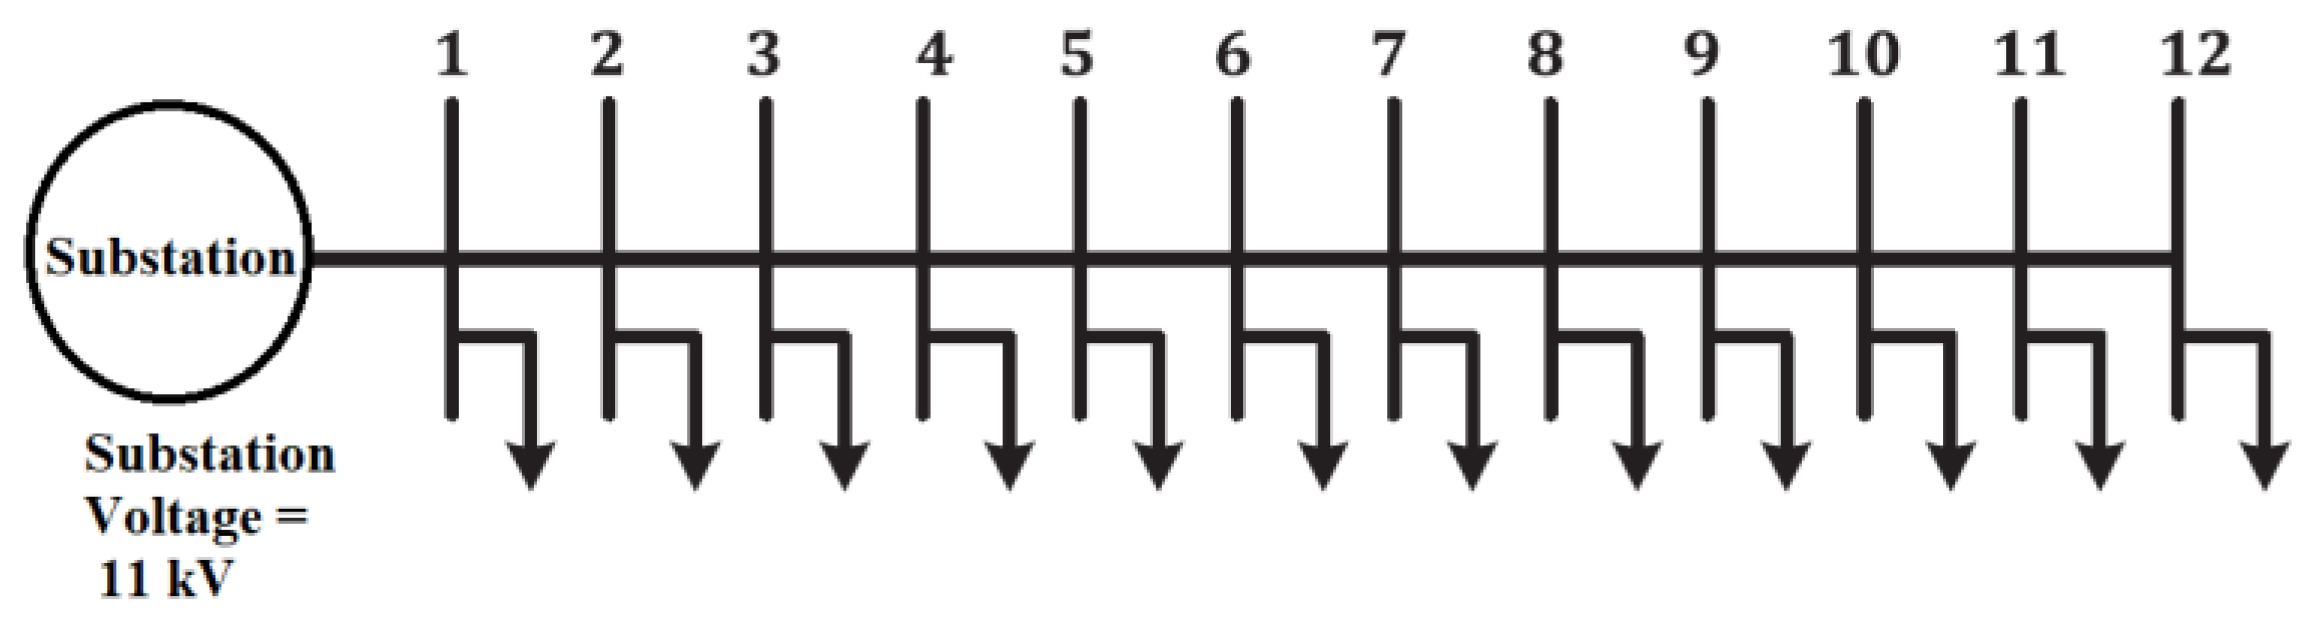
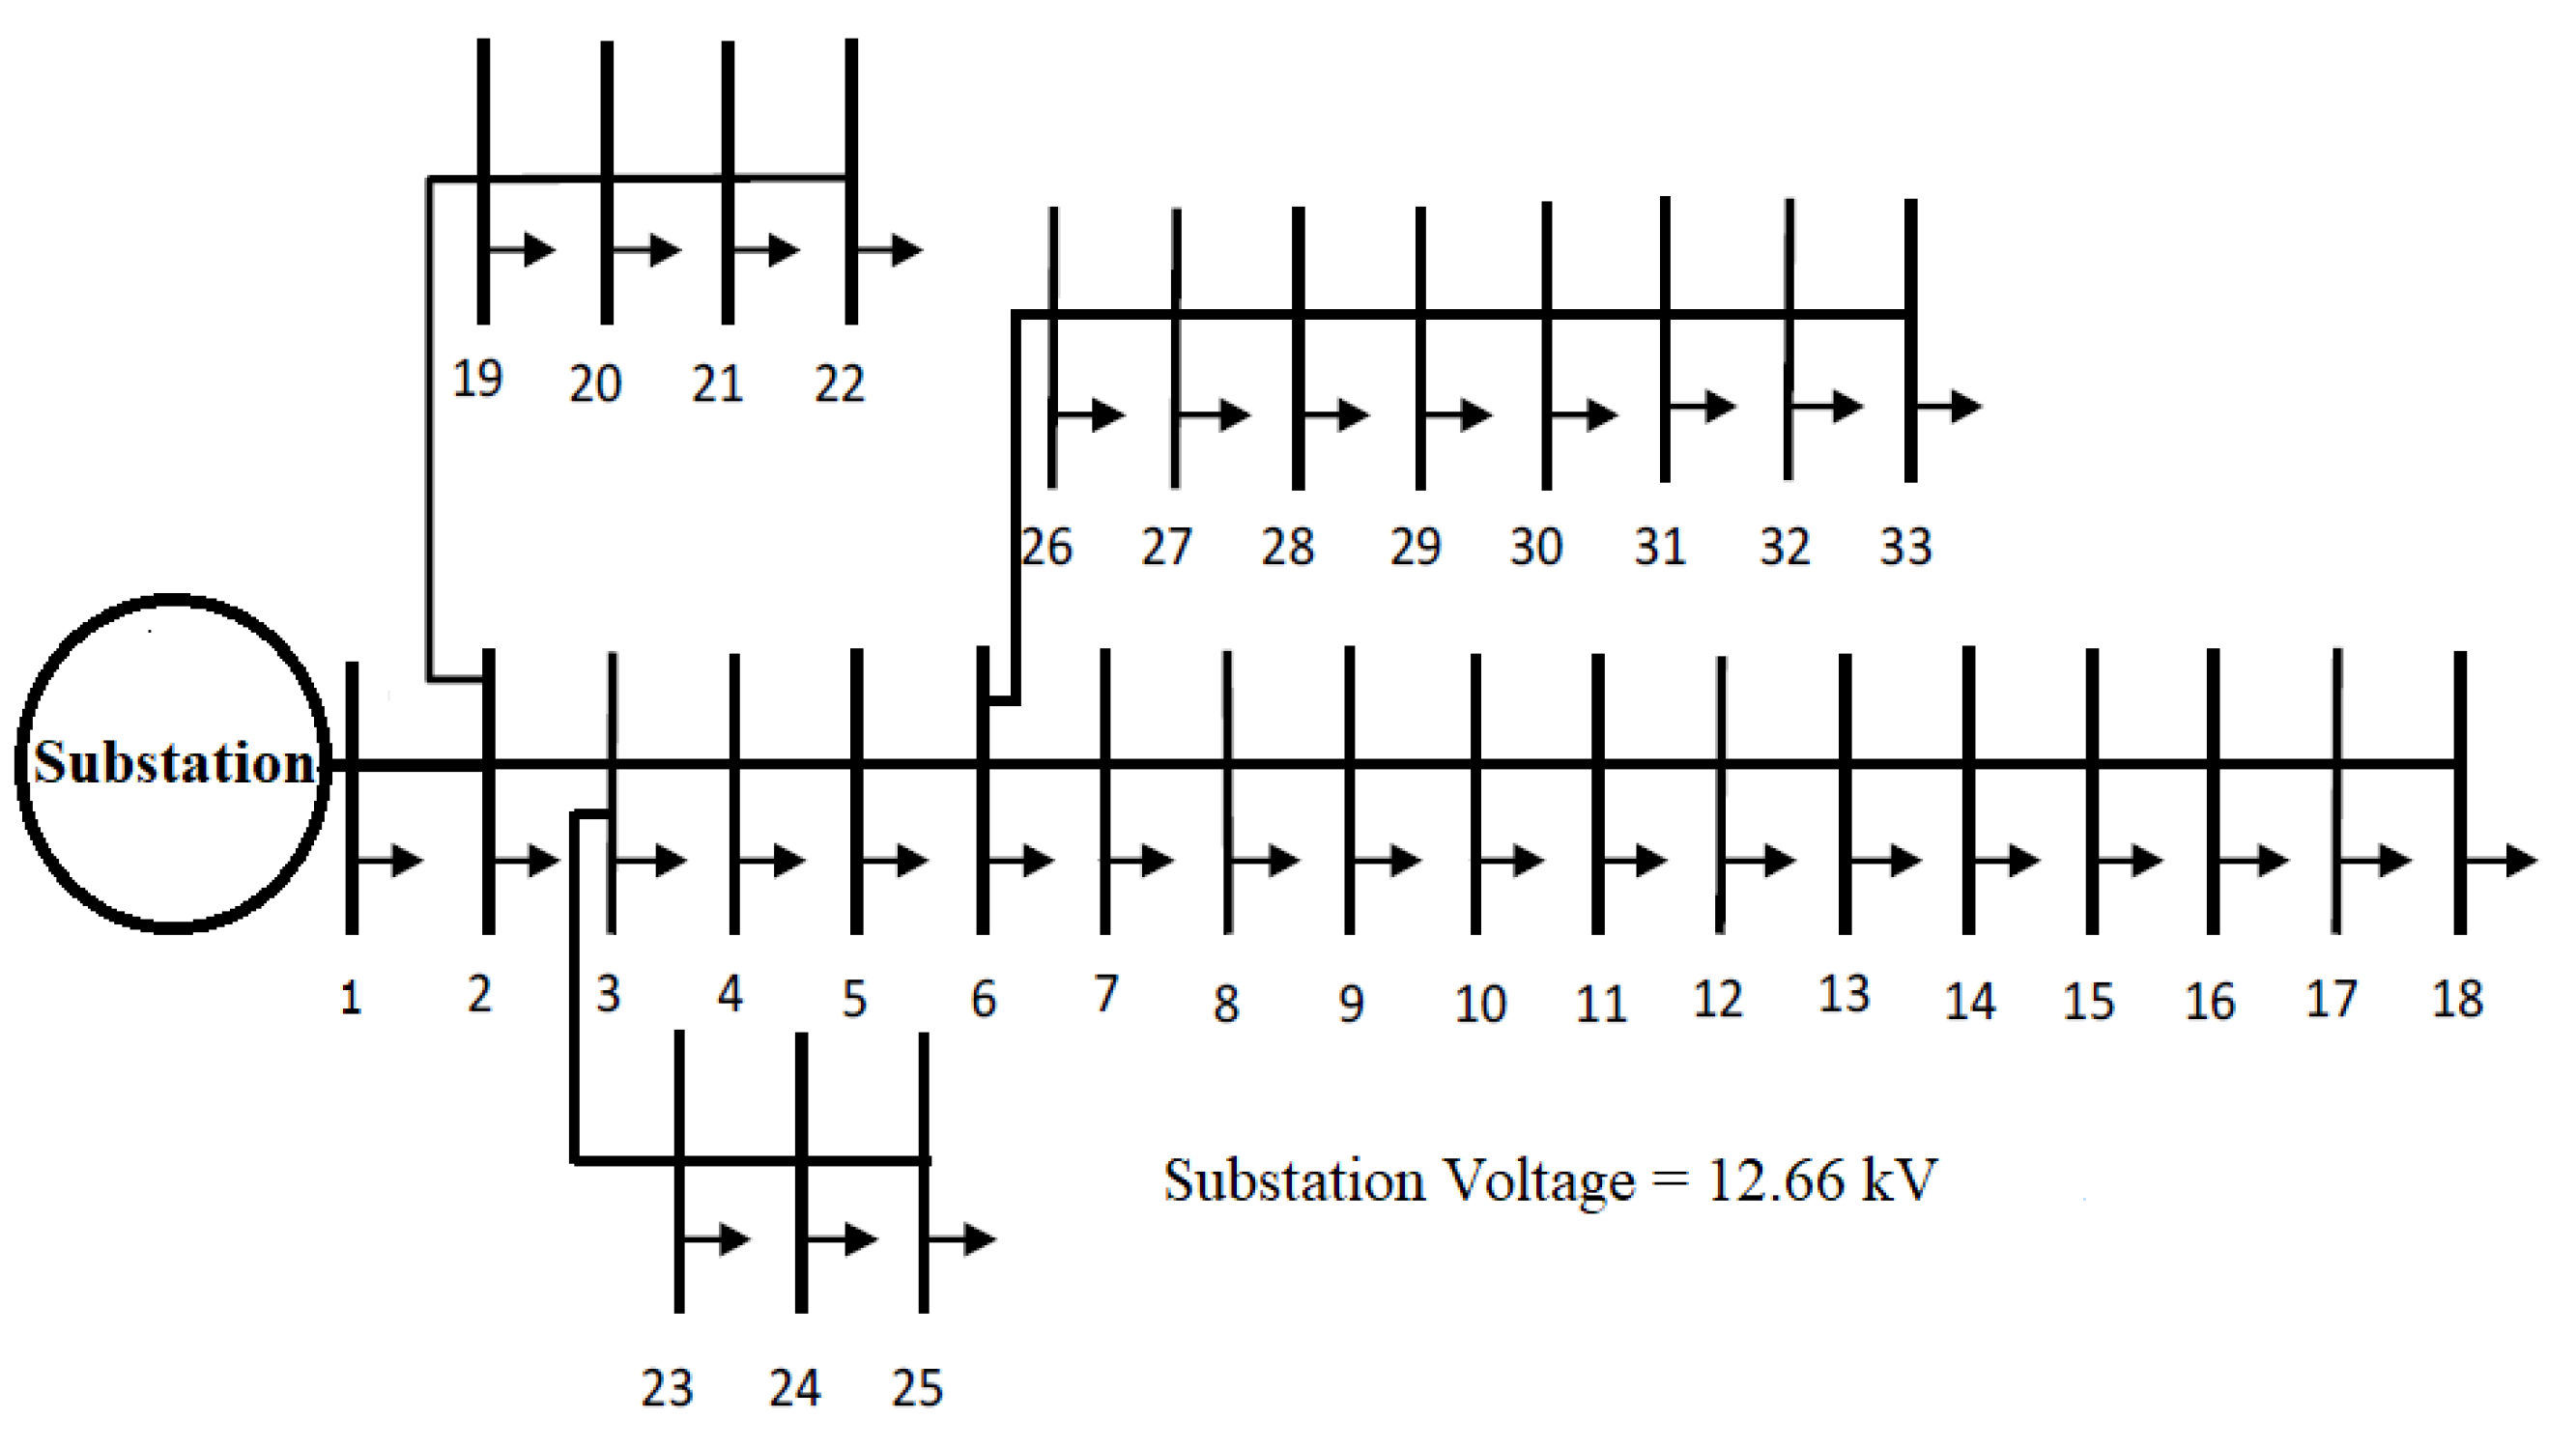
Section 4 presents the simulation results considering single and multiple DGs interconnection. The last section concludes the work presented.

2. Distributed Generation Technology

DG plays an important role in generating power alongside power plants, but at the distribution level. DG can assist supplying energy needs or enhancing network’s power quality (PQ). DG can improve reliability as well as provide some benefits including: reduced lines losses, reactive power control, congestions’ mitigation at distribution and transmission level, increased system capacity and lower reserve margin requirements at low cost, and shorter power outages. This technology and its impacts are dependable on the capacity, location, and type of DG [3,4,5,6,7].

2.1. Distributed Generation, Grid Interconnection Pros and Cons

There are many advantages for the distribution generation interconnection with the grid. First of all, economic advantages can be summarized by: the cost of DG electricity varies because of a number of factors. Therefore, the cost fluctuates below and above grid electricity cost. A good monitoring of DG electricity prices can lead to massive price reductions. The DG can be a means of voltage regulation in buses that lie in the distribution level. The reliability of the system is increased, this comes from the fact of having multiple sources in the network. On the other hand, the disadvantages of DG, grid interconnection are: Grid operators will request money in exchange of the interconnection action. The owner of the DG will be expected to pay for the electricity supplied by the grid and a fee proportional to the maximum power supplied. Apparatus and maintenance fees are required. The addition of control, metering, and protection devices are very essential to separate the DG system from the grid; this is very critical to ensure that the complexity of the system does not reflect terribly on the operation of the overall system. To enhance the reliability of the overall grid the aforementioned maintenance must be satisfied regularly. Problems that occur far from the DG units can still harm them. Therefore, more complex and numerous protective devices must be installed to avoid critical situations [7,8,40,41].
In order to provide the optimal solution that maximizes the benefits, minimizes the costs, and overcome the technical challenges of DG installation; the planning of the DG-Integrated distribution systems requires the characterization of several factors, such as: the total number and capacity of the distributed generators, their optimal location in the network, the kind of connection with the grid, etc. [3,4,5,6,7].

2.2. Distributed Generation Types and Capacity

There are two possibilities of DG; Grid connected and autonomous DG [40]. These possibilities can be split up into two groups depending on the availability: firm and intermittent power. The firm power generation which gives the ability to control the power of DG as a function of the demand. “Firm DG plants” are often classified as supporters; in periods of high consumption. The intermittent power generations cannot be depended on for fulfilling all load requirements, having such a generation character. For this type of power generation technology there is wind power technology or solar power technology that is capable of energy production only when the wind is blowing and the sun is shining [8,9,10].
Subsequently, DG is able to support traditional generation, for example, gas turbines, and internal combustion engines and, in huge institution, combined-cycle turbines steam turbines. Different types such as, Stirling engines micro turbines, renewable energies or fuel cells, including solar energy, geothermal energy, or wind energy can be used [8,9,10].
As earlier mentioned, the effect of DG units strongly depends on the type of DG unit. Generally, four major types of DG are classified, based on their real and reactive power delivering the capability [36], as shown in Table 1. Considering the single line diagram shown in Figure 1, assuming the real power output of DG connected to bus n is PDGn, the DG reactive power output is QDGn, the DG power factor is PFDGn, the real power of the load connected to bus n is PLn, the reactive power of the load connected to bus n is QLn. Then the active and reactive power injected at bus n, where the DG is located, are given by [39]:
P n = P D G n P L n
Q n = Q D G n Q L n
in which
Q D G n = c P D G n
where
c = ( s i g n ) tan ( cos 1 ( P F D G n ) )
The sign function is defined as:
s i g n =   { + 1 ; D G   i n j e c t i n g   r e a c t i v e   p o w e r 1 ; D G   c o n s u m i n g   r e a c t i v e   p o w e r }
The characteristics of the four DG types are listed in Table 2.
In order to study the impact of DGs capacity on the network operation characteristics, the Penetration Level of DGs can be defined as the ratio of the total complex power generated from DGs ( S D G ) to the total complex power peak load demand ( S P e a k ) and it can be calculated as [3,4,5,6,7]:
Penetration   Level = S D G S P e a k 100 %

3. Proposed Approach

The main idea of the proposed method constructed by referring to the resistances of the distribution lines in which the current pass through, and the goal of this method is planning to force the current which feeds each load to pass through the path that has the smallest resistance in the distribution line; and hence guarantee maximum real power loss reduction. The details of the proposed method are listed as follows:

3.1. For Single DG Interconection

Consider a distribution system shown in Figure 2, assuming that the DG is inserted at bus number n. Hence, the system can be divided into two regions; the first region is from bus n to the last bus of the system, while the second region is from the second bus (after the slack bus) to the bus before the DG (n − 1). The loads in the first region are preferred to be fed from the DG, in order to minimize the resistance of distribution line which the current passes through, therefore the power losses are minimized in the system.
In the second region, the source of the power flowing to each load should be tested, in order to check if it should be fed from the substation or from the DG, depending on the resistance which minimizes the power losses. The last bus in which the resistance of the distribution lines from the substation to this bus is smaller than the resistance of the distribution lines from this bus to the DG can be defined as the critical bus. The load at this bus is fed from both the DG and the substation by a certain ratio which gives minimum power losses in the branches surrounding this bus.
Figure 3 represents the flowchart for the proposed algorithm which is used for finding the critical bus when the DG is installed at each bus; also the equations that are used to determine the ratio of power supplied from the DG and substation to the critical bus are presented and derived in the following paragraphs.
After determining the critical bus when the DG is installed at each bus, optimal active power and reactive power of the DG that minimize the power losses in the network can be derived and achieved. Consider a distribution system shown in Figure 4 which represents a simple case where the DG is inserted at bus 4, and assumed that the critical bus is found at bus 2, Kirchhoff’s current law is applied at each bus and Equations (7) and (8) can be obtained.
I 1 = I L 1 I 2
I 3 = I L 2 + I 2
where Ich is the rms phasor current in the branch ch, and ILi is the rms phasor current at the load connected to the bus i.
P L o s s = 3 | I 2 | 2 R 2 + 3 | I 3 | 2 R 3 + 3 | I 1 | 2 R 1
P L o s s = 3 | I 2 | 2 R 2 + 3 | I L 2 + I 2 | 2 R 3 + 3 | I L 1 I 2 | 2 R 1
where P L o s s is the total power losses, and R i is the resistance for branch i.
To obtain the value of | I 2 | which gives the minimum power losses, the power losses formula is derived as:
d P L o s s d | I 2 | = 6 | I 2 | ( R 1 + R 2 + R 3 ) + 6 ( ( | I L 2 | R 3 ) ( | I L 1 | R 1 ) ) = 0
By solving Equation (11), | I 2 | is obtained as:
| I 2 | = | I L 1 | R 1 | I L 2 | R 3 R 1 + R 2 + R 3
The ratio ( ) between | I 2 | and | I 1 | can be defined as the ratio of the current fed from the DG to the current fed from the substation and it can be calculated as:
= | I 2 | | I 1 | = | I 2 | | I L 1 I 2 |
The ratio ( Ɣ ) can be defined as the ratio of the current fed from the DG to the specific load total current and it can be calculated as:
Ɣ = | I 2 | | I L 1 |
The ratio ( Ɣ ) can be also considered as the percentage of the power of the critical bus which is fed from the DG; Ɣ can be also obtained as represented in Equation (16).
Ɣ + Ɣ = 1
Ɣ = 1 ( 1 + 1 )
For the general case when the DG is inserted at a generic bus in the system (bus number n) and the critical bus is at bus m (where m < n), and the total number of buses is N, the following calculations are performed:
| I m | =   i = 1 n 1 C i R i i = 1 n 1 R i
where,
C i = { j = i m 1 | I L j | 1 < i m 1 j = i n 1 | I L j | m i < n 1
The total active power, reactive power, and power factor of the DG which is inserted at bus n can be calculated by Equations (19)–(21) respectively.
P D G n = i = m + 1 N P L i + ( Ɣ × P L m )
Q D G n = i = m + 1 N Q L i + ( Ɣ ×   Q L m )
P F D G n = cos ( tan 1 ( Q D G n P D G n ) )
where P D G n , Q D G n , and P F D G n are the optimal active power, optimal reactive power, and optimal power factor of DG when it is inserted at bus number n respectively. P L i , Q L i are the active and reactive power of the load connected to the bus number i. Also, P L m and Q L m are the active and reactive power of the load connected to the critical bus m.
After determining the penetration level of the DG unit, the power losses, which are due to the current supplied from the DG (after the critical bus to the last bus), are added to the penetration level of the DG in order to let the DG to be able to deliver the current to these loads. Then, after assessing the optimal penetration level of the DG at each bus in the network, the optimal location that minimizes the power losses in the network can be evaluated. Finally, the performance of DG-integrated distribution system is investigated and the exact value of the total power losses is calculated based on the accurate model using power flow equations.
If the system has a sub-branch, such as the distribution network shown in Figure 5 where the sub-branch is in bus s, the system should be divided into three regions. If the DG is desired to be installed at bus sn, the first region is from bus sn to bus sx; which is preferred to be fed from the DG. While, the second region is from bus 2 to bus s and from bus s to bus s1, in this case the same procedure for the second region in the normal case which is without sub-branches is proceeded. The third region is from bus s + 1 to bus y; these three regions are illustrated in Figure 5. In this particular, the resistance of the distribution lines from the substation to bus s and the resistance of the distribution lines from the DG to bus s are compared and the minimum resistance between these two resistances is chosen in order to reduce the power losses. So, in this case, DG capacity can be represented mathematically in order to be implemented in the algorithm as:
P D G n = i = s n s x P L i + i = m + 1 s n P L i + ( Ɣ × P L m ) + a i = ( s + 1 ) y P L i
Q D G n = i = s n s x Q L i + i = m + 1 s n Q L i + ( Ɣ × Q L m ) + a i = ( s + 1 ) y Q L i
where,
a = { 1 ,   i = 1 s R i   >   i = s n s R i 0 ,   o t h e r w i s e
Ɣ = 1 ( 1 + 1 ) , = | I m | | I m 1 |
and m is the critical bus number.
Note: i = m + 1 s n P L i and i = m + 1 s n Q L i should be determined in region 2.

3.2. For Multiple DGs Interconection

In multiple DGs case, all possible combinations or sequences of interconnected DG buses are generated and obtained. As an example, for the distribution system shown in Figure 4, the possible sequences of locations for interconnecting two DGs (if the slack bus is excluded) are: (Bus2, Bus3), (Bus2, Bus4), (Bus3, Bus4). For each obtained sequence, the system must be divided into regions in which the rules discussed before are satisfied. Then, the loads can be divided to be feed from the DGs and the substation in order to minimize the resistance in which each load current passes from it.
Notes:
(1)
If the DG is located in a bus at any sub-branch the number of the regions in the system is increased by one.
(2)
If the number of DGs added increases by one, the number of the regions in the system is increased by one.
Figure 6 represents a flow chart which can be followed to determine the optimal penetration levels and optimal power factors for desired DG locations. After assessing these values for each sequence, the optimal location that minimizes the total power losses in the network can be evaluated.

3.3. Voltage Profile Constraint

The voltage at every bus in the distribution grids should be kept within specific range [42]. The acceptable range of voltage profile is well defined in international standards [43,44,45]. The bus voltage constraint can be represented as:
V m i n V i V m a x   i   { b u s e s   o f   t h e   n e t w o r k }
In this work, the lower and upper voltage thresholds are set as V m i n = 0.9   p u and V m a x = 1.05   p u [36,39,43,44,45].

4. Results and Discussion

The proposed approach has been tested on two different distribution systems; the first one is a 12-bus system with the total active and reactive peak load of 435 kW and 405 kvar respectively, and the total real power loss of 20.7 kW. The single line diagram of this test system is shown in Figure 7. The line and load data for this test system is available in [46]. The second test system, as depicted in Figure 8, contains 33 buses and 32 branches; it is a radial system with the total peak load of 3715 kW and 2300 kvar, and the total real power loss of 211 kW. The line and load data for the 33-bus test system is available in [47]. The third test system which is shown in Figure 9 is 69-bus radial system, it has the total active and reactive peak load of 3802.19 kW and 2694.60 kvar respectively, and the total real power loss of 225 kW. The detailed data for this system appear in [48].
In order to evaluate the power losses reduction (PLR) in these two test systems, the following formula is used:
P L R =   P L o s s ,   n o D G   P L o s s , W i t h   D G P L o s s ,   n o D G   × 100 %
where: P L o s s ,   n o D G is the total real power losses in the network without DGs (in kW), and P L o s s , W i t h   D G is the total real power losses in the network in the presence of DGs (in kW).

4.1. 12-Bus Test System

The 12-bus radial distribution system is simple and used in order to validate the proposed method. Moreover, most of the algorithm steps for the proposed method are discussed. In order to ensure about the performance and accuracy of the proposed method, the evaluated results are validated by comparison with the exact solutions obtained by exhaustive optimal power flow (OPF) algorithm which required excessive calculations efforts.
The critical bus, when a single DG is added at a generic bus, is determined by referring to the flowchart of Figure 3. Figure 10 represents the sign of the difference in impedances. The critical bus is the last tested bus which has negative sign in the difference of the resistances. As an example, if the DG is interconnected at bus 8, the critical bus will be bus # 4. And if the DG is interconnected at bus 10, the critical bus will be bus # 7.
The proposed method was implemented and compared with the actual values, which are obtained by exhaustive OPF solution, as shown in Figure 11. It is clear that the proposed method performance succeed to give results very close to the actual values. Table 3 represents a comparison between the proposed method and the actual values obtained by exhaustive OPF. The results for the proposed method show that the minimum power losses is 3.1587 kW when the penetration level of the DG is 52.97% with power factor equal to 0.73, also, it was noticed that the optimal location of the DG is at bus 9. While, the actual results showed that the minimum power losses is 3.1561 kW when the penetration level of the DG is 53% with power factor equal to 0.74, also, it was noticed that the optimal location of the DG is at bus 9 which is the same location of the proposed method.
In order to deal with the case of multiple DGs interconnection. The previous part has been repeated for more than one DG and as an example two DGs are considered. Figure 12 represents a 3D plot of the total power losses with respect to the location of the two DGs added to the system; the diagonal of the x-y plane (locations of the first and second DGs) represents the case of two interconnected DGs on the same bus and simply it can be considered as the case of interconnected single DG. However, it is noticed that for all bus numbers, the single DG added to the system results in higher power losses than the case of two DGs added to the system. Moreover, it is noticed that the optimal location of the first DG in order to reduce the power losses as much as possible is at bus 7, and the location of the second DG is at bus 10. Table 4 presents a comparison between the values of proposed method and the actual ones for the case of 2 DGs interconnection. It is clear from the results that the processed method has an excellent accuracy and the values are very close to the exact ones.
Voltage profile of 12-bus distribution test system is shown in Figure 13, the “Without DG” curve shows the voltage profile for the original test system and this curve identify that the minimum voltage occurs at the end of the feeder. In addition, it is observed that the voltages at all buses are within the acceptable voltage range. It is clear that the bus voltages will enhance when DGs are optimally connected in the electrical distribution system.

4.2. 33-Bus Test System

The second test system used in the study is 33-bus test system, this test system is a widely used in the literature. To evaluate and validate the performance of the proposed method, results have been compared with hybrid approach, improved analytical (IA) method, and particle swarm optimization (PSO) technique [36,37,38,39].
Referring to the proposed method and considering the case when a single DG is interconnected at each bus, Figure 14 shows the critical buses. After that, assessing the optimal penetration level of the DG at each bus in the network is required; finally, the optimal location that minimizes the power losses in the network is evaluated. The power losses have been calculated when the DG is installed at each bus as presented in Figure 15 which shows that the minimum power losses that can be achieved when a single DG unit is added at each bus. As a result, it is noticed that the minimum power losses is 67.75 kW and occurred when the DG is added to the bus 6 with penetration level of 70.444% and power factor of 0.8255.
Table 5, Table 6, Table 7 summarize the results of the proposed method for single, two, three DG units interconnection in terms of optimal DG location, DG penetration level, DG power factor, and total power losses. The results of the proposed method have been compared with the hybrid, PSO, and IA methods. The last column in these tables presents the amount of power loss reduction achieved by the above-mentioned methods. The results in Table 5 show that better PLR values are attained with the proposed method in the one DG interconnection scenario. On the other hand, the results of the other three methods are the same in terms of PLR, optimal DG locations, and optimal PF with negligible change in the penetration level. In contrast, for the scenario of 2DG interconnection, it was noticed from Table 6 that the IA method provides power losses of 44.39 kW compared to 28.60 kW obtained by the proposed method and other two methods. This is because IA often fails to succeed in determining the optimal locations, especially for multiple DG interconnections. From Table 7, the proposed method and hybrid method achieved a PLR of 94.455%, compared to 94.408% for PSO method which is nearly the same. Again, IA failed to succeed in determining the optimal locations and hence achieves the lowest PLR values.
Regarding the voltage profile for 33-bus test system, it is clear from Figure 16 that the presence of DG in the system improves the voltage profile. The case of interconnecting more than one DG provides more voltage improvement. However, the improvement in the voltage profile in the case of two DGs and three DGs are nearly the same.

4.3. 69-Bus Test System

Table 8 and Table 9 present the results for 69-bus test system when single and two DGs are connected respectively. The results of the four methods are nearly the same in terms of optimal DG parameters which leads to nearly the same PLR. Particularly, for three DG units as shown in Table 10, the results of the proposed method are same as by PSO technique in terms of optimal location, but PLR is 98.10% by the proposed method as compared to 97.95% by PSO technique.
Figure 17 shows the voltage profile for 69-bus test system before and after the DG interconnection, it is observed that voltage profile improves in all cases when the DG is connected to the system, moreover the voltage profile variations satisfy the voltage constraint which is defined in the international standards.

5. Conclusions

The paper has proposed analytical method for determining optimal location, capacity, and power factor of DGs for minimizing losses in power distribution networks. Validity of the proposed method are tested and verified on two test systems. In addition, a comparison has been conducted with hybrid, IA, and PSO methods. Based on the results, the main observations are summarized as follows:
  • The proposed method can provide a simple and accurate solution and do not required exhaustive computations.
  • Locations, capacities, and power factor of DG are crucial factors in the planning of the DG-integrated distribution systems for loss minimization.
  • DG of type 1 with optimal power factor reduces losses more than the DG of other types.
  • The voltage profile will improve when DGs are optimally connected to the distribution networks.
Finally, the proposed method is based on simple algorithm via basic mathematical models. Therefore, it can be easily extended to consider the load variation and intermittent nature of RES-based DGs.

Author Contributions

All authors contributed extensively to the work presented in this paper. J.A.S. proposed the topic, conceived the solution, and supervised the whole work. M.A., A.B. (Ahmad Bodair), and A.B. (Ahmad Baransi) studied and programed the proposed approach. S.F. and G.Z. contributed materials and reviewed the results.

Funding

This research received no external funding.

Acknowledgments

The present work has been realized in the framework of the Research Cooperation Agreement between the Engineering Department of the University of Palermo and the Department of Electrical and Computer Engineering of Birzeit University, for the project DGWG—Distributed Generation integration in Weak Grids.

Conflicts of Interest

The authors declare no conflict of interest.

References

  1. Seritan, G.; Porumb, R.; Cepisca, C.; Grigorescu, S. Integration of Dispersed Power Generation. In Electricity Distribution—Intelligent Solutions for Electricity Transmission and Distribution Networks; Karampelas, K., Ekonomu, L., Eds.; Energy Systems; Springer: Heidelberg/Berlin, Germany, 2016; pp. 27–61. [Google Scholar]
  2. Porumb, R.; Seritan, G. Integration of Advanced Technologies for Efficient Operation of Smart Grids. In Green Energy Advances; IET Inspec: London, UK, 2019. [Google Scholar]
  3. Sa’ed, J.A.; Quraan, M.; Samara, Q.; Favuzza, S.; Zizzo, G. Impact of integrating photovoltaic based DG on distribution network harmonics. In Proceedings of the IEEE/EEEIC 2017, Milan, Italy, 6–9 June 2017; pp. 1–6. [Google Scholar]
  4. Sa’ed, J.A.; Favuzza, S.; Ippolito, M.G.; Massaro, F. Investigating the Effect of Distributed Generators on Traditional Protection in Radial Distribution Systems. In Proceedings of the IEEE/PowerTech 2013, Grenoble, France, 16–20 June 2013; pp. 1–6. [Google Scholar]
  5. Sa’ed, J.A.; Awad, A.; Favuzza, S.; Massaro, F.; Zizzo, G. A Framework to Determine Maximum Capacity of Interconnecting DGs in Distribution Networks. In Proceedings of the IEEE/CPE-POWERENG 2018, Doha, Qatar, 10–12 April 2018; pp. 1–6. [Google Scholar]
  6. Sa’ed, J.A.; Amer, M.; Bodair, A.; Baransi, A.; Favuzza, S.; Zizzo, G. Effect of integrating photovoltaic systems on electrical network losses considering load variation. In Proceedings of the IEEE/EEEIC 2018, Palermo, Italy, 12–15 June 2018; pp. 1–6. [Google Scholar]
  7. Sa’ed, J.A.; Jubran, M.K.; Favuzza, S.; Ippolito, M.G.; Massaro, F. Reassessment of voltage stability for distribution networks in presence of DG. In Proceedings of the IEEE/EEEIC 2016, Florence-Italy, 7–10 June 2016. pp. 1–5.
  8. Singh, B.; Sharma, J. A review on distributed generation planning. Renew. Sustain. Energy Rev. 2017, 76, 529–544. [Google Scholar] [CrossRef]
  9. Theo, W.L.; Lim, J.S.; Ho, W.S.; Hashim, H.; Lee, C.T. Review of distributed generation (DG) system planning and optimisation techniques: Comparison of numerical and mathematical modelling methods. Renew. Sustain. Energy Rev. 2017, 67, 531–573. [Google Scholar] [CrossRef]
  10. Viral, R.; Khatod, D.K. Optimal planning of distributed generation systems in distribution system: A review. Renew. Sustain. Energy Rev. 2012, 16, 5146–5165. [Google Scholar] [CrossRef]
  11. Ehsan, A.; Yang, Q. Optimal integration and planning of renewable distributed generation in the power distribution networks: A review of analytical techniques. Appl. Energy 2018, 210, 44–59. [Google Scholar] [CrossRef]
  12. Georgilakis, P.S.; Hatziargyriou, N.D. Optimal distributed generation placement in power distribution networks: Models, methods, and future research. IEEE Trans. Power Syst. 2013, 28, 3420–3428. [Google Scholar] [CrossRef]
  13. Rau, N.S.; Wan, Y.-H. Optimum location of resources in distributed planning. IEEE Trans. Power Syst. 1994, 9, 2014–2020. [Google Scholar] [CrossRef]
  14. Keane, A.; O’Malley, M. Optimal allocation of embedded generation on distribution networks. IEEE Trans. Power Syst. 2005, 20, 1640–1646. [Google Scholar] [CrossRef]
  15. Harrison, G.P.; Wallace, A.R. Optimal power flow evaluation of distribution network capacity for the connection of distributed generation. IEE Proc. Gener. Transm. Distrib. 2005, 152, 115–122. [Google Scholar] [CrossRef]
  16. Zhu, D.; Broadwater, R.P.; Tam, K.S.; Seguin, R.; Asgeirsson, H. Impact of DG placement on reliability and efficiency with time-varying loads. IEEE Trans. Power Syst. 2006, 21, 419–427. [Google Scholar] [CrossRef]
  17. Singh, D.; Mirsa, R.K.; Singh, D. Effect of load models in distributed generation planning. IEEE Trans. Power Syst. 2007, 22, 2204–2212. [Google Scholar] [CrossRef]
  18. Vinothkumar, K.; Selvan, M.P. Fuzzy embedded genetic algorithm method for distributed generation planning. Electr. Power Compon. Syst. 2011, 39, 346–366. [Google Scholar] [CrossRef]
  19. Kim, K.-H.; Lee, Y.-J.; Rhee, S.-B.; Lee, S.-K.; You, S.-K. Dispersed generator placement using fuzzy-GA in distribution systems. In Proceedings of the IEEE Power Engineering Society Summer Meeting, Chicago, IL, USA, 21–25 July 2002; pp. 1148–1153. [Google Scholar]
  20. Prommee, W.; Ongsakul, W. Optimal multiple distributed generation placement in microgrid system by improved reinitialized social structures particle swarm optimization. Int. Trans. Electr. Energy Syst. 2011, 21, 489–504. [Google Scholar] [CrossRef]
  21. Shaaban, M.F.; Atwa, Y.M.; El-Saadany, E.F. DG allocation for benefit maximization in distribution networks. IEEE Trans. Power Syst. 2013, 28, 639–649. [Google Scholar] [CrossRef]
  22. Golshan, M.E.H.; Arefifar, S.A. Optimal allocation of distributed generation and reactive sources considering tap positions of voltage regulators as control variables. Int. Trans. Electr. Energy Syst. 2007, 17, 219–239. [Google Scholar] [CrossRef]
  23. Suresh, M.C.V.; Belwin, E.J. Optimal DG placement for benefit maximization in distribution networks by using Dragonfly algorithm. Renew. Wind Water Solar 2018, 5, 4. [Google Scholar] [CrossRef]
  24. Aman, M.M.; Jasmon, G.B.; Mokhlis, H.; Bakar, A.H.A. Optimal placement and sizing of a DG based on a new power stability index. Int. J. Electr. Power Energy Syst. 2012, 43, 1296–1304. [Google Scholar] [CrossRef]
  25. Vijay Babu, P.; Singh, S.P. Optimal placement of DG in distribution network for Power loss minimization using NLP & PLS Technique. Energy Procedia 2016, 90, 441–454. [Google Scholar]
  26. Gözel, T.; Hocaoglu, M.H. An analytical method for the sizing and siting of distributed generators in radial systems. Electr. Power Syst. Res. 2009, 79, 912–918. [Google Scholar] [CrossRef]
  27. Singh, D.; Singh, D.; Verma, K.S. Multiobjective optimization for DG planning with load models. IEEE Trans. Power Syst. 2009, 24, 427–436. [Google Scholar] [CrossRef]
  28. El-Khattam, W.; Hegazy, Y.G.; Salama, M.M.A. An integrated distributed generation optimization model for distribution system planning. IEEE Trans. Power Syst. 2005, 20, 1158–1165. [Google Scholar] [CrossRef]
  29. Wang, C.; Nehrir, M.H. Analytical approaches for optimal placement of distribution generation sources in power systems. IEEE Trans. Power Syst. 2004, 19, 2068–2076. [Google Scholar] [CrossRef]
  30. Rajkumar, V.; Khatod, D.K. An analytical approach for sizing and siting of DGs in balanced radial distribution networks for loss minimization. Int. J. Electr. Power Energy Syst. 2015, 67, 191–201. [Google Scholar]
  31. Devi, S.; Geethanjali, M. Application of modified bacterial foraging optimization algorithm for optimal placement and sizing of distributed generation. Expert Syst. Appl. 2014, 41, 2772–2781. [Google Scholar] [CrossRef]
  32. Rao, G.S.; Obulesh, Y. Voltage profile improvement of distribution system using distributed generating units. Int. J. Electr. Comput. Eng. 2013, 3, 337–343. [Google Scholar]
  33. Jamian, J.; Mustafa, M.; Mokhlis, H. Optimal multiple distributed generation output through rank evolutionary particle swarm optimization. Neurocomputing 2015, 152, 190–198. [Google Scholar] [CrossRef] [Green Version]
  34. Gandomkar, M.; Vakilian, M.; Ehsan, M. A genetic–based tabu search algorithm for optimal DG allocation in distribution networks. Electr. Power Compon. Syst. 2007, 33, 1351–1362. [Google Scholar] [CrossRef]
  35. Othman, M.M.; Hegazy, Y.G.; Abdelaziz, A.Y. A modified firefly algorithm for optimal sizing and siting of voltage controlled distributed generators in distribution networks. Period. Polytech. Electr. Eng. Comput. Sci. 2015, 59, 104–109. [Google Scholar] [CrossRef] [Green Version]
  36. Satish, K.; Vishal, K.; Barjeev, T. Hybrid approach for optimal placement of multiple DGs of multiple types in distribution networks. Int. J. Electr. Power Energy Syst. 2016, 75, 226–235. [Google Scholar]
  37. Acharya, N.; Mahat, P.; Mithulananthan, N. An analytical approach for DG allocation in primary distribution network. Int. J. Electr. Power Energy Syst. 2006, 28, 669–678. [Google Scholar] [CrossRef]
  38. Hung, D.Q.; Mithulananthan, N.; Bansal, R.C. Analytical expressions for DG allocation in primary distribution networks. IEEE Trans. Energy Convers. 2010, 25, 814–820. [Google Scholar] [CrossRef]
  39. Hung, D.Q.; Mithulananthan, N. Multiple distributed generator placement in primary distribution networks for loss reduction. IEEE Trans. Ind. Electron. 2013, 60, 1700–1708. [Google Scholar] [CrossRef]
  40. IEEE 1547. Standard for Interconnecting Distributed Resources with Electric Power Systems; IEEE: New York, NY, USA, 2003; pp. 1–28. [Google Scholar]
  41. Paliwal, P.; Patidar, N.P.; Nema, R.K. Planning of grid integrated distributed generators: A review of technology, objectives and techniques. Renew. Sustain. Energy Rev. 2014, 40, 557–570. [Google Scholar] [CrossRef]
  42. IEEE Std 1547–2018. IEEE Standard for Interconnection and Interoperability of Distributed Energy Resources with Associated Electric Power Systems Interfaces; IEEE: New York, NY, USA, 2018. [Google Scholar]
  43. ANSI C84. Electric Power Systems and Equipment Voltage Ratings; NEMA: Arlington, VI, USA, 2011. [Google Scholar]
  44. EN 50160. Voltage Characteristics of Electricity Supplied by Public Electricity Networks; CENELEC: Brussels, Belgium, 2010. [Google Scholar]
  45. IEEE Std 1250-2018. IEEE Guide for Identifying and Improving Voltage Quality in Power Systems; IEEE: New York, NY, USA, 2018. [Google Scholar]
  46. Das, D.; Nagi, H.S.; Kothari, D.P. Novel method for solving radial distribution networks. IEE Proc. Gener. Transm. Distrib. 1994, 141, 226–235. [Google Scholar] [CrossRef]
  47. Kashem, M.A.; Ganapathy, V.; Jasmon, G.B.; Buhari, M.I. A Novel Method for Loss Minimization in Distribution Networks. In Proceedings of the International Conference on Electric Utility Deregulation and Restructuring and Power Technologies, London, UK, 4–7 April 2000; pp. 251–256. [Google Scholar]
  48. Baran, M.E.; Wu, F.F. Optimal Capacitor Placement on Radial Distribution Systems. IEEE Trans Power Deliv. 1989, 4, 725–734. [Google Scholar] [CrossRef]
Figure 1. Part of a distribution system with distributed generation (DG).
Applsci 09 05446 g001
Figure 2. Single line diagram of a simple distribution system.
Applsci 09 05446 g002
Figure 3. Flowchart to obtain the critical bus in any desired region.
Applsci 09 05446 g003
Figure 4. Sample of distribution network used for current derivation.
Applsci 09 05446 g004
Figure 5. Sample of distribution network with sub-branch.
Applsci 09 05446 g005
Figure 6. Flowchart to determine the optimal penetration level, and power factors for desired DG locations.
Applsci 09 05446 g006
Figure 7. Single line diagram of IEEE 12-bus distribution test system.
Applsci 09 05446 g007
Figure 8. Single line diagram of IEEE 33 bus distribution test system.
Applsci 09 05446 g008
Figure 9. Single line diagram of IEEE 69 bus distribution test system.
Applsci 09 05446 g009
Figure 10. The sign of the difference between the impedances of the two paths of the current for each bus when the DG installing at each bus.
Applsci 09 05446 g010
Figure 11. Power losses when the DG is connected to each bus with the optimal parameters.
Applsci 09 05446 g011
Figure 12. Minimum power losses for the combination of two DGs using the proposed approach.
Applsci 09 05446 g012
Figure 13. Voltage profile of 12-bus distribution test system.
Applsci 09 05446 g013
Figure 14. The critical bus when the DG is tested at each bus.
Applsci 09 05446 g014
Figure 15. Power losses when the DG is connected to each bus with the optimal parameters.
Applsci 09 05446 g015
Figure 16. Voltage profile of 33-bus distribution test system.
Applsci 09 05446 g016
Figure 17. Voltage profile of 69-bus distribution test system.
Applsci 09 05446 g017
Table 1. Major types of DG based on power delivering capability.
DG TypeType Description
Type 1DG injecting P and Q
Type 2DG injecting P and requiring Q
Type 3DG injecting only P
Type 4DG injecting only Q
Table 2. The c Parameters for the major types of DG.
DG Type P F D G i Signc
Type 1 0 < P F D G < 1 +1constant
Type 2 0 < P F D G < 1 −1constant
Type 3 P F D G = 1 +10
Type 4 P F D G = 0 +1
Table 3. Comparison between two methods for adding single DG using 12-bus test system.
MethodDG LocationPenetration Level (%)PFDG (Lagging)Total Power Losses (kW)PLR (%)
Proposed method952.970.733.158784.74
Actual9530.743.156184.75
Table 4. Comparison between two methods for adding two DGs using 12-bus test system.
MethodDG NumberDG LocationPenetration Level (%)PFDG (Lagging)Power Losses (kW)PLR (%)
Proposed methodDG near741.15580.71730.8508795.89
DG far1030.74180.7470
ActualDG near741.16650.71730.8508595.89
DG far1030.75250.7469
Table 5. Comparison between methods for adding single DG using 33-bus test system.
MethodDG LocationPenetration Level (%)PFDG (Lagging)Total Power Losses (kW)PLR (%)
Proposed method670.4440.825567.7567.89
Hybrid 669.3010.8267.9067.82
PSO669.4610.8267.9067.82
IA671.1090.8267.9067.82
Table 6. Comparison between methods for adding two DGs using 33-bus test system.
MethodDG NumberDG LocationPenetration Level (%)PFDG (Lagging)Total Power Losses (kW)PLR (%)
Proposed methodDG11322.4030.9028.6086.445
DG23035.4220.72
HybridDG11331.8130.9128.6086.445
DG23034.5130.72
PSODG11320.9180.9128.6086.445
DG23035.1310.73
IADG1650.2360.8244.3978.962
DG23025.1300.82
Table 7. Comparison between methods for adding three DGs using 33-bus test system.
MethodDG NumberDG LocationPenetration Level (%)PFDG (Lagging)Total Power Losses (kW)PLR (%)
Proposed methodDG11320.1250.9111.794.455
DG22427.0880.90
DG33033.0120.71
HybridDG11319.9800.9011.794.455
DG22427.1440.89
DG33032.9340.71
PSODG11319.7510.9111.894.408
DG22427.1890.90
DG33032.7510.71
IADG1625.1300.8222.389.436
DG23025.1300.82
DG31417.5770.82
Table 8. Comparison between methods for adding single DG using 69-bus test system.
MethodDG LocationPenetration Level (%)PFDG (Lagging)Total Power Losses (kW)PLR (%)
Proposed method6148.1120.81123.1889.70
Hybrid 6148.0670.81023.1989.69
PSO6147.6370.81023.2089.69
IA6148.1310.82023.1889.70
Table 9. Comparison between methods for adding two DGs using 69-bus test system.
MethodDG NumberDG LocationPenetration Level (%)PFDG (Lagging)Total Power Losses (kW)PLR (%)
Proposed methodDG11713.4890.8287.2196.80
DG26145.5510.816
HybridDG11713.5190.8207.2196.80
DG26145.4920.810
PSODG11713.5190.8207.2096.80
DG26145.7060.810
IADG11714.1410.8207.2596.78
DG26147.1010.820
Table 10. Comparison between methods for adding three DGs using 69-bus test system.
MethodDG NumberDG LocationPenetration Level (%)PFDG (Lagging)Total Power Losses (kW)PLR (%)
Proposed methodDG11112.6880.8144.2798.10
DG2189.8610.833
DG36144.0910.814
HybridDG11810.3000.7704.3098.09
DG26144.2040.830
DG36611.3730.820
PSODG11112.8750.8304.6197.95
DG2189.8710.810
DG36144.2040.810
IADG11713.3470.8204.9597.80
DG25017.7890.820
DG36144.4830.820

