1. Introduction
Fluid flow in pipeline systems is usually treated as a one-dimensional flow because one component of velocity is dominant; thus, other components can be neglected. Considering the one-dimensional flow assumption, computational simulations of transient events, pressure pulsations or water hammer often suffer from inaccuracy of the mathematical description of the dissipation mechanism, which is usually derived from the energy loss of steady flow and is proportional to velocity squared.
Usually, real energy dissipation is stronger than numerical models predict. This is obvious when the method of characteristic is used. Some authors compensate this difference by introducing the unsteady friction model, which is a type of turbulent model. Daily et al. in [
1], wrote a mathematical description of the basic turbulent model and performed an experimental investigation of the energy loss of an accelerating or decelerating flow, and this work is still often cited.
Caulk [
2] presented a one-dimensional nonlinear equations model derived for axisymmetric motion inside a slender surface of revolution. The general equations were specialized to reflect specific conditions on the fluid, such as the presence of surface tension, a confining elastic membrane or a rigid tube. Robertson [
3] applied the nine-director theory on the modeling of the blood flow in walls of arteries, that are typical case of flexible wall and non-Newtonian liquid fluid structure interaction case. Carapau [
4] used the director theory approach related to fluid dynamics for reduction of the nonlinear three-dimensional equations governing the axisymmetric unsteady motion of a non-Newtonian incompressible fluid to a one-dimensional system of ordinary differential equations depending on time and on a single spatial variable.
Unfortunately, the model of unsteady friction is not as well described as the model of steady friction, and investigation in this area is still ongoing [
5,
6,
7]. In contrast, the inclusion of second viscosity in the model instead of unsteady friction makes results more accurate and it has an advantage: second viscosity is associated with fluid matter, and it is possible to use it in the frequency domain.
The energy dissipation due to second viscosity occurs when the fluid is being compressed or when the fluid is expanding. Stokes formulated a hypothesis that second viscosity equals negative two thirds of the shear viscosity
; thus the fluid is supposed to be in thermodynamic equilibrium [
8].
It has already been proven that Stokes’ hypothesis is not valid for polyatomic gases and liquids [
9]. The author showed the influence of second viscosity on the absorption and dispersion of sound in fluid and discussed the frequency dependence of the second viscosity.
Examination of the theoretical model of liquid was performed in [
10], where authors noted the role of second viscosity in the spreading of wave fronts, dilatation and compression of fluid or attenuation of sound waves. Numerical determination of the bulk viscosity of water was also conducted in [
11,
12].
When we look for experimental data of second viscosity, we find out that they are very rare. It is very difficult to find any experimental data within the last 150 years. Regarding water, possibly the oldest experiments were performed by Karim [
13]. Foldyna published the dependence of second viscosity on pressure [
14,
15]. In addition, [
16] provided measured data for water, and [
17,
18] measured the temperature dependence of the second viscosity.
All published experiments were performed at high frequencies (on the order of MHz or GHz) in a narrow range.
A method of the second viscosity determination from the damping of pressure pulsations is described within this paper. The suggested procedure allows determining of the second viscosity at low frequencies.
2. Model Derivation
This chapter describes the derivation of a mathematical model of pulsating flow in a pipeline, when second viscosity is assumed. The influence of an unsteady velocity profile is considered as well. The solution is obtained in the frequency domain.
The pulsations can be simulated using a transfer matrix that describes system properties, which include the fluid and pipe. The derivation of the transfer matrix originates from the continuity equation and momentum equation for a one-dimensional flow, which can be assumed for the pipe.
2.1. Continuity Equation
The continuity equation for liquid can be written as follows:
where relation between density and pressure for barotropic fluid
is included [
19], which is a common practice for liquids. Integration over the liquid volume
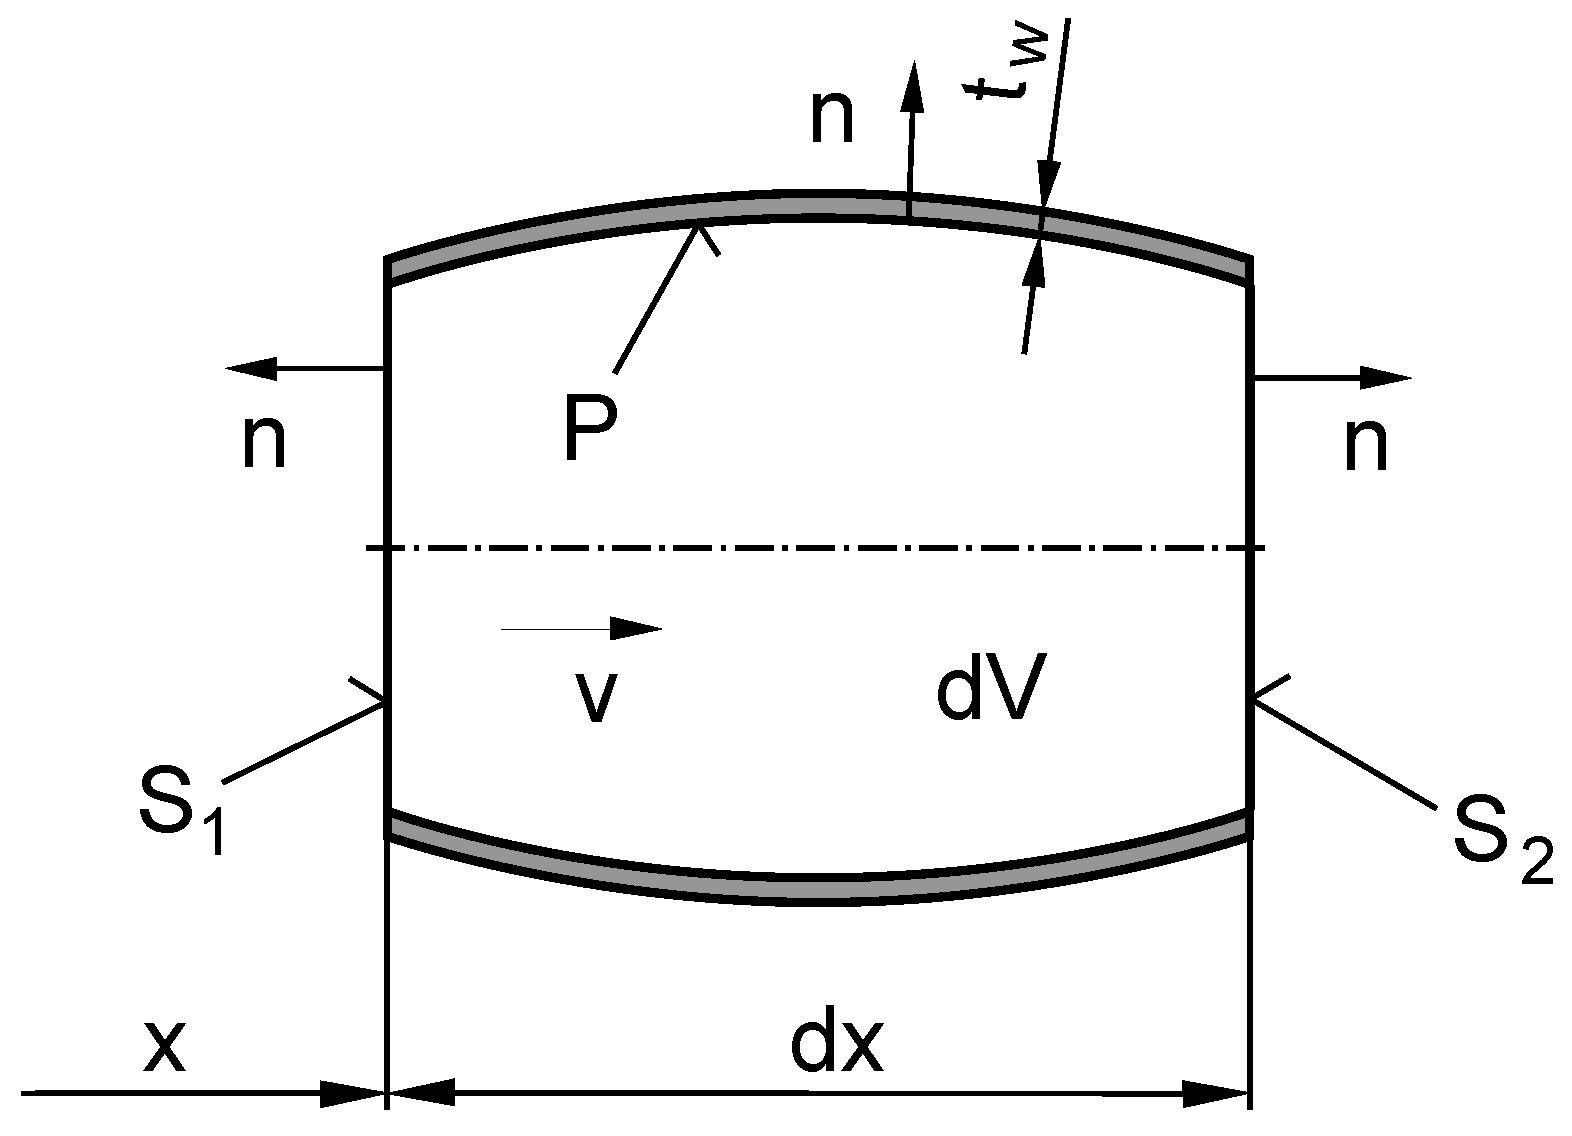
(see
Figure 1) yields:
Flow rates
and
are associated with the corresponding cross-sections
and
. Pressure
p is now the mean value over the entire volume
V of liquid at one time instant. Considering
, it is possible to write Equation (
2) in the form of Equation (
3), where the volume
:
Because the flow in a pipe is being solved, only the one dimensional case can be considered. Thus, the space coordinate x has only one dimension that is associated with the pipe axis. The integral over the pipe inner surface P equals zero when the pipe wall is rigid and leak-proof. However, usually, pipe elasticity allows pipe wall deformations and reduces the sound speed in the system.
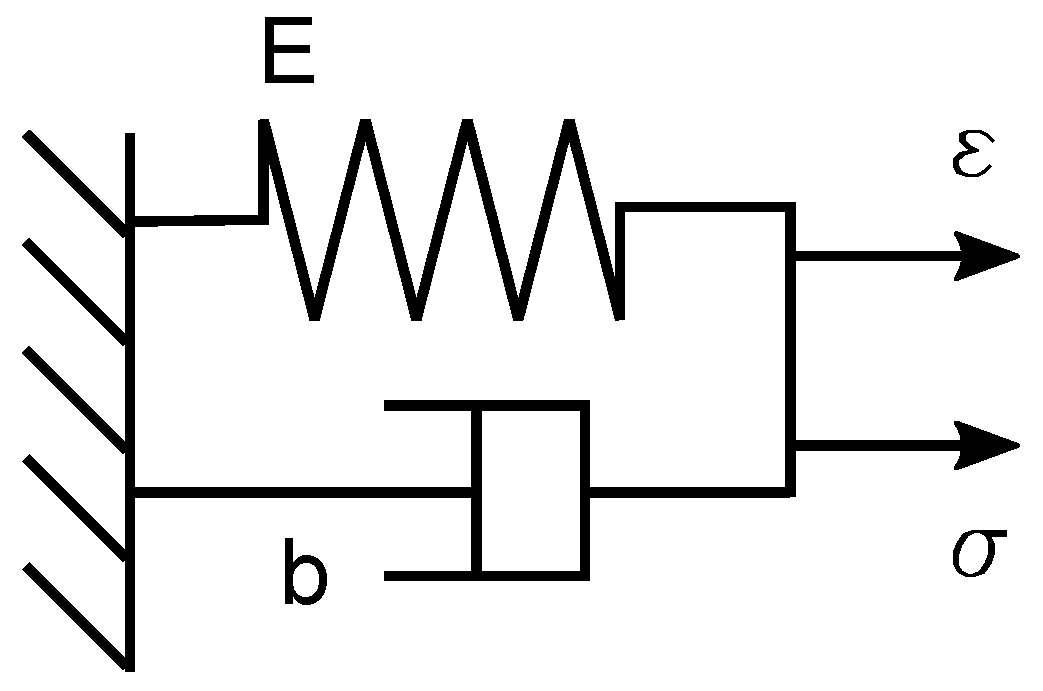
The behavior of the pipe wall can be described using the Kelvin–Voigt model; see
Figure 2.
Using force balance and deforming properties of the model, it is possible to derive:
where subscripts refer to the corresponding parts of the body in
Figure 2.
For a polymeric material pipe a more complex Kelvin–Voigt model must be used. For this case it is complicated to find the appropriate material constants. A detailed discussion of this problem is written in [
20,
21].
When the Laplace transform with zero initial conditions is applied to Equations (
4) to (
6), one can obtain:
where the expression in parenthesis is complex Young’s modulus
.
In the case of a thin wall, the stress and velocity of the wall can be computed according to the following equations:
and after the Laplace transform:
The combination of Equations (
7), (
10) and (
11) yields a relationship between the wall velocity and pressure in the pipe after the Laplace transform:
The wall velocity has a radial direction and is non-zero when the pressure changes (pipe is expanding or contracting).
When the Laplace transform is applied to Equation (
3), it is possible to obtain a continuity equation in the form of Equation (
13). Relationship (
12) is substituted for velocity in the integral over the surface
P.
When the complex speed of sound Equation (
14) is introduced, one obtains the final shape of the continuity equation for the liquid in a pipe Equation (
15).
2.2. Momentum Equation
The momentum equation expresses the equilibrium of forces that originate from inertia, pressure and viscosity. It is possible to write it as follows:
where the stress tensor is a function of shear viscosity and second viscosity:
Substituting Equation (
17) into Equation (
16) yields:
where the convective acceleration is neglected because the liquid velocity is much lower than the speed of sound. When Equation (
18) is integrated over the volume defined in
Figure 1, the momentum equation for the axial direction is obtained:
Here, the function
W represents energy loss due to an unsteady velocity profile. The function is well described in [
22,
23]. The unsteady velocity profile has a significant impact on energy loss in the case of viscous liquids (e.g., oil).
Applying the Laplace transform to Equation (
19) and using Equation (
15) yields the final shape of the momentum equation:
2.3. Transfer Matrix
Transfer matrices determine the transfer of the state vector from the coordinate
to any coordinate
x on the pipe axis. Equations (
15) and (
20) can be written in matrix form:
where:
J
and J
are Bessel functions. The coefficient
B includes the Laplace transform of the function
W:
Equation (
21) can be rearranged:
Now, the Laplace transform with respect to
x is applied to Equation (
26), and after rearranging and applying the inverse Laplace transform, Equation (
27) is obtained.
where
is the parameter of the Laplace transform with respect to
x. The transfer matrix
appears after computing the inverse matrix and executing the inverse Laplace transform in Equation (
27):
Thus, Equation (
27) can be written in the final form:
where
represents the state vector:
When the pressure and flow rate at the beginning of the pipe are known, it is possible to compute the pressure and flow rate in any place along the pipe using Equation (
29). All information about the pipe and liquid is included in the transfer matrix
.
2.4. Transfer Matrix of the Pipe
Oscillation of the fluid in the pipe is sufficiently described by Equation (
29) only for the case when the ends (flanges) of the pipe do not move in the axial direction. The experiment, which is described in the next section, does not fulfil this condition because the excitation is performed only via axial displacement of the flange. Thus, it is also necessary to derive the transfer matrix of the pipe. Generally, the procedure is the same as the abovementioned procedure for the fluid. The transfer matrix of the pipe includes the material properties and mass at both ends of the pipe. The mass represents flanges, valves and sensors because they influence the dynamic behavior of the pipe the most. The scheme is shown in
Figure 3.
The transfer equation between places 0 and 3, when there is no liquid in the pipe, is:
where the index refers to the corresponding place in
Figure 3. Matrices
and
are transfer matrices of the mass at the end of pipe and the pipe, respectively. Their derivation follows. The transfer matrix
comes from the equation of motion:
When the flange is ideally stiff, it is possible to consider the same displacement of both flange faces
. When the Laplace transform is applied on Equation (
32), the transfer matrix of the flange can be written in the form:
The same procedure can be applied on the flange indexed 2 and 3.
The transfer matrix of the pipe
comes from a longitudinal oscillation:
Equations (
4) to (
6) describing the Kelvin–Voigt model of the body can be implied into the Equation (
34). Then it is possible after the Laplace transform to write the Equation (
35) as:
where Equations (
36) and (
37) can be obtained from the stress
and the displacement
taken for the pipe beginning. Knowing that
and
. Speed of sound
in the pipe is a complex number:
The transfer matrix of the pipe comes from the combination of Equations (
35) and (
7):
where:
In this case, the variable
x means the length of the pipe. Boundary conditions
and
can be implied to Equation (
31), then it is possible to write:
When the determinant of the matrix in Equation (
41) equals zero, it is possible to find constants
E and
b for the measured eigenvalues
s.
2.5. Transfer Matrix of the Entire System
The transfer matrix, which is derived in
Section 2.3, allows computation of the fluid dynamics. The transfer matrix, which is derived in
Section 2.4, allows computation of the pipe dynamics (in the axial direction) but without fluid inside. Now, the last step is to convert these two matrices into one transfer matrix that describes the pipe + fluid system. Therefore, the following boundary conditions at the ends of the pipe are used: fluid velocity equals flange velocity, and force, which acts on the flange, equals the force that acts on the fluid.
After the Laplace transform:
Now, Equations (
29), (
31), (
44) and (
45) give:
where the matrix
originates from Equations (
44) and (
45):
When the eigenvalue from the experiment is substituted into the matrix in Equation (
46), it is possible to find fluid properties (speed of sound and second viscosity) from the zero determinant of this matrix.
3. Experiment
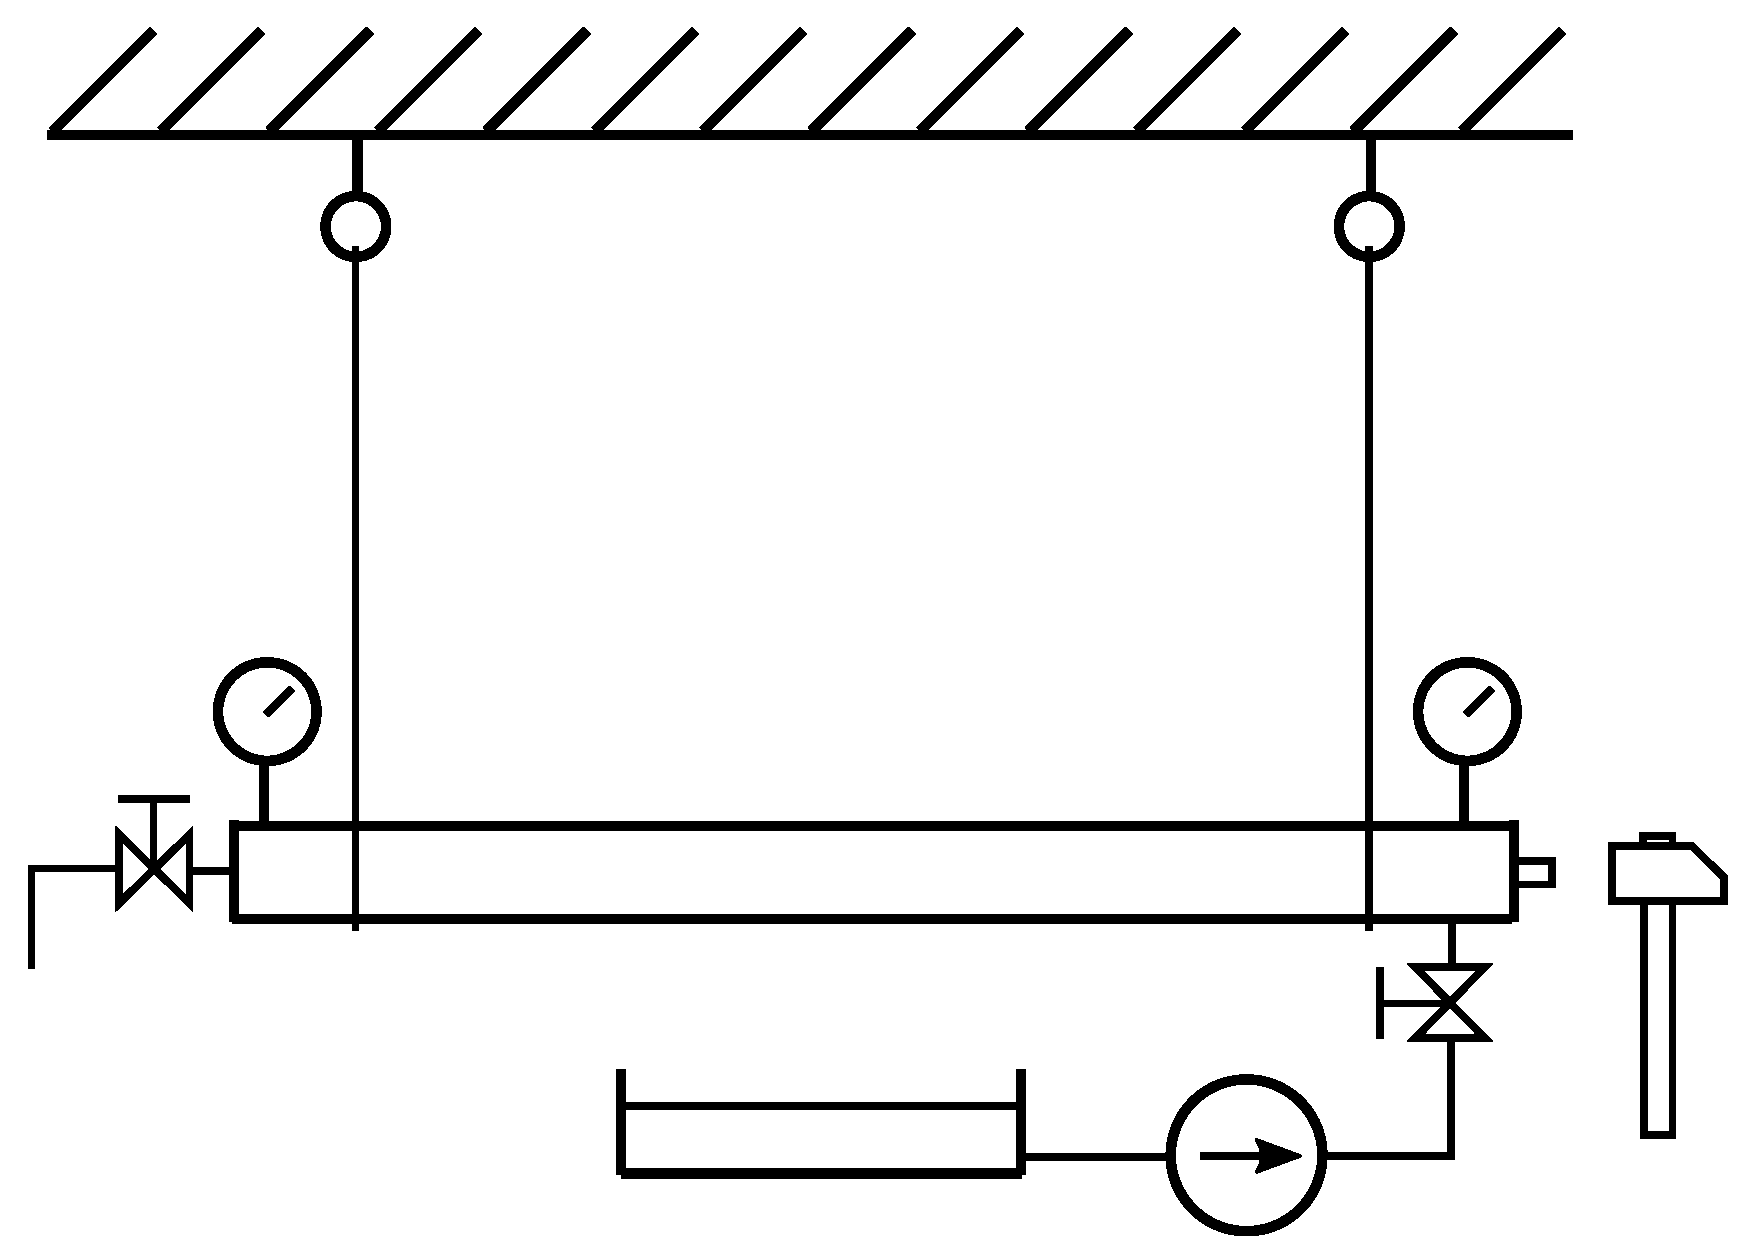
The theoretical analysis described in the previous chapter was used to evaluate the experimental data. The experiment was performed on a simple pipe and gives data that are necessary to calibrate the numerical model. The scheme of the experiment is shown in
Figure 4.
Steel pipes (0.8, 1 and 2 m long) were used. The length is important because it determines the eigenfrequency of the response. The pipe was hung on ropes to ensure that the system mounting had a very low eigenfrequency and did not affect the measurement.
The pipe was filled with water, which was delivered by a pump through a hose and a valve at one end. The air can exit through the valve at the other end. As soon as the pipe was full of water, the valves were shut, and the pipe was ready to be excited with a hammer. The static pressure in the pipe was kept at 1.9 MPa to suppress the influence of air because there was always some amount of air left.
Response to the excitement was measured using pressure transducers, which were mounted to the pipe wall at both ends. The sampling frequency of the transducers was set to the value of ten times higher than the expected frequency of the response (e.g., 26 kHz for the pipe 1 m long), and the uncertainty was 0.25% from the range, which was 10 MPa (one sensor) and 25 MPa (the other sensor). In addition there were accelerometers on the flanges for measuring the acceleration of both ends in the axial direction (range ± 500 m s).
The response was measured with water and without water. Thus, it was possible to determine four material constants, which are necessary for calibrating the numerical model.
First, the modulus of elasticity
E (see
Figure 2) and damping
b were determined from the measurement without water. The damping is supposed to follow a hyperbolic law:
where
is the damping ratio. The shear viscosity was 0.001 Pa s. Then, the speed of sound and the second coefficient of viscosity were determined from the measurement with water. In both cases, the coefficients were computed numerically to make the determinant of the appropriate matrix equal zero in Equations (
41) and (
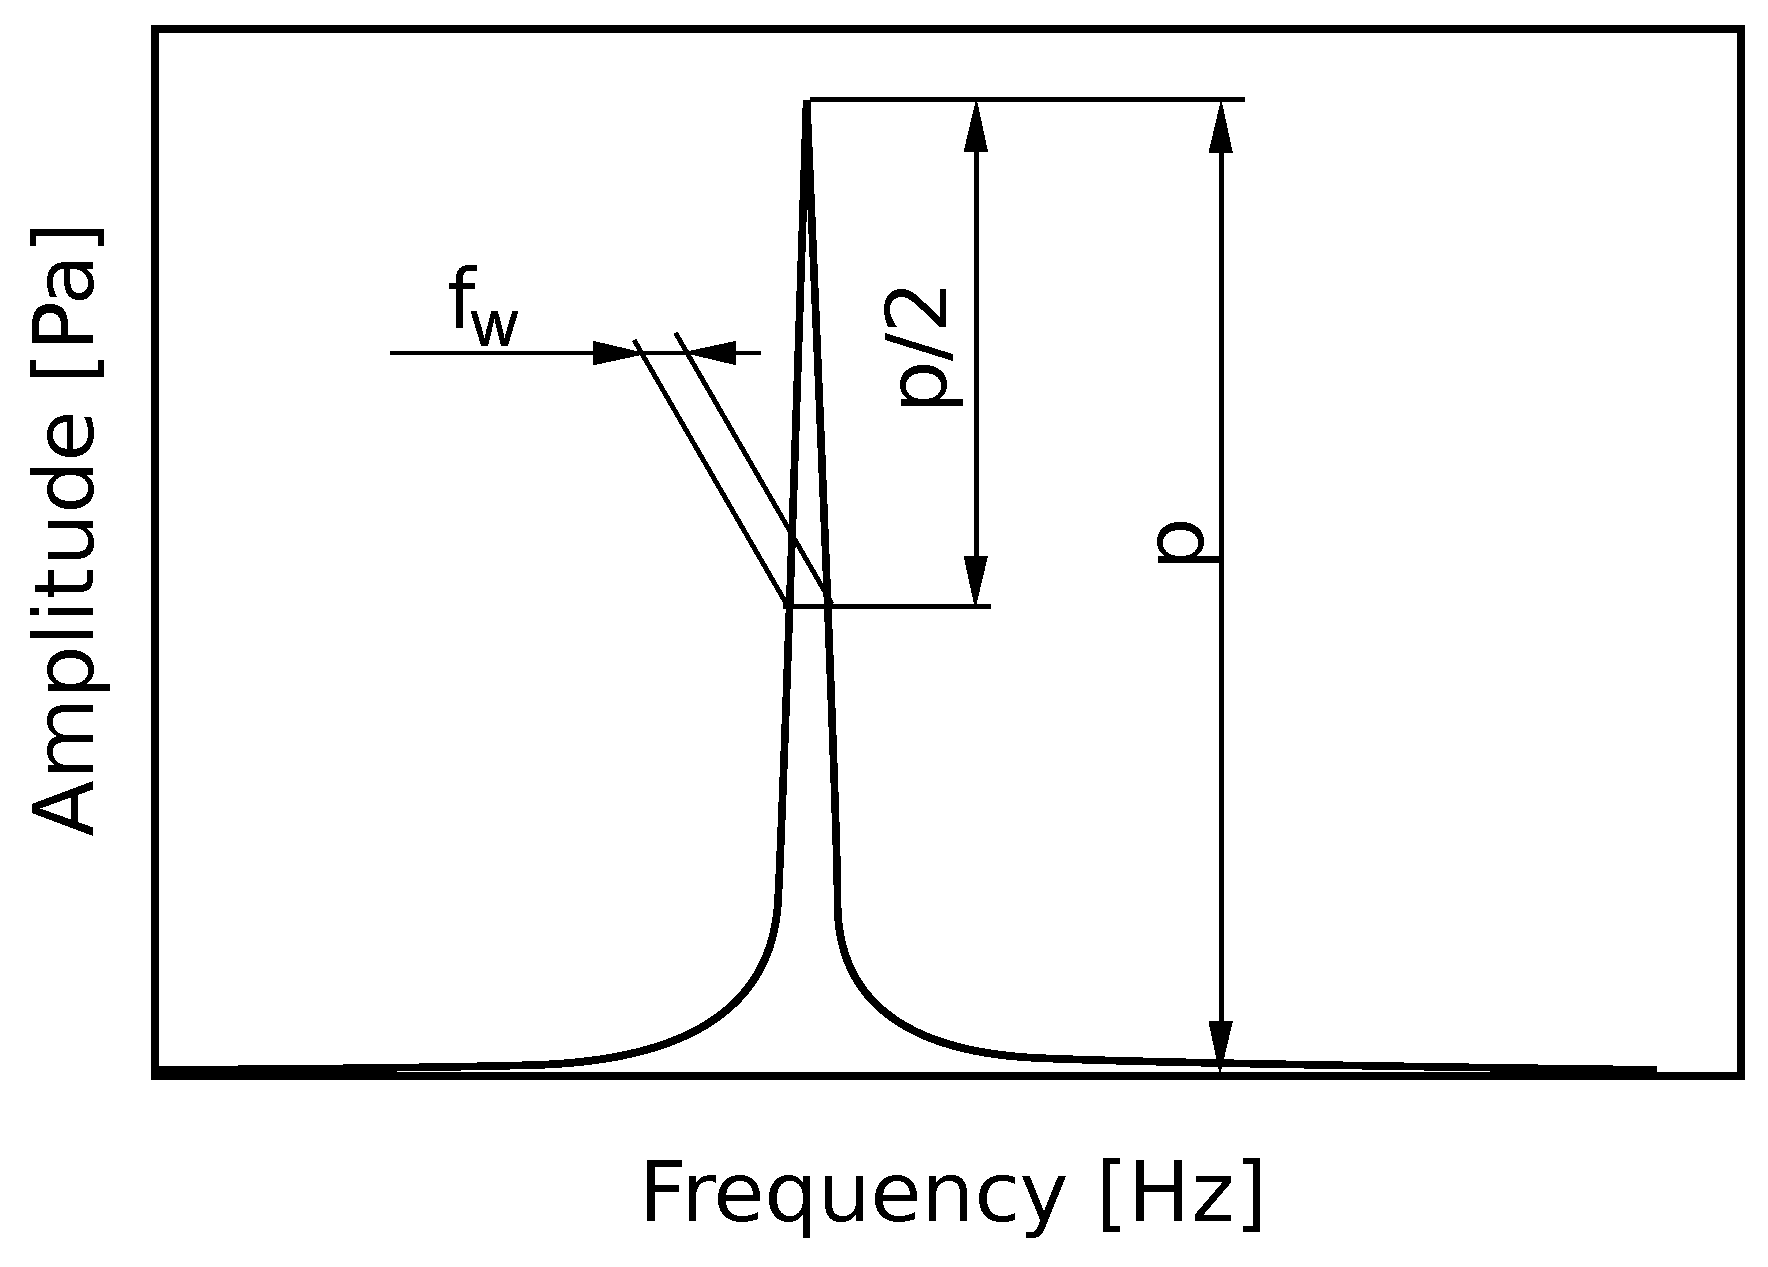
46). The eigenvalue of the system can be computed from a discrete Fourier transform of the measured response according to
Figure 5 and Equation (
49).
where the frequency
f corresponds to the first eigen frequency of the system.
Results
The experiment without water in the pipe was evaluated based on the records of accelerometers. The influence of air was neglected. Thus, it was possible to determine material properties of the pipes. The values of damping ratio
and modulus of elasticity
E (see
Figure 2) were used for evaluating experiments with water in the pipe. The results are listed in
Table 1.
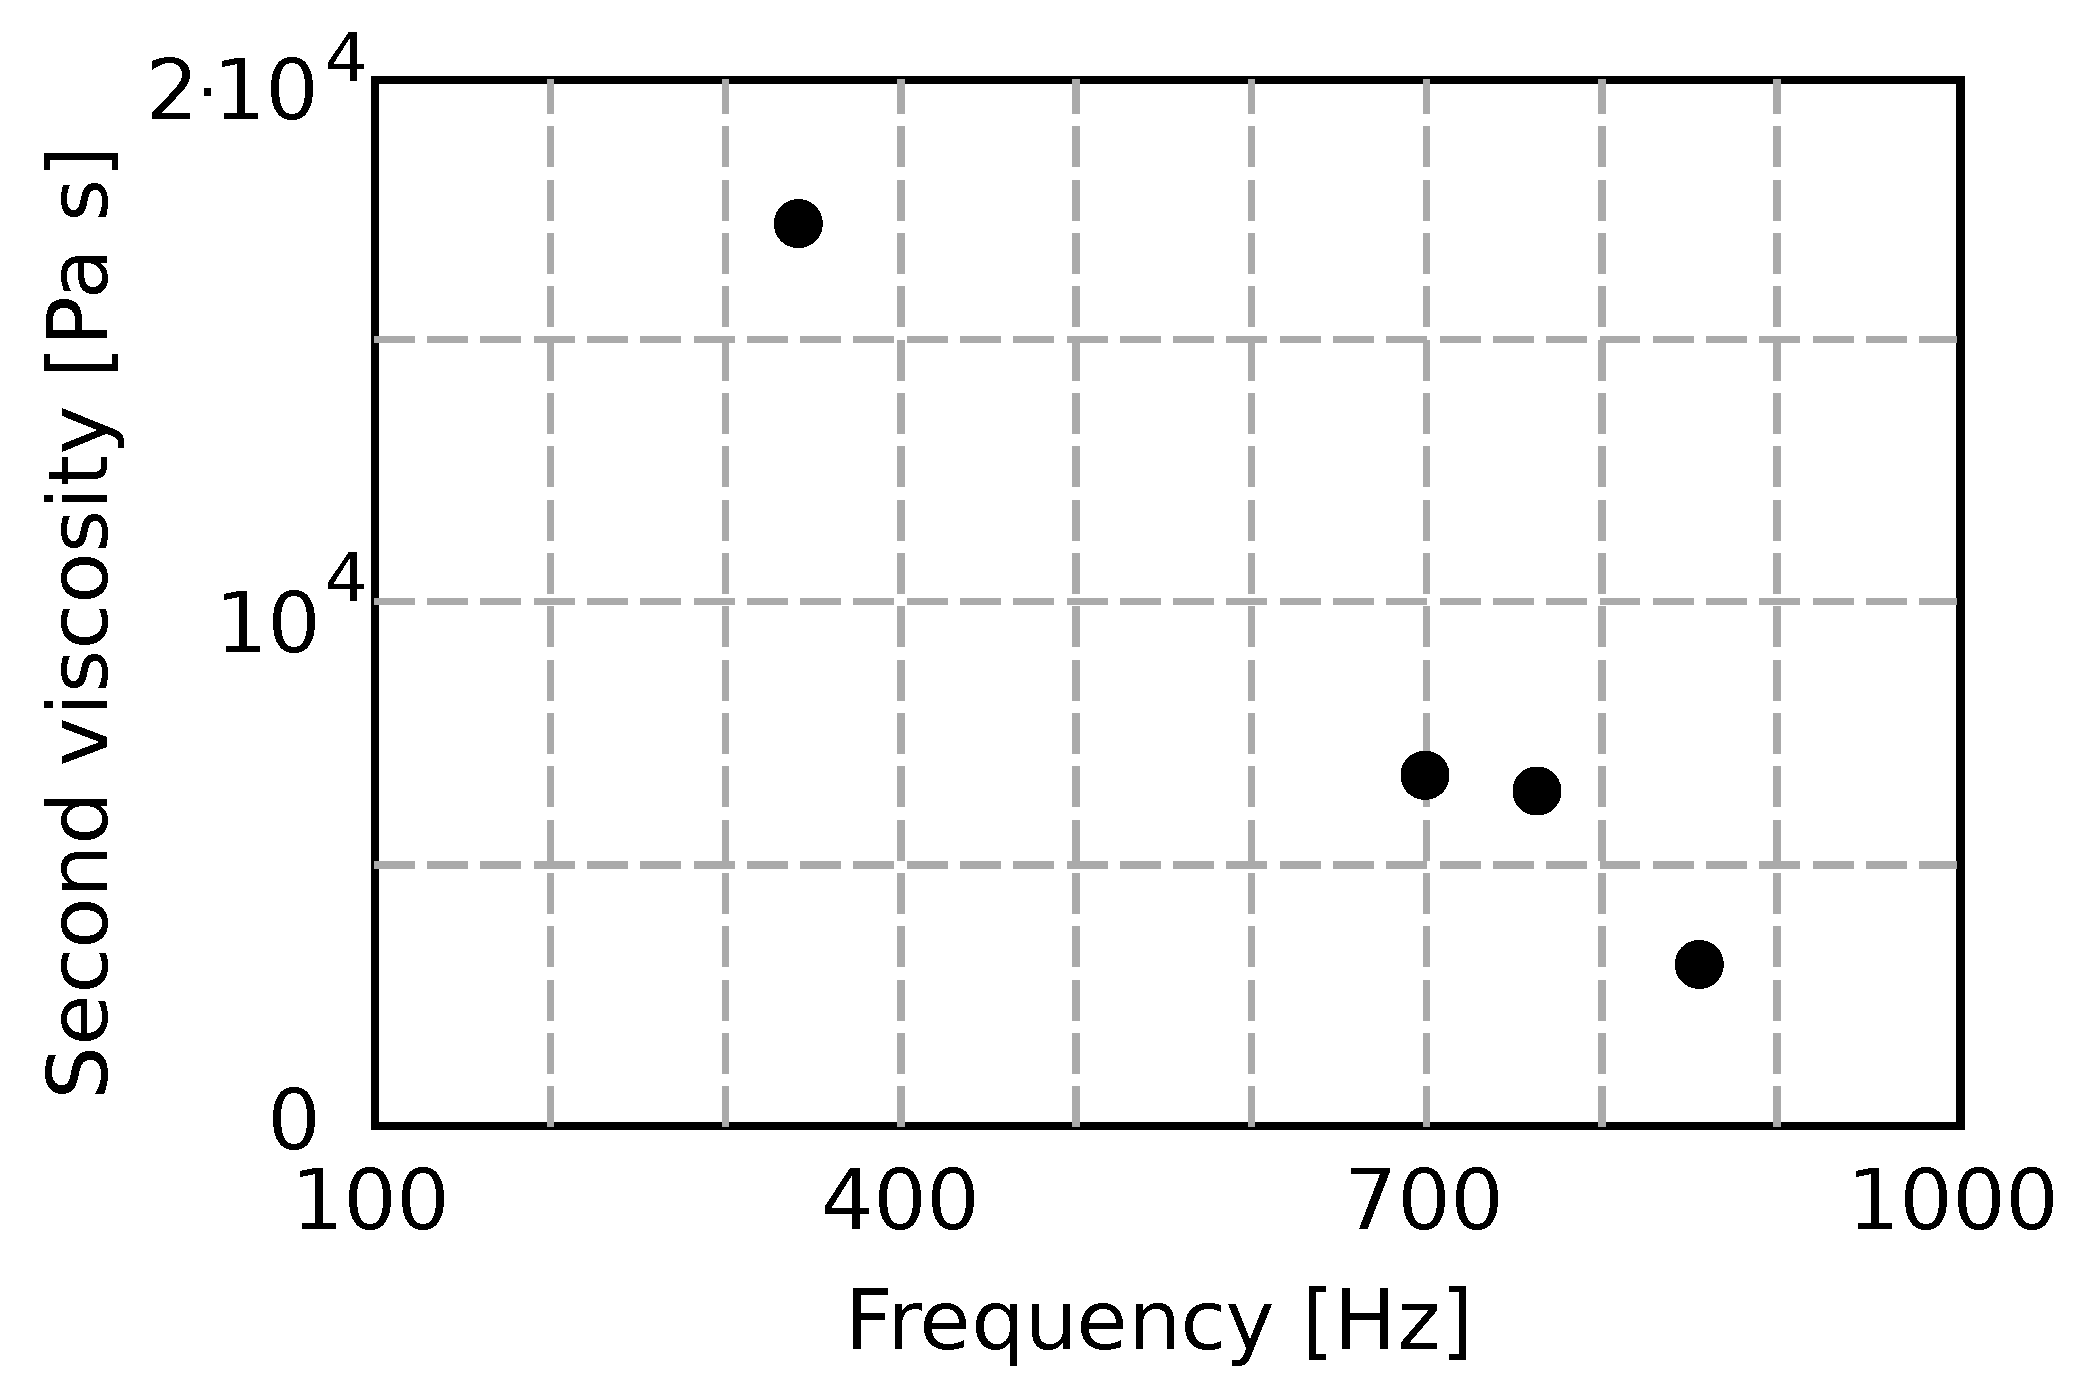
The speed of sound is different for different pipe dimensions (diameter and wall thickness) and does not depend on the frequency. The second viscosity is shown in
Figure 6 as a function of frequency.
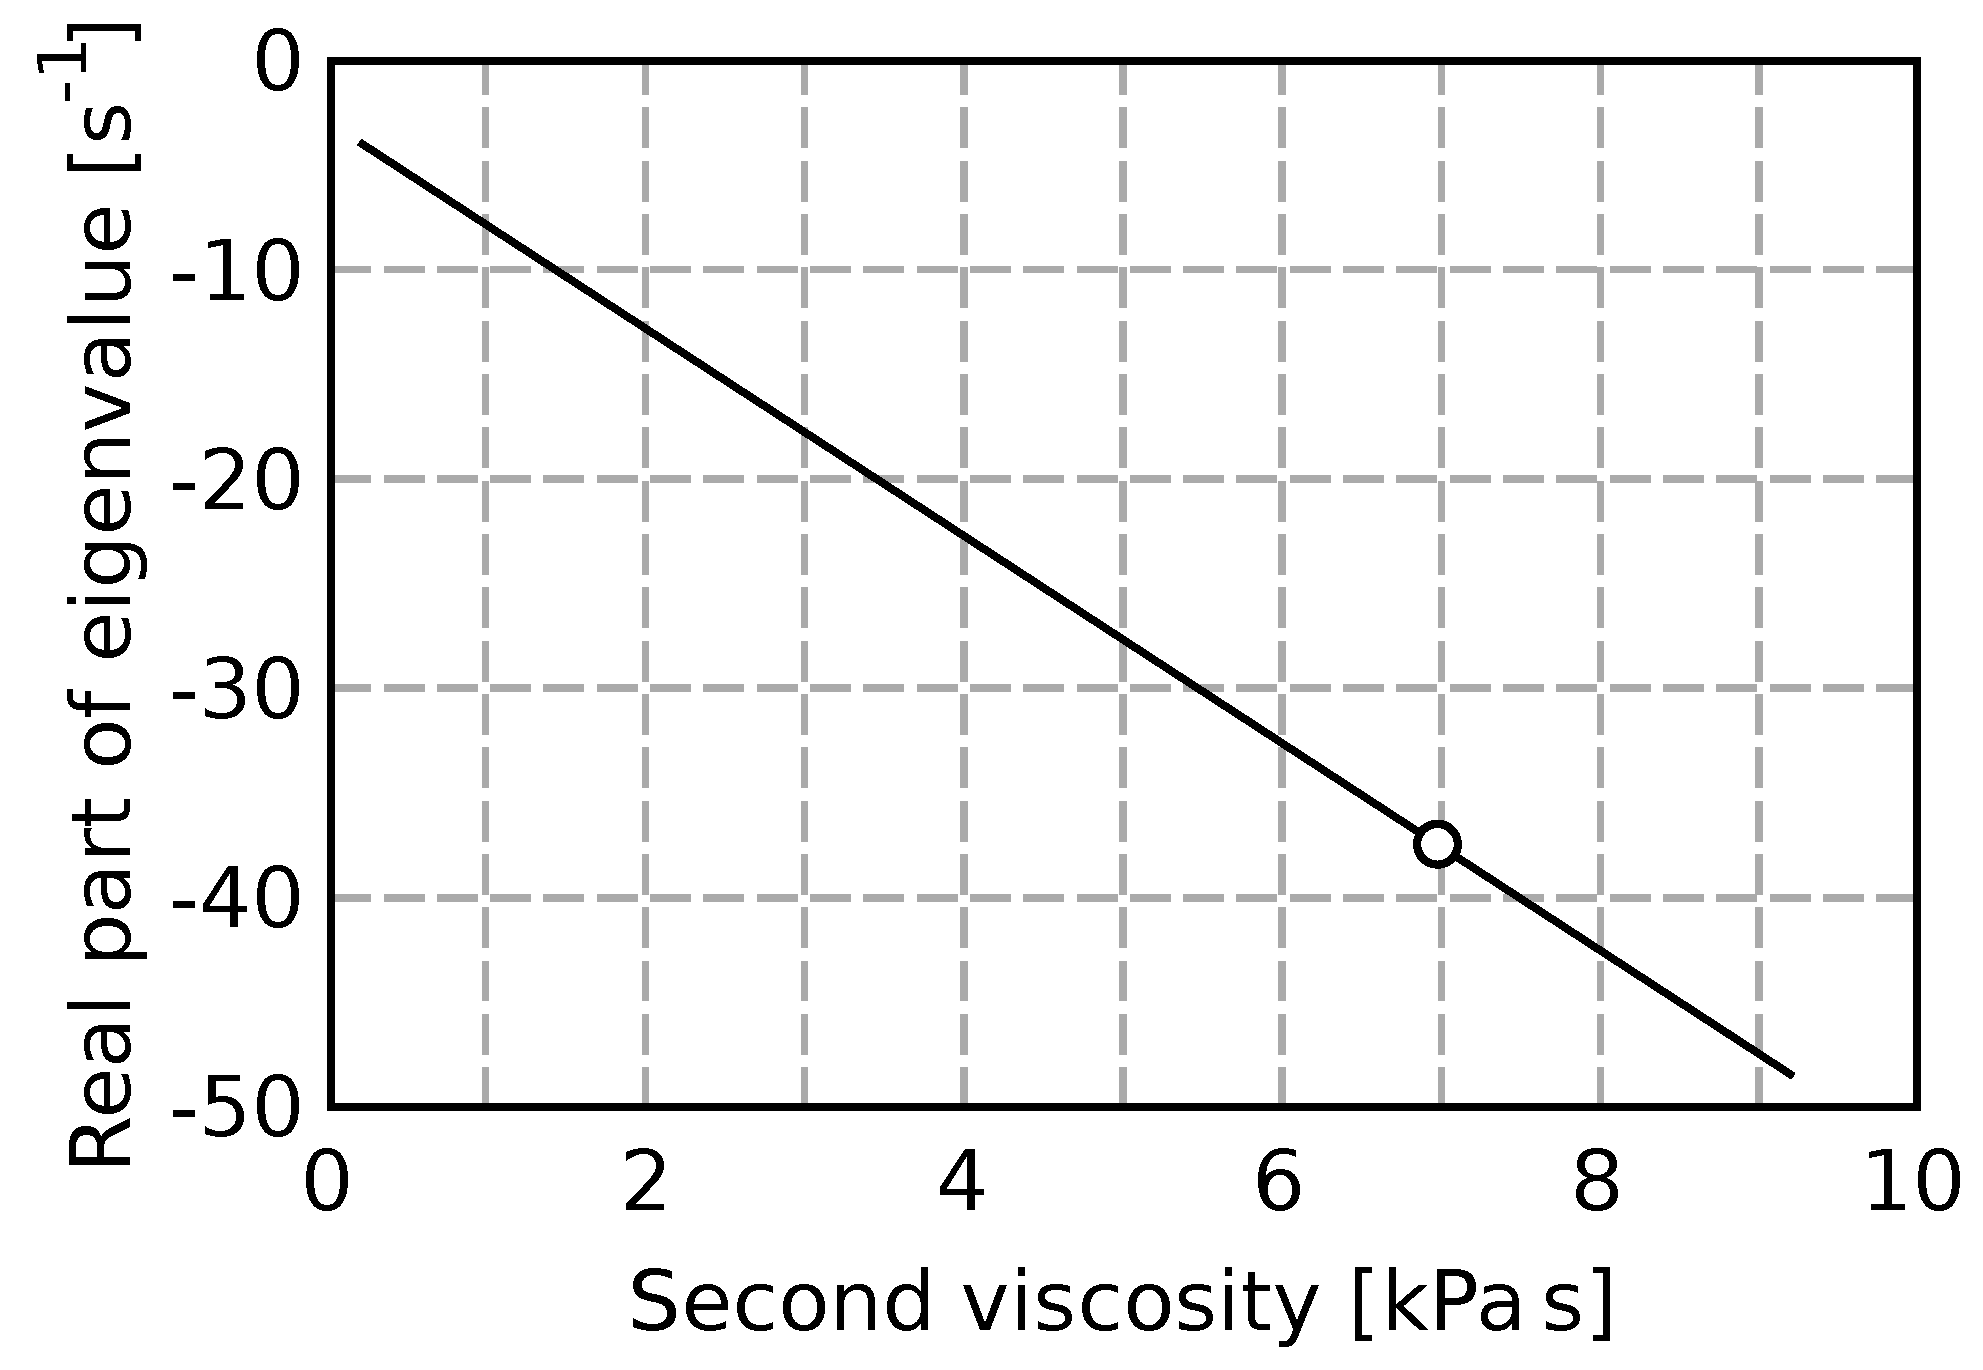
The
Figure 7 shows the model sensitivity on the value of the second viscosity. The real part of the system eigenvalue describes the damping of pressure pulsations. The circle marks a value corresponding to the experiment.
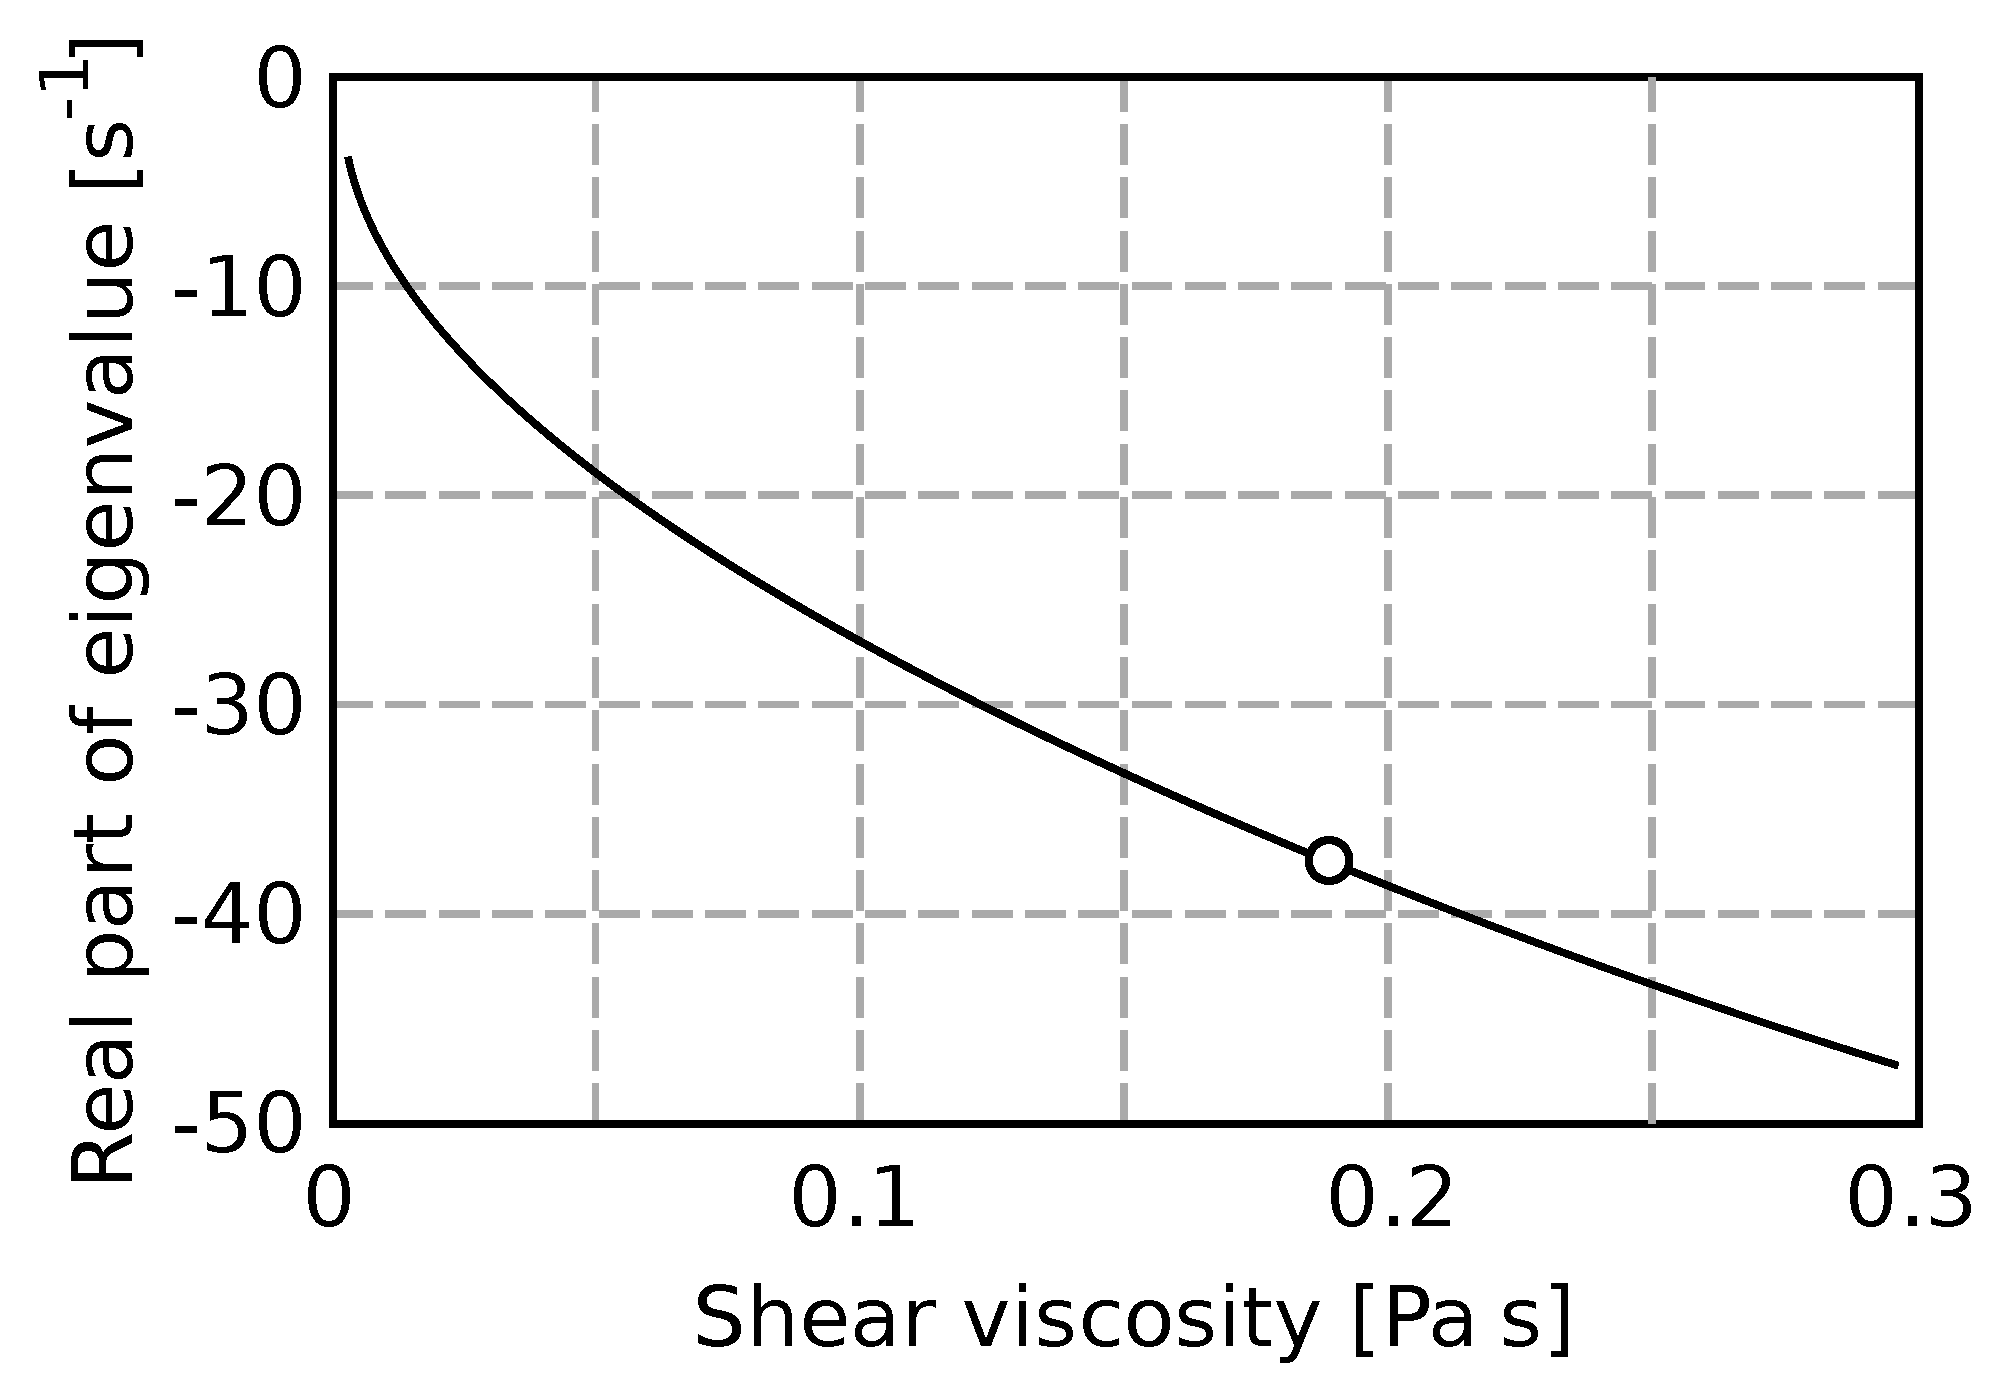
When the second viscosity is supposed to be zero, the shear viscosity has to be changed to obtain the correct eigenvalue.
Figure 8 shows the sensitivity on the shear viscosity. The damping corresponds to the experiment when the shear viscosity is 0.19 Pa s. This value is almost 200× greater than the physically correct number for water at given conditions (0.001 Pa s).
4. Conclusions
The mathematical model of pulsating flow in a pipe is derived in the paper. The obtained description in the frequency domain can be useful for stability analysis of a hydraulic system, typically, penstock of a hydro power plant. Beside the stability analysis it is possible to find the liquid and pipeline material properties by using measured eigenvalues of the system. Young’s modulus and damping of the pipe as well as second viscosity and speed of sound of water were evaluated. Obtained result comes from the simple experiment with the system that is excited by an external force (hammer or water hammer in the case of very large pipelines).
Despite the inclusion of elastic behavior of the pipe, it is still possible to extend the model by including the influence of the surrounding air, which is important in the case of measuring systems transporting gas. The reader should also take into account that the solution is obtained in the frequency domain, and it is not easy to use the results in the time domain.
Author Contributions
Conceptualization, V.H.; methodology, V.H.; validation, D.H. and S.F.; formal analysis, D.H. and S.F.; investigation, V.H.; resources, V.H.; data curation, V.H. and D.H.; writing—original draft preparation, D.H. and S.F.; funding acquisition, D.H.
Funding
This paper has been supported by the project “Computer Simulations for Effective Low-Emission Energy” funded as project No. CZ.02.1.01/0.0/0.0/16_026/0008392 by Operational Programme Research, Development and Education, Priority axis 1: Strengthening capacity for high-quality research and by Grant Agency of Czech Republic within the project GA101/17-19444S “Interaction of heterogeneous liquid with flexible wall”.
Conflicts of Interest
The authors declare no conflict of interest.
Nomenclature
| Symbol | Definition | Symbol | Defintion |
| a | speed of sound in the fluid (m s) | | parameter of the Laplace transform (m) |
| complex sound speed (m s) | S | pipe cross-section (m) |
| speed of sound in the pipe (m s) | | pipe wall cross-section (m) |
| b | damping (Pa s) | | eigenvalue of the system (s) |
| D | pipe diameter (m) | x | space coordinate (m) |
| E | Young’s modulus (Pa) | t | time (s) |
| complex Young’s modulus (Pa) | | pipe wall thickness (m) |
| f | frequency (Hz) | u | displacement (m) |
| F | force (N) | | state vector |
| width of the peak (Hz) | v, | velocity (m s) |
| identity matrix (-) | V | volume (m) |
| m | mass (kg) | W | memory function (-) |
| normal vector (m) | | deformation (-) |
| p | pressure (Pa) | | damping ratio (Pa) |
| P | area of pipe wall (m) | | shear (dynamic) viscosity (Pa s) |
| transfer matrix of fluid | | second viscosity (Pa s) |
| transfer matrix of mass | | stress tensor (Pa) |
| transfer matrix of pipe | | density (kg m) |
| Q | flow rate (m s | | stress (Pa) |
| s | parameter of the Laplace transform (s) | | time in convolution integral (s) |
| | | bar | variable after the Laplace transform |
References
- Daily, J.W.; Hankey, W.L.; Olive, R.W.; Jordaan, J.M. Resistance coefficients for accelerated and decelerated flows through smooth tubes and orifices. Trans. ASME 1956, 78, 1071–1077. [Google Scholar]
- Caulk, D.A.; Naghdi, P.M. Axisymmetric motion of a viscous fluid inside a slender surface of revolution. J. Appl. Mech. 1987, 54, 190–196. [Google Scholar] [CrossRef]
- Robertson, A.M.; Sequeira, A. A Director Theory Approach for Modelling Blood Flow in the Arterial System: An Alternative to Classical 1D Models. Math. Mod. Meth. Appl. Sci. 2005, 15, 871–906. [Google Scholar] [CrossRef]
- Carapau, F.; Correia, P. Numerical simulations of a third-grade fluid flow on a tube through a contraction. Eur. J. Mech. B-Fluid 2017, 65, 45–53. [Google Scholar] [CrossRef]
- Brunone, B.; Golia, U.M.; Greco, M. Effects of two-dimensionality on pipe transients modeling. J. Hydr. Eng. 1995, 121, 906–912. [Google Scholar] [CrossRef]
- Abreu, J.M.; Almeida, A.B. Wall shear stress and flow behavior under transient flow in a pipe. In Proceedings of the 9th Conference on Pressure Surge, Chester, UK, 24–26 March 2004; pp. 457–476. [Google Scholar]
- Pezzinga, G. Evaluation of unsteady flow resistances by quasi-2D or 1D models. J. Hydr. Eng. 2000, 126, 778–785. [Google Scholar] [CrossRef]
- Stokes, G.G. On the theories of internal friction of fluid in motion. Trans. Camb. Philos. Soc. 1845, 8, 287–305. [Google Scholar]
- Tisza, L. Supersonic absorption and Stokes’ viscosity relation. Phys. Rev. 1942, 61. [Google Scholar] [CrossRef]
- Meier, K.; Laesecke, A.; Kabelac, S. Transpor coefficients of the Lennard-Johes model fluid. III. Bulk viscosity. J. Chem. Phys. 2005, 122, 14513. [Google Scholar] [CrossRef] [PubMed]
- Fanourgakis, G.S.; Medina, J.S.; Prosmiti, F. Determining the bulk viscosity of rigid water models. J. Phys. Chem. A 2012, 116, 2564–2570. [Google Scholar] [CrossRef] [PubMed]
- Guo, G.J.; Zhang, Y.G. Equilibrium molecular dynamics calculation of the bulk viscosity of liquid water. Mol. Phys. 2001, 99, 283–289. [Google Scholar] [CrossRef]
- Karim, S.M. Second viscosity coefficient of liquid. J. Acoust. Soc. Am. 1953, 25, 997–1002. [Google Scholar] [CrossRef]
- Foldyna, J.; Sitek, L.; Habán, V. Acoustic wave propagation in high-pressure system. Ultrasonics 2006, 44, 1457–1460. [Google Scholar] [CrossRef] [PubMed]
- Foldyna, J.; Habán, V.; Pohylý, F.; Sitek, L. Transmition of acoustic waves. In Proceedings of the International Congress On Ultrasonics, Vienna, Austria, 9–12 April 2007. [Google Scholar]
- Dukhin, A.S.; Goetz, P.J. Bulk viscosity and compressibility measurement using acoustic spectroscopy. J. Chem. Phys. 2009, 130, 124519. [Google Scholar] [CrossRef] [PubMed]
- Holmes, M.J.; Parker, N.G.; Povey, M.J.W. Temperature dependence of bulk viscosity in water using acoustic spectroscopy. J. Phys. Conf. Ser. 2011, 269, 012011. [Google Scholar] [CrossRef]
- He, X.; Wei, H.; Shi, J.; Liu, J.; Li, S.; Chen, W.; Mo, X. Experimental measurement of bulk viscosity of water based on stimulated Brillouin scattering. Opt. Commun. 2012, 285, 4120–4124. [Google Scholar] [CrossRef]
- Streeter, V.L.; Wylie, E.B. Fluid Mechanics; Clark, B.J., Maisel, J.W., Eds.; McGraw-Hill, Inc.: New York, NY, USA, 1975. [Google Scholar]
- Keramat, A.; Tijsseling, A.S.; Hou, Q.; Ahmadi, A. Fluid-structure interaction with pipe-wall viscoelasticity during water hammer. J. Fluids Struct. 2012, 28, 434–455. [Google Scholar] [CrossRef]
- Weinerowska-Bords, K. Viscoelastic model of waterhammer in single pipeline—Problems and questions. Arch. Hydro-Eng. Environ. Mech. 2006, 53, 331–351. [Google Scholar]
- Zielke, W. Frequency-dependent friction in transient pipe flow. J. Basic Eng. 1968, 90, 109–115. [Google Scholar] [CrossRef]
- Zielke, W. Frequency Dependent Friction in Transient Pipe Flow; The University of Michigan: Ann Arbor, MI, USA, 1966. [Google Scholar]
© 2019 by the authors. Licensee MDPI, Basel, Switzerland. This article is an open access article distributed under the terms and conditions of the Creative Commons Attribution (CC BY) license (http://creativecommons.org/licenses/by/4.0/).
