Article

Ensemble Discrete Wavelet Transform and Gray-Level Co-Occurrence Matrix for Microcalcification Cluster Classification in Digital Mammography

1
I.R.C.C.S. Istituto Tumori “Giovanni Paolo II”, 70124 Bari, Italy
2
Dip. Interateneo di Fisica “M. Merlin”, Università degli Studi di Bari, 70125 Bari, Italy
3
INFN—Istituto Nazionale di Fisica Nucleare, Sezione di Bari, 70126 Bari, Italy
4
Dip. di Scienze Fisiche, della Terra e dell’Ambiente, Università degli Studi di Siena, 53100 Siena, Italy
5
Dip. di Economia e finanza, Università degli Studi di Bari, 70124 Bari, Italy
6
Dip. di Diagnostica per Immagini, Azienda Ospedaliera Universitaria Senese, 53100 Siena, Italy
7
Dip. di Scienze della Salute, Università degli Studi di Genova, 16132 Genova, Italy
*
Author to whom correspondence should be addressed.
These authors contributed equally to this work.
Appl. Sci. 2019, 9(24), 5388; https://doi.org/10.3390/app9245388
Submission received: 23 October 2019 / Revised: 28 November 2019 / Accepted: 4 December 2019 / Published: 9 December 2019
(This article belongs to the Special Issue Signal Processing and Machine Learning for Biomedical Data)

Abstract

:
The presence of clusters of microcalcifications is a primary sign of breast cancer. Their identification is still difficult today for radiologists, and the wrong evaluations involve unnecessary biopsies. In this paper, an automatic tool for characterizing and discriminating clusters of microcalcifications into benign/malignant in digital mammograms is proposed. A set of 104 digital mammograms including microcalcification clusters was randomly extracted from a public available database and manually labeled by our radiologists, obtaining 96 abnormal ROIs. For each so-identified ROI, a multi-scale image decomposition based on the Haar wavelet transform was performed. On the decomposition, a textural features extraction step was carried out both on each sub-image and on the corresponding gray-level co-occurrence matrix. Then, a random forest classifier was employed for classifying microcalcification clusters into benign and malignant. The study found that the most discriminant features extracted from the ROIs decomposition by Haar transform were variance and relative smoothness, whereas as regards the textural features calculated on the GLCMs corresponding to the Haar-decomposed ROI, it emerged that the relationship between the pixels of the sub-image in the diagonal direction had high discriminating power for the classification of microcalcification clusters into benign and malignant. The proposed method was evaluated in cross-validation and performed highly in the prediction of the benign/malignant ROIs, with a mean AUC value of 97.39 ± 0.01 % .

1. Introduction

Breast cancer is currently the second most common cause of cancer death among women worldwide, and early detection of breast lesions is the key to increase the chances of survival and reduce the death rate [1,2]. Although digital mammography is a clinically accepted imaging method for detecting breast cancer in its early stage, there are some difficulties when radiologists analyze mammograms to search for signs of cancer. In particular, Microcalcifications (MCs) are often a primary sign of breast cancer: they are quite tiny calcium deposits and can be distributed in various ways throughout the breast tissue. When MCs are extremely minute (sometimes, they do not exceed 0.1 mm) and occur in clusters, they often indicate the presence of tumor lesions. The identification and characterization of clustered microcalcifications is sometimes a difficult and imprecise process. As a result, missing lesion detection during the routine check or performing many unnecessary breast biopsies on benign microcalcification clusters may occur. Thus, in the screening phase, independent double reading of mammograms by two radiologists is one of the solutions to reduce the missed tumor rate [3]. However, this solution involves a high workload and cost and is time consuming. For these reasons, an automatic tool supporting the radiologist during the mammographic interpretation of such lesions might produce more benefits for the health system with more accurate diagnosis and for the clinics with a lesser radiologist time requirement [4].
Computer technologies and mathematical models can allow increasing the detection rate, and consequently, they can effectively reduce the mortality rate caused by breast cancer [5,6].
The decision support system known as Computer-Aided Detection/Diagnosis (CAD) may offer radiologists reliable support to detect abnormalities in mammographic images [7,8,9]. Indeed, the detection of breast cancer with digital mammography improves when the radiologists can use an artificial intelligence system as the supporting diagnostic tool, without requiring additional reading time [10,11,12].
Although various models of CAD systems for breast diseases have been developed in the past two decades, reaching high performances for specific abnormalities, the automatic and accurate classification of microcalcification clusters in benign/malignant lesion is still difficult due to their nature. In fact, while the properties of normal tissue are quite different from abnormal ones, often benign and malignant ROIs may show overlapping characteristics. Some works showed this difficulty in their analysis: they achieved excellent results in terms of the classification of normal tissue and abnormal ROIs, while they were not able to provide an equally good accuracy for the benign and malignant discrimination problem [13,14]. Furthermore, our previous work on the diagnosis of MC clusters underlined this difference [15]: while the classification of normal and abnormal clusters reached an accuracy greater than 98 % , the distinction between benign and malignant MCs required further study, focusing on the extraction of features useful for this purpose.
During the last two decades, texture analysis by using a set of local statistical properties of pixel intensity proved to be a useful technique to detect and classify lesions in digital mammograms. The benefit of such an approach results in being more effective when the image is analyzed at different scales: this technique may be performed by decomposing each image into different frequency sub-bands by means of a wavelet transform and calculating first and second order texture features. This is confirmed by the several multi-scale texture analysis approaches recently proposed. The work presented in [16] analyzed a set of features extracted by using wavelet functions based on dual tree complex transforms in order to capture the correlation between different wavelet coefficients and their statistical dependencies.
Furthermore, the texture analysis can also take place by considering the spatial relationship between pixels with different gray levels using the co-occurrence matrices [3,17,18] on original images. It is a solid method based on the regular changes of gray levels between two neighboring pixels and how these changes are statistically and spatially correlated.
Most of the state-of-the-art works use these features together with others of different kinds, such as shape features [3,17,18,19], which are often operator dependent because they require the intervention of the radiologist to segment the lesion manually or define appropriate descriptors.
In previous works, we developed detection and classification models of the microcalcification clusters on Full-Field Digital Mammograms (FFDMs) [15,20] as support tools for experts radiologists; indeed, they provided the automated ROIs’ segmentation and characterization into normal/abnormal with high performing results. In this work, we propose a texture analysis approach based on a multi-scale decomposition of the ROIs with the aim of characterizing them in benign/malignant tissue. In particular, to make the lesion classification more objective and operator independent, once the radiologist has identified the Regions Of Interest (ROIs), the characteristic features are extracted in an automated manner.
The process is a multi-phase approach composed of a feature extraction step, performed by texture analysis methods, a features selection step, and a breast region classification in order to categorize clusters of MCs in digital mammograms. Specifically, as a first step, for each ROI, a multi-scale decomposition based on the Haar wavelet transform [21,22] is obtained. On such a decomposition, a set of well known statistical features and a number of attributes able to describe the image texture using the Gray-Level Co-occurrence Matrix (GLCM) [23] are extracted. Successively, a feature selection technique is exploited, carried out with embedded methods allowing an optimization between the interaction of the selected features and the classification algorithm used. Finally, a random forest classifier is trained on a subset of features selected by means of an embedded method with the aim of labeling the clustered microcalcifications in benign or malignant ones. The model performance is tested in cross-validation and evaluated in terms of accuracy and sensitivity; then it is compared with respect to the state-of-the-art.
Differently from the approaches shown in literature and developed for film scanned/digitized mammograms, the proposed approach was developed and evaluated on FFDMs, since digital images have a higher quality than the film scanned ones. In this way, a breast CAD could be implemented on images obtained from digital devices of various cancer institutes preserving a functional compatibility for future research activities. In particular, digital mammograms randomly selected from the public database Breast Cancer Digital Repository (http://bcdr.ceta-ciemat.es) (BCDR) were exploited.

2. Materials And Methods

2.1. Experimental Data

The data used in our analysis consisted of a set of full field digital mammograms extracted from the open access BCDR [24].
Specifically, 104 digital mammograms containing microcalcifications were randomly downloaded from BCDR-DM, the Full Field Digital Mammography based Repository of BCDR. Although the BCDR database provides all the images along with information about the diseases affected by each patient, only the main lesions, often different from the microcalcifications, were highlighted. For this reason, a double blind reading by two radiologists of our institute dedicated to senologic diagnostics was manually performed in order to identify and then classify ROIs containing microcalcification clusters only. Then, as a result of the comparison between the readings of the two radiologists, the ROIs for which both radiologists agreed were considered. In so doing, 56 benign and 40 malignant ROIs with different sizes depending on the extension of each cluster were obtained (see Figure 1 for some examples of ROIs containing microcalcification clusters).

2.2. Texture Analysis

Texture is a feature that can be used to segment an image into regions of interest and classify them [25]. Theoretically, it can be seen as composed of sub-patterns with particular descriptors, and assuming that such descriptors are uniform within the regions with the same texture, it can be helpful to identify a number of features able to discriminate different textures. In the literature, textural analysis is generally based on local statistical measures computed on the pixels’ gray levels of the image. In accordance with this interpretation, in this work, we extracted and analyzed a set of statistical features (1) on a wavelet decomposition of the original ROI and (2) on the relatively calculated GLCMs, on which a classifier was trained with the aim of performing a texture analysis process able to differentiate benign microcalcifications lesions form malignant ones. Specifically, we exploited a two level Haar wavelet decomposition of the ROI containing the lesion; successively, on such resulting images and on the relative calculated GLCM, a set of statistical features was extrapolated as in the following and is depicted in the schema reported in Figure 2. Finally, a classification model was embedded to learn a model able to discriminate benign from malignant tissue and to provide useful information on features’ importance in such a process.

2.2.1. Multi-Scale Wavelet Decomposition

The first step of the proposed work was mainly based on a multi-scale wavelet analysis, an appropriate technique for detection and classification of microcalcifications. Indeed, in digital mammograms, the microcalcifications appear brighter than the neighboring tissue, and represent one of the main high frequency components of the image spectrum. Consequently, in order to catch this signal, the wavelet transform can be used to decompose the original image into different frequency sub-bands. In particular, the Haar wavelet decomposition rescales the high frequency sub-band and reconstructs the image using such a scaled high frequency sub-band [21,22].
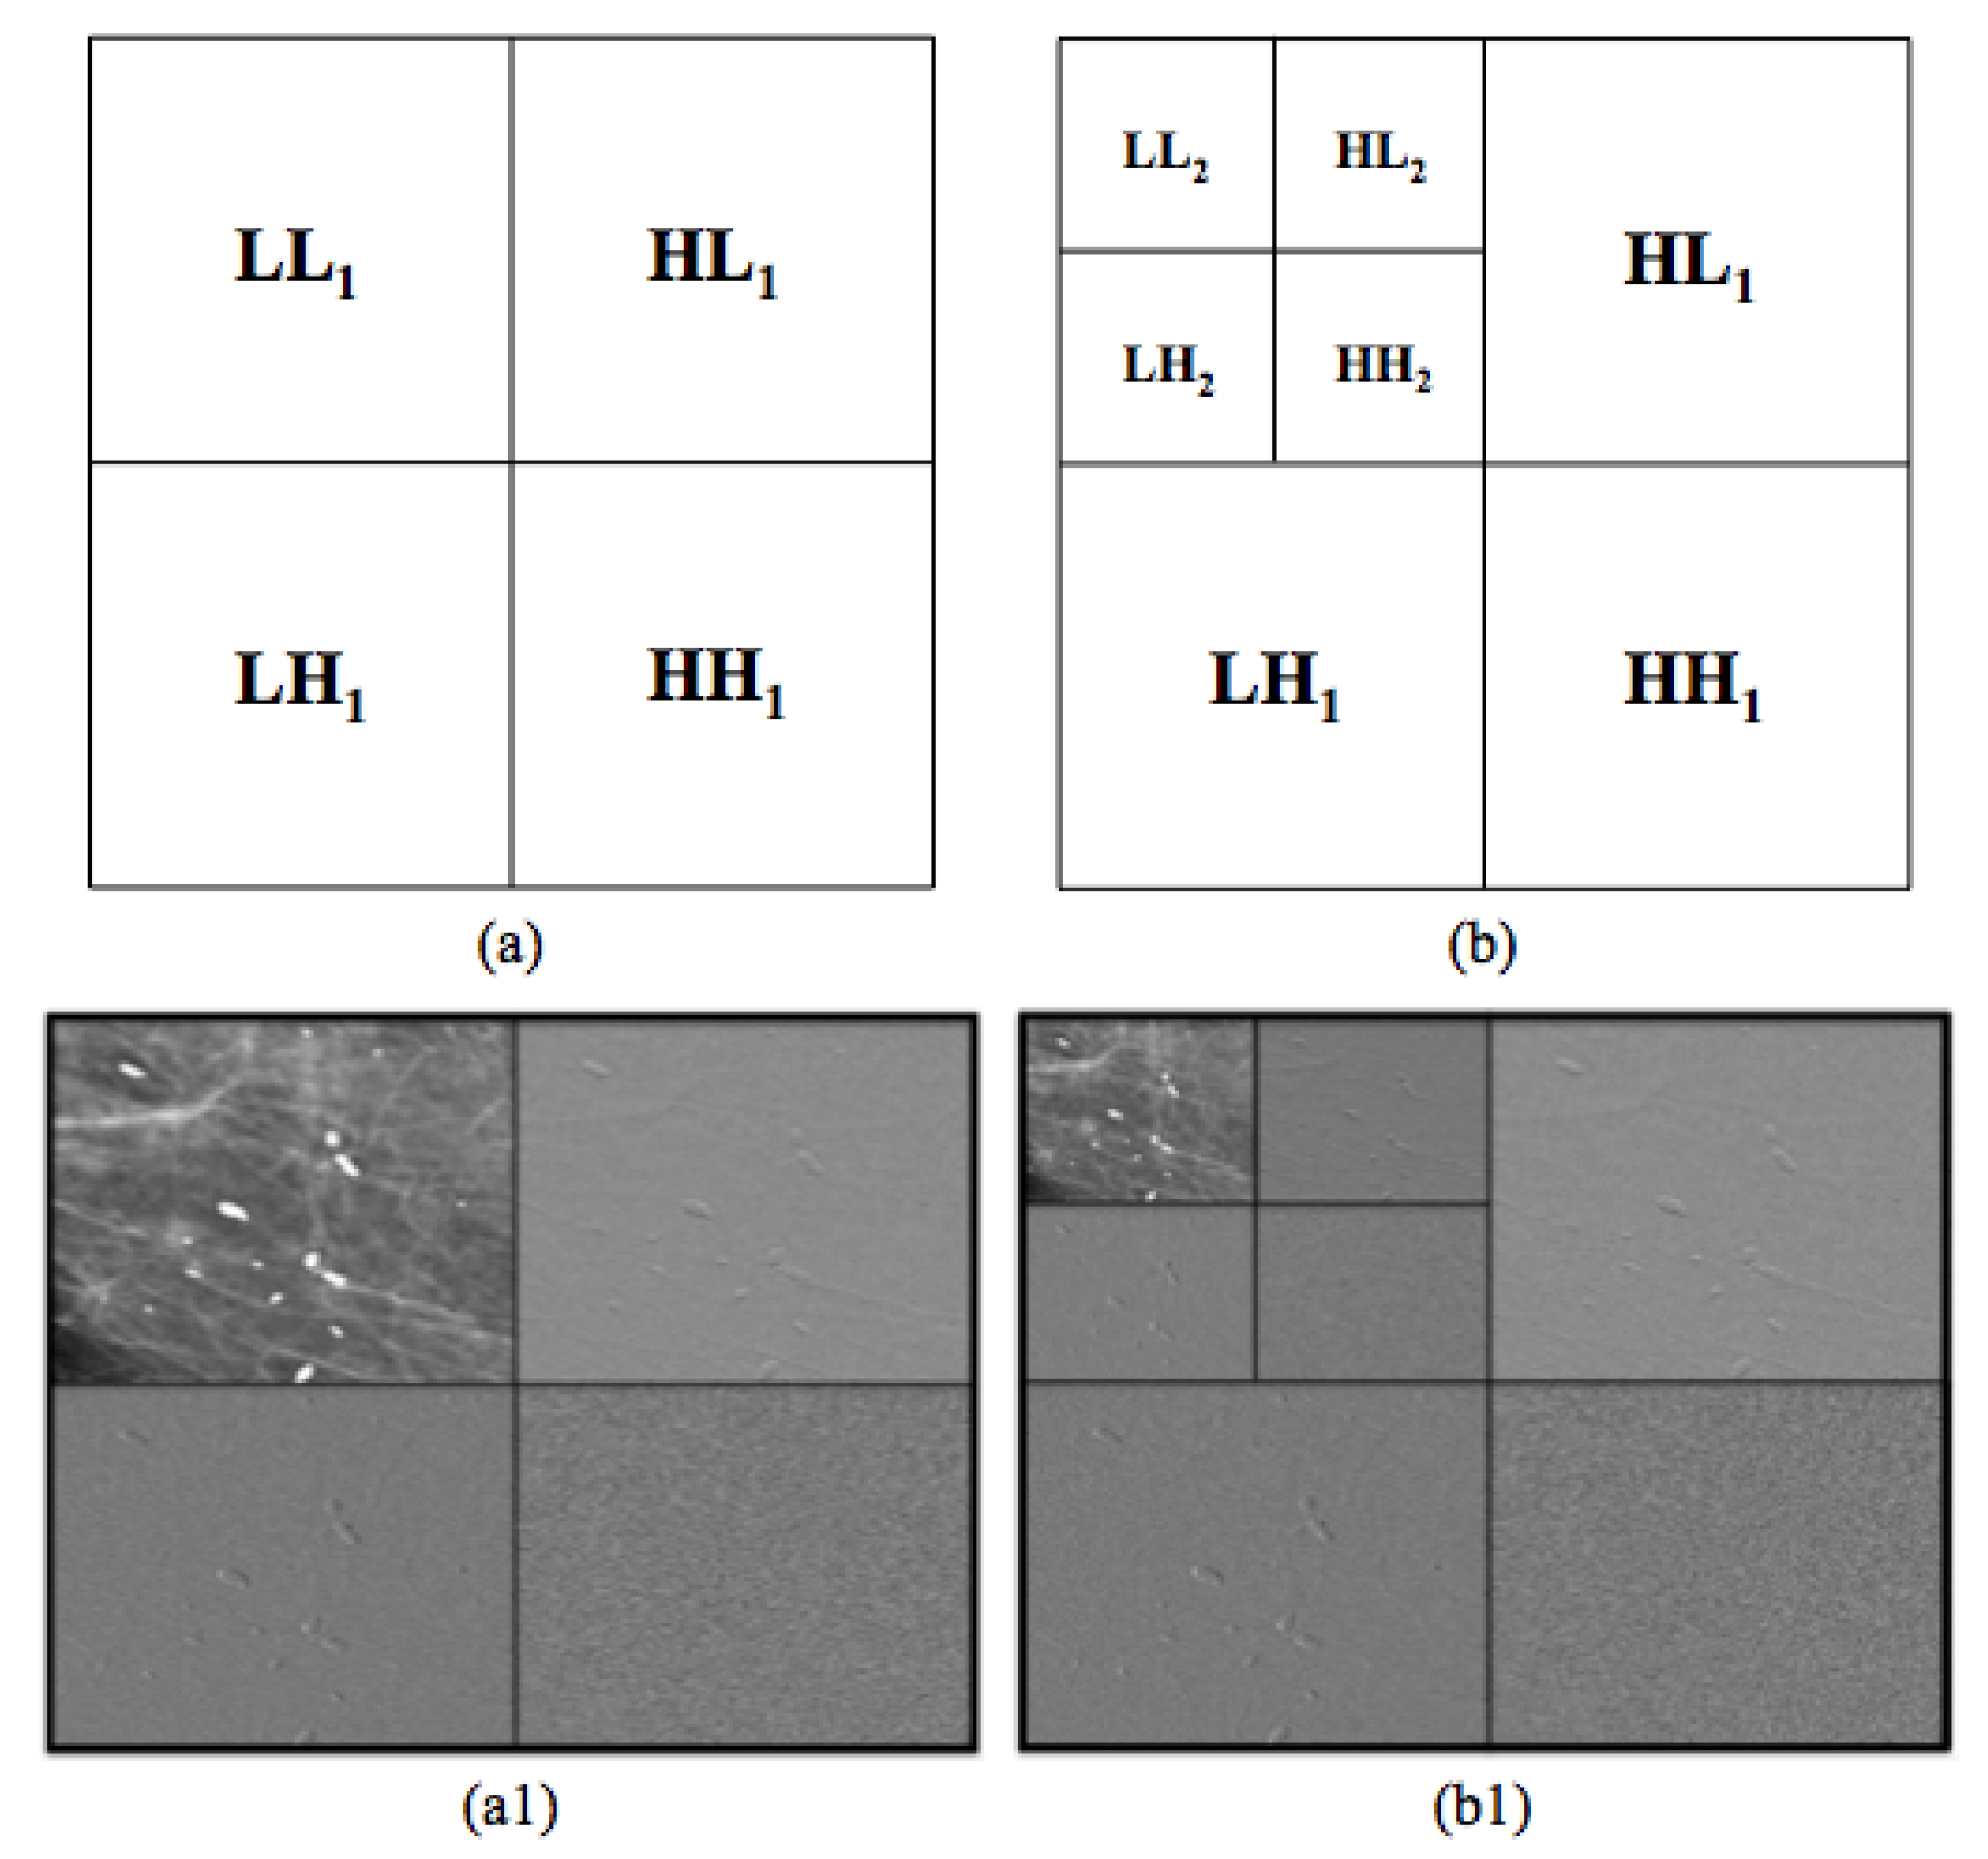
In the 2D Haar wavelet decomposition of the image, the original image is first high-pass filtered, yielding the three detailed coefficients’ sub-images (Figure 3a–a1; top right: horizontal, bottom left: vertical, and bottom right: diagonal), then low-pass filtered and down-scaled, yielding an approximation coefficient sub-image (Figure 3a–a1, top left). To compute the successive level of decomposition, the process was iterated on the approximation coefficient sub-image (Figure 3b–b1, top left). All of these coefficients describe the local geometry of the image in terms of scale and orientation [22,26], allowing suppressing the sub-band of the Haar decomposed image that carries the lowest frequencies and contains smooth (background) information, before the reconstruction of the image [26].
In particular, for each image, the 2D Haar transform at two levels of decomposition was performed, obtaining eight sub-images ( L L 1 , H L 1 , L H 1 , H H 1 , L L 2 , H L 2 , L H 2 , H H 2 ), as shown in Figure 3b–b1. As for the textural features derived from such a decomposition, for each of the sub-images were obtained the computed mean, variance, skewness, kurtosis, entropy, and relative smoothness. The second order moment of the mean, also known as variance, describes the visual roughness of the image, while the third order and fourth order moment, i.e., skewness and kurtosis, respectively, reflect the asymmetry and the uniformity of the histogram of the image. If K denotes the gray scale, μ the gray average, and h ( k ) , k = 0 ,   1 ,   2 ,   ,   K 1 , the histogram of each sub-image, they are defined as follows:
V a r i a n c e = 1 N k = 0 K 1 ( k μ ) 2 h ( k )
S k e w n e s s = 1 N k = 0 K 1 ( k μ ) 3 h ( k )
K u r t o s i s = 1 N k = 0 K 1 ( k μ ) 4 h ( k )
E n t r o p y = 1 N k = 0 K 1 h ( k ) log [ h ( k ) ]
R e l a t i v e S m o o t h n e s s = 1 1 1 + m 2
This way results in a set of 48 statistical features (in the following HAAR SFset) for each ROI.

2.2.2. Gray-Level Co-Occurrence Matrix

A further step towards the texture analysis was carried out by considering the spatial relationship of pixels in the ROIs by using the GLCM method [23], a widely used technique to grasp the textural patterns from the gray-level spatial dependences present in the image [25,27].
After the GLCMs’ generation, several statistical parameters, providing useful information about the texture of an image, could be derived from them by using different formulas. Specifically, in our study, for each image obtained from the first level of the Haar decomposition ( H L 1 , L H 1 , and H H 1 ), we considered an offset D = 2 along the θ 0 ° direction, obtaining two GLCMs, taking into account the relationship between the pixels from right to left (in the following GLCM dir1) and then from left to right (in the following GLCM dir2). Supposing that each GLCM is defined as a matrix G i j ; statistical measures are computed as follows:
E n e r g y = i = 0 K 1 j = 0 K 1 G i j 2
E n t r o p y = i = 0 K 1 j = 0 K 1 G i j log G i j
C o r r e l a t i o n = i = 0 K 1 j = 0 K 1 ( i j ) G i j μ x μ y σ x σ y
H o m o g e n e i t y = i = 0 K 1 j = 0 K 1 G i j 1 + ( i j ) 2
S u m A v e r a g e = k = 0 2 K 2 k G x + y ( k )
S u m E n t r o p y = k = 0 2 K 2 G x + y ( k ) log [ G x + y ( k ) ]
D i f f e r e n c e E n t r o p y = k = 0 K 1 G x y ( k ) log [ G x y ( k ) ]
S u m S q u a r e s = i = 0 K 1 j = 0 K 1 ( 1 μ ) 2 G i j
I n v e r s e D i f f e r e n c e = i = 0 K 1 j = 0 K 1 G i j 1 + | i j | 2 K 2
D i s s i m i l a r i t y = i = 0 K 1 j = 0 K 1 | i j | G i j
A u t o c o r r e l a t i o n = i = 0 K 1 j = 0 K 1 i j G i j
Thus as result, a set of 22 (11 for each of the two directions D) statistical features were obtained for H L 1 , L H 1 , and H H 1 Haar decomposition, for a totally of 66 features (in the following GLCM SF set) for each ROI.

2.3. Classification Model

Once the set of statistical features was extracted from different frequency sub-bands of the Haar wavelet transform calculated on each original image and its relative GLCMs, as described above, a classification model was trained to discriminate microcalcification clusters into benign and malignant on a subset of significant features. We used a well known machine learning method, like random forest (RF) [28].
Moreover, in order to evaluate the minimum number of significant features needed to solve the classification problem, we developed an embedded feature selection [29,30]. Embedded methods allow optimization between the interaction of the selected features and the machine learning algorithm used, because the selection criterion is grafted into it. In particular, the RF classifier processes an analysis of feature importance with respect to its expected result; therefore, these methods are essentially fulfilling the goal, i.e., optimizing the classifier performance. At each step of cross-validation, a feature ranking was calculated with respect to the predictive power assessed with the embedded method on the training set. Then, a binary classification model was trained by selecting iteratively an increasing number of features sorted by their discriminating power. In particular, the tree based strategy used by RF naturally ranks by how well they improve the purity of the node: nodes with the greatest decrease in impurity are at the start of the trees, while nodes with the least decrease in impurity occur at the end of trees measured by Gini’s diversity index. Thus, the RF algorithm allows estimating predictor importance values by permuting out-of-bag observations among the trees. In this work, we adopted a standard configuration for RF with 100 trees and 20 features (as described in [28]) randomly selected at each split. More complicated architectures did not give any significant classification improvement.
The performance of the prediction model was evaluated on 100 ten-fold cross-validation rounds in terms of Area Under the Curve (AUC) of the Receiver Operating Characteristic (ROC) curve and also accuracy, sensitivity, and specificity calculated, identifying the optimal threshold by means of Youden’s index on ROC curves [31]. Performing 100 rounds of cross-validation allowed having an estimate of the error on the average value of the performance.
All the analysis algorithms used in this work (images’ pre-processing, feature extraction and, learning models) were implemented in MATLAB2017a (MathWorks, Inc., Natick, MA, USA) software.

3. Performance Evaluation

The CAD system for classifying ROIs we proposed in [15] was trained on statistical features, derived from the Haar wavelet based multi-scale decomposition of the image and on the number of interest points/corners of the ROIs obtained by using two well known algorithms, SURF and Minimum Eigenvalue Algorithm (MinEigenAlg). The model was evaluated on 96 ROIs (56 benign and 40 malignant) reaching an average AUC value of 94.19 % and an accuracy of 88.19 % for the benign vs. malignant classification problem. Although the experimental outcomes showed high performances of the model in benign/malignant lesions’ discrimination, it was below the results reported in the literature. However, the interesting result shown by the study was that by adding the number of interest points and corners detected by using Speeded Up Robust Feature (SURF) and Minimum Eigenvalue Algorithm (MinEigenAlg) improved the forecast performance of abnormal ROIs with respect to the use of statistical features calculated on the Haar wavelet transform only.
Starting from these encouraging results, here we examined the contribution of other features other than the statistical features calculated on the Haar wavelet transform; moreover, a different approach for the feature selection task was evaluated. In particular, as reported in Section 2.3, at each step of cross-validation, a features ranking was calculated by an embedded method on the learning set, and then, a binary RF classifier was trained by iteratively selecting an increasing number of features.
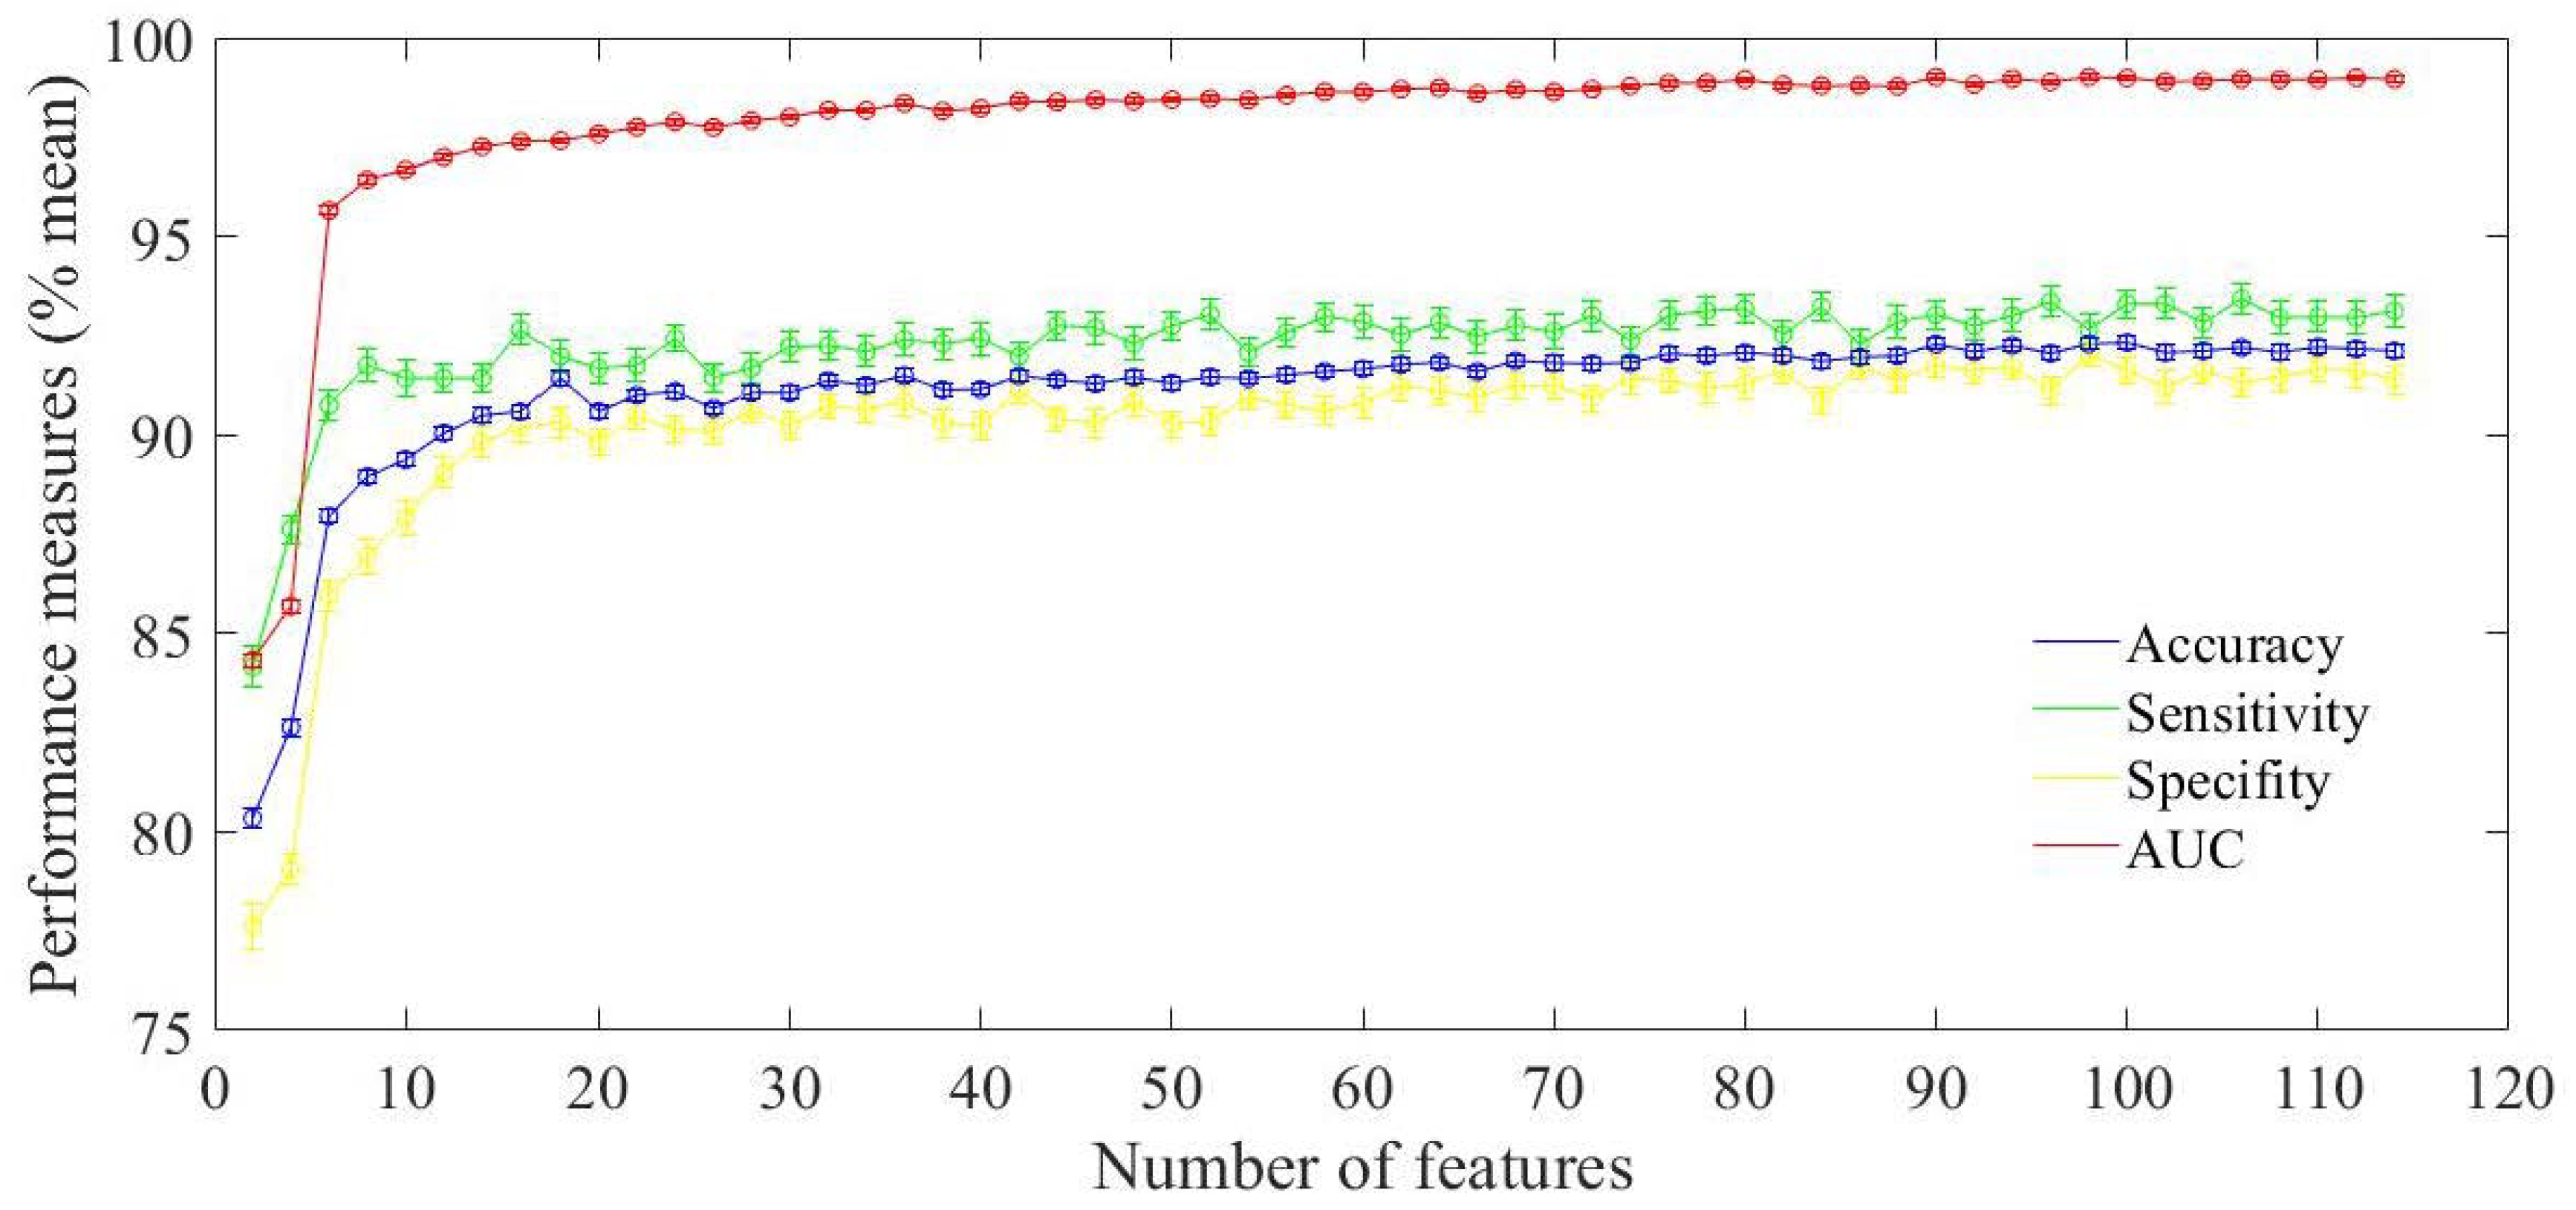
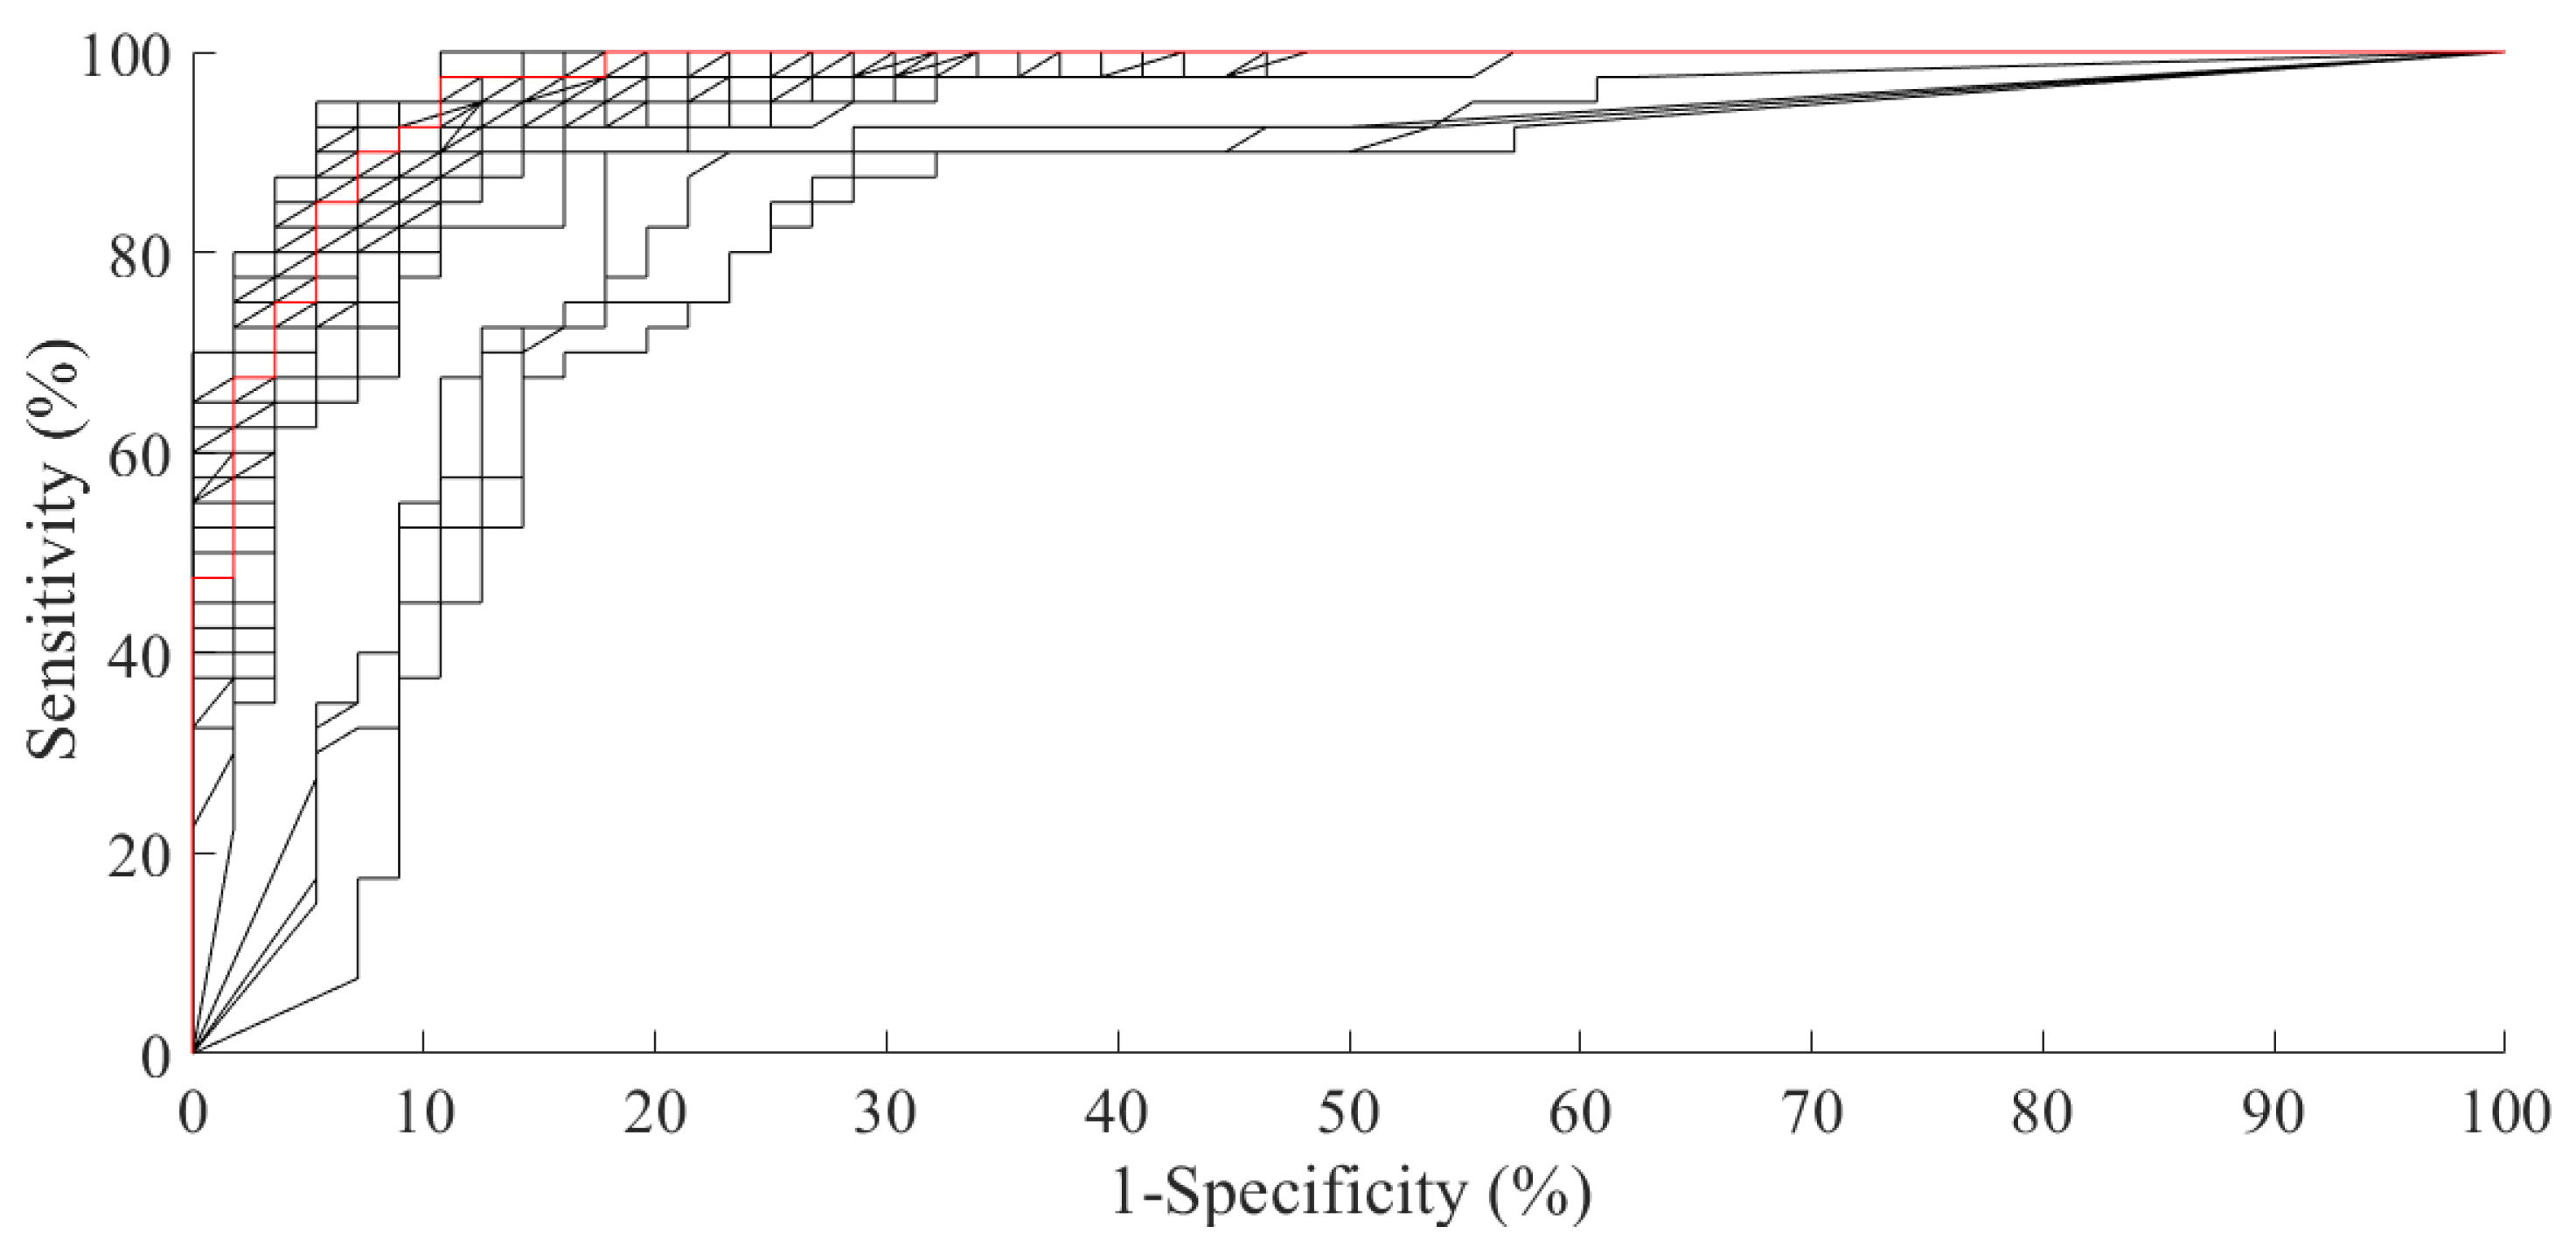
The experimental results for the discrimination of benign and malignant microcalcification clusters are summarized in Figure 4. The mean accuracy of the classifier model (%) was calculated on 100 rounds of 10-fold cross-validation. The experimental outcomes showed that the model reached a higher performance value exploiting only 16 out of the 114 (48 HAAR SF + 66 GLCM SF) features with a mean AUC value of 97.39 ± 0.01 % (Figure 5), an accuracy of 92.58 ± 0.02 % , a sensitivity of 93.15 ± 0.04 % , and a specificity of 89.18 ± 0.03 % . For this classification result, the F1-score was equal to 90.05 ± 0.05 % ; therefore, the classifier showed also good precision. During the study and development of the present work, we used other classifiers, such as SVM, Bayes, and k-nearest neighbors, different from the random forest used for the feature selection step. Nevertheless, no significant improvement in the overall performance for the same task by other evaluated classifiers was observed; this was probably because embedded methods are techniques that perform the feature selection process as part of the model construction process. Then, we preferred to report only this best result for the ease of reading the paper.
We identified the features whose occurrence in the first 16 positions of the rankings defined by the feature selection process was significantly different from the case (p-value null model test 0.05 ) (Table 1). Among these, there were only eight features calculated on the Haar decomposition images, i.e., mean, variance, relative smoothness, and kurtosis. In particular, variance and relative smoothness calculated on the original high-pass filtered image of the first ( L L 1 ) and second ( L L 2 ) level of the Haar decomposition were always selected; therefore, these seemed more informative for the recognition of the type of microcalcification cluster. The other features had an occurrence of selection below 15%, which seemed to be attributable exclusively to the case and not to a real discriminating power.
Moreover, taking into account the features calculated on the GLCMs of the Haar decomposed ROIs, an interesting result emerged. Since GLCM is a technique to obtain information on the relationship between the pixels of an image in each direction, the features with the most discriminating power seemed to be the statistic measures calculated on the GLCM corresponding to the sub-images in the diagonal direction.

4. Discussion

In this paper, we proposed a CAD system for characterizing and discriminating suspicious areas into benign/malignant as a development of the previous work for the classification of microcalcification clusters in full field digital mammograms [15]. The analysis was performed on 96 ROIs collected from 104 digital mammogram images of the BCDR database. For each ROI, firstly, a set of some textural features was computed on a multi-scale decomposition based on the Haar wavelet transform, obtaining a first set of statistical features (HAAR SF set). Secondly, the GLCM on the sub-images decomposed by Haar transform was calculated to derive a different set of textural features, obtaining a second set of statistical features (GLCM SF set). Therefore, all the features obtained were used to train an RF classifier with an embedded method for the feature selection able to discriminate ROIs. The classification performance was evaluated in terms of accuracy, sensitivity, specificity, and AUC values.
The model developed on the HAAR and GLCM statistical feature set, previously described, was high performing in the prediction of benign and malignant clustered microcalcifications with the RF classifier. It was observed that using both textural feature sets led to a median AUC value of 97.39 % , an accuracy of 92.58 % , a sensitivity of 93.15 % , and a specificity of 89.18 % .
Table 2 summarizes the results of the proposed method and other state-of-the-art models for the classification into benign and malignant ROIs. For this comparison, we considered works on classification of MC clusters that mainly used textural features [16] or a combination of these feature with other typologies [3,17,18,19,32]. We considered both works that used the same public database and others that collected digital mammography images; since all the databases collected heterogeneous images, often not coming from the same research centers, according to us, this comparison was justified.
Moreover, in [33,34], the authors developed a Convolutional Neural Network (CNN) decision support system, which was an artificial feed-forward neural network with tens or hundreds of layers. Each of these layers learned to detect independently the different features of an image: the algorithm divided each image into topologically compact portions, each of which would be processed by the filters in order to search for specific patterns, and the output of each image was used as the input for the next layer. However, this method tended to require more images for training, as the new network needed numerous examples of the object to understand the variation of the features. Training times were often longer, and the number of combinations of existing network layers could make configuring the network from scratch a very complex operation.
In our work, we used only textural features. The extraction of tissue texture features performed in an automated manner from ROIs did not require any intervention by radiologists and provided characteristic information about microcalcification clusters that may be helpful to human readers to improve the discrimination of malignant and benign lesions.
Since these works used different digital databases and classifiers, the comparison was purely qualitative. However, the performance of our model was high performing in terms of accuracy and AUC both with respect to works using the same database and to those using the DDSM database. As highlighted in the table, only [18] showed a higher accuracy, but in this work, additional features were used, such as shape features, which required a segmentation process that did not seem to justify the computational effort in terms of performance.

5. Conclusions

The diagnosis of microcalcifications is usually based on radiologists’ expertise, sometimes resulting in an inaccurate lesion detection with unnecessary biopsies and subsequent surgery. Several methods have been developed for the task of microcalcification diagnosis, in some cases performing well. Indeed, in the literature, this classification problem was not yet very accurate compared to the normal and abnormal tissues’ discrimination, despite a high rate of false positives implying unnecessary biopsies. Nevertheless, the automatic and accurate classification of microcalcification clusters, especially in differentiating the benign from the malignant ones, remains still complicated due to their nature. In this paper, we proposed the use of texture analysis methods combined with machine learning techniques in order to select the optimal subset for characterizing breast regions. In particular, we trained a binary RF classifier on an increasing number of features sorted by their diagnostic power calculated using the embedded feature importance method.
Specifically, we developed a completely automated texture analysis approach to characterize benign and malignant tissues on digital mammograms. Using only textural features, the experimental results evaluated by cross-validation techniques were quite promising with respect to the state-of-the-art works.
Since the sample of images with microcalcification clusters of BCDR was poor, we considered it appropriate to evaluate the model performance through the cross-validation technique. Nevertheless, our future work will include a validation study on a larger population, also considering other public database, and on an independent test sample. Moreover, we will evaluate the contribution of other types of features to our model with respect to those used in this work, in order to improve the diagnostic accuracy.

Author Contributions

Conceptualization, A.F. (Annarita Fanizzi), L.L., T.M.B., S.T., and D.L.F.; data curation, A.F. (Annarita Fanizzi), L.L., A.F. (Alfonso Fausto), and D.L.F.; formal analysis, A.F. (Annarita Fanizzi), L.L., T.M.B., and S.T.; funding acquisition, V.L., R.M., and D.L.F.; methodology, A.F. (Annarita Fanizzi), L.L., T.M.B., R.B., F.C., and S.T.; software, A.F. (Annarita Fanizzi) and L.L.; supervision, V.L., S.T., and D.L.F.; validation, A.F. (Annarita Fanizzi); writing, original draft, A.F. (Annarita Fanizzi), L.L., T.M.B., S.T., and D.L.F.; writing, review and editing, R.B., U.B., F.C., V.D., A.F. (Alfonso Fausto), R.M., A.T., P.T., and V.L. All authors approved the final version.

Funding

This research received no external funding.

Acknowledgments

This work was supported by funding from the Italian Ministry of Health “Ricerca Corrente 2018–2020”.

Conflicts of Interest

The authors declare no conflict of interest. The funders had no role in the design of the study; in the collection, analyses, or interpretation of data; in the writing of the manuscript; nor in the decision to publish the results.

Abbreviations

The following abbreviations are used in this manuscript:
AUCArea Under the Curve
BCDRBreast Cancer Digital Repository
BCDR-DMBreast Cancer Digital Repository-Digital Mammography
CADComputer Automated Detection
CADxComputer Automated Diagnosis
CNNConvolutional Neural Network
dir1right to left direction in GLCM
dir2left to right direction in GLCM
FFDMFull-Field Digital Mammography
GLCMGray-Level Co-occurrence Matrix
GLCM-SFGray-Level Co-occurrence Matrix Statistical Features
HAAR-SFHaar Statistical Features
HEHigh-Energy
HHHigh-High
HLHigh-Low
LELow-Energy
LHLow-High
LLLow-Low
LDALinear Discriminant Analysis
MC>Microcalcification
RFRandom Forest
ROCReceiver Operating Characteristic
ROIRegion Of Interest
SVMSupport Vector Machine

References

  1. Puliti, D.; Duffy, S.W.; Miccinesi, G.; De Koning, H.; Lynge, E.; Zappa, M.; Paci, E. Overdiagnosis in mammographic screening for breast cancer in Europe: A literature review. J. Med. Screen. 2012, 19, 42–56. [Google Scholar] [CrossRef] [PubMed]
  2. Elmore, J.G.; Armstrong, K.; Lehman, C.D.; Fletcher, S.W. Screening for breast cancer. JAMA 2005, 293, 1245–1256. [Google Scholar] [CrossRef] [PubMed]
  3. Khehra, B.S.; Pharwaha, A.P.S. Least-squares support vector machine for characterization of clusters of microcalcifications. World Acad. Sci. Eng. Technol. Int. J. Comput. Inf. Sci. Eng. 2013, 7, 932–941. [Google Scholar]
  4. Jalalian, A.; Mashohor, S.B.; Mahmud, H.R.; Saripan, M.I.B.; Ramli, A.R.B.; Karasfi, B. Computer-aided detection/diagnosis of breast cancer in mammography and ultrasound: A review. Clin. Imaging 2013, 37, 420–426. [Google Scholar] [CrossRef] [Green Version]
  5. Beura, S.; Majhi, B.; Dash, R. Mammogram classification using two dimensional discrete wavelet transform and gray-level co-occurrence matrix for detection of breast cancer. Neurocomputing 2015, 154, 1–14. [Google Scholar] [CrossRef]
  6. Buciu, I.; Gacsadi, A. Directional features for automatic tumor classification of mammogram images. Biomed. Signal Process. Control 2011, 6, 370–378. [Google Scholar] [CrossRef]
  7. Fanizzi, A.; Tangaro, S.; Bellotti, R.; Basile, T.; Bottigli, U.; Losurdo, L.; Massafra, R.; Tamborra, P.; Didonna, V.; La Forgia, D. Automatised detection of microcalcification in mammography. Phys. Med. Eur. J. Med. Phys. 2016, 32, 217. [Google Scholar] [CrossRef]
  8. Bozkurt, S.; Gimenez, F.; Burnside, E.S.; Gulkesen, K.H.; Rubin, D.L. Using automatically extracted information from mammography reports for decision-support. J. Biomed. Inform. 2016, 62, 224–231. [Google Scholar] [CrossRef]
  9. Verma, B. Novel network architecture and learning algorithm for the classification of mass abnormalities in digitized mammograms. Artif. Intell. Med. 2008, 42, 67–79. [Google Scholar] [CrossRef]
  10. Rodríguez-Ruiz, A.; Krupinski, E.; Mordang, J.J.; Schilling, K.; Heywang-Köbrunner, S.H.; Sechopoulos, I.; Mann, R.M. Detection of breast cancer with mammography: Effect of an artificial intelligence support system. Radiology 2018, 290, 305–314. [Google Scholar] [CrossRef]
  11. Fanizzi, A.; Losurdo, L.; Basile, T.M.A.; Bellotti, R.; Bottigli, U.; Delogu, P.; Diacono, D.; Didonna, V.; Fausto, A.; Lombardi, A.; et al. Fully Automated Support System for Diagnosis of Breast Cancer in Contrast-Enhanced Spectral Mammography Images. J. Clin. Med. 2019, 8, 891. [Google Scholar] [CrossRef] [PubMed] [Green Version]
  12. Sánchez-Ferrero, G.V.; Arribas, J.I. A statistical-genetic algorithm to select the most significant features in mammograms. In Proceedings of the International Conference on Computer Analysis of Images and Patterns, Vienna, Austria, 27–29 August 2007; Springer: New York, NY, USA, 2007; pp. 189–196. [Google Scholar]
  13. Malar, E.; Kandaswamy, A.; Chakravarthy, D.; Dharan, A.G. A novel approach for detection and classification of mammographic microcalcifications using wavelet analysis and extreme learning machine. Comput. Biol. Med. 2012, 42, 898–905. [Google Scholar] [CrossRef]
  14. Phadke, A.C.; Rege, P.P. Detection and Classification of Microcalcifications Using Discrete Wavelet Transform. Int. J. Emerg. Trends Technol. Comput. Sci. 2013, 2, 130–134. [Google Scholar]
  15. Losurdo, L.; Fanizzi, A.; Basile, T.M.; Bellotti, R.; Bottigli, U.; Dentamaro, R.; Didonna, V.; Fausto, A.; Massafra, R.; Monaco, A.; et al. A Combined Approach of Multiscale Texture Analysis and Interest Point/Corner Detectors for Microcalcifications Diagnosis. In Proceedings of the International Conference on Bioinformatics and Biomedical Engineering, Granada, Spain, 25–27 April 2018; Springer: New York, NY, USA, 2018; pp. 302–313. [Google Scholar]
  16. Hu, K.; Yang, W.; Gao, X. Microcalcification diagnosis in digital mammography using extreme learning machine based on hidden Markov tree model of dual-tree complex wavelet transform. Expert Syst. Appl. 2017, 86, 135–144. [Google Scholar] [CrossRef]
  17. Pérez, N.; Silva, A.; Ramos, I. Ensemble features selection method as tool for breast cancer classification. Int. J. Image Min. 2015, 1, 224–244. [Google Scholar] [CrossRef]
  18. Singh, B.; Kaur, M. An approach for classification of malignant and benign microcalcification clusters. Sādhanā 2018, 43, 39. [Google Scholar] [CrossRef] [Green Version]
  19. Ren, J. ANN vs. SVM: Which one performs better in classification of MCCs in mammogram imaging. Knowl.-Based Syst. 2012, 26, 144–153. [Google Scholar] [CrossRef] [Green Version]
  20. Fanizzi, A.; Basile, T.; Losurdo, L.; Amoroso, N.; Bellotti, R.; Bottigli, U.; Dentamaro, R.; Didonna, V.; Fausto, A.; Massafra, R.; et al. Hough transform for clustered microcalcifications detection in full-field digital mammograms. In Proceedings of the Applications of Digital Image Processing XL International Society for Optics and Photonics, San Diego, CA, USA, 19 September 2017; Volume 10396, p. 1039616. [Google Scholar]
  21. Gonzalez, R.C.; Woods, R.E. Digital Image Processing; Prentice-Hall, Inc.: Upper Saddle River, NJ, USA, 2002. [Google Scholar]
  22. Mallat, S.G. A theory for multiresolution signal decomposition: The wavelet representation. IEEE Trans. Pattern Anal. Mach. Intell. 1989, 11, 674–693. [Google Scholar] [CrossRef] [Green Version]
  23. Haralick, R.M.; Shanmugam, K.; Dinstein, I. Textural features for image classification. IEEE Trans. Syst. Man Cybern. 1973, 6, 610–621. [Google Scholar] [CrossRef] [Green Version]
  24. Ramos-Pollán, R.; Guevara-López, M.A.; Suárez-Ortega, C.; Díaz-Herrero, G.; Franco-Valiente, J.M.; Rubio-del Solar, M.; González-de Posada, N.; Vaz, M.A.P.; Loureiro, J.; Ramos, I. Discovering mammography-based machine learning classifiers for breast cancer diagnosis. J. Med. Syst. 2012, 36, 2259–2269. [Google Scholar] [CrossRef]
  25. Pathak, B.; Barooah, D. Texture analysis based on the gray-level co-occurrence matrix considering possible orientations. Int. J. Adv. Res. Electr. Electron. Instrum. Eng. 2013, 2, 4206–4212. [Google Scholar]
  26. Mallat, S. A Wavelet Tour of Signal Processing; Academic Press: New York, NY, USA, 1999. [Google Scholar]
  27. Mohanaiah, P.; Sathyanarayana, P.; GuruKumar, L. Image texture feature extraction using GLCM approach. Int. J. Sci. Res. Publ. 2013, 3, 1. [Google Scholar]
  28. Breiman, L. Random forests. Mach. Learn. 2001, 45, 5–32. [Google Scholar] [CrossRef] [Green Version]
  29. Saeys, Y.; Inza, I.; Larrañaga, P. A review of feature selection techniques in bioinformatics. Bioinformatics 2007, 23, 2507–2517. [Google Scholar] [CrossRef] [PubMed] [Green Version]
  30. Guyon, I.; Elisseeff, A. An introduction to variable and feature selection. J. Mach. Learn. Res. 2003, 3, 1157–1182. [Google Scholar]
  31. Youden, W. Index for rating diagnostic tests. Cancer 1950, 3, 32–35. [Google Scholar] [CrossRef]
  32. Alam, N.; RE Denton, E.; Zwiggelaar, R. Classification of microcalcification clusters in digital mammograms using a stack generalization based classifier. J. Imaging 2019, 5, 76. [Google Scholar] [CrossRef] [Green Version]
  33. Hepsağ, P.U.; Özel, S.A.; Yazıcı, A. Using deep learning for mammography classification. In Proceedings of the 2017 IEEE International Conference on Computer Science and Engineering (UBMK), Antalya, Turkey, 5–8 October 2017; pp. 418–423. [Google Scholar]
  34. Cai, H.; Huang, Q.; Rong, W.; Song, Y.; Li, J.; Wang, J.; Chen, J.; Li, L. Breast Microcalcification Diagnosis Using Deep Convolutional Neural Network from Digital Mammograms. Comput. Math. Methods Med. 2019, 2019, 2717454. [Google Scholar] [CrossRef]
Figure 1. Example regions of interest with microcalcification clusters extracted from the BCDR dataset.
Applsci 09 05388 g001
Figure 2. Scheme of feature extraction. For each ROI, a set of some textural features was computed on a multi-scale decomposition by using the Haar wavelet transform, called the HAAR SFset. Moreover, GLCMs was calculated on each sub-image decomposed by Haar transform in order to derive a second set of textural features, called the GLCM SF set. This scheme is shown starting from a low energy image, but it is also performed for recombined images.
Applsci 09 05388 g002
Figure 3. Image decomposition schema (a,b) and on the image sample (a1b1). In the 2D Haar wavelet decomposition of the image, the original image is first high-pass filtered, yielding the three sub-images ((aa1); top right: horizontal; bottom left: vertical; bottom right: diagonal), then low-pass filtered and down-scaled, yielding an approximation coefficient sub-image ((aa1), top left). To compute the successive level of decomposition, the process is iterated on the approximation coefficient sub-image ((bb1) top, left).
Applsci 09 05388 g003
Figure 4. Mean accuracy and standard error (%) of each performance values (AUC, accuracy, sensitivity, specificity) along with the number of features: the average value on 100 rounds of 10-fold cross-validation for increasing values of the number of features used to train the classification model to recognize benign/malignant ROIs extracted from the BCDR dataset.
Applsci 09 05388 g004
Figure 5. ROC curves calculated on 100 rounds of 10-fold cross-validation of the classification model that showed the highest accuracy value. In red, the average ROC curve is shown.
Applsci 09 05388 g005
Table 1. Significant features on the BCDR database: the features whose occurrence fell into the first 16 positions of the rankings defined by the embedded method are significantly different from the case (p-value null model test 0.05 ) for the benign vs. malignant classification problems.
Benign/Malignant
Significant FeaturesFrequency (%)
Relative Smoothness Haar LL1100
Variance Haar LL1100
Relative Smoothness Haar LL2100
Variance Haar LL2100
Sum Variance GLCM HH1 dir2 93.70
Sum Variance GLCM HH1 dir1 90.70
Sum Average GLCM HH1 dir2 72.80
Autocorrelation GLCM HH1 dir2 66.40
Sum Average GLCM HH1 dir1 59.80
Mean Haar HH1 42.20
Autocorrelation GLCM HH1 dir1 39.20
Difference Entropy GLCM HH1 dir1 35.50
Sum Entropy GLCM LH1 dir2 30.10
Sum Entropy GLCM HH1 dir2 28.50
Entropy GLCM HH1 dir1 26.30
Kurtosis Haar HH2 22.20
Difference Entropy GLCM HH1 dir2 20.60
Entropy GLCM HH1 dir2 16.10
Entropy GLCM HH2 dir1 15.70
Mean Haar LL2 15.40
Kurtosis Haar HL2 15.20
Table 2. Benign vs. malignant microcalcification cluster classification: accuracy (Acc) and Area Under the Curve (AUC) performances.
MethodsDBNo. of ROIsFeaturesClassifierAcc (%)AUC (%)
Ren et al. (2012) [19]DDSM150statistical, shape and structuralSVM-94
Khehra et al. (2013) [3]DDSM380statistical, shape, texturalLS-SVM89-
Perez et al. (2015) [17]BCDR76shape and texturalNB-79
Hu et al. (2017) [16]DDSM150texturalExtreme Learning Machine-92
Hepsağ et al. (2017) [33]BCDR134shape and texturalCNN84-
Singh et al. (2018) [18]DDSM428shape and texturalSVM9493
Alam et al. (2019) [32]DDSM280shape, textural, topologicalEnsemble learning8582
Cai et al. (2019) [34]Private database749shape and texturalCNN8794
Proposed approachBCDR96texturalRF9297