Article

Determination of Clamping Force Using Bolt Vibration Responses during the Tightening Process

1
Department of Mechanical Engineering, Hanyang University, Seoul 04763, Korea
2
Hyundai Motor Group, Seoul 137873, Korea
*
Author to whom correspondence should be addressed.
Appl. Sci. 2019, 9(24), 5379; https://doi.org/10.3390/app9245379
Submission received: 18 October 2019 / Revised: 3 December 2019 / Accepted: 4 December 2019 / Published: 9 December 2019
(This article belongs to the Special Issue Vibration-Based Structural Health Monitoring)

Abstract

:

Featured Application

This approach allows detection of transient spectral characteristics using the cepstrum for diagnosis.

Abstract

This paper presents a novel method to measure clamping force by using the vibration of bolts. The resonance frequency of the bolt increases in line with the clamping force during the tightening process. These characteristics were measured and utilized in the k-means clustering algorithm. Bolt specimens were fastened to the load cell using a nutrunner for verification of the proposed method. The precisely measured clamping force was labeled. The labeled data was used to predict the clamping force from the vibration responses. To use the proposed method in assembly of actual parts, an accelerometer was attached to the nutrunner for vibration measurements. This enabled continuous monitoring of the clamping force without influence on the parts. The estimated clamping force was compared with those from the torque method. When the vibration of a bolt was transmitted through the nutrunner, loss of high-frequency vibration energy occurred. The resonant frequency band vibrations of the bolt were preserved to determine the fastening force. The components in the low frequency band were excluded using a band-pass filter. The clamping force of the bolt used in the vehicle’s lower arm and the link was also evaluated precisely. By using the proposed method, it is possible to continuously monitor variations of the clamping force during the manufacturing process.

1. Introduction

Mechanically fastened joints and adhesive bonded joints are used to join structures [1,2]. These joints affect the damping and dynamic properties of the assembled structure [3]. Fastened joints consist of bolts, rivets, and pins. Bolted joints are used widely for their reliability and cost reduction during vehicle manufacture. As the demand for lightweight structures is increasing in the automotive [4] and aerospace [5,6] industries, advanced composite materials and alloys are being used [7]. A decrease in weight is inevitably accompanied by an increase in vibration. According to Ni sui et al. [8], structures made of lightweight materials easily transmit sound due to small transmission losses. For systems consisting of various thin wall structures, such as automobiles, the sound transmission characteristics are determined by the mass law. Noise emission is inversely proportional to the plate thickness and material density. This results in an increase in structure-borne noise or a failure of parts during operation due to excessive vibrations. To minimize these faults, a thick bolt that can apply excessive clamping force over the designed value is required. When the clamping force is measured precisely, the reliability of the assembled parts increases with the reduction of the bolt size. The mechanism of the bolt tightening process is complex. Numerous factors affect the lifespan of an assembled bolt. The tension of the bolts induces preloading, which makes the two separate parts move in phases. By preventing slippage between parts, the force has the greatest effect on the lifecycle. Most bolt failures are caused by insufficient initial clamping force applications. When the applied preloading of the bolt is less than the design value, the bolt can be loosened by vibrations from operations. Monitoring of the bolt loosening is important to ensure the safety of structures [9,10,11,12,13,14,15,16]. To minimize unexpected problems due to bolt loosening, it is important to evaluate the initial bolt clamping force during the tightening process.
Torque and angle controls are used to apply uniform clamping forces to each bolt in the manufacturing process. Measurement of the tightening torque using a wrench is the least expensive and most efficient method for estimation of the clamping force [17]. When the torque is used to estimate the clamping force, the tightening is performed until the applied torque reaches the value set by the operator. Alternatively, the torque is estimated by the value measured when loosening the already tightened bolt. For the bolt assembly process, only a small portion of the fastening torque is converted to fastening force (less than 10%). Most of the applied energy is known to be used to overcome the friction generated on the bolt threads (40%) and on the bolt head or nut seat (50%). The efficiency of the conversion is affected by the bolt material, and can be changed by installing a lock washer or by lubricating the threads. Torque is converted into the product of nut factor, clamping force, and nominal diameter. Nut factor causes variation of 25–30% caused by friction, operator, geometry, tool accuracy, and relaxation factors. Consequently, it is difficult to use this for structures and joints that require precise monitoring of the clamping force [18,19,20]. The angle control method utilizes the linear relationship between the rotation and the clamping force in the elastic deformation of a bolt [21]. The status when the bolt head seat comes into contact with the bolted joint is called the snug point. At the snug point, the axial clamping force is zero; the fastening force increases in proportion to the angle in the rotating process [22].
Strain gauge and ultrasonic measurements were used to precisely measure the initial clamping force. The strain method measures the clamping force using Hooke’s law after attaching a strain gauge to the axial direction of a bolt [18,23]. For an axial strain gauge, the mounting should be aligned in axial directions. This method does not allow online monitoring of the clamping force. To measure the clamping force using ultrasonic waves, the tone burst signal is transmitted through the bolt to measure the time of flight (ToF) [24]. When the bolt is stretched by the tensile force, the path through which the wave is transmitted becomes larger [25]. The clamping force is measured from the time difference of arrival (TDoA). Measurement of the clamping force using ultrasonic waves is robust and widely used. The cutting process for both bolt ends to induce normal incidence and reflection of the ultrasonic waves is essential and makes the application to actual manufacturing processes difficult [26]. Dynamometers precisely inserted directly between bolts and assembled parts were used to measure bolt clamping force [27]. This method is not applicable to the actual production process due to difficulties in continuous monitoring of the clamping force using load cells.
In this study, we propose a clamping force estimation method that can be applied to the actual bolt assembly process. The accuracy of the estimation process was compared with that of the conventional torque method. The vibrations generated during bolt rotations showed fastening process characteristics. Accelerometers were used in the actual production process to provide advantages in sensing and installation. This allowed quality evaluation for the bolting process. In the speaker recognition algorithm, features were extracted using linear frequency cepstral coefficients (LFCC) [28]. Quantification was performed by applying the vector quantization algorithm to the extracted speaker features. Each speaker was classified by clustering the quantized speaker voice information. In this study, the speaker recognition algorithm was applied to the bolt vibration responses. The responses for different clamping forces were classified as the corresponding speakers in the recognition algorithm. The feature with the highest clamping force was used as a reference. The method of similarity estimation was applied. This provided a highly efficient, nondestructive method to estimate the clamping force.

2. Nondestructive Method to Estimate Clamping Force

This section describes the algorithm used to determine the bolt clamping force. The proposed algorithm is based on unsupervised learning using k-means clustering after extracting the cepstrum as a feature of the vibration responses. The cepstrum analysis is used to summarize the spectral characteristics [29]. The cepstrum analysis used to detect the echoes in seismic signals is defined as “the power spectrum of the logarithm of the power spectrum” [30]. It is widely used in speech analysis, communications, seismology, and geophysics [31]. Use of an inverse Fourier transform on the log spectrum instead of a standard Fourier transform was also proposed [32]. The “complex cepstrum” was defined as the inverse Fourier transform of the complex logarithm of the complex spectrum. The complex cepstrum contains phase information retrieved from the time domain. This mitigates the effects of harmonics and sidebands in the measured audio signals [33]. When using a rotating element such as a nutrunner to fasten bolts, sidebands associated with the fastening speed are generated at the control frequency of the servomotor and harmonics appear in the entire frequency band. These components are not related to the clamping force of the bolts. Elimination of the effects using cepstrum analysis benefits the interpretation of the signal. The calculation of cepstrum is available in various forms. When using LFCC or mel frequency cepstral coefficients (MFCC), a discrete cosine transform is widely applied instead of the Fourier transform or inverse Fourier transform [28]. The mel frequency was designed for frequency domain analysis when recognizing human speech signals. In this study, the real cepstrum was used as:
x ^ r ( τ ) = D C T [ log ( | X ( f ) | ) ] ,
where DCT is the discrete cosine transform and X ( f ) is the Fourier transform of the time signal. The discrete cosine transform used in this is study defined as:
D C T ( x ( k ) ) = 2 N n = 1 N x ( n ) 1 1 + δ cos ( π 2 N ( 2 n 1 ) ( k 1 ) )
where k = 1 , 2 , , N , x is the measured signal, N is length of signal, and δ is Kronecker delta.
The cepstrum was named by reversing the first syllable of spectrum. The quefrency was obtained from the Fourier transform of logarithmic frequency.
An additional benefit of interpretation of the signal using the cepstrum includes the logarithmic computation. The signal is measured when the wave propagation possesses the combined characteristics of the source and the propagation path. In this study, the vibration excitation source is a fastening nutrunner. The bolt is included in the transmission path. The vibration due to transmissions reflect the change of the fastening force in the bolt. These properties are multiplicative in the frequency domain. When configured with the logarithmic transformation of the spectrum, the source and the propagation path become additives and are inherited in the calculation of the cepstrum.
Tiwari [28] applied triangular band pass frequency response for the filter bank. A triangular filter bank is used to simulate the subjective spectrum [34]. Triangular filters are converted into sinc2 functions in the quefrency domain that are efficient for real-time calculations and anti-aliasing benefits. One hundred triangular filters are set at equal intervals in the frequency band between 4 kHz and 20 kHz to simulate a band pass filtering effect. The frequency band includes a change in natural frequency that occurs when the bolt is tightened. The linearly spaced triangular filters were utilized to characterize the cepstrum as feature coefficients. The feature was represented by the T × 100 dimensional vector, where T is the number of time windows. The data set constructed from 472 bolt fastening experiments was trained in machine learning algorithms.
Unsupervised learning is a way to unravel hidden structures of data without knowing the number of clusters [35]. K-means clustering is one of the simple and widely used unsupervised learning algorithms. It produces K nonhierarchical clusters. The algorithm extracts the data into mutually exclusive clusters and returns a vector of indices representing the k-clusters assigned to each set of vectors. The k-means clustering problem divides N data sets X = {x1, x2, …, xN}, xNRd into K disjoints. The reference function finds the sum of the squared Euclidean distances of each data point xi and the center of the cluster kk. This reference function F is expressed as:
F ( k 1 , , k K ) = i = 1 K j = 1 K i x i j k i 2
where xi is the jth object of the ith cluster and ki is the centroid of the ith cluster.
In one dimension, the centroid is the arithmetic mean of all the points in the cluster. For multidimensional data, the centroid has the same components as the number of dimensions. The calculation of centroids in each dimension is identical to the calculation in one dimension. Centroid ki is defined as:
k i = 1 K i j = 1 K i x i j ,     i = 1 , , K .
The objective of k-means is to gain the least summation of the squared error over all clusters. The solution to this problem is NP-hard [36]. Lloyd [30] proposed a local search solution for this problem, now widely called k-means. The original k-average algorithm did not mathematically guarantee the correctness of clustering. Arthur [37] proposed a k-means ++ algorithm as a modified algorithm of k-means. The use of the k-means algorithm has expanded in many applications [38]. The algorithm classifies each data item into a single cluster. The fuzzy c-means algorithm proposed by Dunn [39] and improved by Bezdek [40] allows data points to belong to multiple clusters. X-means automatically optimizes the number of clusters k using the Akaike information criterion (AIC) or Bayesian information criterion (BIC) [41]. Pelleg and Moore [42] also used the kd-tree to effectively identify the nearest cluster center.
K-means clustering is performed in the sequential computations. The entire dataset is divided into k disjoint subsets. For each subset, a centroid is computed. Each data item is put into the group containing the centroid that is nearest to that data item. This process is called clustering. After clustering is completed, the centroids of all the clusters are recomputed. Then, clustering is performed again based on the recomputed centroids. Clustering and centroid recalculations are repeated until the centroid converges. K-means clustering is a simple, unsupervised learning method [43]. The relationship between the size of the dataset and the computation time is linear. Partitions are created in any order. The more variables there are, the faster the computation, meaning tighter clusters can be created.

3. Estimation of Clamping Force from Vibration Measured in the Clamped Parts

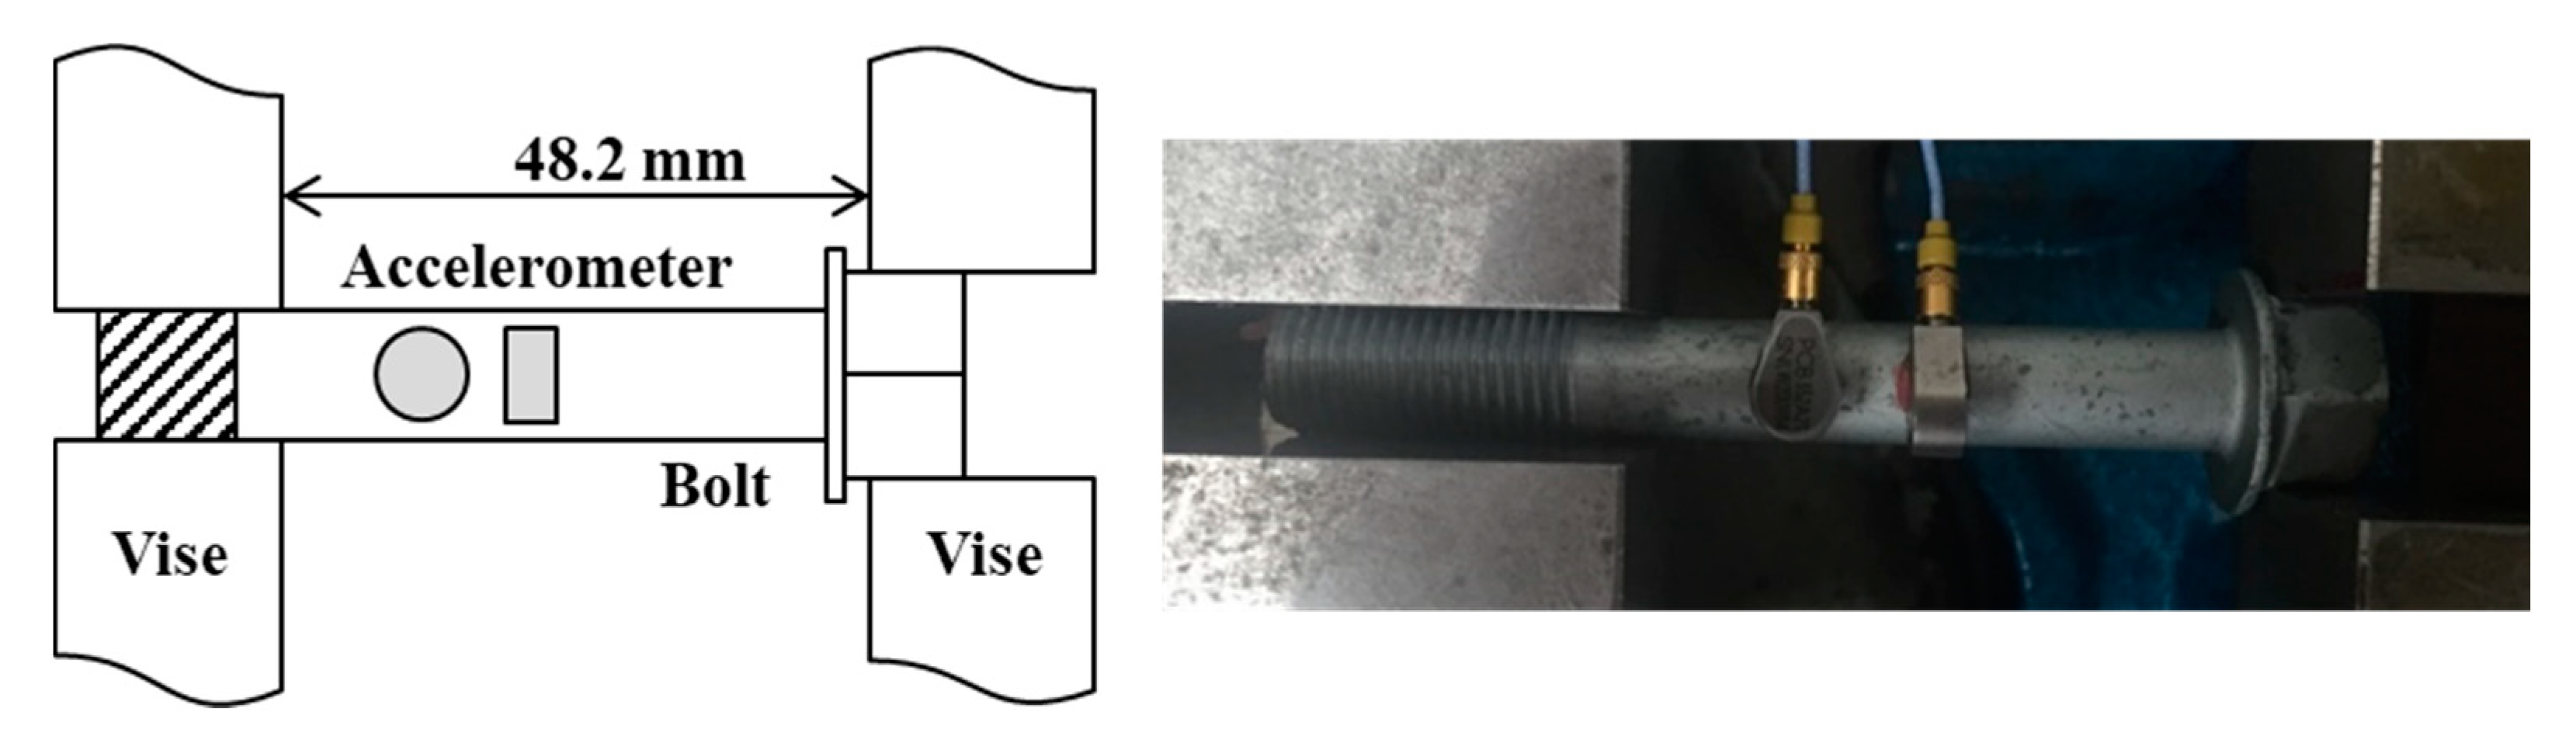
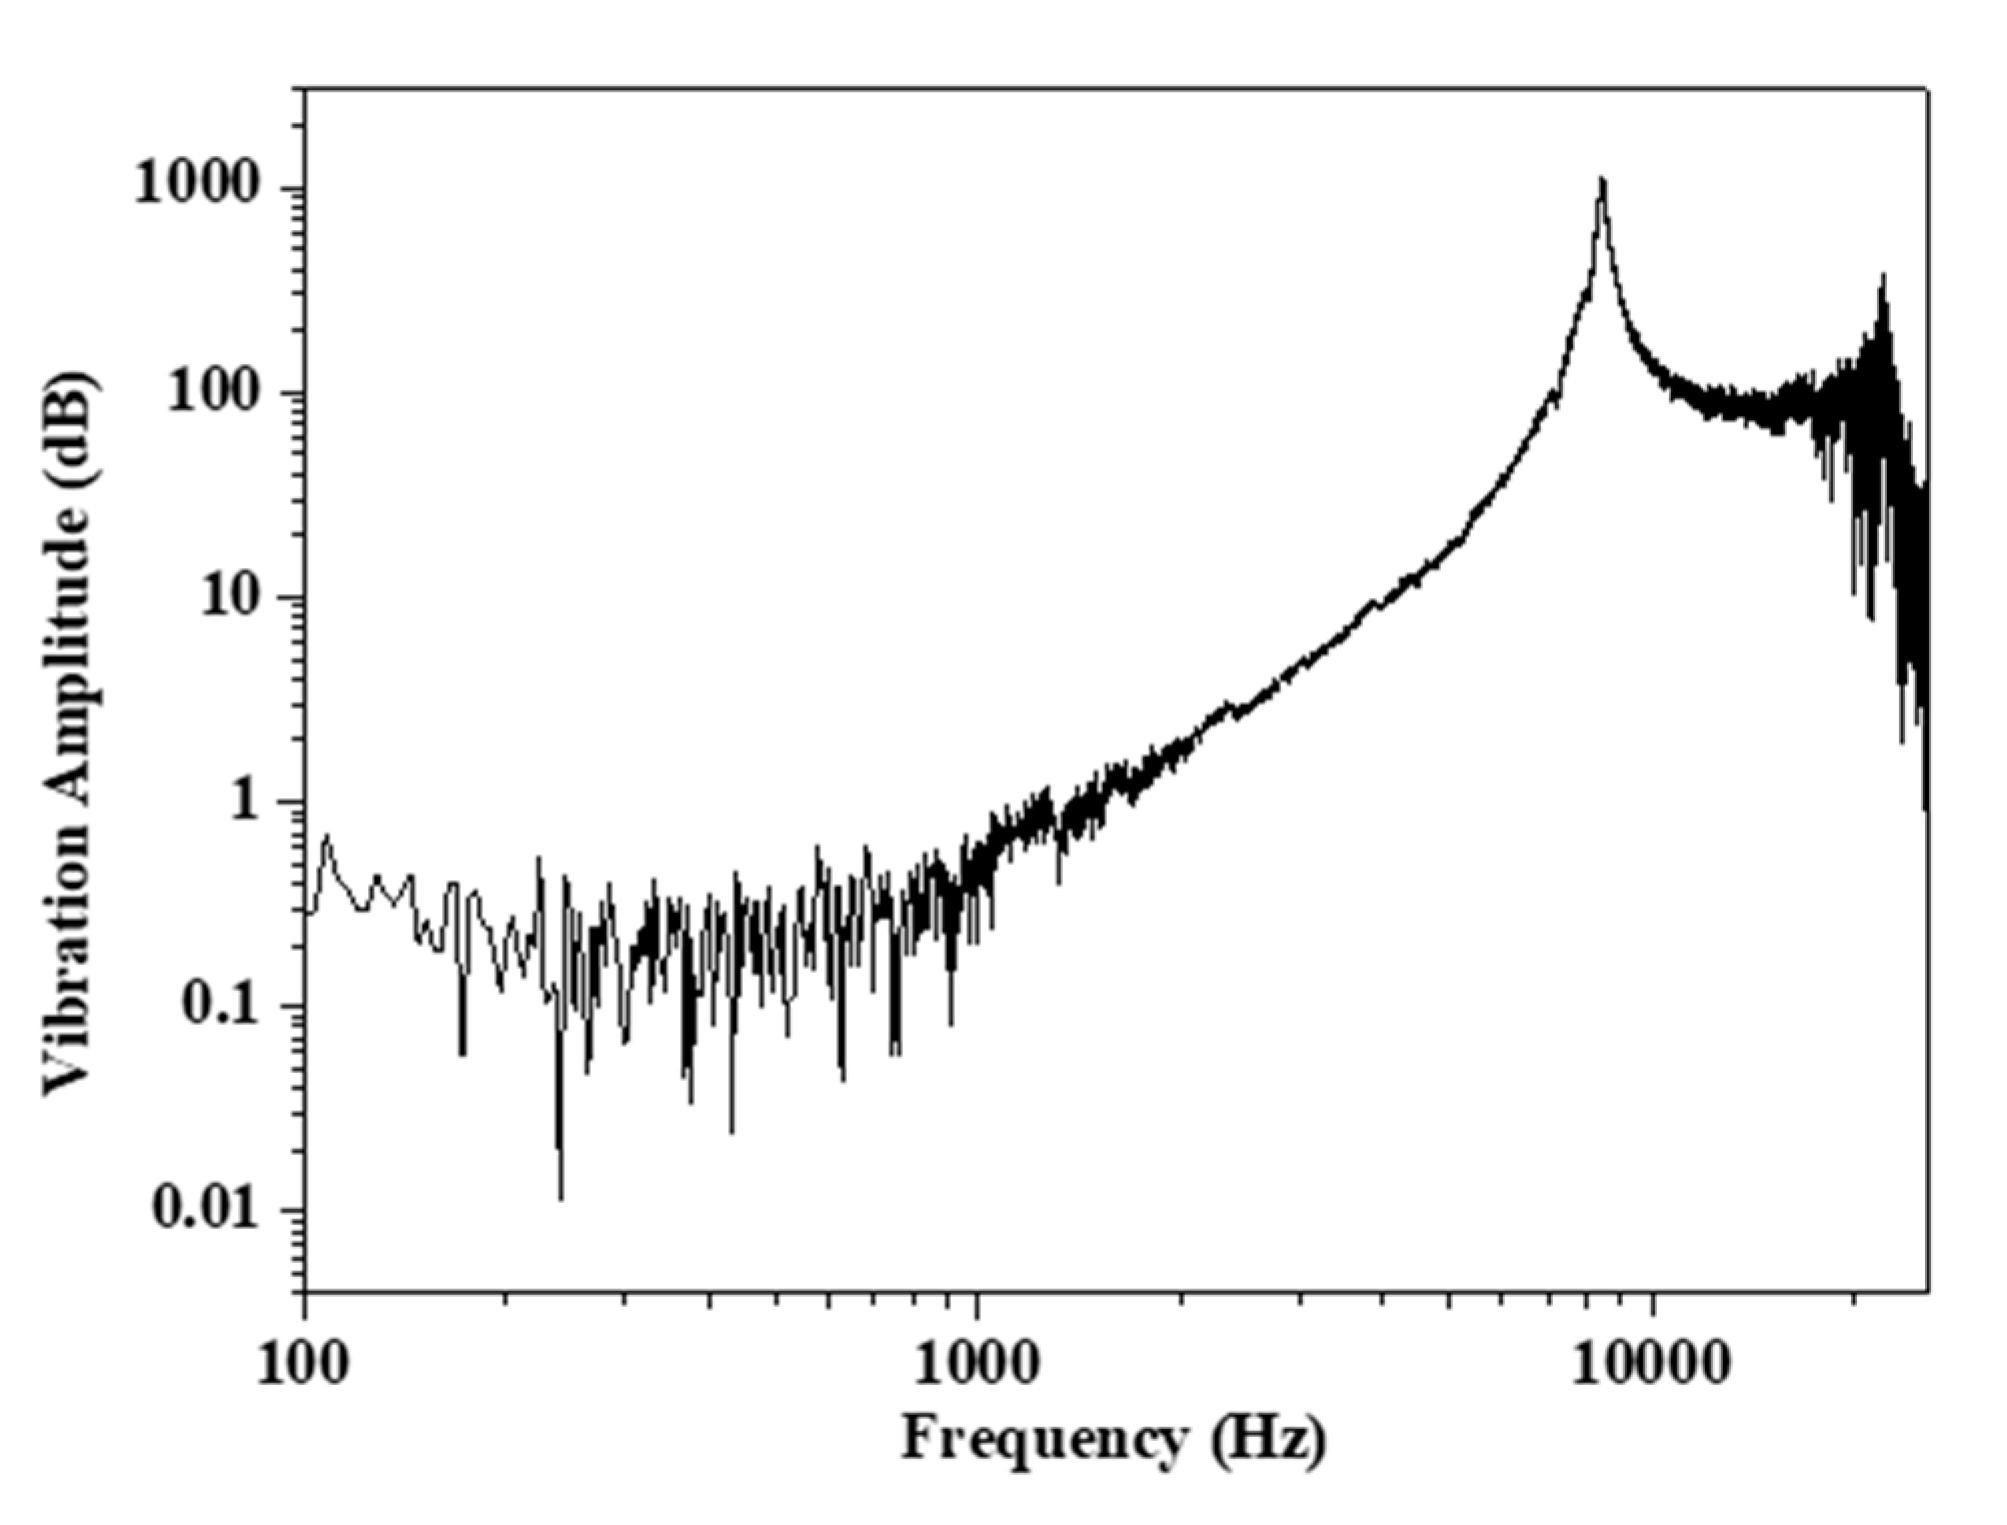
3.1. Natural Frequency of a Bolt Specimen

The bolt acts as a transmission path for vibration transfer from the nutrunner into the clamped parts. In the process of bolt fastening, the boundary stiffness and tensile force of the bolt increase. This tension in the bolt increases the natural frequency for flexural vibrations. The excitation of the bolt and its transfer to the clamped structure is inevitably generated by the nutrunner that fastens the bolt. While the vibration properties of the clamped structure are stationary and do not change, the frequency response of the bolts changes due to increasing preload. The vibration modal component continuously changes in a short fastening time and is an important indicator of the clamping force. To measure the modal properties, both ends of the bolt were fixed to a hydraulic vise. The thickness of the bolt was 10 mm. The grip length was 48.2 mm, which is the same for the load cell experiments shown in the following section. As shown in Figure 1, the accelerometers (PCB, 352A21/NC) were attached to the bolt surface. An impact hammer (PCB, 086C02) was used to excite the bolt. Two accelerometers were attached in the longitudinal and the transverse directions to confirm the occurrence of the signal in a similar band to the frequency component of the responses generated in the bolt fastening process. The actual responses during the clamping process and the impact-generated transverse flexural vibrations occurred in similar frequency bands.
The frequency response of the measured bolts is shown in Figure 2. This figure shows the bolt vibration characteristics when excited by a point force. This provides important information about the modal properties of the testing bolt. When analyzed as the beams of simply supported boundary conditions with Young’s modulus of 207 GPa, density of 7600 kg/m3, and 10 mm diameter, the first natural frequency of the bolt was calculated as 8452 Hz according to the Euler–Bernoulli beam theory [44]. The value was similar to the measured value of 8388 Hz (an error of less than 1%). The resonance in the longitudinal direction was not observed.

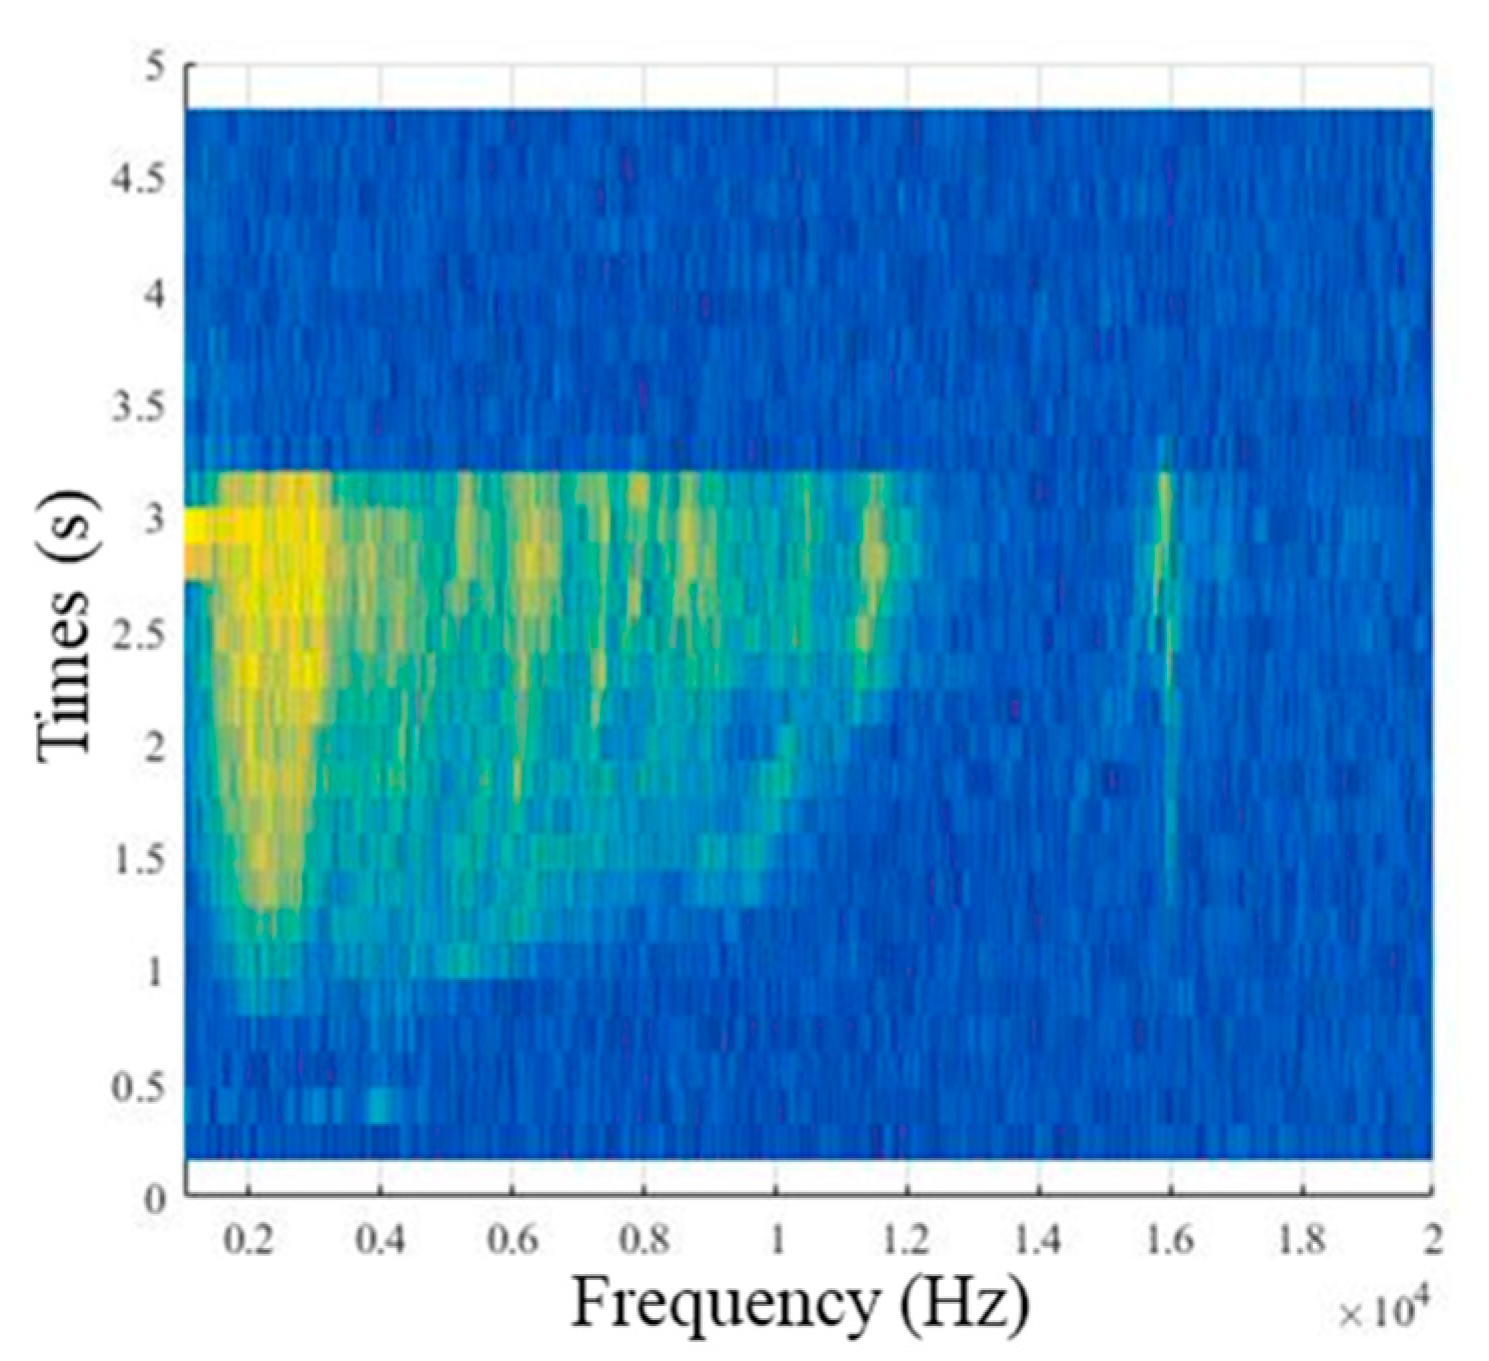
3.2. Dynamic Characteristics of a Fastening Bolt

When the bolt is used in the assembly, the bolt vibration is influenced by the elongation. With the increasing clamping force during bolt rotations, the tensile force increases. Since the vibration response was measured in the transverse direction, the bolt was assumed as the beam with tensile axial load. The equation of motion for the beam with tension is given as [45,46]:
D 4 w ζ 4 T 2 w ζ 2 + M 2 w t 2 = 0
where D is the bending stiffness, w is the beam deflection, ζ is the coordinate of vibration measurement, T is the axial load, and M is the mass per unit length.
The harmonic solution of the bolt deflection is assumed as [47]:
w ( ζ ) = A 1 sin ( k b 1 ζ ) + A 2 cos ( k b 1 ζ ) + A 3 e k b 2 ( ζ L ) + A 4 e k b 2 ζ
where A n ( n = 1 , 2 , 3 , 4 ) are the coefficients related to the boundary condition, k b n ( n = 1 , 2 ) is the wavenumber, and L is the length of the bolt. Wavenumbers are expressed as [45,46]:
k b 1 , 2 = ( ± T 2 D ) + { ( T 2 D ) 2 + ω 2 M D }
where ω is angular frequency.

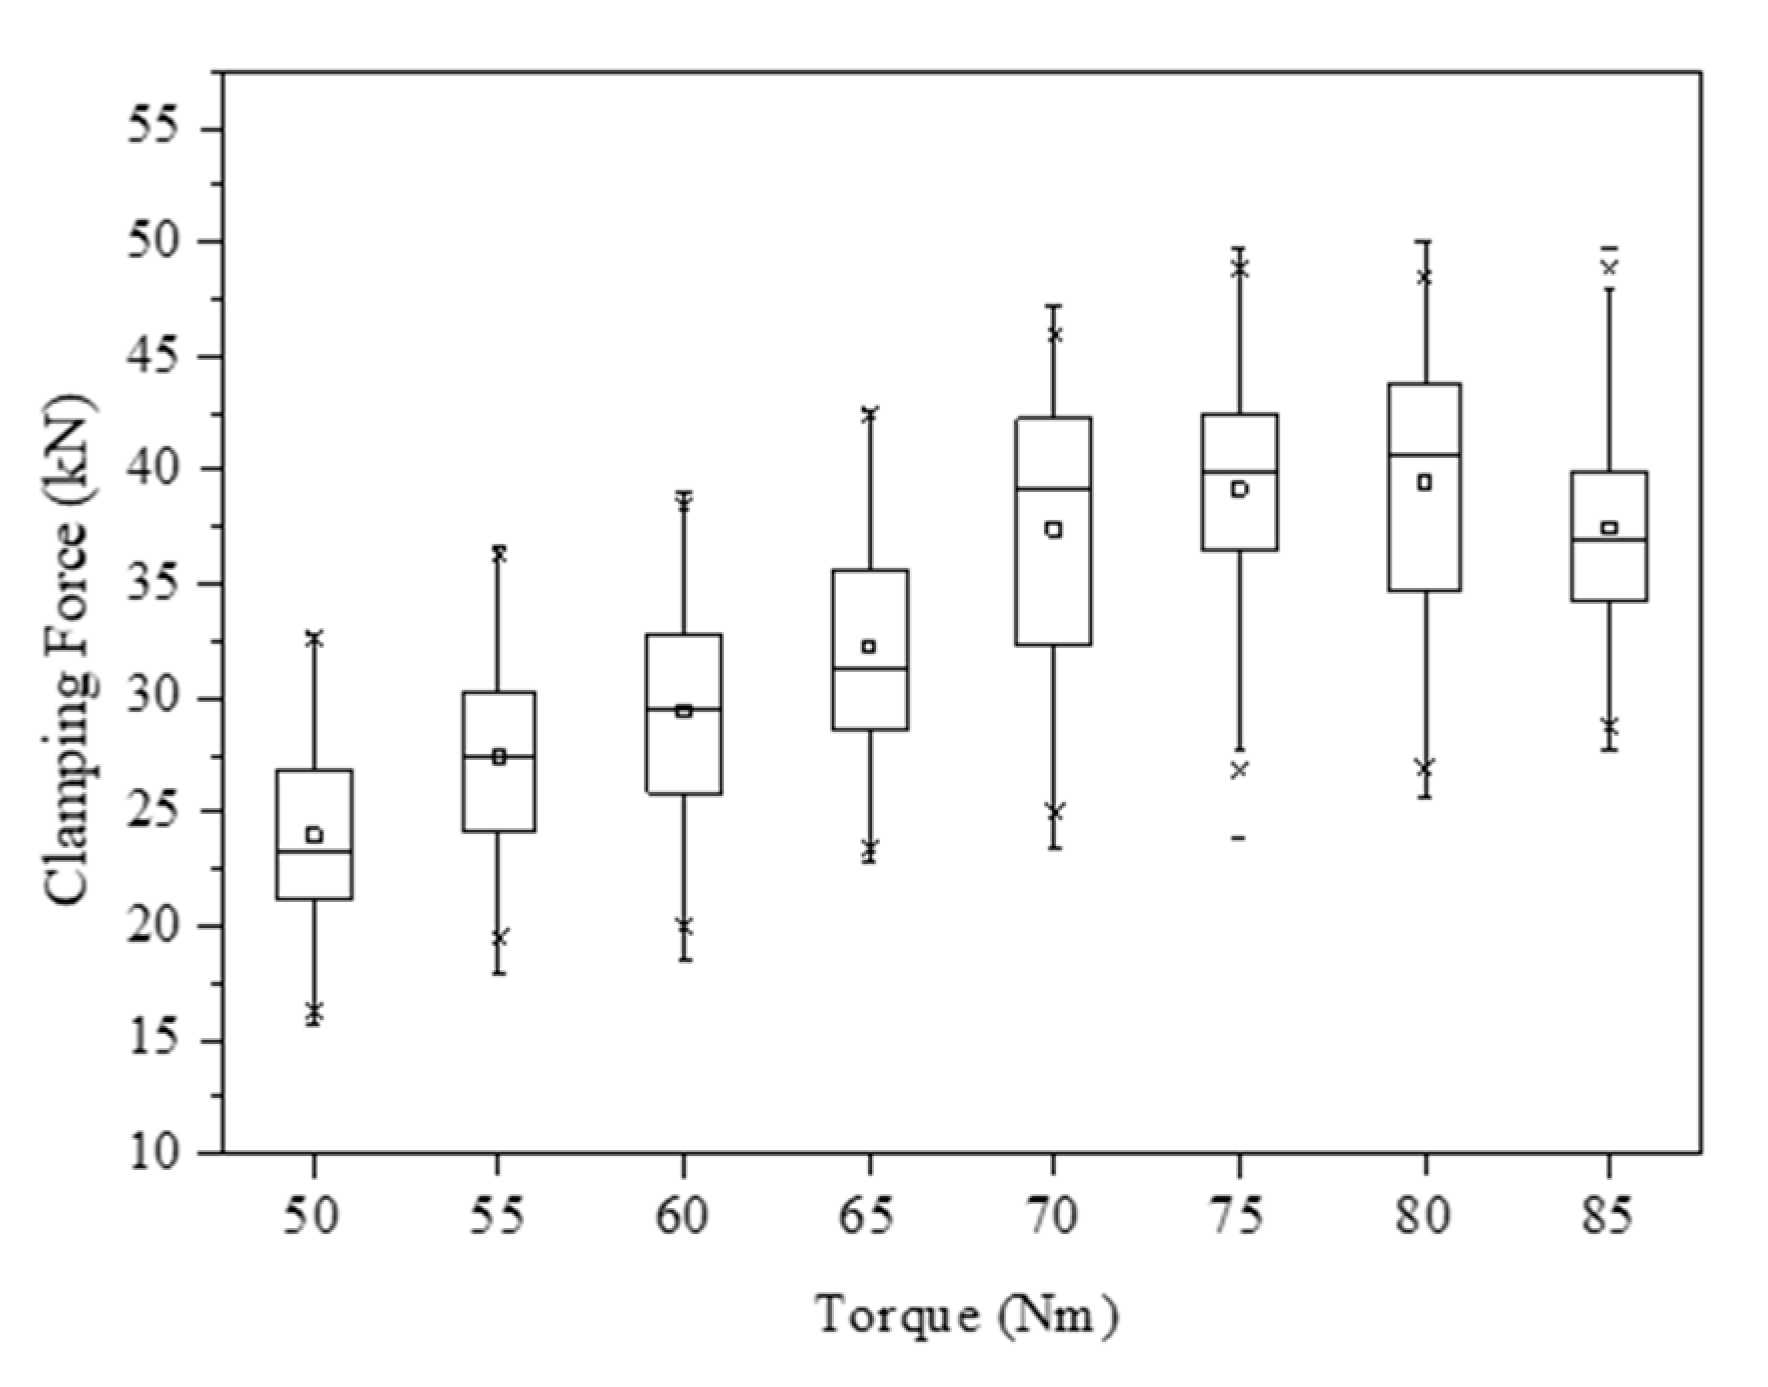
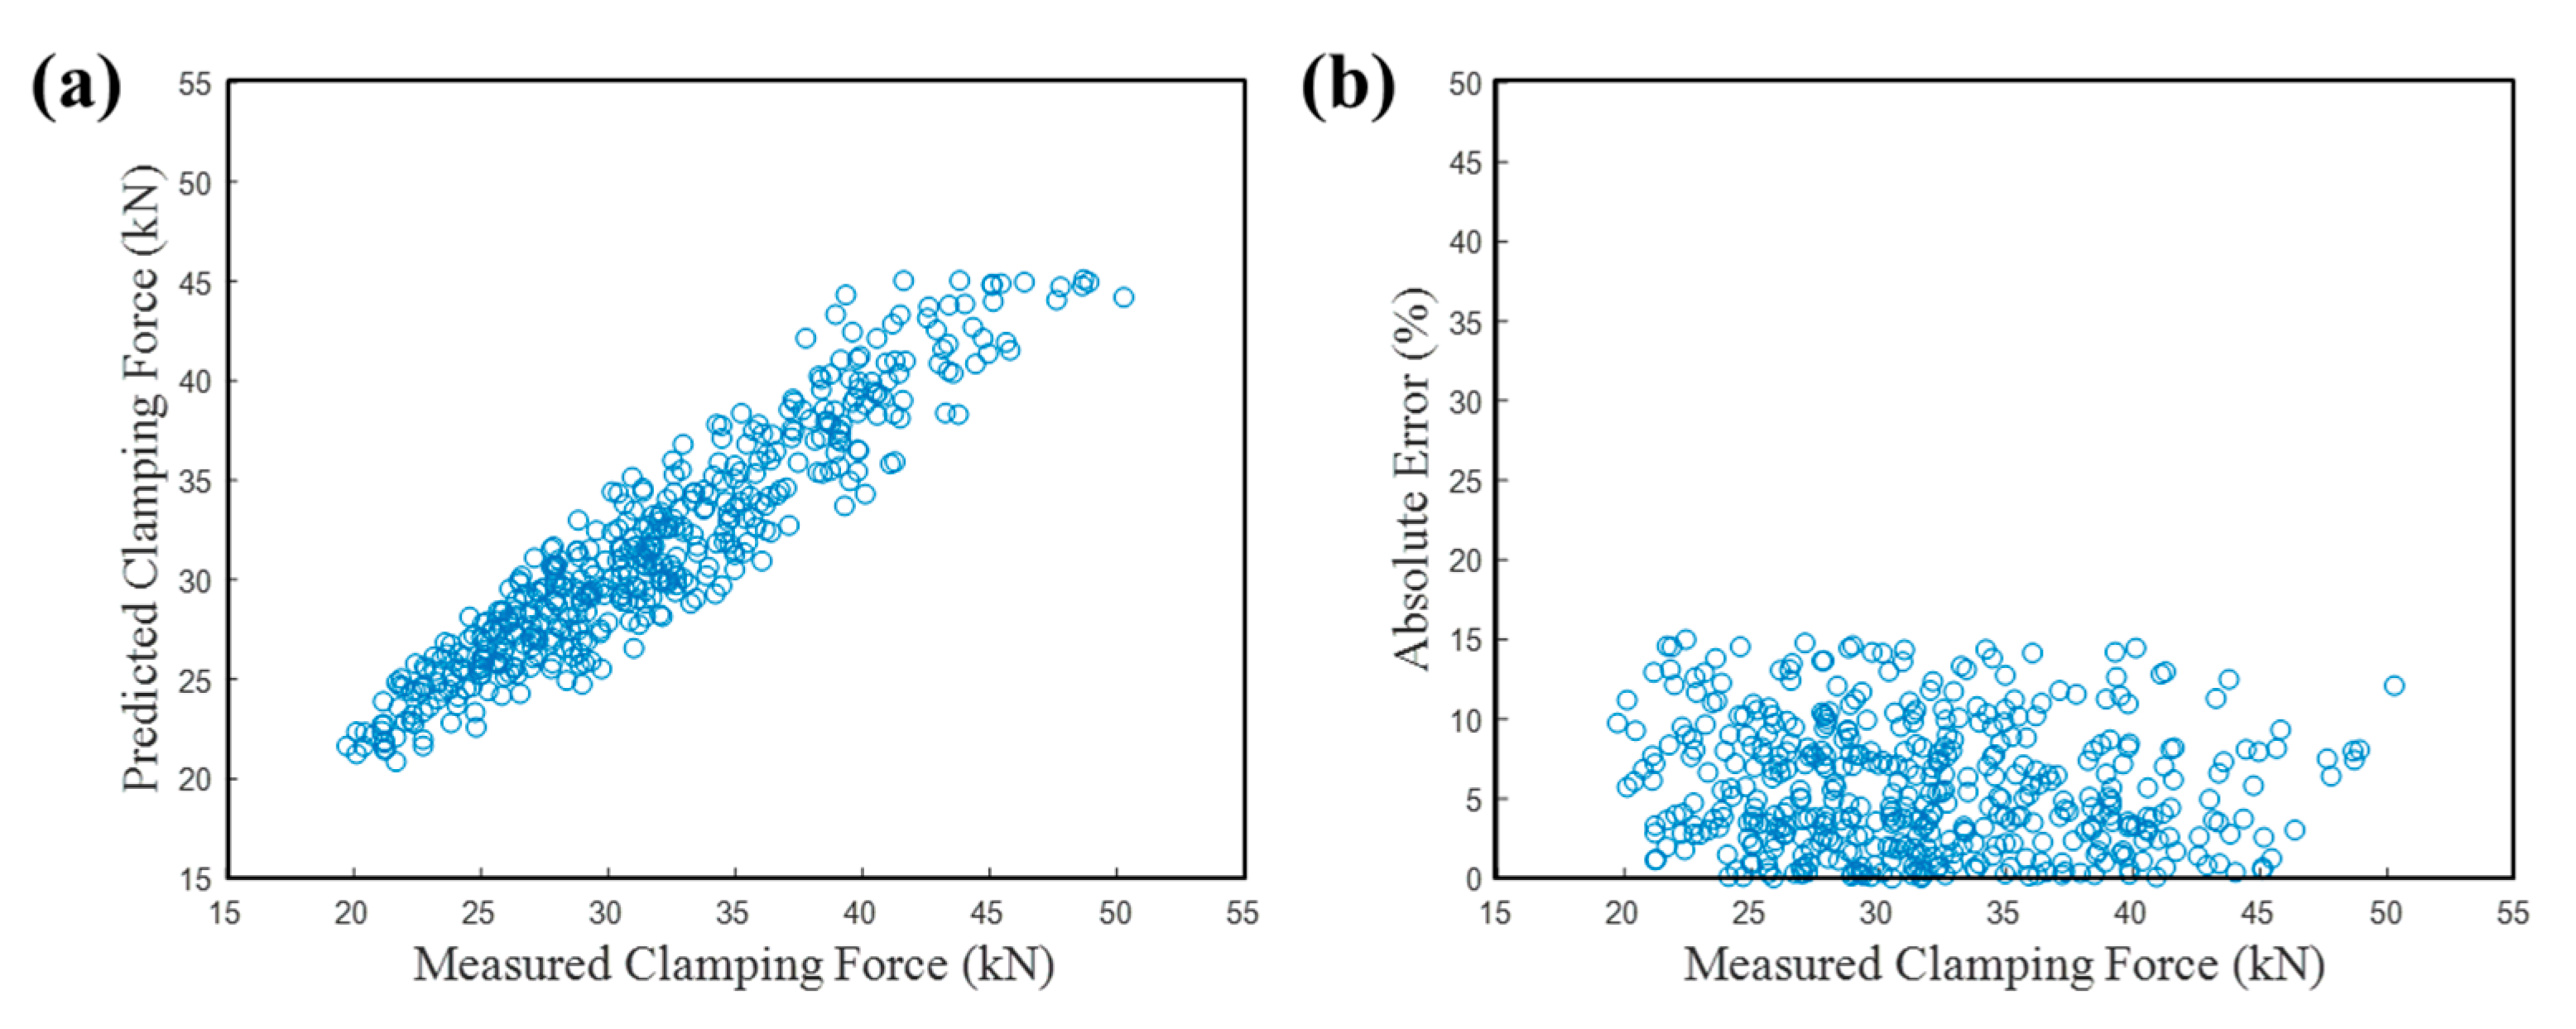
3.3. Clamping on a Load Cell

Experiments were performed to fasten bolts to the load cell, as shown in Figure 3. The bolt was made of SCM435 and galvanized GEOMET®. The length of the bolt was 70 mm and the diameter was 10 mm. The standard bolted pitch was 1.25 mm. An accelerometer PCB 352A21/NC was attached to the load cell to measure the vibration of the bolt during fastening. The bolts were fastened at a constant speed using an electric Atlas Copco nutrunner. The data acquisition system (NI cDAQ-9178 and NI 9234) was used to receive the vibration signal from the accelerometer and the data processing was performed with MATLAB.
When the bolt was excited during the fastening process using a nutrunner, a dynamic characteristic that changes according to the fastening force was measured by an accelerometer. Figure 4 shows the short-time Fourier transform (STFT) of the measured vibrations of the load cell. The vibration responses show the change in the resonance frequency with the clamping of the bolt. The bolt started to rotate after 1.2 s. The seating occurred after 1.9 s when the vibration components of the bolt were observed in the vibration responses. The resonant responses occurred in the 8 kHz band in the above experiment. This frequency is similar to the natural frequency of the bolt when clamped at both ends. This suggests that the bolt flexural vibration occurs during the bolt assembly process and that this influences the acceleration measurements. The frequency of the resonant responses increased steadily until about 3.6 s during the fastening process.
For this experiment, bolt tightening was performed with the nutrunner to induce different torques ranging from 50 Nm to 90 Nm. As shown in Figure 5, the bolts were tightened with clamping forces ranging from 15 kN to 50 kN. When the clamping force of each torque was measured, up to 35% error occurred in order to reach the desired clamping force. The distribution of the clamping force was very large when the fastening was performed by controlling the torque. For better estimation, classification was performed using the reference function of Equation (3), using the k-means clustering algorithm. The measured responses and evaluated variables were used. The test set was evaluated in the same manner as for the training detailed in Section 2. The vibration responses measured with the highest clamping force were selected as the references among the variations. The maximum value was obtained when the distance between the reference data and the cluster of each data point was derived using Euclidean distance. The maximum squared Euclidean distance was derived as a comparison method for each vibration response. Figure 6 shows the estimated clamping force from the Euclidean distance. The derived results were curve-fitted using a linear function, and the error between the actual clamping force and the predicted value was compared. The average error was about 5%, which was much smaller than that estimated by the torque. The maximum error was less than 15%. The bolt yielded when tightened with the clamping force larger than 35 kN. It can be seen that the inflection of the data occurred in this vicinity. The proposed clamping force estimation by measurement of the vibration response and its cepstrum allowed precise estimation, which was not possible with torque control methods.

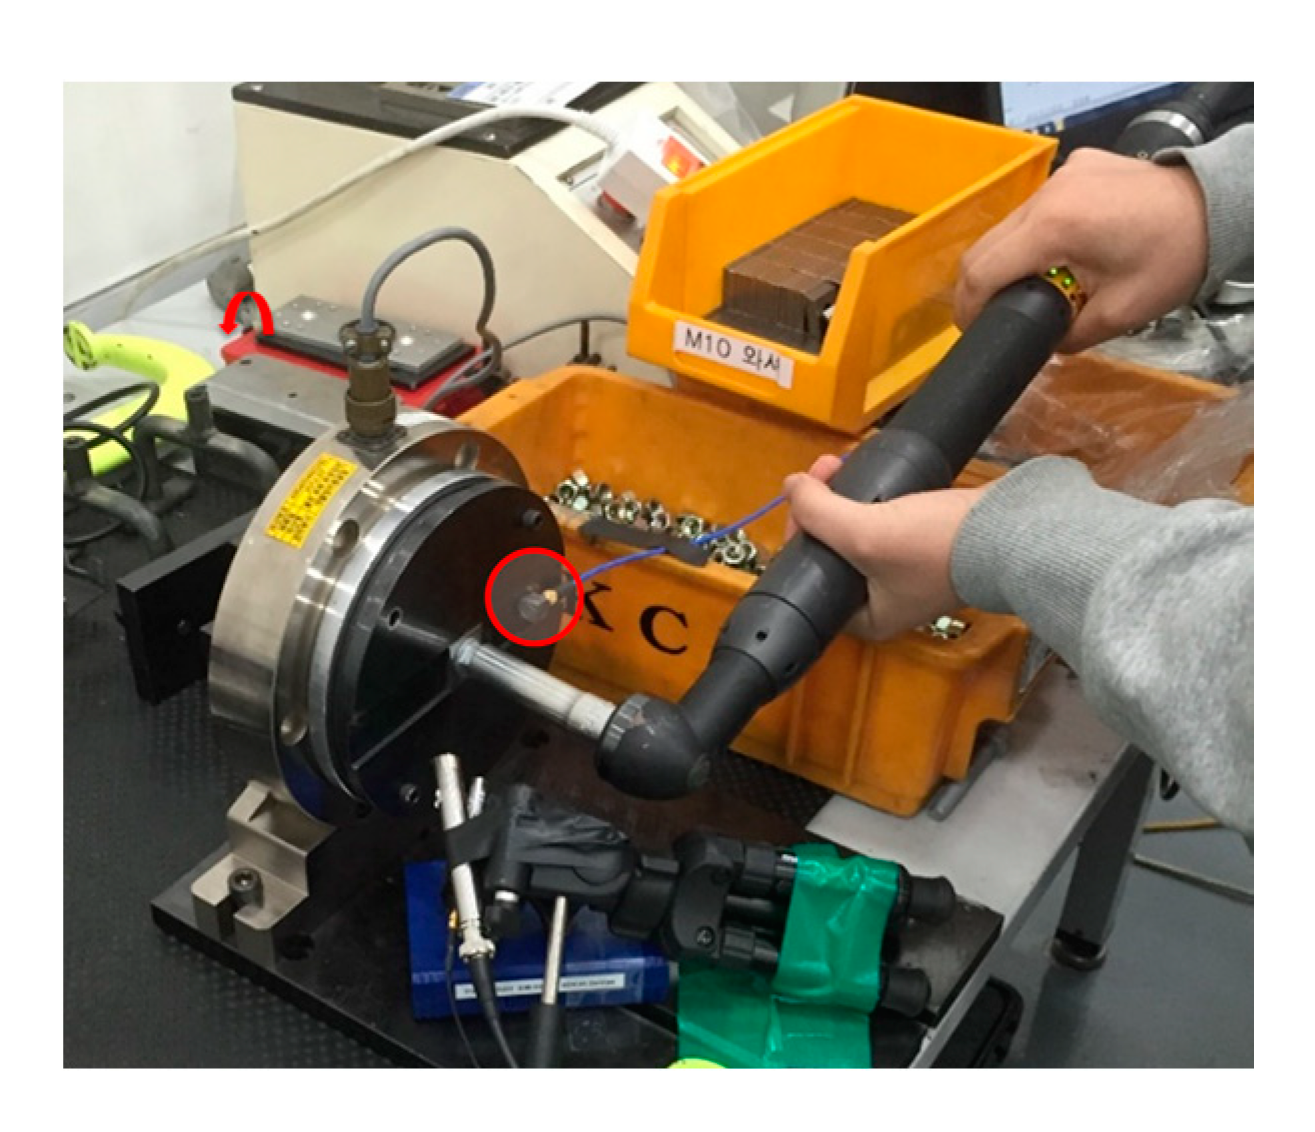
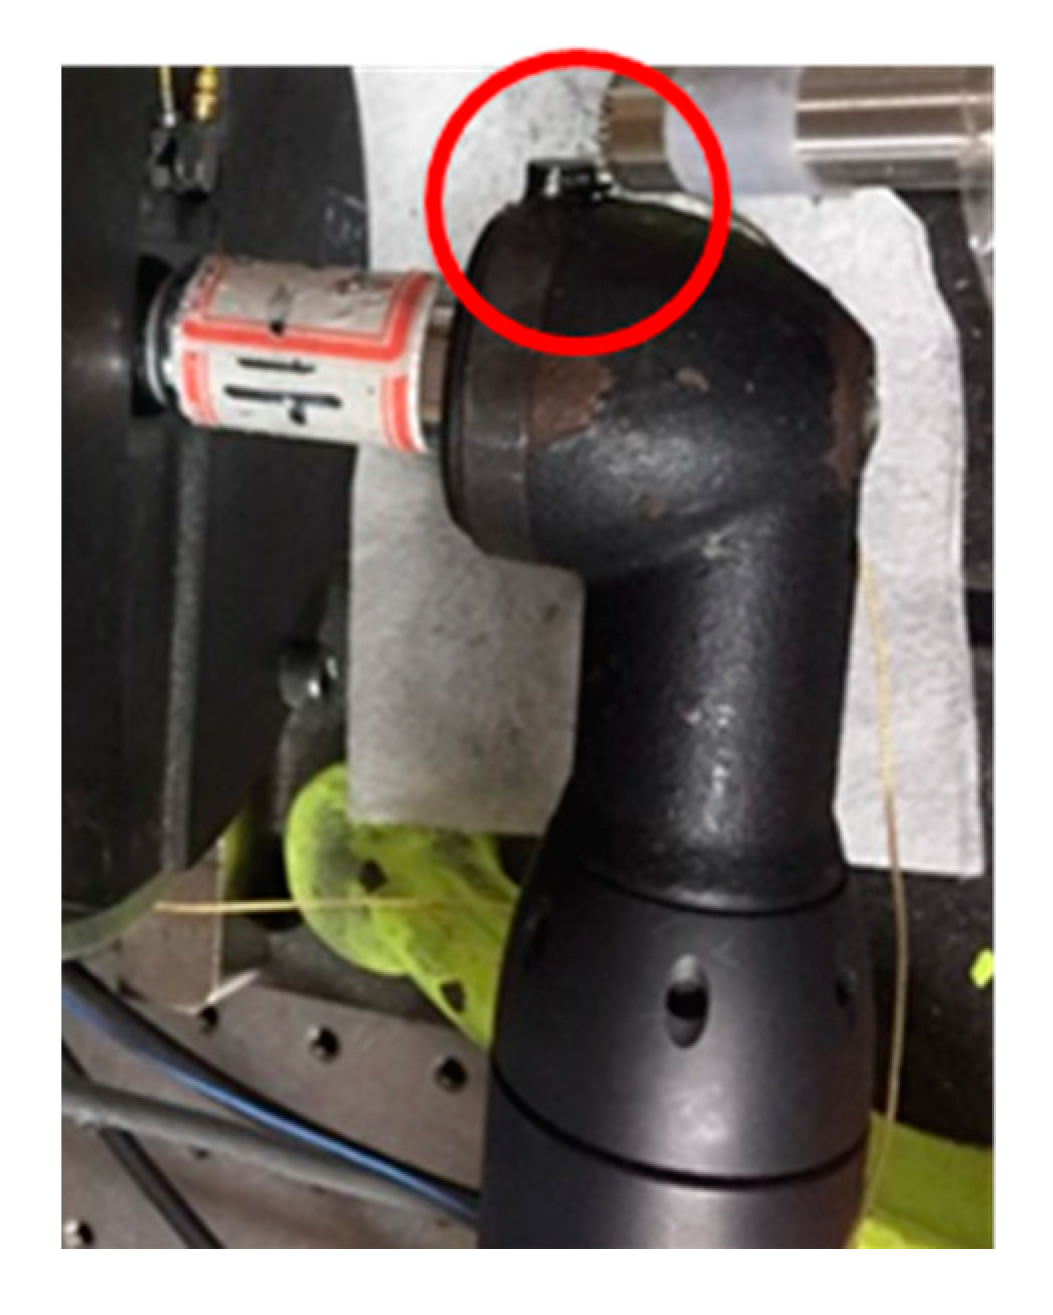
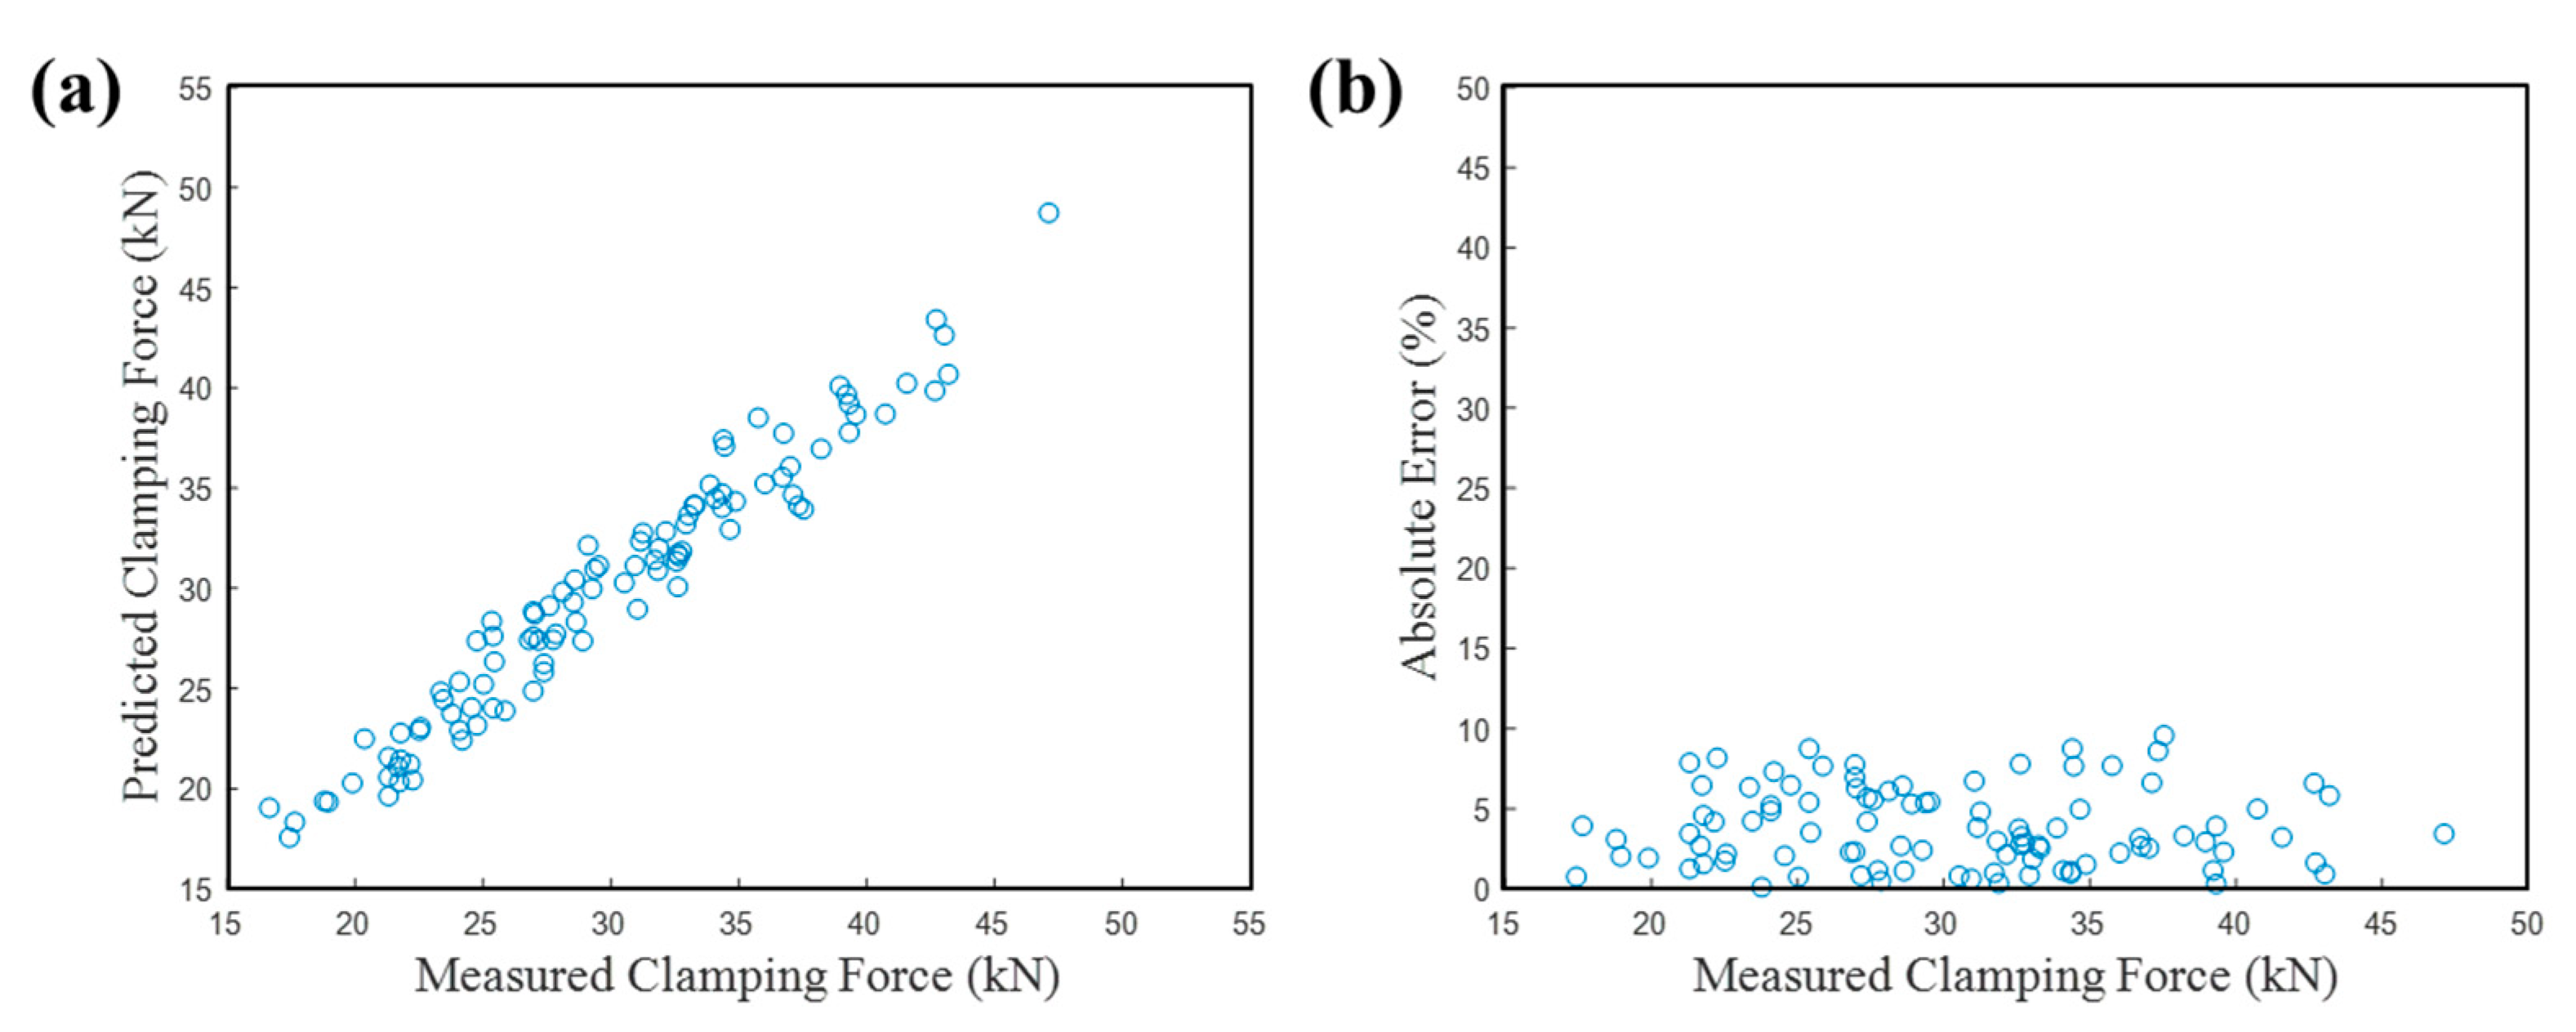
3.4. Test Results with Accelerometer Attached to the Nutrunner

For the experiments on the load cell, the vibration was measured directly on the clamped part. For application during assembly, the acceleration response was measured in the nutrunner to ensure minimal influence on the parts or the manufacturing process. The bolt was rotated using the nutrunner, and strong attachment to the bolt was expected. Four main motions occur when a manual nutrunner is used by an operator [48]. In the fastening step, the vibrations at relatively high frequencies are generated with large amplitude. In the case of idling, the constant frequency components from motor rotations are generated with relatively low amplitude. When an operator holds the nutrunner in his hand, there is an out-of-work signal generated by the hand. Both the amplitude and frequency are relatively low when vibrations are measured during walking. Therefore, the vibration measured on the nutrunner in the fastened state is distinguished from the vibration in the idling state. As the fastening of the bolt proceeds, the vibration characteristic of the bolt changes. The cepstral coefficient was derived using the LFCC to distinguish the changing vibration characteristics. Since the rotational speed of the nutrunner is identical, the fastening components become the significant components. The k-means clustering and Euclidean distance were used to classify the clamping force.
The accelerometer was attached to the head of the nutrunner as close as possible to the bolt, as shown in Figure 7. The accelerometer measured the fastening characteristics, which changed according to the clamping force. Experiments using the accelerometer on the nutrunner were also performed using 500 bolts in the load cell to investigate the applicability. Fastening was performed using the same torque as in the actual production line. Accelerometers were attached to both the load cell and the nutrunner. Compared to the responses measured in the load cell, the vibration of the nutrunner was influenced by the rotating elements, especially below 4 kHz, as shown in Figure 8. In addition, the high-frequency components above 12 kHz were not effectively measured due to attenuation during transfer from the bolt to the nutrunner. The resonant frequency band of the bolt in which the clamping force has influence was measured. Band-pass filtering was applied from 4 to 20 kHz. The k-means clustering algorithm was used to exclude the components below 4 kHz, which include the contribution from rotating elements of the nutrunner. The same parameters of the k-means algorithm as in the experiment of clamping on the load cell were applied. In total, 400 training sets were constructed from 500 vibration measurements to generate fitting curves, and the results were applied to 100 test sets.
In the experiment in which the accelerometer was attached to the nutrunner, the distribution of the clamping force was narrower than that of the previous load-cell experiment, as shown in Figure 4, in which the tightening torque was varied. Figure 9 shows that the clamping forces were in the 35 to 45 kN ranges. The maximum scatter measured by each method is compared in Table 1. The result of estimating the clamping force using the Euclidean distance was confirmed, showing that the estimation is linearly obtained according to the clamping force. Extrapolation is also possible in addition to the measured range. For bolt tightening experiments, only discrete data was considered. It is possible to predict the clamping force sufficiently by using the continuous clamping force diagram.

4. Conclusions

An experimental method is presented to measure the bolt clamping force by acoustic signatures. The change of dynamic characteristics during bolt fastening were investigated by the vibration responses analyzed using cepstral analysis. The short-time spectrum of the vibration responses measured during bolt fastening showed the change of the natural frequency of the bolt. The increased clamping force induced the increasing natural frequency. As the tightening force increased, the vibration components occurred at higher frequencies. The frequency components inevitably induced a change in quefrency from the cepstral analysis. The change in quefrency components was used as the main feature of the k-means clustering algorithm. When the torque was used to monitor the clamping force, there were deviations of more than 30%, as reported in previous studies. When the vibration responses were used to monitor the clamping force, the deviation from the actual value measured by the load cell was smaller than 10%. To apply the proposed method in actual production lines, vibrations of the nutrunner were measured. The responses influenced by the operation of the rubber were analyzed and discarded during the estimation process. By using the components that have a strong influence on the bolt’s natural mode, the estimation was achieved with similar accuracy as that using the vibration of the clamped part. Thus, measurement of the clamping force of bolts fastened in a nondestructive and practical manner for production and with high accuracy was presented. With the use of vibrations in audio frequency ranges (20 Hz–20 kHz), the proposed method benefits big-data configurations and data augmentation necessary for unsupervised learning. In this study, the speech recognition algorithm was applied to the method only to measure the tightening force of the bolts. This method can be applied to experiments with variables that continuously change with time. The proposed methodology also has applications for experiments where the measurement response changes due to attenuation with distance.

Author Contributions

Writing—original draft, G.T.; Conceptualization and Methodology, G.T. and J.P.; Investigation and Validation, G.T. and J.G.; Data curation, J.G.; Writing—Review and Editing, G.T. and J.P.

Funding

This research was supported by Hyundai Motor Group.

Conflicts of Interest

The authors declare no conflict of interest.

References

  1. Ibrahim, R.; Pettit, C. Uncertainties and dynamic problems of bolted joints and other fasteners. J. Sound Vib. 2005, 279, 857–936. [Google Scholar] [CrossRef]
  2. Thoppul, S.D.; Finegan, J.; Gibson, R.F. Mechanics of mechanically fastened joints in polymer-matrix composite structures—A review. Compos. Sci. Technol. 2009, 69, 301–329. [Google Scholar] [CrossRef]
  3. Adel, F.; Shokrollahi, S.; Jamal-Omidi, M.; Ahmadian, H. A model updating method for hybrid composite/aluminum bolted joints using modal test data. J. Sound Vib. 2017, 396, 172–185. [Google Scholar] [CrossRef]
  4. Cole, G.; Sherman, A. Light weight materials for automotive applications. Mater. Charact. 1995, 35, 3–9. [Google Scholar] [CrossRef]
  5. Chronopoulos, D.; Troclet, B.; Bareille, O.; Ichchou, M. Modeling the response of composite panels by a dynamic stiffness approach. Compos. Struct. 2013, 96, 111–120. [Google Scholar] [CrossRef]
  6. Liu, Q.; Sun, H.; Wang, T.; Qing, X. On-Site Health Monitoring of Composite Bolted Joint Using Built-In Distributed Eddy Current Sensor Network. Materials 2019, 12, 2785. [Google Scholar] [CrossRef] [PubMed] [Green Version]
  7. Zenkert, D. An Introduction to Sandwich Construction; Engineering Materials Advisory Services: Cradley Heath, Warley, UK, 1995. [Google Scholar]
  8. Sui, N.; Yan, X.; Huang, T.-Y.; Xu, J.; Yuan, F.-G.; Jing, Y. A lightweight yet sound-proof honeycomb acoustic metamaterial. Appl. Phys. Lett. 2015, 106, 171905. [Google Scholar] [CrossRef]
  9. Yin, H.; Wang, T.; Yang, D.; Liu, S.; Shao, J.; Li, Y. A smart washer for bolt looseness monitoring based on piezoelectric active sensing method. Appl. Sci. 2016, 6, 320. [Google Scholar] [CrossRef]
  10. Wu, J.; Cui, X.; Xu, Y. A novel RFID-based sensing method for low-cost bolt loosening monitoring. Sensors 2016, 16, 168. [Google Scholar] [CrossRef] [Green Version]
  11. Xu, J.; Wang, C.; Li, H.; Zhang, C.; Hao, J.; Fan, S. Health monitoring of bolted spherical joint connection based on active sensing technique using piezoceramic transducers. Sensors 2018, 18, 1727. [Google Scholar] [CrossRef] [Green Version]
  12. Xu, J.; Dong, J.; Li, H.; Zhang, C.; Ho, S.C. Looseness Monitoring of Bolted Spherical Joint Connection Using Electro-Mechanical Impedance Technique and BP Neural Networks. Sensors 2019, 19, 1906. [Google Scholar] [CrossRef] [PubMed] [Green Version]
  13. Huynh, T.-C.; Dang, N.-L.; Kim, J.-T. Preload monitoring in bolted connection using piezoelectric-based smart interface. Sensors 2018, 18, 2766. [Google Scholar] [CrossRef] [PubMed] [Green Version]
  14. Oregui, M.; Li, S.; Núñez, A.; Li, Z.; Carroll, R.; Dollevoet, R. Monitoring bolt tightness of rail joints using axle box acceleration measurements. Struct. Control Health Monit. 2017, 24, e1848. [Google Scholar] [CrossRef] [Green Version]
  15. Zhang, Z.; Liu, M.; Liao, Y.; Su, Z.; Xiao, Y. Contact acoustic nonlinearity (CAN)-based continuous monitoring of bolt loosening: Hybrid use of high-order harmonics and spectral sidebands. Mech. Syst. Signal Process. 2018, 103, 280–294. [Google Scholar] [CrossRef]
  16. Yeager, M.; Whitaker, A.; Todd, M. A method for monitoring bolt torque in a composite connection using an embedded fiber Bragg grating sensor. J. Intell. Mater. Syst. Struct. 2018, 29, 335–344. [Google Scholar] [CrossRef]
  17. Yeaple, F. Bolt torque equations predict stresses. Prod. Eng. 1978, 49, 28–33. [Google Scholar]
  18. Bickford, J. Handbook of Bolts and Bolted Joints; CRC press: Boca Raton, FL, USA, 1998. [Google Scholar]
  19. Joshi, S.; Pathare, R. Ultrasonic instrument for measuring bolt stress. Ultrasonics 1984, 22, 261–269. [Google Scholar] [CrossRef]
  20. Nassar, S.A.; Veeram, A.B. Ultrasonic control of fastener tightening using varying wave speed. In Proceedings of the ASME 2005 Pressure Vessels and Piping Conference, Waikoloa, HI, USA, 16–20 July 2017; pp. 189–198. [Google Scholar]
  21. Fukuoka, T.; Takaki, T. Evaluations of the tightening process of bolted joint with elastic angle control method. In Proceedings of the ASME/JSME 2004 Pressure Vessels and Piping Conference, San Diego, CA, USA, 25–29 July 2004; pp. 11–18. [Google Scholar]
  22. Fujinaka, T.; Nakano, H.; Omatu, S. Bolt tightening control using neural networks. In Proceedings of the IEEE International Conference on Systems, Man and Cybernetics. e-Systems and e-Man for Cybernetics in Cyberspace (Cat. No. 01CH37236), Tucson, AZ, USA, 7–10 October 2001; pp. 1390–1395. [Google Scholar]
  23. Vand, E.H.; Oskouei, R.; Chakherlou, T. An experimental method for measuring clamping force in bolted connections and effect of bolt threads lubrication on its value. World Acad. Sci. Eng. Technol. 2008, 22, 457–460. [Google Scholar]
  24. Jhang, K.-Y.; Quan, H.-H.; Ha, J.; Kim, N.-Y. Estimation of clamping force in high-tension bolts through ultrasonic velocity measurement. Ultrasonics 2006, 44, e1339–e1342. [Google Scholar] [CrossRef]
  25. Wang, C.; Wang, N.; Ho, S.-C.; Chen, X.; Pan, M.; Song, G. Design of a novel wearable sensor device for real-time bolted joints health monitoring. IEEE Internet Things J. 2018, 5, 5307–5316. [Google Scholar] [CrossRef]
  26. Chaki, S.; Corneloup, G.; Lillamand, I.; Walaszek, H. Combination of longitudinal and transverse ultrasonic waves for in situ control of the tightening of bolts. J. Press. Vessel Technol. 2007, 129, 383–390. [Google Scholar] [CrossRef]
  27. Liu, Z.; Zhou, C.; Lu, Y.; Yang, X.; Liang, Y.; Zhang, L. Application of FRP bolts in monitoring the internal force of the rocks surrounding a mine-shield tunnel. Sensors 2018, 18, 2763. [Google Scholar] [CrossRef] [PubMed] [Green Version]
  28. Tiwari, V. MFCC and its applications in speaker recognition. Int. J. Emerg. Technol. 2010, 1, 19–22. [Google Scholar]
  29. Randall, R.B.; Tech, B. Frequency Analysis; Brüel & Kjær: Nærum, Denmark, 1987. [Google Scholar]
  30. Bogert, B.; Healy, M.; Tukey, J. The quefrency analysis of time series for echos. In Proceedings of the Symposium on Time Series Analysis; John Willey & Sons: New York, NY, USA, 1962; pp. 209–243. [Google Scholar]
  31. Oppenheim, A.V.; Schafer, R.W. From frequency to quefrency: A history of the cepstrum. IEEE Signal Process. Mag. 2004, 21, 95–106. [Google Scholar] [CrossRef]
  32. Schafer, R.W. Echo Removal by Discrete Generalized Linear Filtering. Ph.D. Thesis, M.I.T., Cambridge, MA, USA, 1969. [Google Scholar]
  33. Randall, R.B. A history of cepstrum analysis and its application to mechanical problems. Mech. Syst. Signal Process. 2017, 97, 3–19. [Google Scholar] [CrossRef]
  34. Hasan, M.R.; Jamil, M.; Rahman, M. Speaker identification using mel frequency cepstral coefficients. Variations 2004, 1, 565–568. [Google Scholar]
  35. Dib, L.; Carbone, A. CLAG: An unsupervised non hierarchical clustering algorithm handling biological data. BMC Bioinform. 2012, 13, 194. [Google Scholar] [CrossRef]
  36. Drineas, P.; Frieze, A.; Kannan, R.; Vempala, S.; Vinay, V. Clustering large graphs via the singular value decomposition. Mach. Learn. 2004, 56, 9–33. [Google Scholar] [CrossRef] [Green Version]
  37. Arthur, D.; Vassilvitskii, S. k-means++: The advantages of careful seeding. In Proceedings of the Eighteenth Annual ACM-SIAM Symposium on Discrete Algorithms, New Orleans, LA, USA, 7–9 January 2007; pp. 1027–1035. [Google Scholar]
  38. Jain, A.K. Data clustering: 50 years beyond K-means. Pattern Recognit. Lett. 2010, 31, 651–666. [Google Scholar] [CrossRef]
  39. Dunn, J.C. A fuzzy relative of the ISODATA process and its use in detecting compact well-separated clusters. J. Cybern. 1973, 3, 32–57. [Google Scholar] [CrossRef]
  40. Bezdek, J.C. Pattern Recognition with Fuzzy Objective Function Algorithms; Springer Science & Business Media: Norwell, MA, USA, 2013. [Google Scholar]
  41. Pelleg, D.; Moore, A.W. X-means: Extending k-means with efficient estimation of the number of clusters. In Proceedings of the Seventeenth International Conference on Machine Learning (ICML), Stanford, CA, USA, 26 June–2 July 2000; pp. 727–734. [Google Scholar]
  42. Pelleg, D.; Moore, A. Accelerating Exact k-Means Algorithms with Geometric Reasoning; Carnegie-Mellon University Pittsburgh PA School of Computer Science: Pittsburgh, PA, USA, 2000. [Google Scholar]
  43. Yiakopoulos, C.; Gryllias, K.C.; Antoniadis, I.A. Rolling element bearing fault detection in industrial environments based on a K-means clustering approach. Expert Syst. Appl. 2011, 38, 2888–2911. [Google Scholar] [CrossRef]
  44. Timoshenko, S. History of Strength of Materials: With a Brief Account of the History of Theory of Elasticity and Theory of Structures; Courier Corporation: North Chelmsford, MA, USA, 1983. [Google Scholar]
  45. Bokaian, A. Natural frequencies of beams under compressive axial loads. J. Sound Vib. 1988, 126, 49–65. [Google Scholar] [CrossRef]
  46. Bokaian, A. Natural frequencies of beams under tensile axial loads. J. Sound Vib. 1990, 142, 481–498. [Google Scholar] [CrossRef]
  47. Park, J. Transfer function methods to measure dynamic mechanical properties of complex structures. J. Sound Vib. 2005, 288, 57–79. [Google Scholar] [CrossRef]
  48. Won, S.-H.P.; Golnaraghi, F.; Melek, W.W. A fastening tool tracking system using an IMU and a position sensor with Kalman filters and a fuzzy expert system. IEEE Trans. Ind. Electron. 2008, 56, 1782–1792. [Google Scholar] [CrossRef]
Figure 1. Bolt specimen and measurement setup for the natural bolt frequency.
Applsci 09 05379 g001
Figure 2. The vibration responses of the bolt when excited by an impact hammer when clamped. The natural frequency appeared at 8000 Hz.
Applsci 09 05379 g002
Figure 3. Experimental setup for bolt tightening to the load cell using a nutrunner. The load cell vibration was measured by the accelerometer (PCB, 352A21/NC).
Applsci 09 05379 g003
Figure 4. Short-time spectrum of the bolt fastening signal.
Applsci 09 05379 g004
Figure 5. The influence of the applied torque on the resulting clamping force. When the same torque was applied, the clamping force showed more than 30% deviations.
Applsci 09 05379 g005
Figure 6. (a) Scatter of estimated clamping forces using accelerometer on load cell compared to the actual value, and (b) relative deviations.
Applsci 09 05379 g006
Figure 7. Vibration measurement with the accelerometer attached to the head of the nutrunner (red circle).
Applsci 09 05379 g007
Figure 8. Change of the spectral characteristics with time (the increase of the clamping force) for the vibration measured on the nutrunner.
Applsci 09 05379 g008
Figure 9. Scatter of clamping force estimated using accelerometer on nutrunner. (a) Estimated clamping force by vibration measurements and (b) relative deviations.
Applsci 09 05379 g009
Table 1. Deviations of the clamping force for the constant torque tightening.
Torque MeasurementLoad Cell Vibration MeasurementNut Runner Vibration Measurement
35.83%14.99%9.57%

