Invasive Weed Optimization Technique-Based ANN to the Prediction of Rock Tensile Strength


 ,
, 
Abstract
1. Introduction
- To create an appropriate database applicable for the prediction of TS.
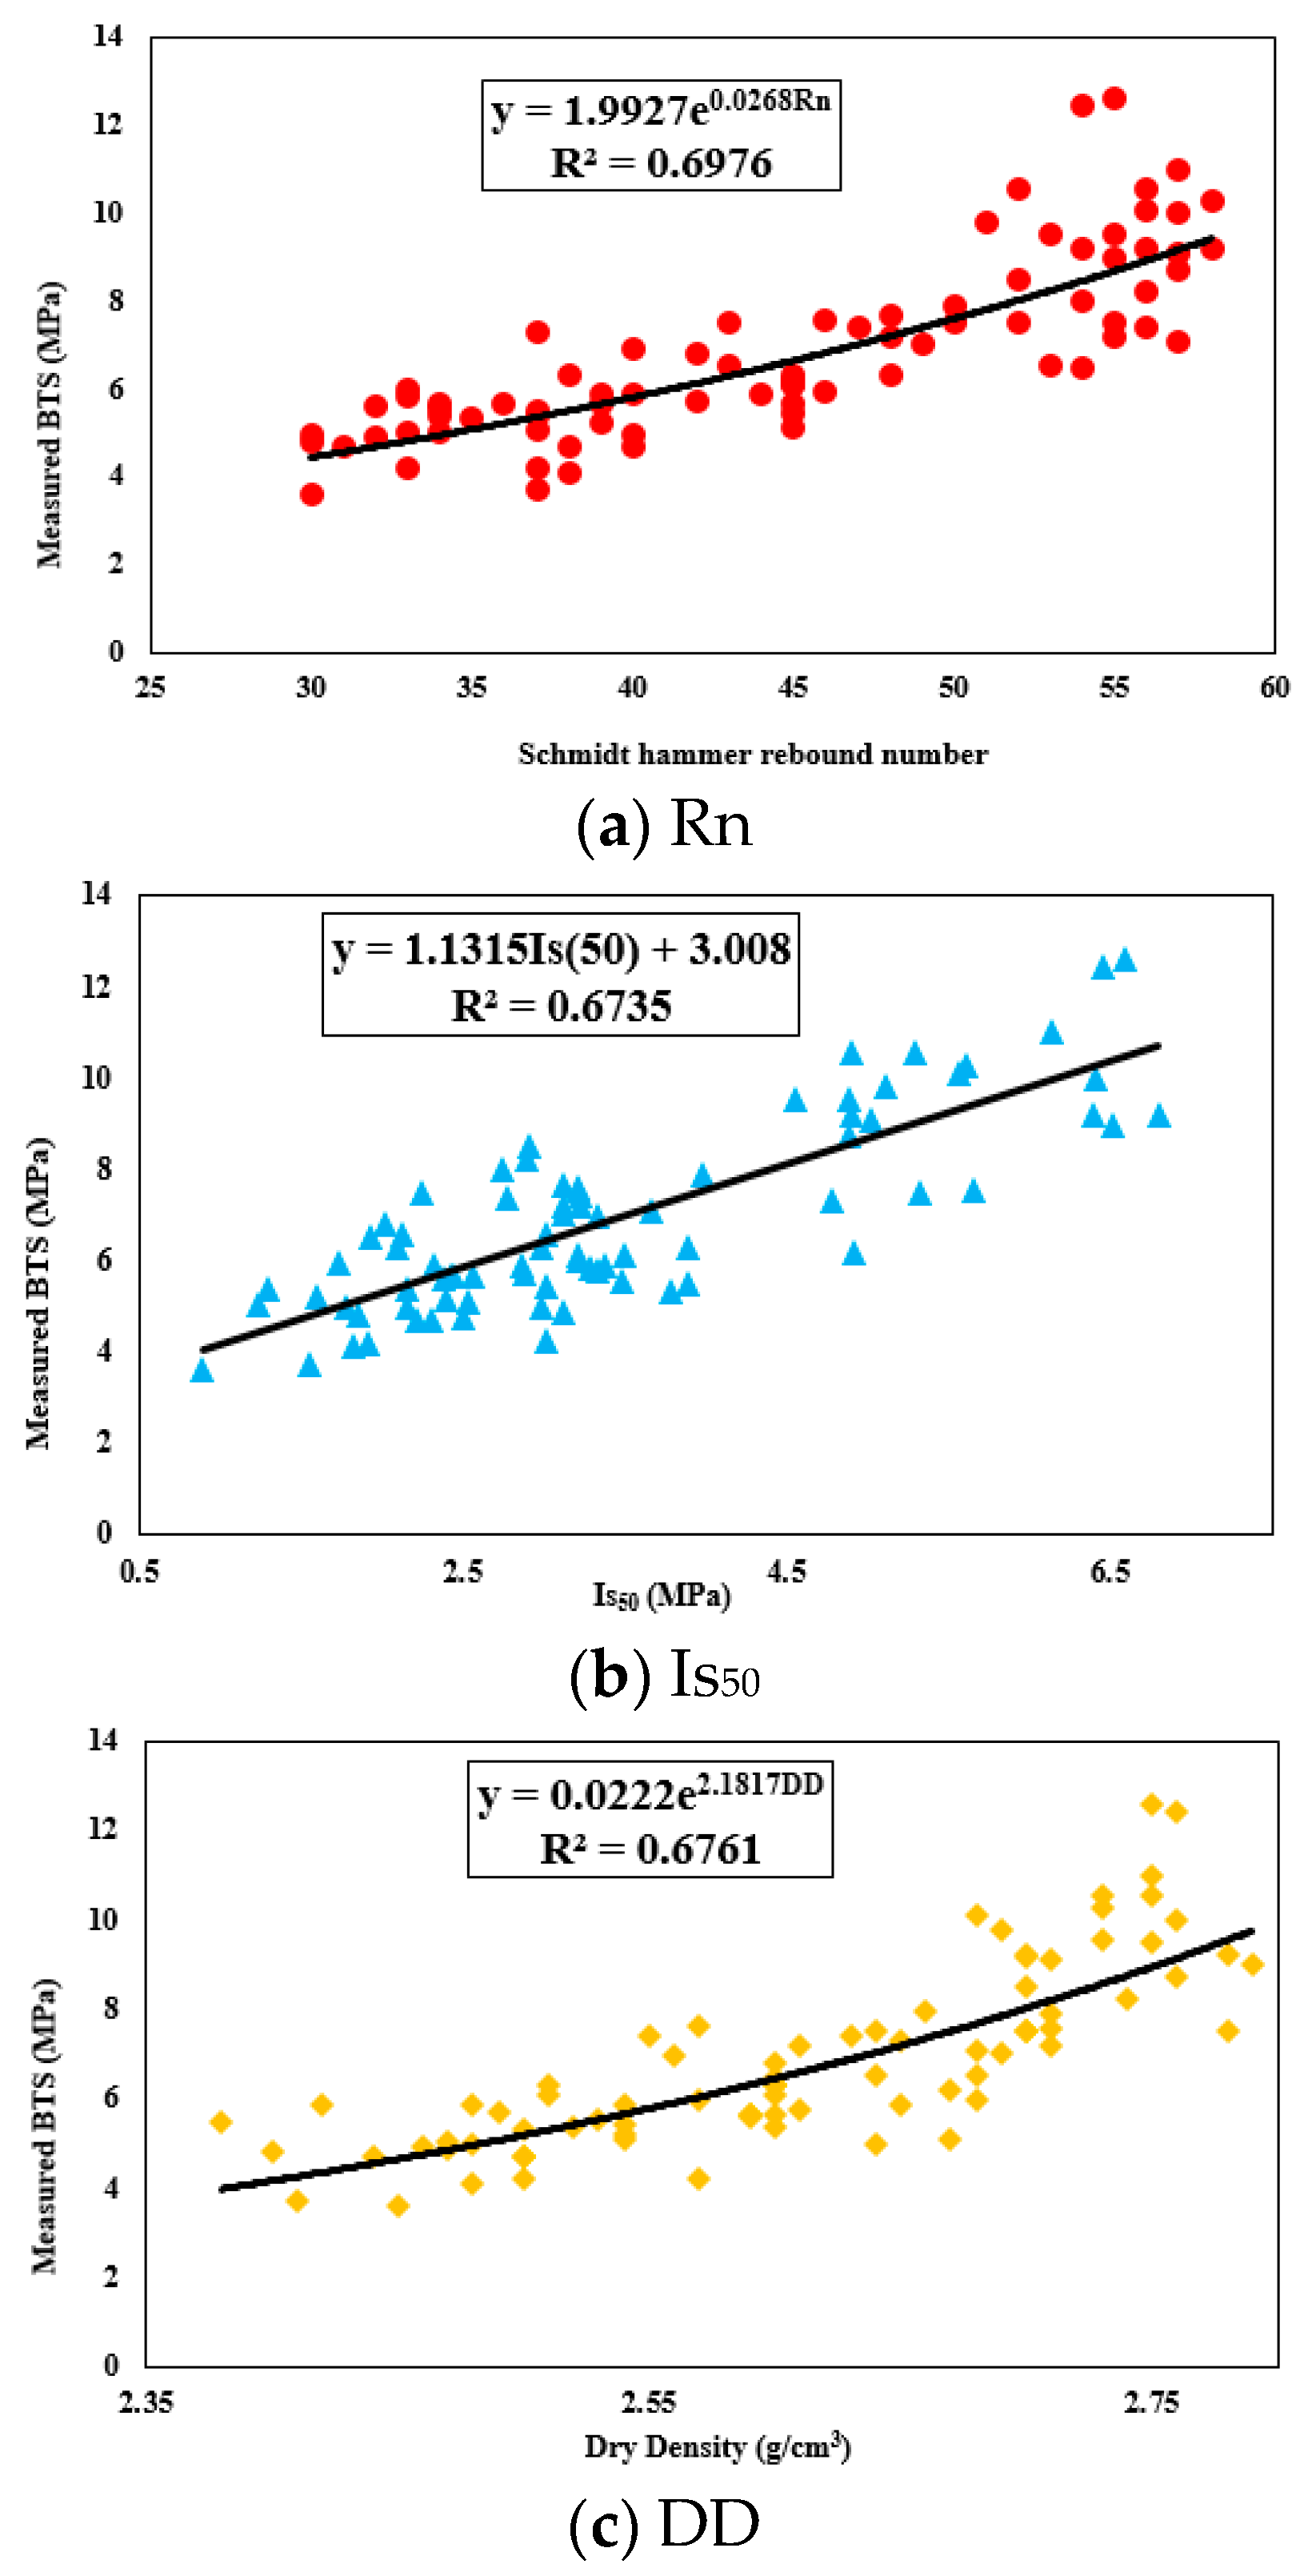
- To develop a number of novel equations by means of simple regression analysis.
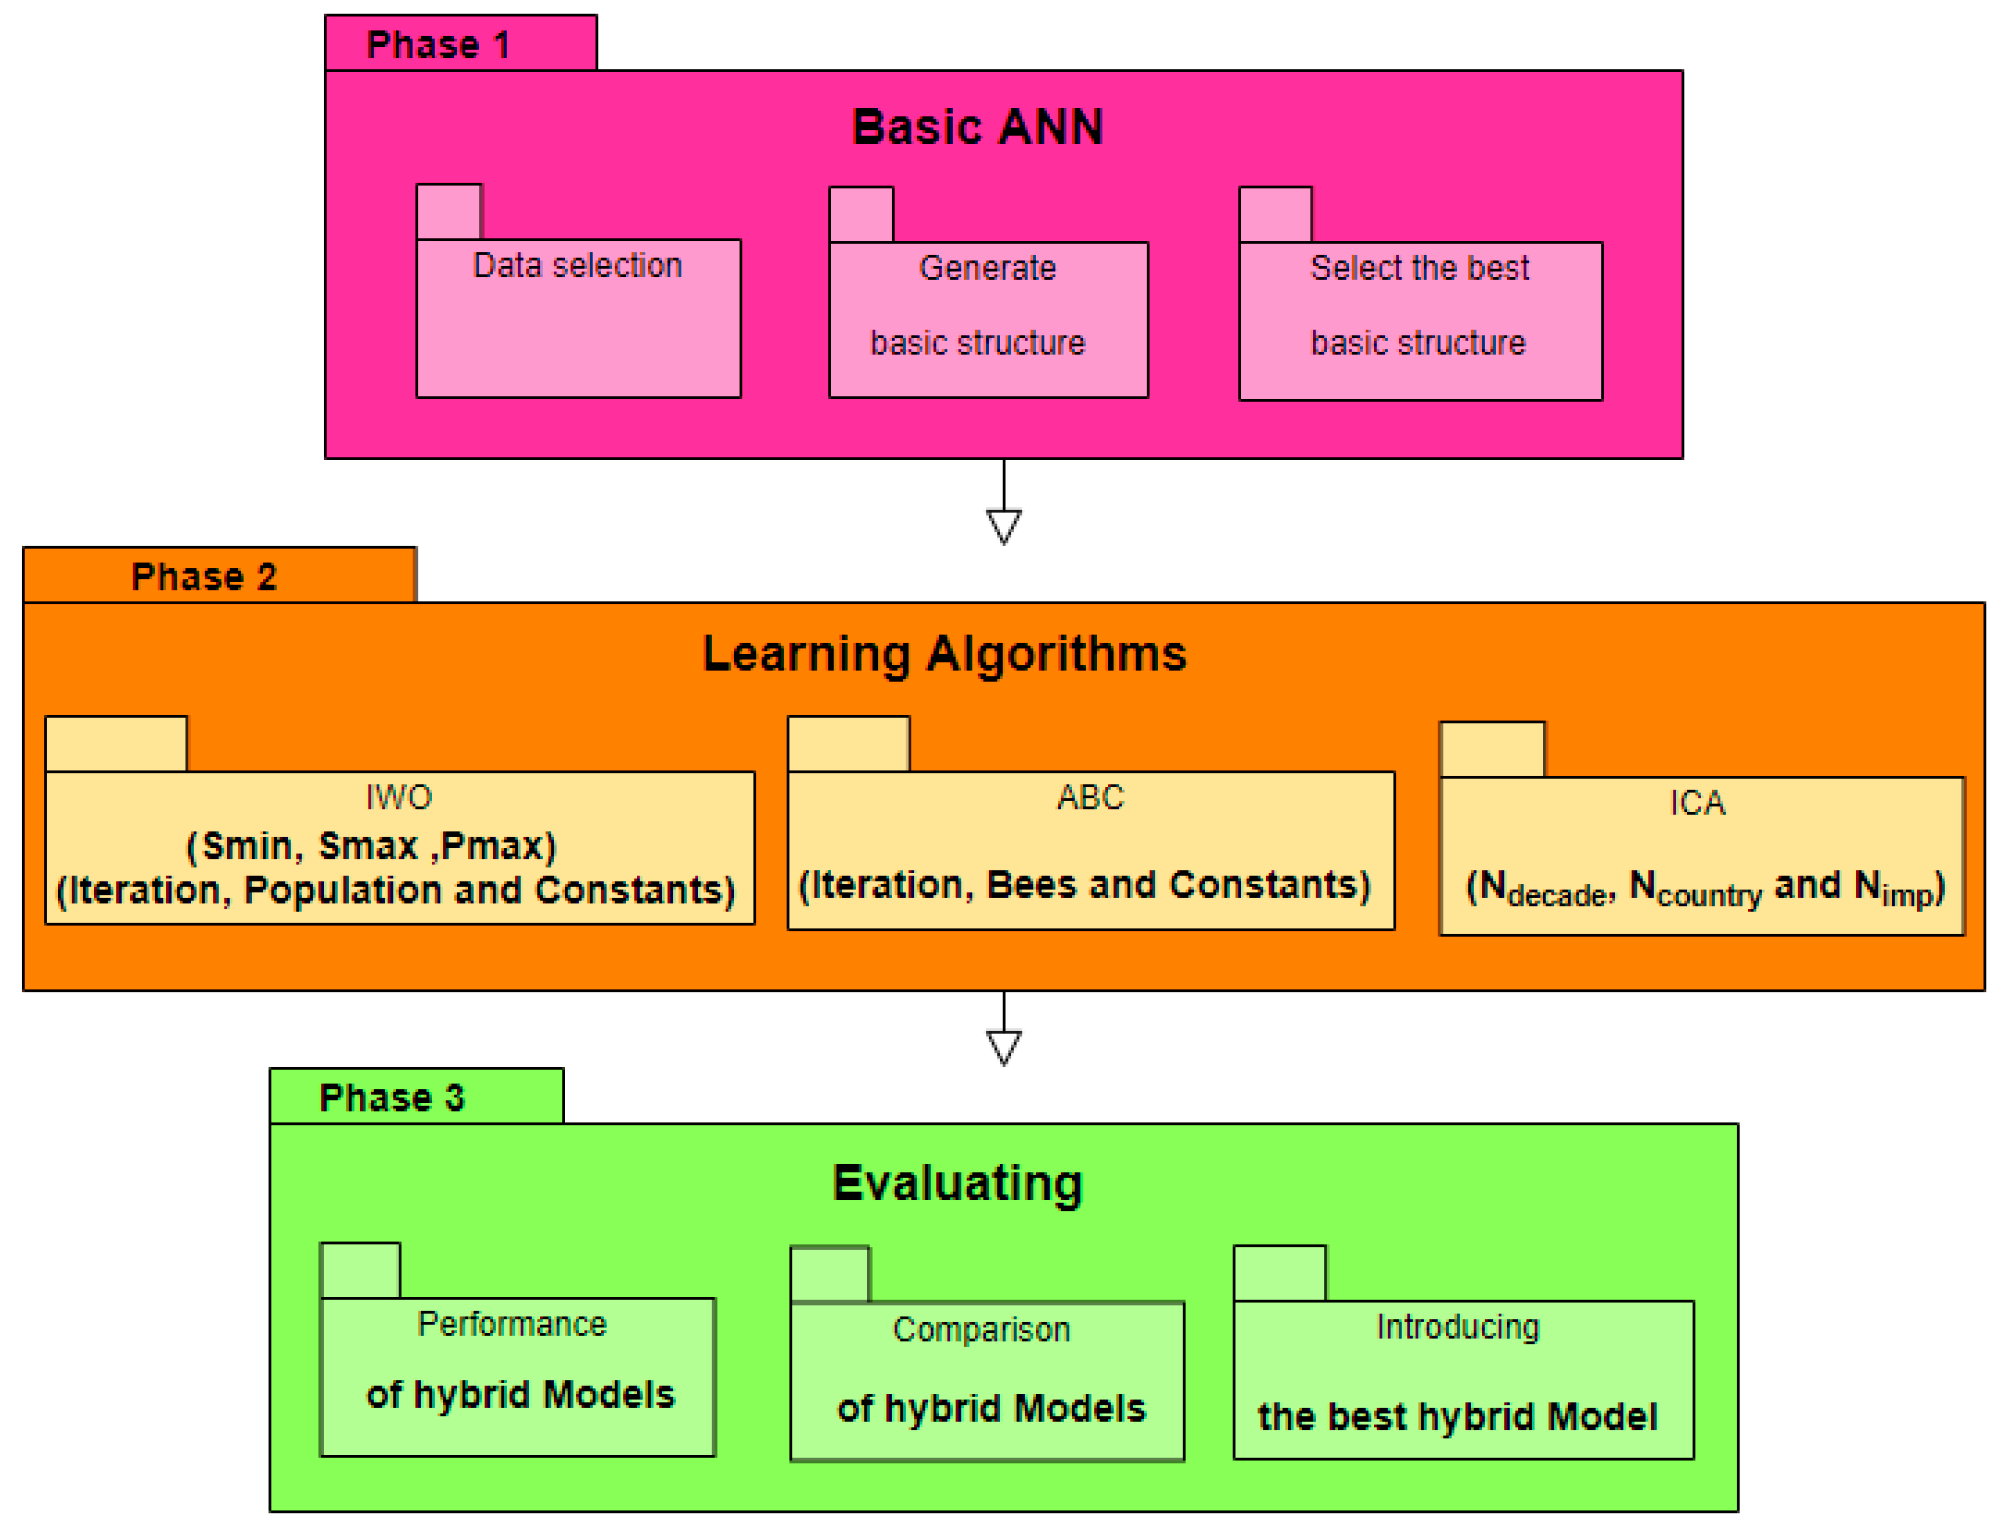
- To design three hybrid intelligent models: IWO-ANN, ABC-ANN, and ICA-ANN.
- To propose a hybrid intelligent model of the highest accuracy in predicting rock TS.
2. Laboratory Experiments and Regression Analysis
3. Methodology
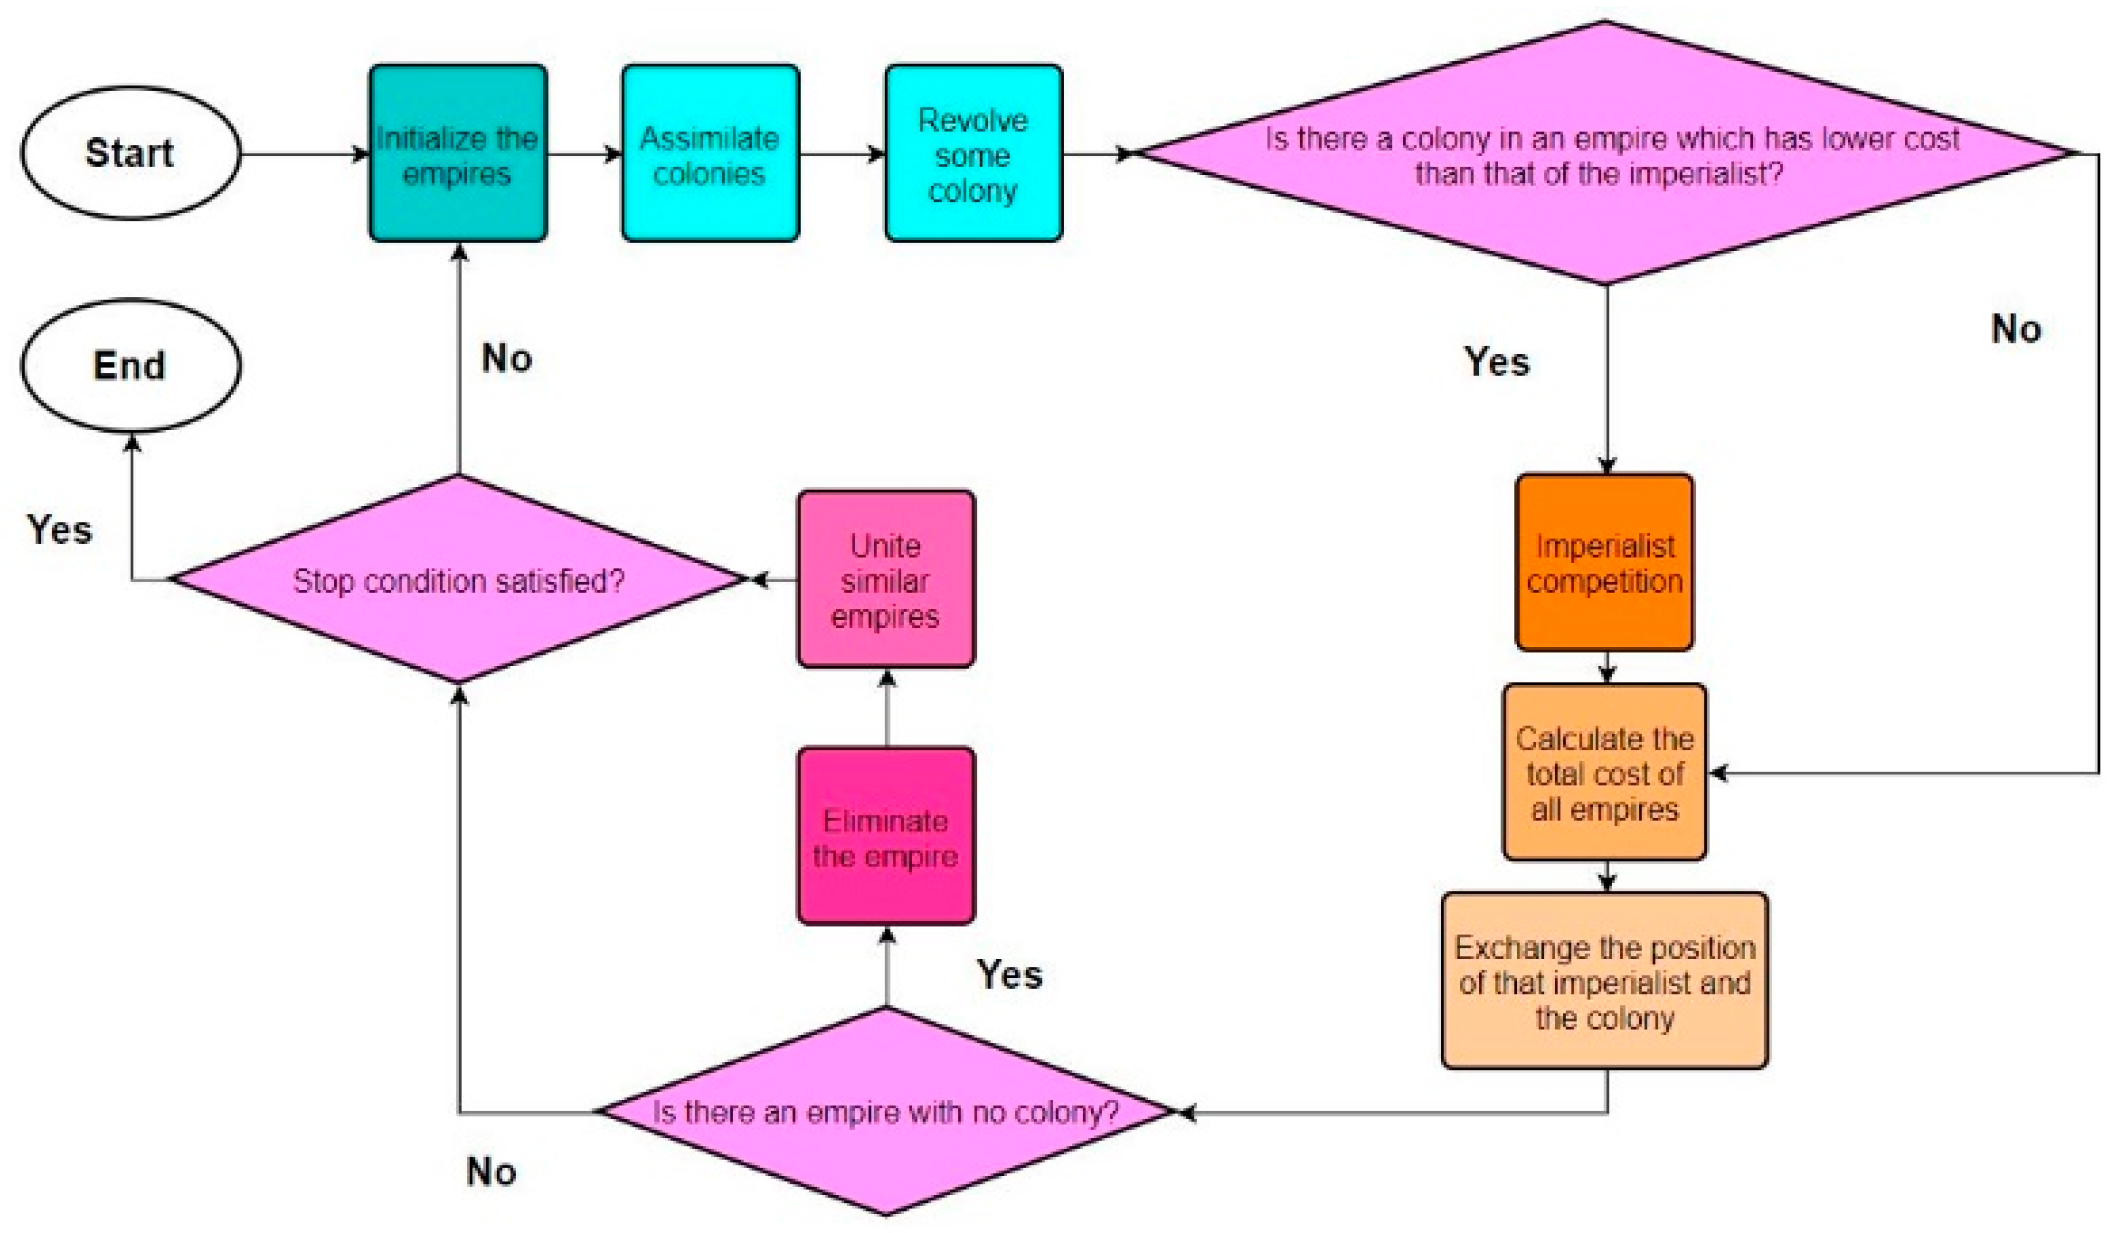
3.1. Imperialist Competitive Algorithm
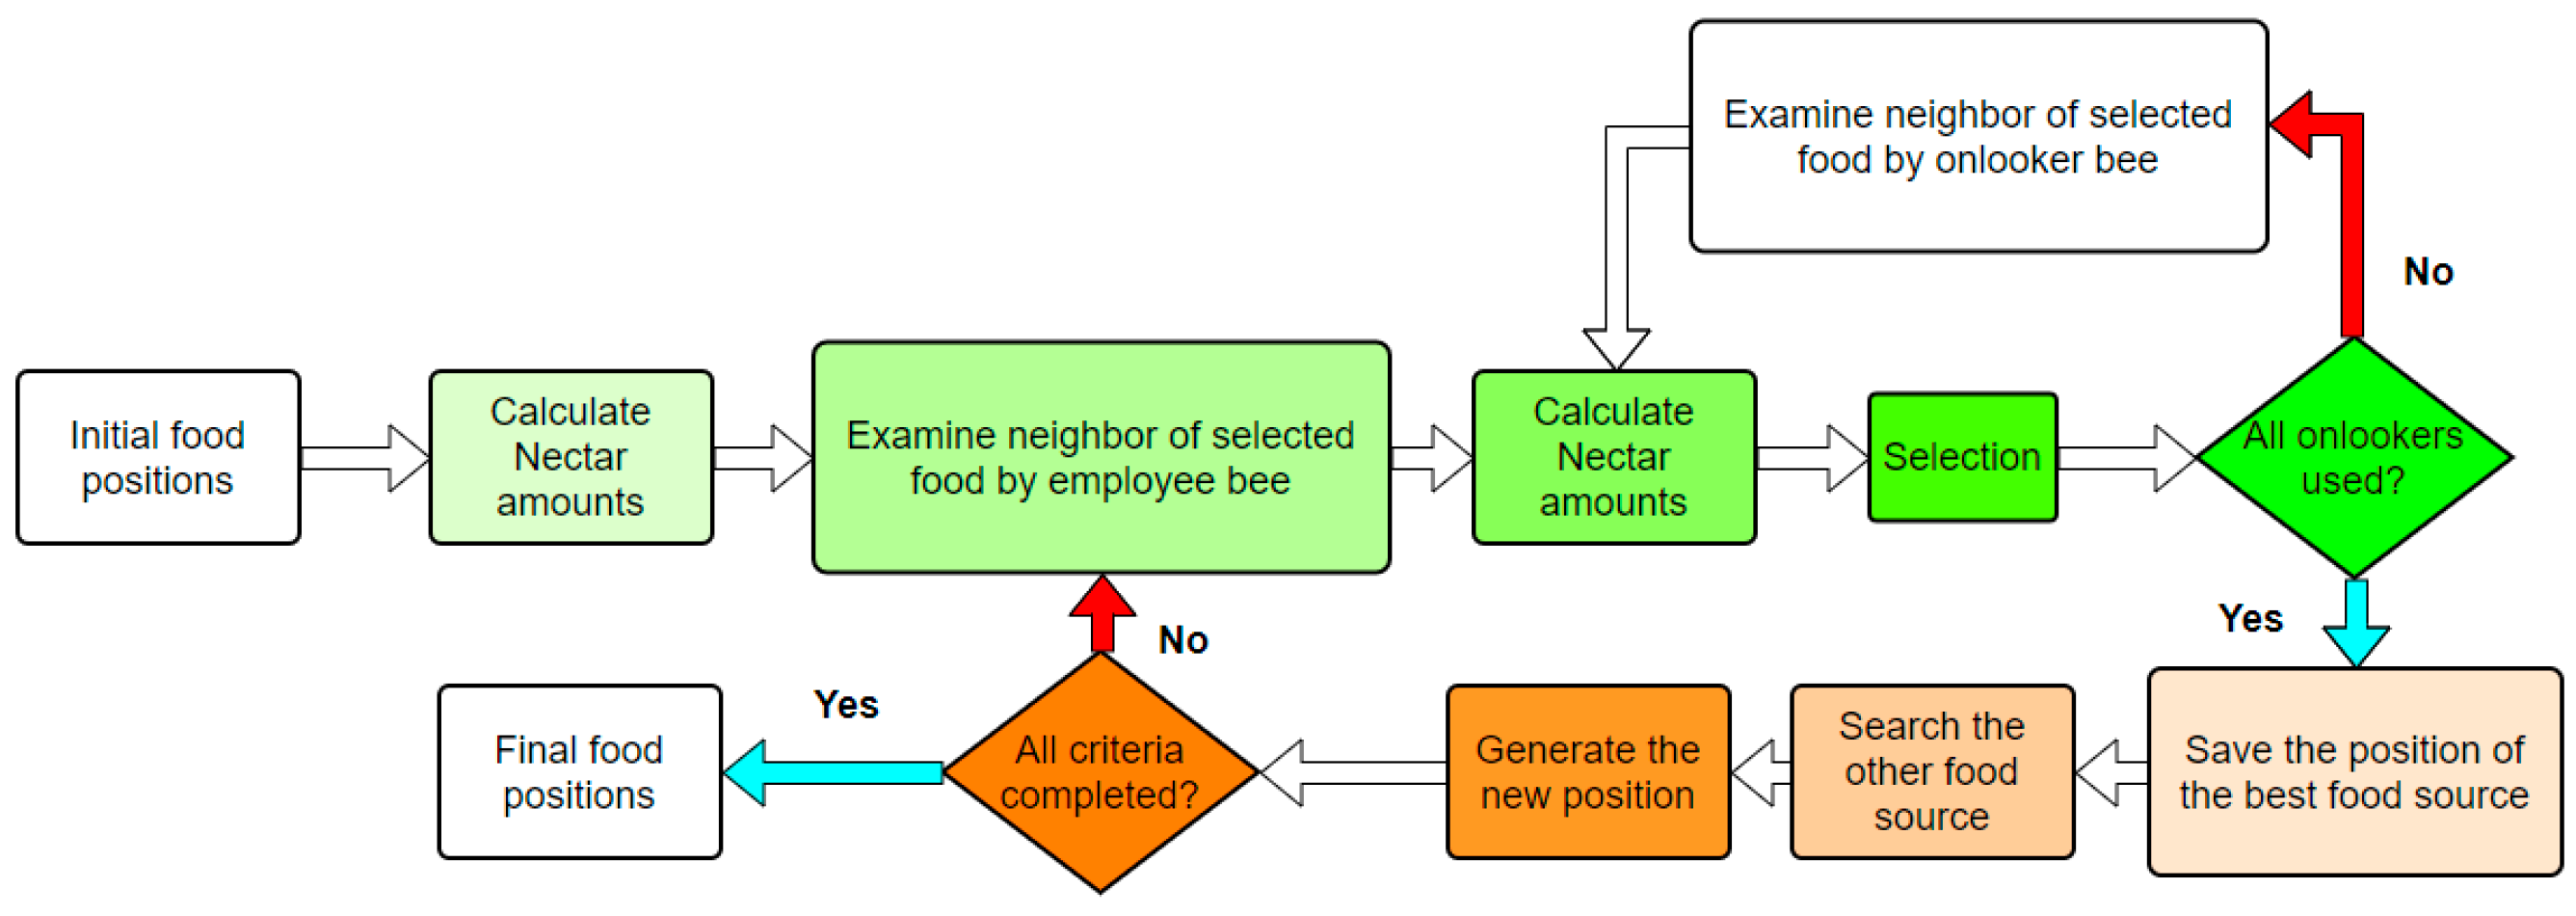
3.2. Artificial Bee Colony
- is the response i for the parameter j,
- is parameter j in the new response,
- i is the number of one to the number of solutions,
- φ is a random number in the negative interval of 1-1,
- k is a random number of one the answers or solusions,
- BN is the number of initial solutions,
- D is the number of optimization parameters.
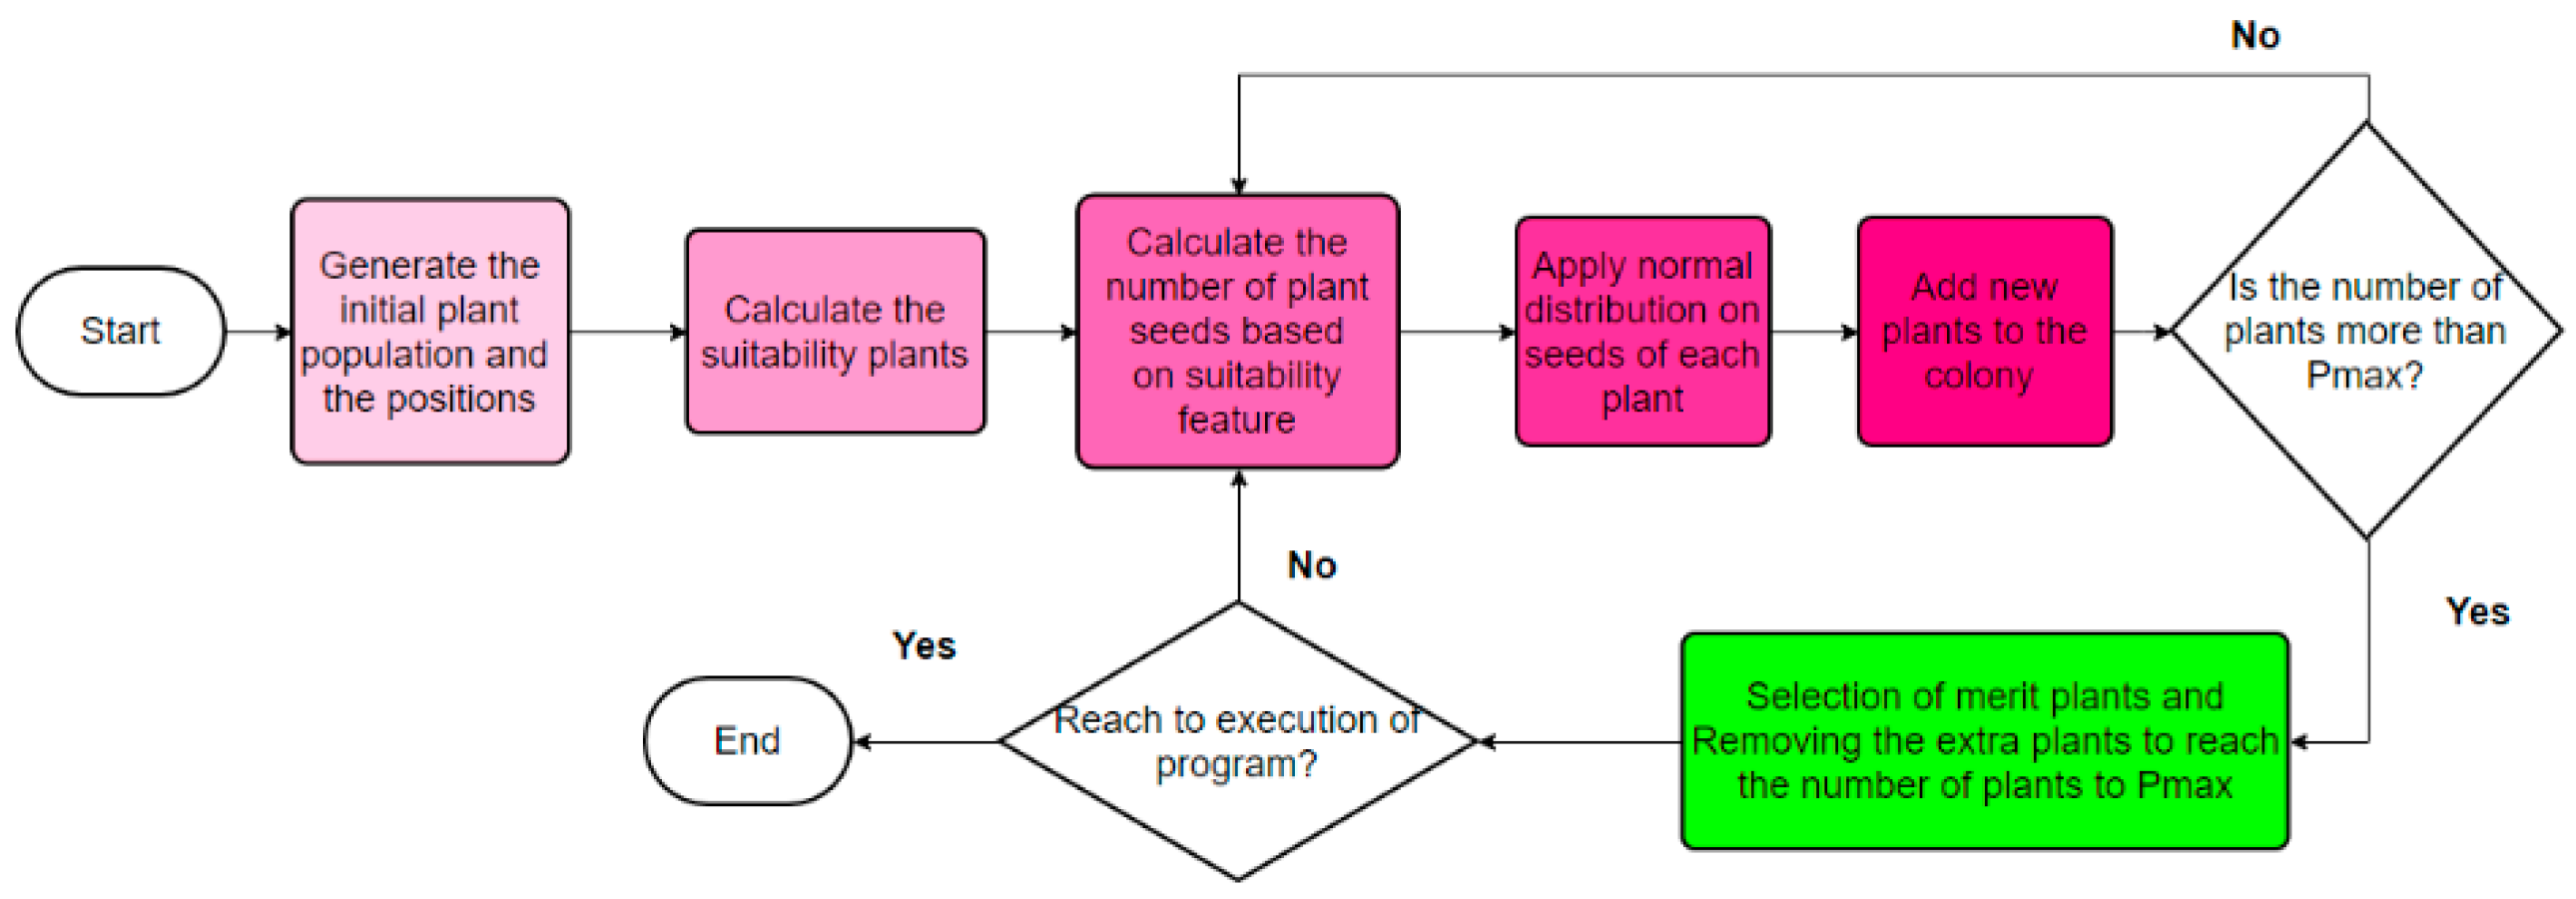
3.3. Invasive Weed Optimization (IWO)
3.4. Hybrid Algorithms
4. Model Development
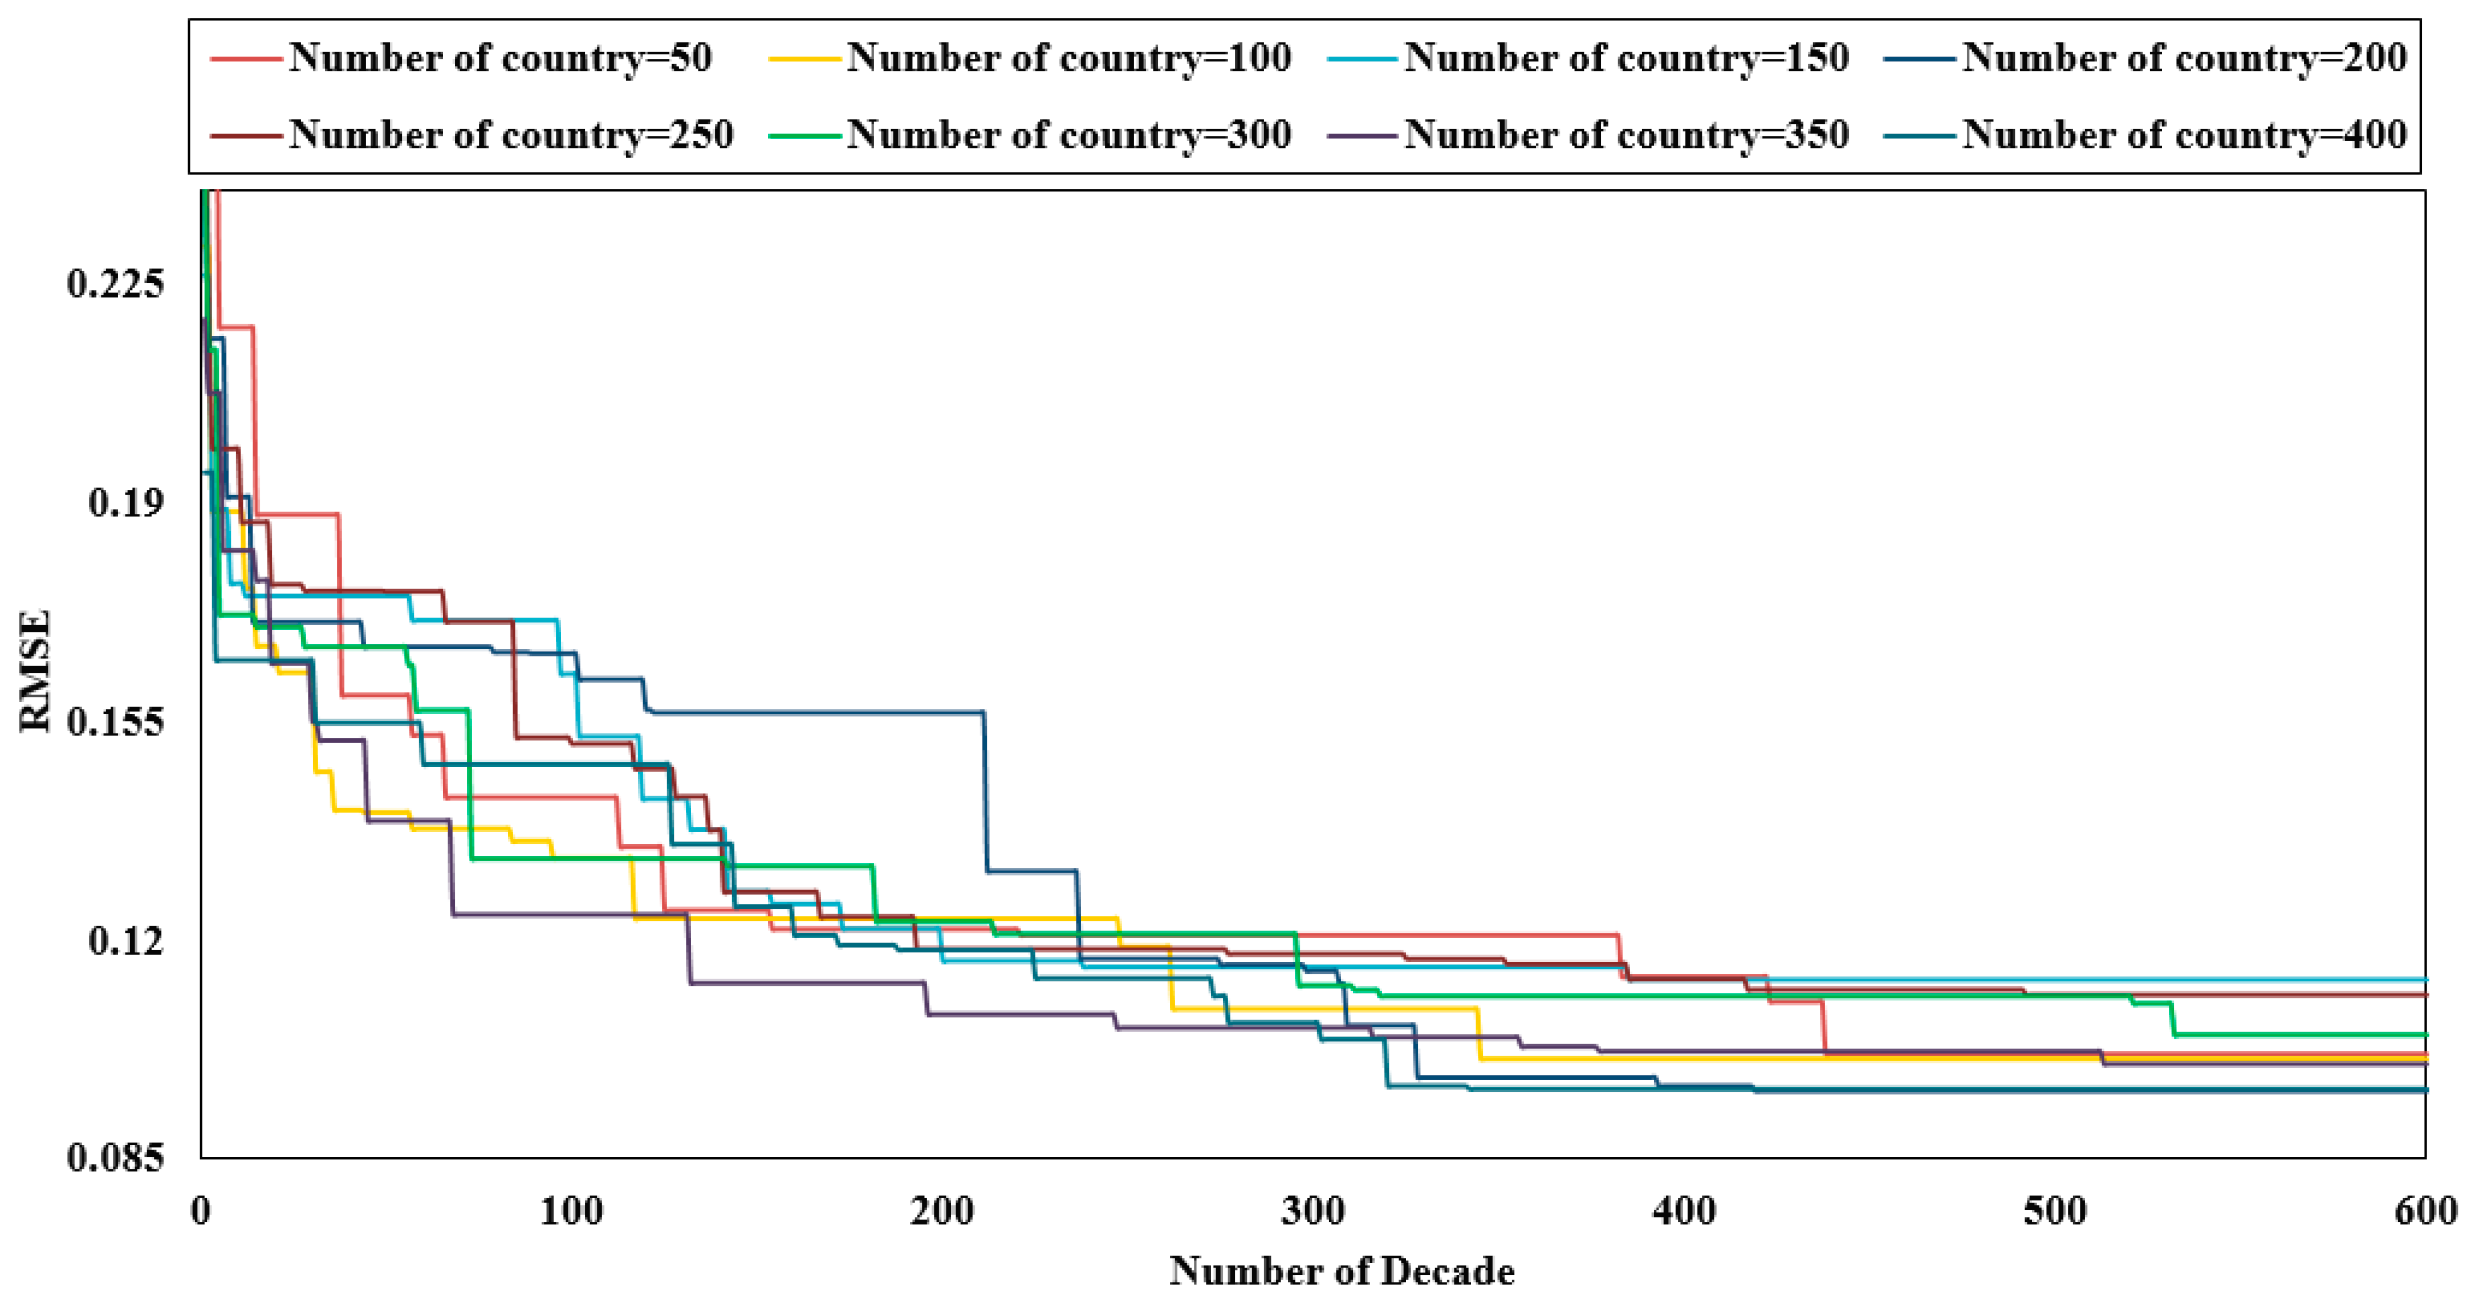
4.1. ICA-ANN
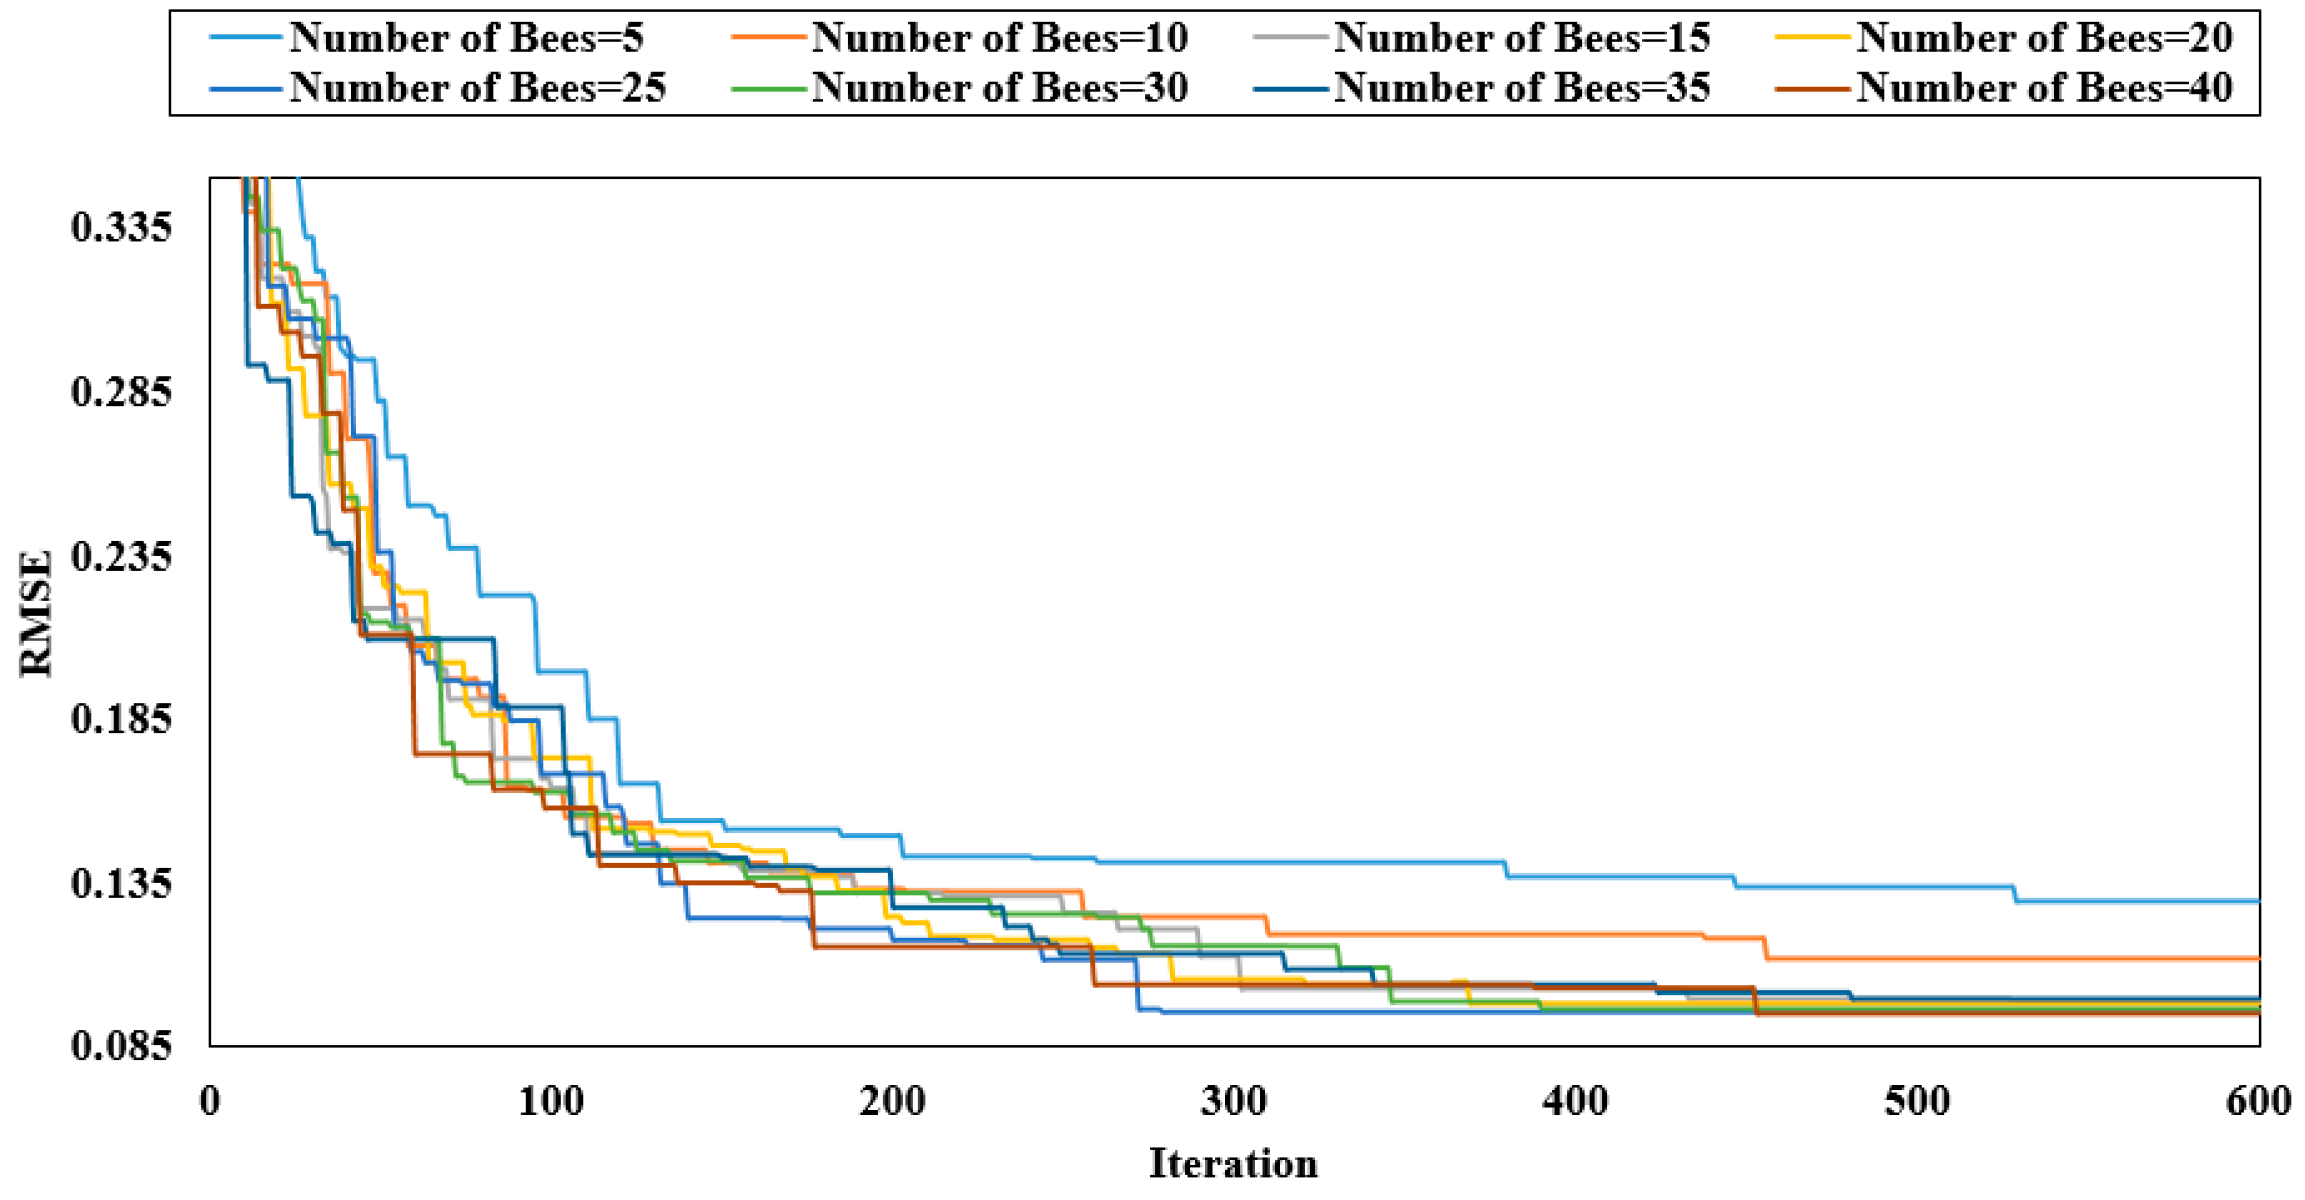
4.2. ABC-ANN
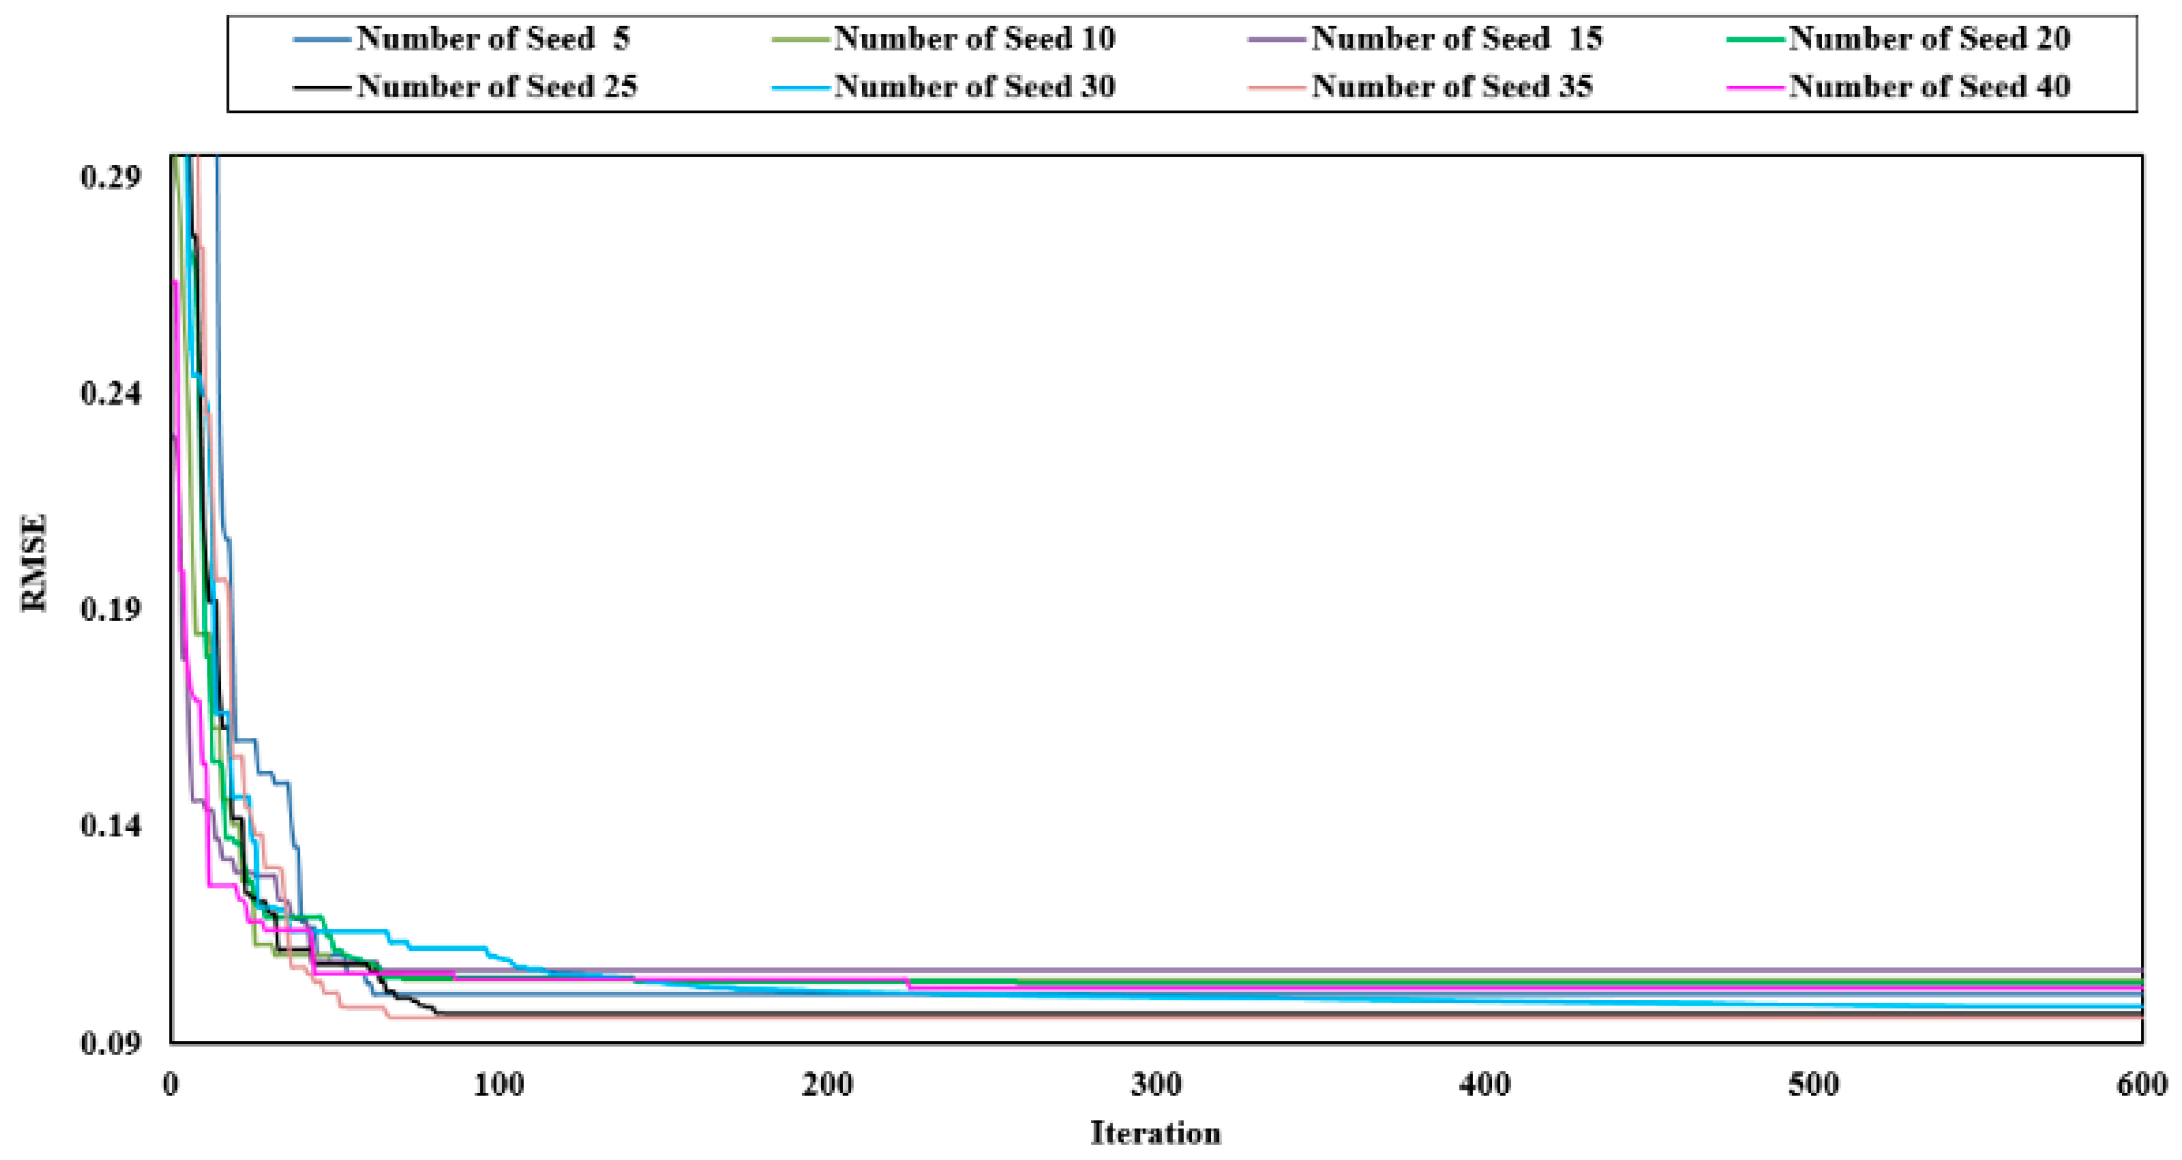
4.3. IWO-ANN
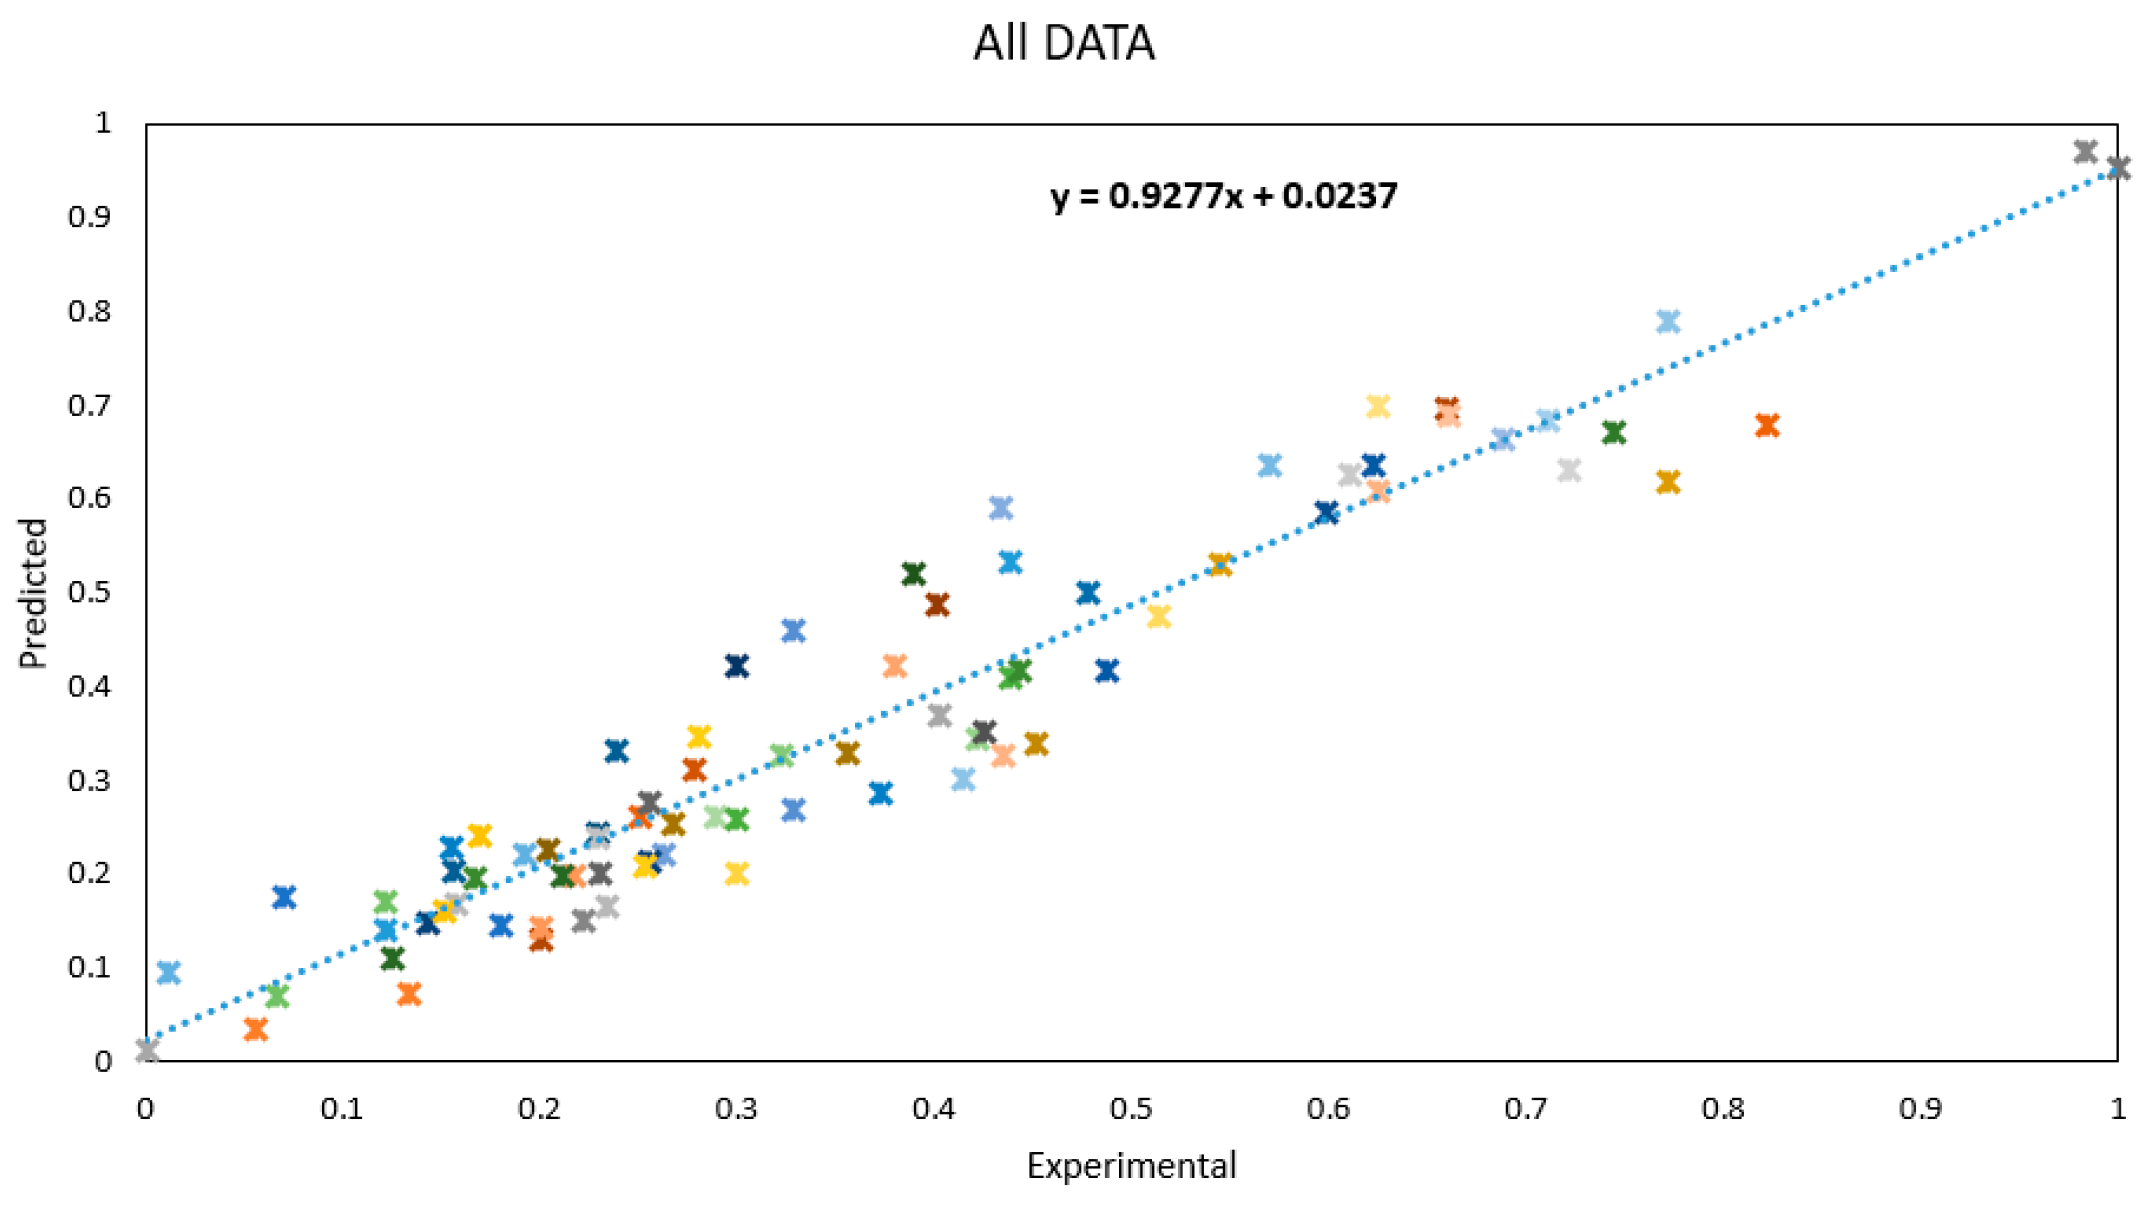
5. Results and Discussion
6. Conclusions
Author Contributions
Funding
Conflicts of Interest
References
- Baykasoğlu, A.; Güllü, H.; Çanakçı, H.; Özbakır, L. Prediction of compressive and tensile strength of limestone via genetic programming. Expert Syst. Appl. 2008, 35, 111–123. [Google Scholar] [CrossRef]
- Kahraman, S.; Fener, M.; Kozman, E. Predicting the compressive and tensile strength of rocks from indentation hardness index. J. S. Afr. Inst. Min. Metall. 2012, 112, 331–339. [Google Scholar]
- Heidari, M.; Khanlari, G.R.; Kaveh, M.T.; Kargarian, S. Predicting the Uniaxial Compressive and Tensile Strengths of Gypsum Rock by Point Load Testing. Rock Mech. Rock Eng. 2012, 45, 265–273. [Google Scholar] [CrossRef]
- Singh, V.; Singh, D.; Singh, T. Prediction of strength properties of some schistose rocks from petrographic properties using artificial neural networks. Int. J. Rock Mech. Min. Sci. 2001, 38, 269–284. [Google Scholar] [CrossRef]
- Nazir, R.; Momeni, E.; Armaghani, D.J.; Amin, M.F.M. Correlation between unconfined compressive strength and indirect tensile strength of limestone rock samples. Electron. J. Geotech. Eng. 2013, 18, 1737–1746. [Google Scholar]
- Ulusay, R.; Hudson, J.A.; ISRM. The Complete ISRM Suggested Methods for Rock Characterization, Testing and Monitoring: 1974–2006; Commission on Testing Methods, International Society for Rock Mechanics; ISRM Turkish Natl Group: Ankara, Turkey, 2007; 628 p. [Google Scholar]
- Kahraman, S.; Bilgin, N.; Feridunoglu, C. Dominant rock properties affecting the penetration rate of percussive drills. Int. J. Rock Mech. Min. Sci. 2003, 40, 711–723. [Google Scholar] [CrossRef]
- Mishra, D.A.; Basu, A. Use of the block punch test to predict the compressive and tensile strengths of rocks. Int. J. Rock Mech. Min. Sci. 2012, 51, 119–127. [Google Scholar] [CrossRef]
- Sheorey, P.R. Empirical Rock Failure Criteria; A A Balkema: Rotterdam, The Netherlands, 1997. [Google Scholar]
- Perras, M.A.; Diederichs, M.S. A Review of the Tensile Strength of Rock: Concepts and Testing. Geotech. Geol. Eng. 2014, 32, 525–546. [Google Scholar] [CrossRef]
- Armaghani, D.J.; Amin, M.F.M.; Yagiz, S.; Faradonbeh, R.S.; Abdullah, R.A. Prediction of the uniaxial compressive strength of sandstone using various modeling techniques. Int. J. Rock Mech. Min. Sci. 2016, 85, 174–186. [Google Scholar] [CrossRef]
- Koopialipoor, M.; Fahimifar, A.; Ghaleini, E.N.; Momenzadeh, M.; Armaghani, D.J. Development of a new hybrid ANN for solving a geotechnical problem related to tunnel boring machine performance. Eng. Comput. 2019, 1–13. [Google Scholar] [CrossRef]
- Zhou, J.; Aghili, N.; Ghaleini, E.N.; Bui, D.T.; Tahir, M.M.; Koopialipoor, M. A Monte Carlo simulation approach for effective assessment of flyrock based on intelligent system of neural network. Eng. Comput. 2019, 1–11. [Google Scholar] [CrossRef]
- Asteris, P.G.; Nozhati, S.; Nikoo, M.; Cavaleri, L.; Nikoo, M. Krill herd algorithm-based neural network in structural seismic reliability evaluation. Mech. Adv. Mater. Struct. 2019, 26, 1146–1153. [Google Scholar] [CrossRef]
- Chahnasir, E.S.; Zandi, Y.; Shariati, M.; Dehghani, E.; Toghroli, A.; Mohamad, E.T.; Shariati, A.; Safa, M.; Wakil, K.; Khorami, M. Application of support vector machine with firefly algorithm for investigation of the factors affecting the shear strength of angle shear connectors. SMART Struct. Syst. 2018, 22, 413–424. [Google Scholar]
- Mohammadhassani, M.; Nezamabadi-Pour, H.; Suhatril, M.; Shariati, M. Identification of a suitable ANN architecture in predicting strain in tie section of concrete deep beams. Struct. Eng. Mech. 2013, 46, 853–868. [Google Scholar] [CrossRef]
- Toghroli, A.; Suhatril, M.; Ibrahim, Z.; Safa, M.; Shariati, M.; Shamshirband, S. Potential of soft computing approach for evaluating the factors affecting the capacity of steel–concrete composite beam. J. Intell. Manuf. 2018, 29, 1793–1801. [Google Scholar] [CrossRef]
- Safa, M.; Shariati, M.; Ibrahim, Z.; Toghroli, A.; Baharom, S.B.; Nor, N.M.; Petkovic, D. Potential of adaptive neuro fuzzy inference system for evaluating the factors affecting steel-concrete composite beam’s shear strength. Steel Compos. Struct. 2016, 21, 679–688. [Google Scholar] [CrossRef]
- Hasanipanah, M.; Amnieh, H.B.; Khamesi, H.; Armaghani, D.J.; Golzar, S.B.; Shahnazar, A. Prediction of an environmental issue of mine blasting: An imperialistic competitive algorithm-based fuzzy system. Int. J. Environ. Sci. Technol. 2018, 15, 551–560. [Google Scholar] [CrossRef]
- Jiang, W.; Arslan, C.A.; Tehrani, M.S.; Khorami, M.; Hasanipanah, M. Simulating the peak particle velocity in rock blasting projects using a neuro-fuzzy inference system. Eng. Comput. 2019, 35, 1203–1211. [Google Scholar] [CrossRef]
- Rad, H.N.; Hasanipanah, M.; Rezaei, M.; Eghlim, A.L. Developing a least squares support vector machine for estimating the blast-induced flyrock. Eng. Comput. 2018, 34, 709–717. [Google Scholar] [CrossRef]
- Zhou, J.; Li, X.; Mitri, H.S. Classification of rockburst in underground projects: Comparison of ten supervised learning methods. J. Comput. Civ. Eng. 2016, 30, 4016003. [Google Scholar] [CrossRef]
- Zhou, J.; Shi, X.; Du, K.; Qiu, X.; Li, X.; Mitri, H.S. Feasibility of random-forest approach for prediction of ground settlements induced by the construction of a shield-driven tunnel. Int. J. Geomech. 2016, 17, 4016129. [Google Scholar] [CrossRef]
- Liao, X.; Khandelwal, M.; Yang, H.; Koopialipoor, M.; Murlidhar, B.R. Effects of a proper feature selection on prediction and optimization of drilling rate using intelligent techniques. Eng. Comput. 2019, 1–12. [Google Scholar] [CrossRef]
- Zhou, J.; Li, E.; Wang, M.; Chen, X.; Shi, X.; Jiang, L. Feasibility of Stochastic Gradient Boosting Approach for Evaluating Seismic Liquefaction Potential Based on SPT and CPT Case Histories. J. Perform. Constr. Facil. 2019, 33, 4019024. [Google Scholar] [CrossRef]
- Zhou, J.; Shi, X.; Li, X. Utilizing gradient boosted machine for the prediction of damage to residential structures owing to blasting vibrations of open pit mining. J. Vib. Control 2016, 22, 3986–3997. [Google Scholar] [CrossRef]
- Zhou, J.; Li, X.; Mitri, H.S. Evaluation method of rockburst: State-of-the-art literature review. Tunn. Undergr. Sp. Technol. 2018, 81, 632–659. [Google Scholar] [CrossRef]
- Monjezi, M.; Dehghani, H. Evaluation of effect of blasting pattern parameters on back break using neural networks. Int. J. Rock Mech. Min. Sci. 2008, 45, 1446–1453. [Google Scholar] [CrossRef]
- Khandelwal, M.; Armaghani, D.J.; Faradonbeh, R.S.; Ranjith, P.G.; Ghoraba, S. A new model based on gene expression programming to estimate air flow in a single rock joint. Environ. Earth Sci. 2016, 75, 739. [Google Scholar] [CrossRef]
- Manoj, K.; Monjezi, M. Prediction of flyrock in open pit blasting operation using machine learning method. Int. J. Min. Sci. Technol. 2013, 23, 313–316. [Google Scholar] [CrossRef]
- Khandelwal, M.; Singh, T.N. Correlating static properties of coal measures rocks with P-wave velocity. Int. J. Coal Geol. 2009, 79, 55–60. [Google Scholar] [CrossRef]
- Harandizadeh, H.; Toufigh, M.M.; Toufigh, V. Application of improved ANFIS approaches to estimate bearing capacity of piles. Soft Comput. 2019, 23, 9537–9547. [Google Scholar] [CrossRef]
- Asteris, P.G.; Kolovos, K.G.; Douvika, M.G.; Roinos, K. Prediction of self-compacting concrete strength using artificial neural networks. Eur. J. Environ. Civ. Eng. 2016, 20, s102–s122. [Google Scholar] [CrossRef]
- Apostolopoulou, M.; Armaghani, D.J.; Bakolas, A.; Douvika, M.G.; Moropoulou, A.; Asteris, P.G. Compressive strength of natural hydraulic lime mortars using soft computing techniques. Procedia Struct. Integr. 2019, 17, 914–923. [Google Scholar] [CrossRef]
- Armaghani, D.J.; Koopialipoor, M.; Marto, A.; Yagiz, S. Application of several optimization techniques for estimating TBM advance rate in granitic rocks. J. Rock Mech. Geotech. Eng. 2019, 11, 779–789. [Google Scholar] [CrossRef]
- Xu, H.; Zhou, J.; GAsteris, P.; Jahed Armaghani, D.; Tahir, M.M. Supervised Machine Learning Techniques to the Prediction of Tunnel Boring Machine Penetration Rate. Appl. Sci. 2019, 9, 3715. [Google Scholar] [CrossRef]
- Armaghani, D.J.; Hatzigeorgiou, G.D.; Karamani, C.; Skentou, A.; Zoumpoulaki, I.; Asteris, P.G. Soft computing-based techniques for concrete beams shear strength. Procedia Struct. Integr. 2019, 17, 924–933. [Google Scholar] [CrossRef]
- Asteris, P.G.; Nikoo, M. Artificial bee colony-based neural network for the prediction of the fundamental period of infilled frame structures. Neural Comput. Appl. 2019, 1–11. [Google Scholar] [CrossRef]
- Asteris, P.G.; Moropoulou, A.; Skentou, A.D.; Apostolopoulou, M.; Mohebkhah, A.; Cavaleri, L.; Rodrigues, H.; Varum, H. Stochastic Vulnerability Assessment of Masonry Structures: Concepts, Modeling and Restoration Aspects. Appl. Sci. 2019, 9, 243. [Google Scholar] [CrossRef]
- Hajihassani, M.; Abdullah, S.S.; Asteris, P.G.; Armaghani, D.J. A Gene Expression Programming Model for Predicting Tunnel Convergence. Appl. Sci. 2019, 9, 4650. [Google Scholar] [CrossRef]
- Asteris, P.G.; Apostolopoulou, M.; Skentou, A.D.; Moropoulou, A. Application of artificial neural networks for the prediction of the compressive strength of cement-based mortars. Comput. Concr. 2019, 24, 329–345. [Google Scholar]
- Cavaleri, L.; Asteris, P.G.; Psyllaki, P.P.; Douvika, M.G.; Skentou, A.D.; Vaxevanidis, N.M. Prediction of Surface Treatment Effects on the Tribological Performance of Tool Steels Using Artificial Neural Networks. Appl. Sci. 2019, 9, 2788. [Google Scholar] [CrossRef]
- Asteris, P.G.; Tsaris, A.K.; Cavaleri, L.; Repapis, C.C.; Papalou, A.; Di Trapani, F.; Karypidis, D.F. Prediction of the fundamental period of infilled RC frame structures using artificial neural networks. Comput. Intell. Neurosci. 2016, 2016, 20. [Google Scholar] [CrossRef]
- Psyllaki, P.; Stamatiou, K.; Iliadis, I.; Mourlas, A.; Asteris, P.; Vaxevanidis, N. Surface treatment of tool steels against galling failure. In MATEC Web of Conferences. EDP Sci. 2018, 188, 4024. [Google Scholar]
- Asteris, P.G.; Ashrafian, A.; Rezaie-Balf, M. Prediction of the compressive strength of self-compacting concrete using surrogate models. Comput. Concr. 2019, 24, 137–150. [Google Scholar]
- Koopialipoor, M.; Tootoonchi, H.; Armaghani, D.J.; Mohamad, E.T.; Hedayat, A. Application of deep neural networks in predicting the penetration rate of tunnel boring machines. Bull. Eng. Geol. Environ. 2019, 1–14. [Google Scholar] [CrossRef]
- Yang, H.Q.; Li, Z.; Jie, T.Q.; Zhang, Z.Q. Effects of joints on the cutting behavior of disc cutter running on the jointed rock mass. Tunn. Undergr. Sp. Technol. 2018, 81, 112–120. [Google Scholar] [CrossRef]
- Yang, H.Q.; Xing, S.G.; Wang, Q.; Li, Z. Model test on the entrainment phenomenon and energy conversion mechanism of flow-like landslides. Eng. Geol. 2018, 239, 119–125. [Google Scholar] [CrossRef]
- Yang, H.; Liu, J.; Liu, B. Investigation on the cracking character of jointed rock mass beneath TBM disc cutter. Rock Mech. Rock Eng. 2018, 51, 1263–1277. [Google Scholar] [CrossRef]
- Zhou, J.; Koopialipoor, M.; Murlidhar, B.R.; Fatemi, S.A.; Tahir, M.M.; Armaghani, D.J.; Li, C. Use of Intelligent Methods to Design Effective Pattern Parameters of Mine Blasting to Minimize Flyrock Distance. Nat. Resour. Res. 2019, 1–15. [Google Scholar] [CrossRef]
- Guo, H.; Zhou, J.; Koopialipoor, M.; Armaghani, D.J.; Tahir, M.M. Deep neural network and whale optimization algorithm to assess flyrock induced by blasting. Eng. Comput. 2019, 1–14. [Google Scholar] [CrossRef]
- Koopialipoor, M.; Nikouei, S.S.; Marto, A.; Fahimifar, A.; Armaghani, D.J.; Mohamad, E.T. Predicting tunnel boring machine performance through a new model based on the group method of data handling. Bull. Eng. Geol Environ. 2018, 78, 3799–3813. [Google Scholar] [CrossRef]
- Asteris, P.; Roussis, P.; Douvika, M. Feed-forward neural network prediction of the mechanical properties of sandcrete materials. Sensors 2017, 17, 1344. [Google Scholar] [CrossRef] [PubMed]
- Cavaleri, L.; Chatzarakis, G.E.; Di Trapani, F.; Douvika, M.G.; Roinos, K.; Vaxevanidis, N.M.; Asteris, P.G. Modeling of Surface Roughness in Electro-Discharge Machining Using Artificial Neural Networks. Adv. Mater. Res. 2017, 6, 169–184. [Google Scholar]
- Sarir, P.; Chen, J.; Asteris, P.G.; Armaghani, D.J.; Tahir, M.M. Developing GEP tree-based, neuro-swarm, and whale optimization models for evaluation of bearing capacity of concrete-filled steel tube columns. Eng. Comput. 2019, 1–19. [Google Scholar] [CrossRef]
- Chen, H.; Asteris, P.G.; Jahed Armaghani, D.; Gordan, B.; Pham, B.T. Assessing Dynamic Conditions of the Retaining Wall: Developing Two Hybrid Intelligent Models. Appl. Sci. 2019, 9, 1042. [Google Scholar] [CrossRef]
- Kumar, B.R.; Vardhan, H.; Govindaraj, M. Prediction of Uniaxial Compressive Strength, Tensile Strength and Porosity of Sedimentary Rocks Using Sound Level Produced During Rotary Drilling. Rock Mech. Rock Eng. 2011, 44, 613–620. [Google Scholar] [CrossRef]
- Koopialipoor, M.; Ghaleini, E.N.; Haghighi, M.; Kanagarajan, S.; Maarefvand, P.; Mohamad, E.T. Overbreak prediction and optimization in tunnel using neural network and bee colony techniques. Eng. Comput. 2019, 35, 1191–1202. [Google Scholar] [CrossRef]
- Zhao, Y.; Noorbakhsh, A.; Koopialipoor, M.; Azizi, A.; Tahir, M.M. A new methodology for optimization and prediction of rate of penetration during drilling operations. Eng. Comput. 2019, 1–9. [Google Scholar] [CrossRef]
- Koopialipoor, M.; Fallah, A.; Armaghani, D.J.; Azizi, A.; Mohamad, E.T. Three hybrid intelligent models in estimating flyrock distance resulting from blasting. Eng. Comput. 2019, 35, 243–256. [Google Scholar] [CrossRef]
- Ghaleini, E.N.; Koopialipoor, M.; Momenzadeh, M.; Sarafraz, M.E.; Mohamad, E.T.; Gordan, B. A combination of artificial bee colony and neural network for approximating the safety factor of retaining walls. Eng. Comput. 2018, 35, 647–658. [Google Scholar] [CrossRef]
- Koopialipoor, M.; Armaghani, D.J.; Hedayat, A.; Marto, A.; Gordan, B. Applying various hybrid intelligent systems to evaluate and predict slope stability under static and dynamic conditions. Soft Comput. 2019, 23, 5913–5929. [Google Scholar] [CrossRef]
- Koopialipoor, M.; Armaghani, D.J.; Haghighi, M.; Ghaleini, E.N. A neuro-genetic predictive model to approximate overbreak induced by drilling and blasting operation in tunnels. Bull. Eng. Geol Environ. 2019, 78, 981–990. [Google Scholar] [CrossRef]
- Mohamad, E.T.; Armaghani, D.J.; Momeni, E.; Yazdavar, A.H.; Ebrahimi, M. Rock strength estimation: A PSO-based BP approach. Neural Comput. Appl. 2018, 30, 1635–1646. [Google Scholar] [CrossRef]
- Atashpaz-Gargari, E.; Lucas, C. Imperialist competitive algorithm: An algorithm for optimization inspired by imperialistic competition. In Proceedings of the IEEE Congress on Evolutionary Computation (CEC 2007), Singapore, 25–28 September 2007; pp. 4661–4667. [Google Scholar]
- Hajihassani, M.; Jahed Armaghani, D.; Marto, A.; Tonnizam Mohamad, E. Ground vibration prediction in quarry blasting through an artificial neural network optimized by imperialist competitive algorithm. Bull. Eng. Geol Environ. 2014, 74, 873–886. [Google Scholar] [CrossRef]
- Armaghani, D.J.; Hasanipanah, M.; Mohamad, E.T. A combination of the ICA-ANN model to predict air-overpressure resulting from blasting. Eng. Comput. 2016, 32, 155–171. [Google Scholar] [CrossRef]
- Gordan, B.; Koopialipoor, M.; Clementking, A.; Tootoonchi, H.; Mohamad, E.T. Estimating and optimizing safety factors of retaining wall through neural network and bee colony techniques. Eng Comput. 2019, 35, 945–954. [Google Scholar] [CrossRef]
- Armaghani, D.J.; Mohamad, E.T.; Narayanasamy, M.S.; Narita, N.; Yagiz, S. Development of hybrid intelligent models for predicting TBM penetration rate in hard rock condition. Tunn. Undergr. Sp. Technol. 2017, 63, 29–43. [Google Scholar] [CrossRef]
- Karaboga, D. An Idea Based on Honey Bee Swarm for Numerical Optimization; Technical Report-tr06; Erciyes University, Engineering Faculty, Computer Engineering Department: Kayseri, Turkey, 2005. [Google Scholar]
- Nozohour-leilabady, B.; Fazelabdolabadi, B. On the application of artificial bee colony (ABC) algorithm for optimization of well placements in fractured reservoirs; efficiency comparison with the particle swarm optimization (PSO) methodology. Petroleum 2016, 2, 79–89. [Google Scholar] [CrossRef]
- Ahmad, A.; Razali, S.F.M.; Mohamed, Z.S.; El-shafie, A. The Application of Artificial Bee Colony and Gravitational Search Algorithm in Reservoir Optimization. Water Resour. Manag. 2016, 30, 2497–2516. [Google Scholar] [CrossRef]
- Zhang, C.; Ouyang, D.; Ning, J. An artificial bee colony approach for clustering. Expert Syst. Appl. 2010, 37, 4761–4767. [Google Scholar] [CrossRef]
- Rodriguez, F.J.; García-Martínez, C.; Blum, C.; Lozano, M. An artificial bee colony algorithm for the unrelated parallel machines scheduling problem. In International Conference on Parallel Problem Solving from Nature; Springer: Berlin/Heidelberg, Germany, 2012; pp. 143–152. [Google Scholar]
- Oliveira, I.M.S.D.; Schirru, R.; de Medeiros, J. On the performance of an artificial bee colony optimization algorithm applied to the accident diagnosis in a pwr nuclear power plant. In Proceedings of the 2009 international nuclear Atlantic conference (INAC 2009), Rio de Janeiro, Brazil, 27 September–2 October 2009. [Google Scholar]
- Irani, R.; Nasimi, R. Application of artificial bee colony-based neural network in bottom hole pressure prediction in underbalanced drilling. J. Pet. Sci. Eng. 2011, 78, 6–12. [Google Scholar] [CrossRef]
- Ebrahimi, E.; Monjezi, M.; Khalesi, M.R.; Armaghani, D.J. Prediction and optimization of back-break and rock fragmentation using an artificial neural network and a bee colony algorithm. Bull. Eng. Geol. Environ. 2016, 75, 27–36. [Google Scholar] [CrossRef]
- Karaboga, D.; Basturk, B. A powerful and efficient algorithm for numerical function optimization: Artificial bee colony (ABC) algorithm. J. Glob. Optim. 2007, 39, 459–471. [Google Scholar] [CrossRef]
- Sun, L.; Koopialipoor, M.; Armaghani, D.J.; Tarinejad, R.; Tahir, M.M. Applying a meta-heuristic algorithm to predict and optimize compressive strength of concrete samples. Eng. Comput. 2019, 1–13. [Google Scholar] [CrossRef]
- Koopialipoor, M.; Ghaleini, E.N.; Tootoonchi, H.; Armaghani, D.J.; Haghighi, M.; Hedayat, A. Developing a new intelligent technique to predict overbreak in tunnels using an artificial bee colony-based ANN. Environ. Earth Sci. 2019, 78, 165. [Google Scholar] [CrossRef]
- Mehrabian, A.R.; Lucas, C. A novel numerical optimization algorithm inspired from weed colonization. Ecol. Inform. 2006, 1, 355–366. [Google Scholar] [CrossRef]
- Bashir, Z.A.; El-Hawary, M.E. Applying wavelets to short-term load forecasting using PSO-based neural networks. IEEE Trans. Power Syst. 2009, 24, 20–27. [Google Scholar] [CrossRef]
- Lin, C.-J.; Hsieh, M.-H. Classification of mental task from EEG data using neural networks based on particle swarm optimization. Neurocomputing 2009, 72, 1121–1130. [Google Scholar] [CrossRef]
- Taghavifar, H.; Mardani, A.; Taghavifar, L. A hybridized artificial neural network and imperialist competitive algorithm optimization approach for prediction of soil compaction in soil bin facility. Measurement 2013, 46, 2288–2299. [Google Scholar] [CrossRef]
- Yagiz, S.; Karahan, H. Prediction of hard rock TBM penetration rate using particle swarm optimization. Int. J. Rock Mech. Min. Sci. 2011, 48, 427–433. [Google Scholar] [CrossRef]
- Armaghani, D.J.; Hasanipanah, M.; Mahdiyar, A.; Majid, M.Z.A.; Amnieh, H.B.; Tahir, M.M. Airblast prediction through a hybrid genetic algorithm-ANN model. Neural Comput. Appl. 2018, 29, 619–629. [Google Scholar] [CrossRef]
- Momeni, E.; Nazir, R.; Armaghani, D.J.; Maizir, H. Prediction of pile bearing capacity using a hybrid genetic algorithm-based ANN. Measurement 2014, 57, 122–131. [Google Scholar] [CrossRef]
- Liou, S.-W.; Wang, C.-M.; Huang, Y.-F. Integrative Discovery of Multifaceted Sequence Patterns by Frame-Relayed Search and Hybrid PSO-ANN. J. UCS 2009, 15, 742–764. [Google Scholar]
- Asteris, P.G.; Armaghani, D.J.; Hatzigeorgiou, G.D.; Karayannis, C.G.; Pilakoutas, K. Predicting the shear strength of reinforced concrete beams using Artificial Neural Networks. Comput. Concr. 2019, 24, 469–488. [Google Scholar]
- Asteris, P.G.; Kolovos, K.G. Self-compacting concrete strength prediction using surrogate models. Neural Comput. Appl. 2019, 31, 409–424. [Google Scholar] [CrossRef]
- Armaghani, D.; Mohamad, E.; Hajihassani, M. Evaluation and prediction of flyrock resulting from blasting operations using empirical and computational methods. Eng. Comput. 2016, 32, 109–121. [Google Scholar] [CrossRef]
- Hornik, K.; Stinchcombe, M.; White, H. Multilayer feedforward networks are universal approximators. Neural Netw. 1989, 2, 359–366. [Google Scholar] [CrossRef]
- Mohamad, E.T.; Faradonbeh, R.S.; Armaghani, D.J.; Monjezi, M.; Majid, M.Z.A. An optimized ANN model based on genetic algorithm for predicting ripping production. Neural Comput. Appl. 2017, 28, 393–406. [Google Scholar] [CrossRef]
- Armaghani, D.J.; Hajihassani, M.; Sohaei, H.; Mohamad, E.T.; Marto, A.; Motaghedi, H.; Moghaddam, M.R. Neuro-fuzzy technique to predict air-overpressure induced by blasting. Arab. J. Geosci. 2015, 8, 10937–10950. [Google Scholar] [CrossRef]
- Sonmez, H.; Gokceoglu, C.; Nefeslioglu, H.A.; Kayabasi, A. Estimation of rock modulus: For intact rocks with an artificial neural network and for rock masses with a new empirical equation. Int. J. Rock Mech. Min. Sci. 2006, 43, 224–235. [Google Scholar] [CrossRef]
- Yang, H.; Koopialipoor, M.; Armaghani, D.J.; Gordan, B.; Khorami, M.; Tahir, M.M. Intelligent design of retaining wall structures under dynamic conditions. Steel Compos. Struct. 2019, 31, 629–640. [Google Scholar]
- Koopialipoor, M.; Noorbakhsh, A.; Noroozi Ghaleini, E.; Jahed Armaghani, D.; Yagiz, S. A new approach for estimation of rock brittleness based on non-destructive tests. Nondestruct. Test. Eval. 2019, 1–22. [Google Scholar] [CrossRef]
- Xu, C.; Gordan, B.; Koopialipoor, M.; Armaghani, D.J.; Tahir, M.M.; Zhang, X. Improving Performance of Retaining Walls Under Dynamic Conditions Developing an Optimized ANN Based on Ant Colony Optimization Technique. IEEE Access 2019, 7, 94692–94700. [Google Scholar] [CrossRef]
- Mohamad, E.T.; Koopialipoor, M.; Murlidhar, B.R.; Rashiddel, A.; Hedayat, A.; Armaghani, D.J. A new hybrid method for predicting ripping production in different weathering zones through in-situ tests. Measurement 2019, 147, 106826. [Google Scholar] [CrossRef]
- Koopialipoor, M.; Murlidhar, B.R.; Hedayat, A.; Armaghani, D.J.; Gordan, B.; Mohamad, E.T. The use of new intelligent techniques in designing retaining walls. Eng. Comput. 2019, 1–2. [Google Scholar] [CrossRef]
- Zorlu, K.; Gokceoglu, C.; Ocakoglu, F.; Nefeslioglu, H.A.; Acikalin, S. Prediction of uniaxial compressive strength of sandstones using petrography-based models. Eng. Geol. 2008, 96, 141–158. [Google Scholar] [CrossRef]


| Model No. | Ncountry | Network Result | Ranking | Total Rank | ||||||||
|---|---|---|---|---|---|---|---|---|---|---|---|---|
| TR | TS | TR | TS | |||||||||
| R2 | RMSE | R2 | RMSE | R2 | RMSE | R2 | RMSE | |||||
| 1 | 50 | 0.865 | 0.1019 | 0.877 | 0.1104 | 4 | 4 | 3 | 3 | 14 | ||
| 2 | 100 | 0.871 | 0.1012 | 0.882 | 0.1001 | 5 | 5 | 4 | 4 | 18 | ||
| 3 | 150 | 0.853 | 0.1136 | 0.863 | 0.1187 | 1 | 1 | 1 | 1 | 4 | ||
| 4 | 200 | 0.899 | 0.096 | 0.901 | 0.0978 | 8 | 8 | 7 | 7 | 30 | ||
| 5 | 250 | 0.857 | 0.1113 | 0.871 | 0.1119 | 2 | 2 | 2 | 2 | 8 | ||
| 6 | 300 | 0.861 | 0.1049 | 0.902 | 0.0971 | 3 | 3 | 8 | 8 | 24 | ||
| 7 | 350 | 0.874 | 0.1003 | 0.899 | 0.0983 | 6 | 6 | 6 | 6 | 24 | ||
| 8 | 400 | 0.898 | 0.0964 | 0.885 | 0.0997 | 7 | 7 | 5 | 5 | 24 | ||
| Model No. | Bees No. | Network Result | Ranking | Total Rank | ||||||||
|---|---|---|---|---|---|---|---|---|---|---|---|---|
| TR | TS | TR | TS | |||||||||
| R2 | RMSE | R2 | RMSE | R2 | RMSE | R2 | RMSE | |||||
| 1 | 5 | 0.843 | 0.1295 | 0.854 | 0.1264 | 1 | 1 | 1 | 1 | 4 | ||
| 2 | 10 | 0.857 | 0.1122 | 0.867 | 0.1091 | 2 | 2 | 2 | 2 | 8 | ||
| 3 | 15 | 0.896 | 0.0987 | 0.899 | 0.0971 | 5 | 5 | 6 | 6 | 22 | ||
| 4 | 20 | 0.895 | 0.0986 | 0.879 | 0.0995 | 4 | 4 | 3 | 3 | 14 | ||
| 5 | 25 | 0.906 | 0.0959 | 0.902 | 0.0963 | 7 | 7 | 7 | 7 | 28 | ||
| 6 | 30 | 0.901 | 0.097 | 0.894 | 0.0978 | 6 | 6 | 5 | 5 | 22 | ||
| 7 | 35 | 0.875 | 0.1001 | 0.891 | 0.0988 | 3 | 3 | 4 | 4 | 14 | ||
| 8 | 40 | 0.908 | 0.0946 | 0.904 | 0.0955 | 8 | 8 | 8 | 8 | 32 | ||
| Model No. | Seeds No. | Network Result | Ranking | Total Rank | ||||||||
|---|---|---|---|---|---|---|---|---|---|---|---|---|
| TR | TS | TR | TS | |||||||||
| R2 | RMSE | R2 | RMSE | R2 | RMSE | R2 | RMSE | |||||
| 1 | 5 | 0.898 | 0.0964 | 0.889 | 0.0971 | 5 | 5 | 4 | 4 | 18 | ||
| 2 | 10 | 0.869 | 0.0998 | 0.881 | 0.0988 | 2 | 2 | 3 | 3 | 10 | ||
| 3 | 15 | 0.861 | 0.1018 | 0.877 | 0.1004 | 1 | 1 | 2 | 2 | 6 | ||
| 4 | 20 | 0.874 | 0.0987 | 0.869 | 0.1028 | 3 | 3 | 1 | 1 | 8 | ||
| 5 | 25 | 0.923 | 0.0918 | 0.909 | 0.0943 | 7 | 7 | 6 | 6 | 26 | ||
| 6 | 30 | 0.909 | 0.0935 | 0.922 | 0.0927 | 6 | 6 | 8 | 8 | 28 | ||
| 7 | 35 | 0.928 | 0.0911 | 0.917 | 0.0936 | 8 | 8 | 7 | 7 | 30 | ||
| 8 | 40 | 0.887 | 0.0979 | 0.894 | 0.0959 | 4 | 4 | 5 | 5 | 18 | ||
| Hybrid Model | R2 | VAF | RMSE | |||
|---|---|---|---|---|---|---|
| TR | TS | TR | TS | TR | TS | |
| IWO-ANN | 0.928 | 0.917 | 92.872 | 91.731 | 0.0911 | 0.0936 |
| ABC-ANN | 0.908 | 0.904 | 90.816 | 90.419 | 0.0946 | 0.0955 |
| ICA-ANN | 0.899 | 0.901 | 89.889 | 90.134 | 0.0960 | 0.0978 |
© 2019 by the authors. Licensee MDPI, Basel, Switzerland. This article is an open access article distributed under the terms and conditions of the Creative Commons Attribution (CC BY) license (http://creativecommons.org/licenses/by/4.0/).
Share and Cite
Huang, L.; Asteris, P.G.; Koopialipoor, M.; Armaghani, D.J.; Tahir, M.M. Invasive Weed Optimization Technique-Based ANN to the Prediction of Rock Tensile Strength. Appl. Sci. 2019, 9, 5372. https://doi.org/10.3390/app9245372
Huang L, Asteris PG, Koopialipoor M, Armaghani DJ, Tahir MM. Invasive Weed Optimization Technique-Based ANN to the Prediction of Rock Tensile Strength. Applied Sciences. 2019; 9(24):5372. https://doi.org/10.3390/app9245372
Chicago/Turabian StyleHuang, Lei, Panagiotis G. Asteris, Mohammadreza Koopialipoor, Danial Jahed Armaghani, and M. M. Tahir. 2019. "Invasive Weed Optimization Technique-Based ANN to the Prediction of Rock Tensile Strength" Applied Sciences 9, no. 24: 5372. https://doi.org/10.3390/app9245372
APA StyleHuang, L., Asteris, P. G., Koopialipoor, M., Armaghani, D. J., & Tahir, M. M. (2019). Invasive Weed Optimization Technique-Based ANN to the Prediction of Rock Tensile Strength. Applied Sciences, 9(24), 5372. https://doi.org/10.3390/app9245372