Abstract
The high customer requirements for appropriate product quality pose a challenge for manufacturers and suppliers and also cause them many problems related to ensuring a sufficiently high product quality throughout the entire production cycle. For the above reasons, it is so important to assess the capability of monitored processes, and shaping, analyzing and controlling the capability of processes is an important aspect of managing an organization that uses a process approach to management. The use of an appropriate method to analyze the course of production processes is a necessity imposed by quality standards, e.g., ISO 9001: 2015. That is why it is so important to propose a quick and low-cost method of assessing production processes. For this purpose, a method of assessing the capability of the manufacturing process using bootstrap analysis was used. The article presents the analysis of inherent properties of the production process based on the results of measurements of the characteristic features of the process or the characteristics of the manufactured products (process variables) for the shafts with grooves. The main goals of the work are to develop a procedure for determining process capability based on the bootstrap method, including criteria for the classification of production process capability; to develop the criterion values for confidence intervals of production process capability; as well as to demonstrate the practical application of bootstrap analysis in manufacturing. Moreover, comparative analyses of process capabilities using bootstrap and classic methods were carried out. They confirm both the narrowing of the confidence interval when using the bootstrap method and the possibility of determining a better estimator of the lower limit of this range compared to the results obtained using the classic method. The tests carried out for the unit production of shafts with grooves showed that the analysis of the process capability for measuring tests n = 10 is possible. Finally, new criterion values for the assessment of process capability for the bootstrap method were proposed. The model for assessing the capability of production processes presented in the paper was implemented in low-volume production in the defense industry.
1. Introduction
In the modern globalized market, and in connection with the growing requirements of customers, one of the key problems and at the same time challenges of suppliers is the quality assurance of manufactured products throughout the entire production cycle. One of the aspects of product quality assurance is the quality of production processes and in particular their capability.
Process capability is an important factor in the cooperation between the supplier and the customer [1]. Currently, the recipients of components for the aviation, automotive or machine industry among others, in addition to product specifications and acceptable manufacturing defects, impose on their suppliers the required process capability, as the lack of process capability control can generate losses. To meet these requirements, the supplier should therefore monitor and measure the course of manufacturing processes so as to be able to correct and improve the quality of the product based on reliable information. That is why the problem of assessing the capability of monitored processes becomes so important, and shaping, analyzing and controlling the capability of processes is an important aspect of organization management, especially when it uses a process approach to management.
The problems of assessing the capability of production processes and maintaining the capability at the required level are a key element of business cooperation. When entering into contracts between interested parties, it is often impossible to sign such agreement. In most cases, this is a level set too high for the production process capability, i.e., the quality of the production. Elderly, time-worn machinery park and old technology mean low process capability; in turn, modern machinery park, automated production, precise control of production processes and modern technology allow achieving high capability of the production process [2]. That quality of processes, represented by their capability, is expected by recipients from manufacturers, especially from European Union countries. In the case of suppliers operating in the automotive sector having a quality management system certificate, continuous process capability analysis is even an obligatory action [3].
The results of the production process measurements depend on the complexity of the research methods used. An appropriate, structured research method is also a prerequisite for obtaining reliable information about the capability of the production process.
In the general case, the analysis of the capability of the production process consists in comparing the width of the tolerance range required with the distribution of results obtained in a selected range of the duration of this process [4]. Currently, two methods of testing process capabilities are used: classic and percentile analysis. Classic analysis is used for distributions that can be considered normal, while percentile analysis is used for distributions that deviate from the normal distribution. In both cases, the number of samples taken should exceed n = 100 measurement results [5]. Therefore, if in reality the tested process cannot be characterized by the required number of measurement results (less than 100 measurements), and in addition, their distribution deviates from the normal, the analysis of the process capability, carried out by classic or percentile methods, is not possible (assuming the correctness and reliability of the obtained capability values). Therefore, it seems that in the case of monitoring the course of such processes, the bootstrap method can be used to test their capability [6].
The bootstrap method involves drawing with return lots of small-scale bootstrap samples from a small number of results. Due to the size of the bootstrap sample set, this method is cumbersome to measure process capability in industrial practice. However, after using the appropriate software, it becomes accessible to operators who do not have extensive knowledge of statistical process control.
The basic use of bootstrap analysis to measure the capability of production processes can find place in industrial practice, mainly in cases where:
- This is job-lot or job production.
- The measurement methods used in the research of processes are in the form of destructive tests, and, at the same time, the value of the tested sample is relatively high.
- Process capability assessment is performed for a trial batch to verify that the capability value required in the contract with the recipient is achievable. In this case, the use of bootstrap analysis reduces the costs associated with the production and testing of a larger sample batch, necessary using the classic method.
- The capability of the production process is tested, where measurements are rarely done, e.g., due to the cost of testing and analysis.
The bootstrap method can be used for what-if studies. It is used in many different areas, including in simulation models analyzing medical data [7,8,9,10,11,12], in financial analyzes [13,14,15], in solving problems in the area of logistics and distribution [16,17,18], in environmental protection [19,20,21,22], safety sciences [23], automotive [24], risk management [25,26] and in classic queuing models [27].
The Aims of the Study
Taking the above into consideration, the following aims of the study were formulated:
- Development of a process capability determination procedure based on the bootstrap method, including criteria for the classification of production process capability.
- Using the developed procedure to analyze the capability of the production process.
- Conducting a comparative analysis of process capability determined by bootstrap and classic methods.
- Development of criterion values for confidence intervals of process capabilities.
The subject of consideration at work will be the production process. The analysis of inherent properties of the production process will be carried out on the basis of the results of measuring the characteristic features of the process or the characteristics of the products manufactured (process variables).
In the following, this paper discusses in detail the issues related to the capability of the production process and the description of the bootstrap method used in this study. Then, the research methodology, obtained research results and their discussion are presented. The last part of the work summarizes the conducted research and presents the conclusions of the paper and the possibilities of practical application of the bootstrap method.
2. Process Capability
The characteristics of the course of the process are best determined using appropriate statistical methods (PN-EN ISO 9004:2018-06) [28]. This involves the need to obtain quantitative results of measuring process variables (PN-EN ISO 9001:2015-10) [29] that will allow effective process monitoring.
The basic goals of process analysis are as follows [30]:
- Formulating directions and priorities for improving their course.
- Measurement of process improvement effects.
- Regulation of the process flow.
An ideal, stationary process should be characterized by the lack of dispersion of results—any selected process variable characterizing its output during the process has a constant value. In reality (practice) there are no stationary processes. The result of each real process is in the form of a distribution of the values of the selected process variable—it is characterized by dispersion. Thus, the basic parameters for assessing the quality of processes are:
- A measure of the distribution dispersion of a selected process variable (process dispersion).
- Measure of the location of the distribution of the selected process variable (process centering).
The assessment of the quality of production processes is associated with the assumption that each product delivered to the customer is endowed with a defect (loss); the smaller it is, the higher is the quality of the product [31,32]. This loss is the higher the more the value of the product feature considered deviates from the target value, including within the tolerance range. This contradicts the view expressed by Taylor that the product quality is constant if the property under consideration falls within the tolerance range (Figure 1). The tolerance field is defined here by the lower LSL and upper USL tolerance limits.
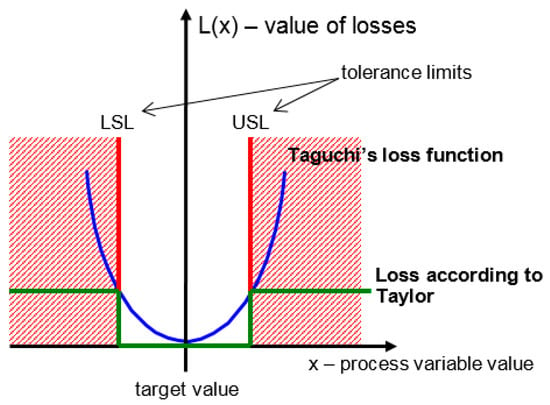
Figure 1.
Taguchi and Taylor quality loss functions. Source: own study.
Therefore, given the approach presented by Taguchi, every product whose parameters deviate from the target value is characterized by a loss of quality [33,34].
To characterize the process with the capability specified for the selected process variable x, the width of the range in which we accept the obtained process results should be compared with the adopted limit of the process variable distribution, e.g., with the range of 6σ [35].
Indicators for process capability are increasingly used in industrial practice. Due to the introduction of a process approach in quality management in 2000 [29], it became necessary to monitor processes. “The organization should define the processes needed in the quality management system and their application in the organization and should (...) define and apply the criteria and methods (including monitoring, measurement and related performance indicators) needed to ensure the effective conduct and supervision of these processes”. The point 8.5.1. of this standard refers to “the ability to achieve the planned results of production processes and services provided.” In industrial practice, the planned result is the required width of the tested property range of the manufactured product.
The process capability is a special inherent feature of the process resulting from the statistical description of one of the outputs (adopted for the description of the process) carried out in a selected period of time. The process capability is the relationship between the required tolerance of the considered product property—process output—treated as a process variable and the obtained dispersion of the value of this variable—the result of the adopted method of limiting the distribution of variable values obtained in a given process duration. Graphic interpretation of the process capability assessment is presented in Figure 2.
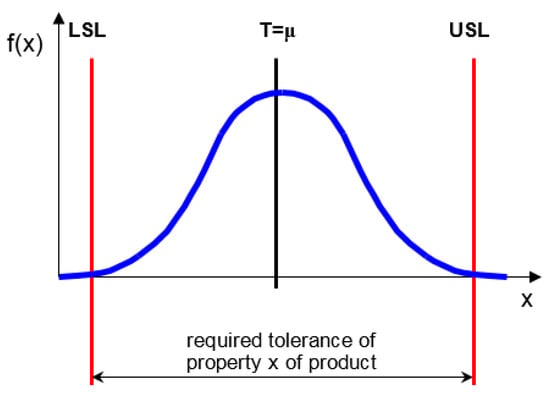
Figure 2.
Graphic illustration of process capability. Source: own study.
The simplest form of the process capability indicator, denoted by CP, is defined as follows:
This coefficient is used when the instantaneous average process value , obtained on the basis of measurements, is equal to the assumed—purposeful process value T. Arithmetic mean and standard deviation s of measurements are given by the formula:
where:
- xi, measurement value;
- n, sample size.
As follows from the above dependence, in order not to generate excessive losses associated with maintaining defective products, the process capability index should be [36]:
CP ≥ 1,
In the assessment of process capability in industrial practice, the distribution limited by six standard deviations is taken as the measure of the scatter of measurement results [37]. For the normal distribution of the process variable, the CP process capability indicator takes the form:
where:
- USL, upper tolerance limit;
- LSL, lower tolerance limit;
- n, sample size;
- σ, standard deviation of the general population.
Due to the growing requirements of customers, especially global concerns, the criteria for the minimum limit value of the CP coefficient have been adopted for some industries [38]. According to Steinem et al., [39] the minimum values of CP coefficient for selected industries are for the machinery industry CP = 1, for the automotive industry CP = 1.33, and in the aviation industry CP = 2. Analyzing the capability of the production process, three ranges of the CP value can be presented. When CP > 1 the process dispersion is smaller than the width of the tolerance range, and this is the recommended process capability. For CP = 1, the tolerance range is equal to the process dispersion, and this is a satisfactory process capability [40]. When CP < 1, the tolerance range is narrower than the process dispersion—defective products are produced in excessive quantity. Then, the process capability is insufficient [41]. Another interpretation of the process capability coefficient value can be found in the literature, e.g., Kubera states that low process capability is CP < 1, average 1 < CP < 1.3 and high CP > 1.33 [41]. The interpretation may be different for different types of industry and processes, in this paper the capability at CP = 1 level will be accepted as satisfactory.
Whether or not a production process to be executed is capable of achieving the assumed performance parameters depends, among others, on the reliability of the machines and technological devices that make up the system under design [42]. Layouts and temporal structure optimization of manufacturing requires application of a multi-criteria approach in designing production systems [43].
3. Bootstrap Method
There are methods that simplify the procedure when assessing process capability using numerical indicators. One of such methods is bootstrap analysis based on the so-called bootstrap samples [44], which can be used when the sample size is not very large (show Figure 3). The purpose of this analysis is the possible verification of previously obtained results using factor methods.
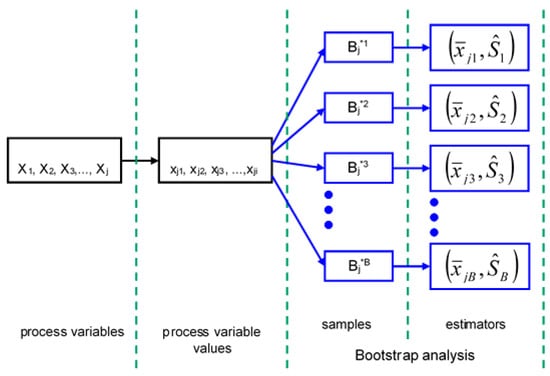
Figure 3.
Scheme of bootstrap analysis. Source: own study.
Bootstrap methods have been known for over 20 years, but only in recent years they have been widely used, primarily in stochastic simulation models. The basis of this method is the assumption that the future is similar to the past. Therefore, instead of studying the past and trying to describe it using theoretical distributions, and then simulating the future using the selected distributions, you can generate simulation input data directly from historical data [45,46]. As a consequence, this means that since the observed sample of real data contains all the necessary information about the studied population, this sample can be treated as a population.
Bootstrap analysis consists of a draw with returning individual results from a random sample (from the original data) and then creating a new sample from the drawn samples for the study [47]. Thus, it is a method of estimating the distribution of estimation errors, using multiple random draws of observations with returns from the original sample. The draws take into account all possible combinations of elements from the sample, based on real data [48]. It allows checking the distribution of parameters in relation to the initial sample [49]. The bootstrap method is useful when the form of the distribution of the variable in the population is not known and when the quality or amount of information collected does not allow the use of classic statistical methods [50]. Due to the fact that it does not make assumptions about the distribution in the population, it is included in the non-parametric methods.
Let xj1, xj2, xj3, ... xji denote the values of the process variable Xi of the production process under investigation. From a given set of xji values, we draw with returning n measurement values and in this way we get new bootstrap samples Bj*1, Bj*2, Bj*3, ... Bj*B.
Each bootstrap sample consists of exactly the same number of “n” elements as the number of values tested [30,51,52,53].
The number of bootstrap draws cannot be less than nn. Based on empirical research, it has been shown that a sufficient number of draws for conducting tests is B = 1000 measurements [54]. After obtaining the set number of bootstrap attempts, based on them, inference is calculated by calculating the appropriate statistics ϕ. The empirical distribution obtained in this way is used to make inferences about the parameter θ [48,55].
The main advantage of this is that the process variable distribution is not studied but empirically constructed based on measuring a large number of samples of the process variable value [56]. The advantage of this is also the ability to assess process capabilities based on abnormal distributions, characterized by high skewness, flattening, drift, etc.
To sum up the above, the following analogy is crucial for the use of the bootstrap method in statistical inference: the bootstrap sample is for the sample drawn what the sample drawn for the entire population.
4. Subject and Research Method
The paper presents a method for assessing the manufacturing process capability of an shafts with grooves, a typical production process whose quality assessment is made on the basis of capability analysis and is carried out during the final product control. Based on the analysis of many industrial products it can be concluded that one half of all machine parts are rotational parts: shafts (over 40%), discs, sleeves, thin wall cylinders, rings, etc. [57].
In the case of production, there are two categories of processes when the capability analysis using the bootstrap method seems to be practically the best solution. These categories include processes in which:
- Measurements of the process variable are performed by the method destroying the sample and for economic reasons the sample size of the process capability becomes the sample size and
- The result of the course is a small collection of products (low-volume production).
The production process of an shafts with grooves belongs to the second of the mentioned categories of processes.
In the present case, due to the small size of the general population of products n = 10, the analysis of the process capability will be carried out using the bootstrap method, with the population size being the same as the sample size.
The shafts with grooves is manufactured by a manufacturing plant that provides complete reinforcement for defense purposes. The shafts is a necessary component of this armament.
The production of the shafts with the groove was chosen for the following reasons:
- The process is a typical example of a small batch process.
- It is necessary to make a cyclical assessment of the production process.
- Due to the number of shafts produced, it is not possible to assess the shape of the process variable distribution, so the assumption about the normality of the distribution of quality characteristics is rejected.
The results analyzed were obtained on the basis of measurements made using a CMM (coordinate-measuring machine). The geometry of this product defines 19 parameters (18 measurement parameters and total length), with parameter 12 selected as the process variable for analyzing the process capability.
To assess the process capability, a research procedure consisting of five activities was used (see Figure 4):
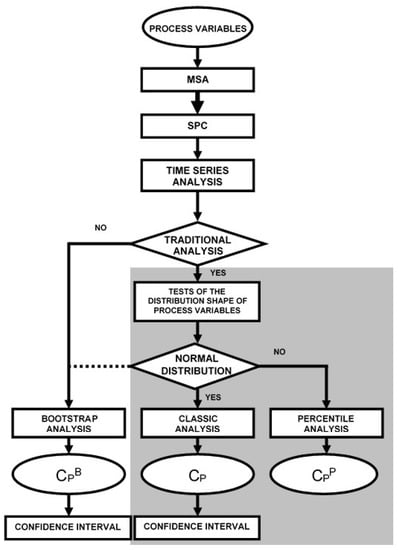
Figure 4.
Diagram of the algorithm for assessing the quality of processes using the classic, percentile and bootstrap methods. Source: own study.
- Measurement systems analysis (MSA).
- Statistical process control (SPC).
- Time series analysis.
- Distribution studies of the selected process variable.
- Process capability assessment, including capability assessment using three methods: classic, percentile, bootstrap.
The principle of process capability assessment should be to take into account confidence intervals with a lower limit CP MIN. This indicates that with some probability (the confidence interval was calculated at P = 95% in the work), the capacity of the analyzed process will not be lower than the lower limit of the confidence interval [58,59].
The detailed scope of research for individual activities is presented in Figure 5. Due to the large number of results (especially charts), the results are presented only for the final stage of the procedure, i.e., the assessment of the process capability CP.
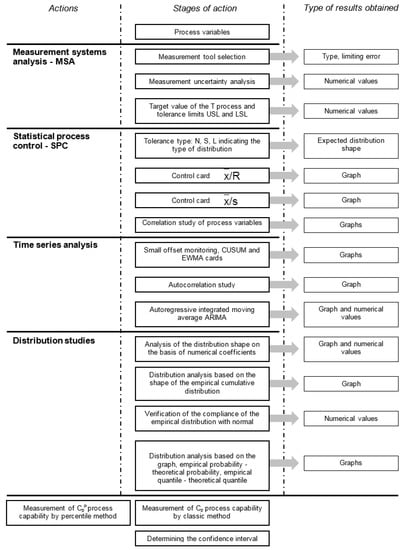
Figure 5.
Sequence of actions in the process capability assessment procedure and presentation of individual results. Source: own study.
5. Results and Discussion
The results of the analyzes of process variable capacity 12, the unit production process of the shafts with the grooves are shown in Figure 6.
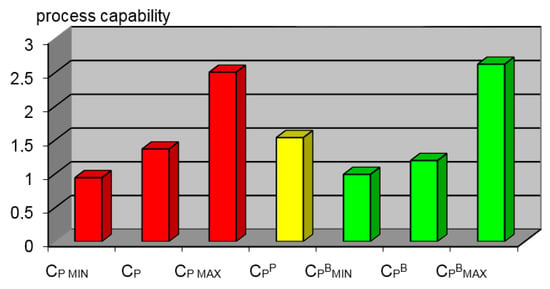
Figure 6.
Comparison of the results of the value of the unit production process of the shafts with grooves, for the 12 process variable, by the classic method (red), percentile method (yellow) and bootstrap method (green). Source: own study.
For the unit production process of an shafts with grooves, the lowest value is taken by the process coefficient of the lower limit of the confidence interval of the classic analysis. The process capability coefficient determined by the percentile method CPP falls within the process capability range determined by the classic method as well as in the process range determined by the bootstrap method.
The tests carried out for the unit production of shafts with grooves have shown that the analysis of the process capability for ten measurements is possible. In both examined cases, the average value of process capability determined by the classic method CP was greater than the lower bootstrap limit of the process capability. Whereas, the lower limit of the process capability determined by the classic method CP MIN was below the lower bootstrap limit CPBMIN (Figure 7).
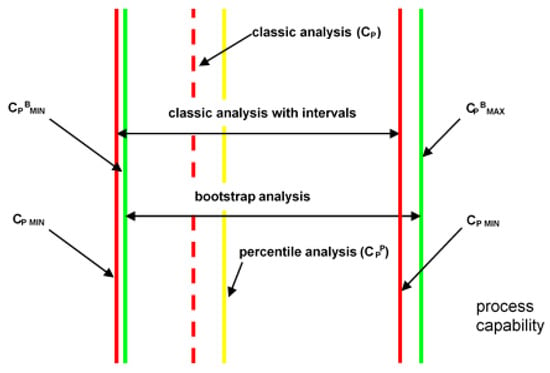
Figure 7.
Graphic presentation of the results of the production process capability assessment of the shafts with grooves, process variable 12. Source: own study.
Based on the analyzes and results obtained, new criterion standards for the assessment of process capability can be introduced, resulting from the lower limit of process capability assessment. Analyzing the lower limits of process capability confidence intervals, processes can be assessed without the need to analyze the sample size, because interval estimation of process capability using the bootstrap method does not require this. The proposed new criterion values for process capability assessment for the bootstrap method are presented in Table 1.

Table 1.
Sample criterion values of process capability assessment for the lower limit of bootstrap process capability in relation to the process capability determined by the traditional method for normal distribution. Source: own study.
6. Summary and Discussion
The article reviews and critically evaluates the methods used to determine process capability. The capability of production processes was treated here as the basic property determining their quality, conditioning control and, as a consequence, process management. In the case of a process-based approach to organization management, process capability can and should be one of the key instruments of organization management, in particular, quality management in the organization.
Against the background of the methods used so far to determine the capability of production processes, traditional and percentile, the article presents the assumptions of the bootstrap method and discusses the effects of using this method in relation to specific cases of process flows [60]. An attempt was also made to use the bootstrap method to analyze production processes.
In addition, a procedure for determining the capability of production processes based on the bootstrap method was developed and this procedure was used to analyze the process of manufacturing shafts with grooves (production process). The above model for assessing the capability of production processes using the bootstrap method for low-volume production has been implemented in the defense industry.
On the basis of the literature studies, research and analysis of the results obtained, the following conclusions can be drawn:
- The procedure of process capability determination, developed on the basis of the bootstrap method, is a simplification compared to the classic method by omitting the assessment of the shape of the distribution of measured parameters.
- An examined comparative analysis of the processes capabilities, determined by the bootstrap and classic methods, including those based on the simulation of results obtained using the classic method for a small sample size, allowed the determination of new criterion values of the process capability, analyzed by the bootstrap method, based on the small random sample size.
- The use of bootstrap analysis results in a better approximation of confidence intervals of the production process capability factor than traditional analyses. The obtained test results confirm both the narrowing of the confidence interval when using the bootstrap method and the possibility of determining a better estimator of the lower limit of this range. The lower limit of process capability, obtained on the basis of the bootstrap method, is shifted upwards compared to the results obtained using the classic method. This is important when assessing process capability because the obtained value of the lower confidence interval limit means that at the selected confidence level the actual capability of the tested process will not be lower.
- New criterion values for process capability determined by the bootstrap method were developed. The introduced criteria make it possible to assess the capabilities of processes taking place in various branches of the economy (different classes of processes), determined by the bootstrap method, and are equivalent to the criteria used so far resulting from the use of the classic method of determining capacity. The developed criteria allow the assessment of the capability of the processes examined also on the basis of small sample sizes (n ≥ 10).
Based on the conducted research and literature study, the following possibilities of practical application of bootstrap analysis can be proposed:
- The unit and low-volume production process capability (this type of process was described in the paper), as a result of which a few or tens of products are obtained, can not be assessed by traditional methods.
- The production process capability assessment, carried out using the bootstrap method and realized on the base of destructive testing methods, shows an advantage over the classical method due to the reduction of the costs of performed tests.
- The production process capability assessment of the trial batch, in the event that the production facility analyzes the commencement of production and the requirements imposed by the customer strictly specify the capability of the process, can also be performed with the help of bootstrap analysis, thereby reducing the sample batch size, and as a consequence reduction of project costs.
- Bootstrap analysis of process capability assessment can also be used to determine required tolerance limits. In this case, based on the bootstrap analysis carried out and the assumed value of the bootstrap process capability coefficient, the searched tolerance limits sought can be determined.
- Another application of bootstrap analysis is the ability of production process capability assessment when conducting a second party audit—a customer audit. On the basis of a small sample size and self-made measurements, auditors can easily and quickly form an opinion on the capability of the production processes in which they are interested. This is a very important application of bootstrap analysis, because the supplier can produce products in the production process with a different process capability than can be determined from the batch delivered to the customer.
- The study of changes in process capability over time, conducted to determine the quality of a specific production machine and technological lines, can also be performed used bootstrap analysis. In this case, the process capability analysis gives a signal that the machine needs to be repaired or completely replaced. In the case of testing the capabilities of technological lines, this way it is possible to carry out an analysis of multimodal distributions obtained as a result of overlapping distribution of measured values for elements made on machines working in parallel in a technological line. Thus, the use of process capability assessment using bootstrap analysis makes it possible to assess numerically the state of the production equipment.
- Bootstrap analysis of the production process capability can also be used as one of the possibilities to validate this process.
Author Contributions
Conceptualization, P.S. and M.S.; methodology, P.S., M.S. and A.D.; formal analysis, M.S., A.D. and J.C.; resources, M.S., A.D. and J.C.; writing—original draft preparation, P.S., M.S., A.D. and J.C.; writing—review and editing, M.S., A.D. and J.C.; visualization, M.S., A.D. and J.C.; project administration, M.S.
Funding
This research received no external funding.
Conflicts of Interest
The authors declare no conflict of interest.
References
- Liao, M.Y. Process capability control chart for non-normal data–evidence of on-going capability assessment. Qual. Technol. Quant. Manag. 2016, 13, 165–181. [Google Scholar] [CrossRef]
- Kashif, M.; Aslam, M.; Al-Marshadi, A.H.; Jun, C.H.; Khan, M.I. Evaluation of modified non-normal process capability index and its bootstrap confidence intervals. IEEE Access 2017, 5, 12135–12142. [Google Scholar] [CrossRef]
- IATF 16949:2016. Standard Systemu Zarządzania Jakością w Przemyśle Motoryzacyjnym; Polski Komitet Normalizacyjny: Warszawa, Poland, 2016; p. 16949. [Google Scholar]
- Saha, M.; Dey, S.; Maiti, S.S. Bootstrap confidence intervals of CpTk for two parameter logistic exponential distribution with applications. Int. J. Syst. Assur. Eng. Manag. 2019, 10, 623–631. [Google Scholar] [CrossRef]
- Franklin, L.A.; Wasserman, G.S. Bootstrap lower confidence limits for capability indices. J. Qual. Technol. 1992, 24, 196–202. [Google Scholar] [CrossRef]
- Dwornicka, R.; Radek, N.; Pietraszek, J. The bootstrap method as a tool to improve the design of experiments. Syst. Saf. Hum.-Tech. Facil.-Environ. 2019, 1, 724–729. [Google Scholar] [CrossRef]
- Bland, J.M.; Altman, D.G. Statistics Notes: Bootstrap resampling methods. BMJ 2015, 350, h2622. [Google Scholar] [CrossRef]
- Grunkemeier, G.L.; Wu, Y. Bootstrap resampling methods: Something for nothing? Ann. Thorac. Surg. 2004, 77, 1142–1144. [Google Scholar] [CrossRef]
- Lee, S.; Kim, C. Estimation of association between healthcare system efficiency and policy factors for public health. Appl. Sci. 2018, 8, 2674. [Google Scholar] [CrossRef]
- Lipton, J.W.; Shaw, W.D.; Holmes, J.; Patterson, A. Short communication: Selecting input distributions for use in Monte Carlo simulations. Regul. Toxicol. Pharmacol. 1995, 21, 192–198. [Google Scholar] [CrossRef]
- Schomaker, M.; Heumann, C. Bootstrap inference when using multiple imputation. Stat. Med. 2018, 37, 2252–2266. [Google Scholar] [CrossRef]
- Vicente, E.; Jha, A.; Frey, E. A nonparametric sinogram-based bootstrap resampling method to investigate scan time reduction in nuclear medicine imaging. J. Nucl. Med. 2016, 57, 1872. [Google Scholar]
- Boyle, P.; Broadie, M.; Glasserman, P. Monte Carlo methods for security pricing. J. Econ. Dyn. Control 1997, 21, 1267–1321. [Google Scholar] [CrossRef]
- Hacker, S.; Hatemi, J.A. A bootstrap test for causality with endogenous lag length choice: Theory and application in finance. J. Econ. Stud. 2012, 39, 144–160. [Google Scholar] [CrossRef]
- Du, K.; Worthington, A.C.; Zelenyuk, V. Data envelopment analysis, truncated regression and double-bootstrap for panel data with application to Chinese banking. Eur. J. Oper. Res. 2018, 265, 748–764. [Google Scholar] [CrossRef]
- Alexandre, L.; da Silva, N.C.F.; da Silva, C.M. Bootstrap method in price analysis in reverse logistics of solid waste from commercial restaurants. Int. J. Adv. Eng. Res. Sci. (IJAERS) 2019, 6, 482–485. [Google Scholar] [CrossRef]
- Ferrari, C.; Migliardi, A.; Tei, A. A bootstrap analysis to investigate the economic efficiency of the logistics industry in Italy. Int. J. Logist. Res. Appl. 2018, 21, 20–34. [Google Scholar] [CrossRef]
- Lytras, M.D.; Visvizi, A. Who uses Smart City services and what to make of it: Toward interdisciplinary Smart Cities research. Sustainability 2018, 10, 1998. [Google Scholar] [CrossRef]
- Barakat, H.M.; Nigm, E.M.; Khaled, O.M.; Momenkhan, F.A. Bootstrap method for order statistics and modeling study of the air pollution. Commun. Stat. —Simul. Comput. 2015, 44, 1477–1491. [Google Scholar] [CrossRef]
- Keller, J.P.; Chang, H.H.; Strickland, M.J.; Szpiro, A.A. Measurement error correction for predicted spatiotemporal air pollution exposures. Epidemiology 2017, 28, 338–345. [Google Scholar] [CrossRef]
- Koçak, E.; Şarkgüneşi, A. The impact of foreign direct investment on CO2 emissions in Turkey: New evidence from cointegration and bootstrap causality analysis. Environ. Sci. Pollut. Res. 2018, 25, 790–804. [Google Scholar] [CrossRef]
- Zhang, A.; Shi, H.; Li, T.; Fu, X. Analysis of the influence of rainfall spatial uncertainty on hydrological simulations using the Bootstrap method. Atmosphere 2018, 9, 71. [Google Scholar] [CrossRef]
- Corral-De-Witt, D.; Carrera, E.V.; Munoz-Romero, S.; Tepe, K.; Rojo-Alvarez, J.L. Multiple correspondence analysis of emergencies attended by integrated security services. Appl. Sci. 2019, 9, 1396. [Google Scholar] [CrossRef]
- Bąkowski, A.; Radziszewski, L.; Žmindak, M. Determining selected diesel engine combustion descriptors using the bootstrap method. Procedia Eng. 2016, 157, 451–456. [Google Scholar] [CrossRef]
- Ardia, D.; Gatarek, L.T.; Hoogerheide, L.F. A new bootstrap test for multiple assets joint risk testing. J. Risk 2017, 19, 4. [Google Scholar] [CrossRef]
- Valášková, K.; Spuchľáková, E.; Adamko, P. Non-parametric Bootstrap method in risk management. Procedia Econ. Financ. 2015, 24, 701–709. [Google Scholar] [CrossRef]
- Barton, R.R.; Schruben, L.W. Resampling methods for input modeling. In Proceedings of the 2001 Winter Simulation Conference, Arlington, VA, USA, 9–12 December 2001; Peters, B.A., Smith, J.S., Medeiros, D.J., Rohrer, M.W., Eds.; pp. 372–378. [Google Scholar] [CrossRef]
- PN-EN ISO 9004:2018-06. Zarządzanie Jakością, Jakość Organizacji, Wytyczne Osiągnięcia Trwałego Sukcesu; Polski Komitet Normalizacyjny: Warszawa, Poland, 2018; Volume 6, p. 9004. [Google Scholar]
- PN-EN ISO 9001:2015-10. Systemy Zarządzania Jakością Wymagania; Polski Komitet Normalizacyjny: Warszawa, Poland, 2015; Volume 10, p. 9001. [Google Scholar]
- Płaska, S. Wprowadzenie do Statystycznego Sterowania Procesami Technologicznymi; Wydawnictwo Politechniki Lubelskiej: Lublin, Poland, 2000. [Google Scholar]
- Balamurali, S.; Usha, M. Determination of an efficient variables sampling system based on the Taguchi process capability index. J. Oper. Res. Soc. 2019, 70, 420–432. [Google Scholar] [CrossRef]
- Taguchi, G.; Elsayed, E.A.; Hsiang, T.C. Quality Engineering in Production Systems; Mc-Graw-Hill College: New York, NY, USA, 1989. [Google Scholar]
- Gavin, D.; Gallimore, K.; Brown, J. Does ISO 9000 give a quality emphasis advantage? A comparison of large service and manufacturing organizations. Qual. Manag. J. 2001, 8, 52–59. [Google Scholar]
- Kuvaja, P.; Bicego, A. Bootstrap? A European assessment methodology. Softw. Qual. J. 1994, 3, 117–127. [Google Scholar] [CrossRef]
- Dahlgaard, J.; Kristensen, K.; Kanji, G. Podstawy Zarządzania Jakością; Wydawnictwo Naukowe PWN: Warszawa, Poland, 2002. [Google Scholar]
- Kapania, M. Measuring Your Process Capability. Qual. Product. J. 2000, 1–13. [Google Scholar]
- Wu, C.W.; Shu, M.; Pearn, W.; Liu, K. Bootstrap approach for supplier selection based on production yield. Int. J. Prod. Res. 2008, 46, 5211–5230. [Google Scholar] [CrossRef]
- Suozzi, M. Process Capability Studies; Hughes Aircraft Company: Tucson, AZ, USA, 1990. [Google Scholar]
- Steinem, S.; Bovas, A.; MacKay, J. Understanding Process Capability Indices. Institute for Improvement of Quality and Productivity; University of Waterloo: Waterloo, ON, Canada, 2003. [Google Scholar]
- Jay, A. Six Sigma Simplified Tools; LifeStar: Denver, CO, USA, 2003. [Google Scholar]
- Kubera, H. Zachowanie Jakości Produktu; Wydawnictwo Akademii Ekonomicznej w Poznaniu: Poznań, Polska, 2002. [Google Scholar]
- Gola, A. Reliability analysis of reconfigurable manufacturing system structures using computer simulation methods. Eksploatacja i Niezawodnosc—Maintenance and Reliability 2019, 21, 90–102. [Google Scholar] [CrossRef]
- Plinta, D.; Krajčovič, M. Production System Designing with the Use of Digital Factory and Augmented Reality Technologies. Progress in Automation, Robotics and Measuring Techniques. ICA 2015. In Advances in Intelligent Systems and Computing; Szewczyk, R., Zieliński, C., Kaliczyńska, M., Eds.; Springer: Cham, Germany, 2015; p. 350. [Google Scholar] [CrossRef]
- Efron, B.; Tibshirani, R. Bootstrap methods for standard errors, confidence intervals, and other measures of statistical accuracy. Stat. Sci. 1986, 1, 54–75. [Google Scholar] [CrossRef]
- Gentle, J.E. Random Number Generation and Monte Carlo Methods; Springer: New York, NY, USA, 2003. [Google Scholar]
- Mielczarek, B. Metody próbkowania w symulacji Monte Carlo. Prace Naukowe Instytutu Organizacji i Zarządzania Politechniki Wrocławskiej 2007, 83, 187–199. [Google Scholar]
- Clare, A. Machine Learning and Data Mining for Yeast Functional Genomics. Ph.D. Thesis, Departament of Computer Science University of Wales, Aberystwyth, UK, February 2003. [Google Scholar]
- Zglińska-Pietrzak, A. Zastosowanie metody bootstrapowej w analizie portfelowej. Przegląd Statystyczny 2012, 59, 246–257. [Google Scholar]
- Efron, B. Bootstrap methods: Another look at the jackknife. Ann. Stat. 1979, 7, 1–26. [Google Scholar] [CrossRef]
- Rao, G.S.; Aslam, M.; Kantam, R. Bootstrap confidence intervals of CNpk for inverse Rayleigh and log-logistic distributions. J. Stat. Comput. Simul. 2016, 86, 862–873. [Google Scholar] [CrossRef]
- Domański, C.; Pruska, K. Nieklasyczne Metody Statystyczne; PWE: Warszawa, Poland, 2000. [Google Scholar]
- Kozak, P.; Płaska, S.; Stoma, P. Ocena jakości procesów z wykorzystaniem metod bootstropowych, IX Konferencja Techniczna, pt. In Metrologia w Technikach Wytwarzania Maszyn; Wydawnictwo Politechniki Częstochowskiej: Częstochowa, Poland, 2001; pp. 129–134. [Google Scholar]
- Saama, P. Introduction to Resampling Methods—Based Methods; UCLA Office of Academic Computing: Los Angeles, CA, USA, 1997. [Google Scholar]
- Efron, B.; Tibshirani, R. An Introduction to the Bootstrap, 1st ed.; Chapman & Hall/CRC: Boca Raton, FL, USA; London, UK; New York, NY, USA; Washington, DC, USA, 1993; p. 456. [Google Scholar]
- Kisielińska, J. Dokładna metoda bootstrapowa i jej zastosowanie do estymacji wariancji. Przegląd Statystyczny 2011, 58, 1–2, 60–73. [Google Scholar]
- Davison, A.; Hinkley, D. Bootstrap Methods and Their Application; Cambridge Series in Statistical and Probabilistic Mathematics; Cambridge University Press: Cambridge, UK, 1997. [Google Scholar]
- Świć, A.; Wołos, D.; Gola, A.; Šmidová, N. Accuracy control in the process of low-rigidity elastic deformable shafts turning. Tehnicki Vjesnik-Technical Gazette 2019, 26, 927–934. [Google Scholar] [CrossRef]
- Dey, S.; Saha, M.; Maiti, S.S.; Jun, C.H. Bootstrap confidence intervals of generalized process capability index Cpyk for Lindley and power Lindley distributions. Commun. Stat.-Simul. Comput. 2018, 47, 249–262. [Google Scholar] [CrossRef]
- Kashif, M.; Aslam, M.; Rao, G.S.; Al-Marshadi, A.H.; Jun, C.H. Bootstrap confidence intervals of the modified process capability index for Weibull distribution. Arab. J. Sci. Eng. 2017, 42, 4565–4573. [Google Scholar] [CrossRef]
- Hall, P.; Härdle, W.; Simar, L. Iterated bootstrap with applications to frontier models. J. Product. Anal. 1995, 6, 63–76. [Google Scholar] [CrossRef]
© 2019 by the authors. Licensee MDPI, Basel, Switzerland. This article is an open access article distributed under the terms and conditions of the Creative Commons Attribution (CC BY) license (http://creativecommons.org/licenses/by/4.0/).