Experimental and Numerical Study on the Effect of the Temperature-Control Curtain in Thermal Stratified Reservoirs


Abstract
1. Introduction
2. Experimental Test
2.1. Test Methods
2.2. Generalization of Thermal Stratification
2.3. Model Scenarios
- Curtain position (CP), means the distance from the curtain to the outlet, with the unit of m.
- The water-retaining proportion (Pr), means the proportion of retaining water depth of TCC to the overall depth of the water, with the unit of %.
- Outlet submerged depth (OSD), means the depth from the water surface to the centerline of the outlet, with the unit of cm.
- Released flow quantity (RQ), means the flow quantity released from the outlet, with the unit of m3/h.
3. Three-Dimensional Numerical Simulation
3.1. Model Description
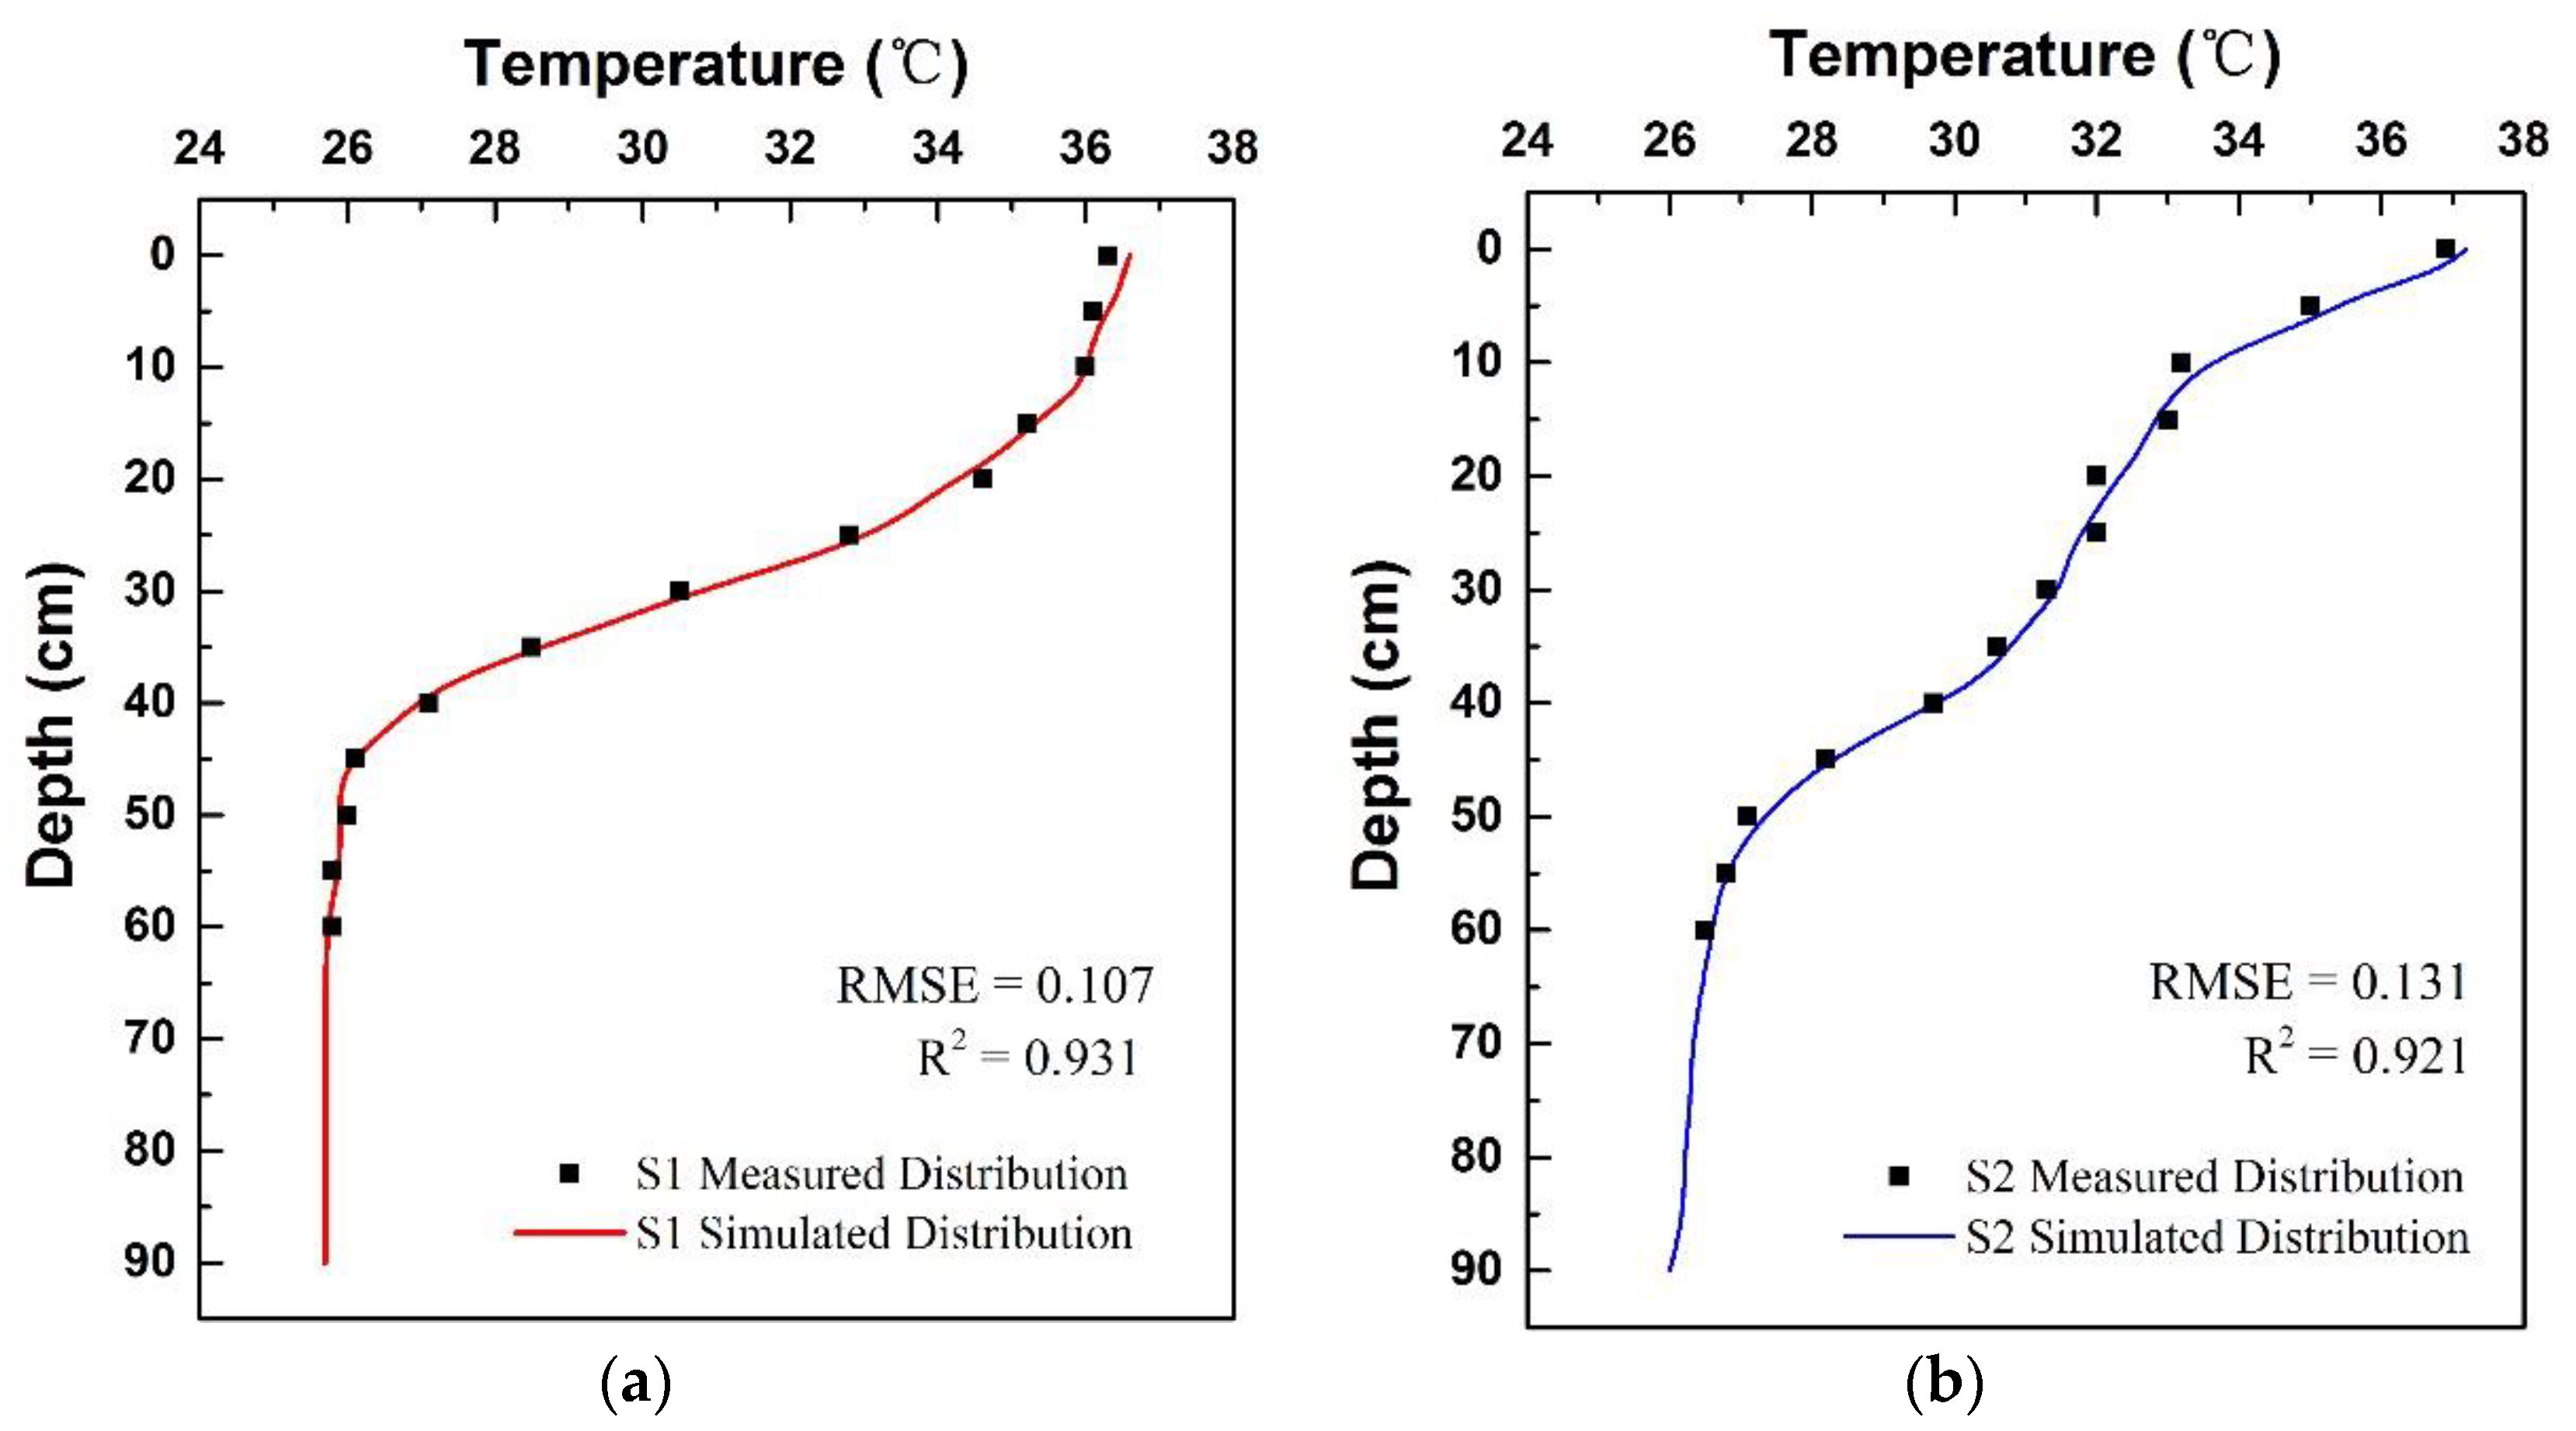
3.2. Model Verification
4. Results and Analysis
4.1. The effect of TCC and Cause Analysis
4.2. Analysis of Influencing Factors
4.2.1. Effect of CP
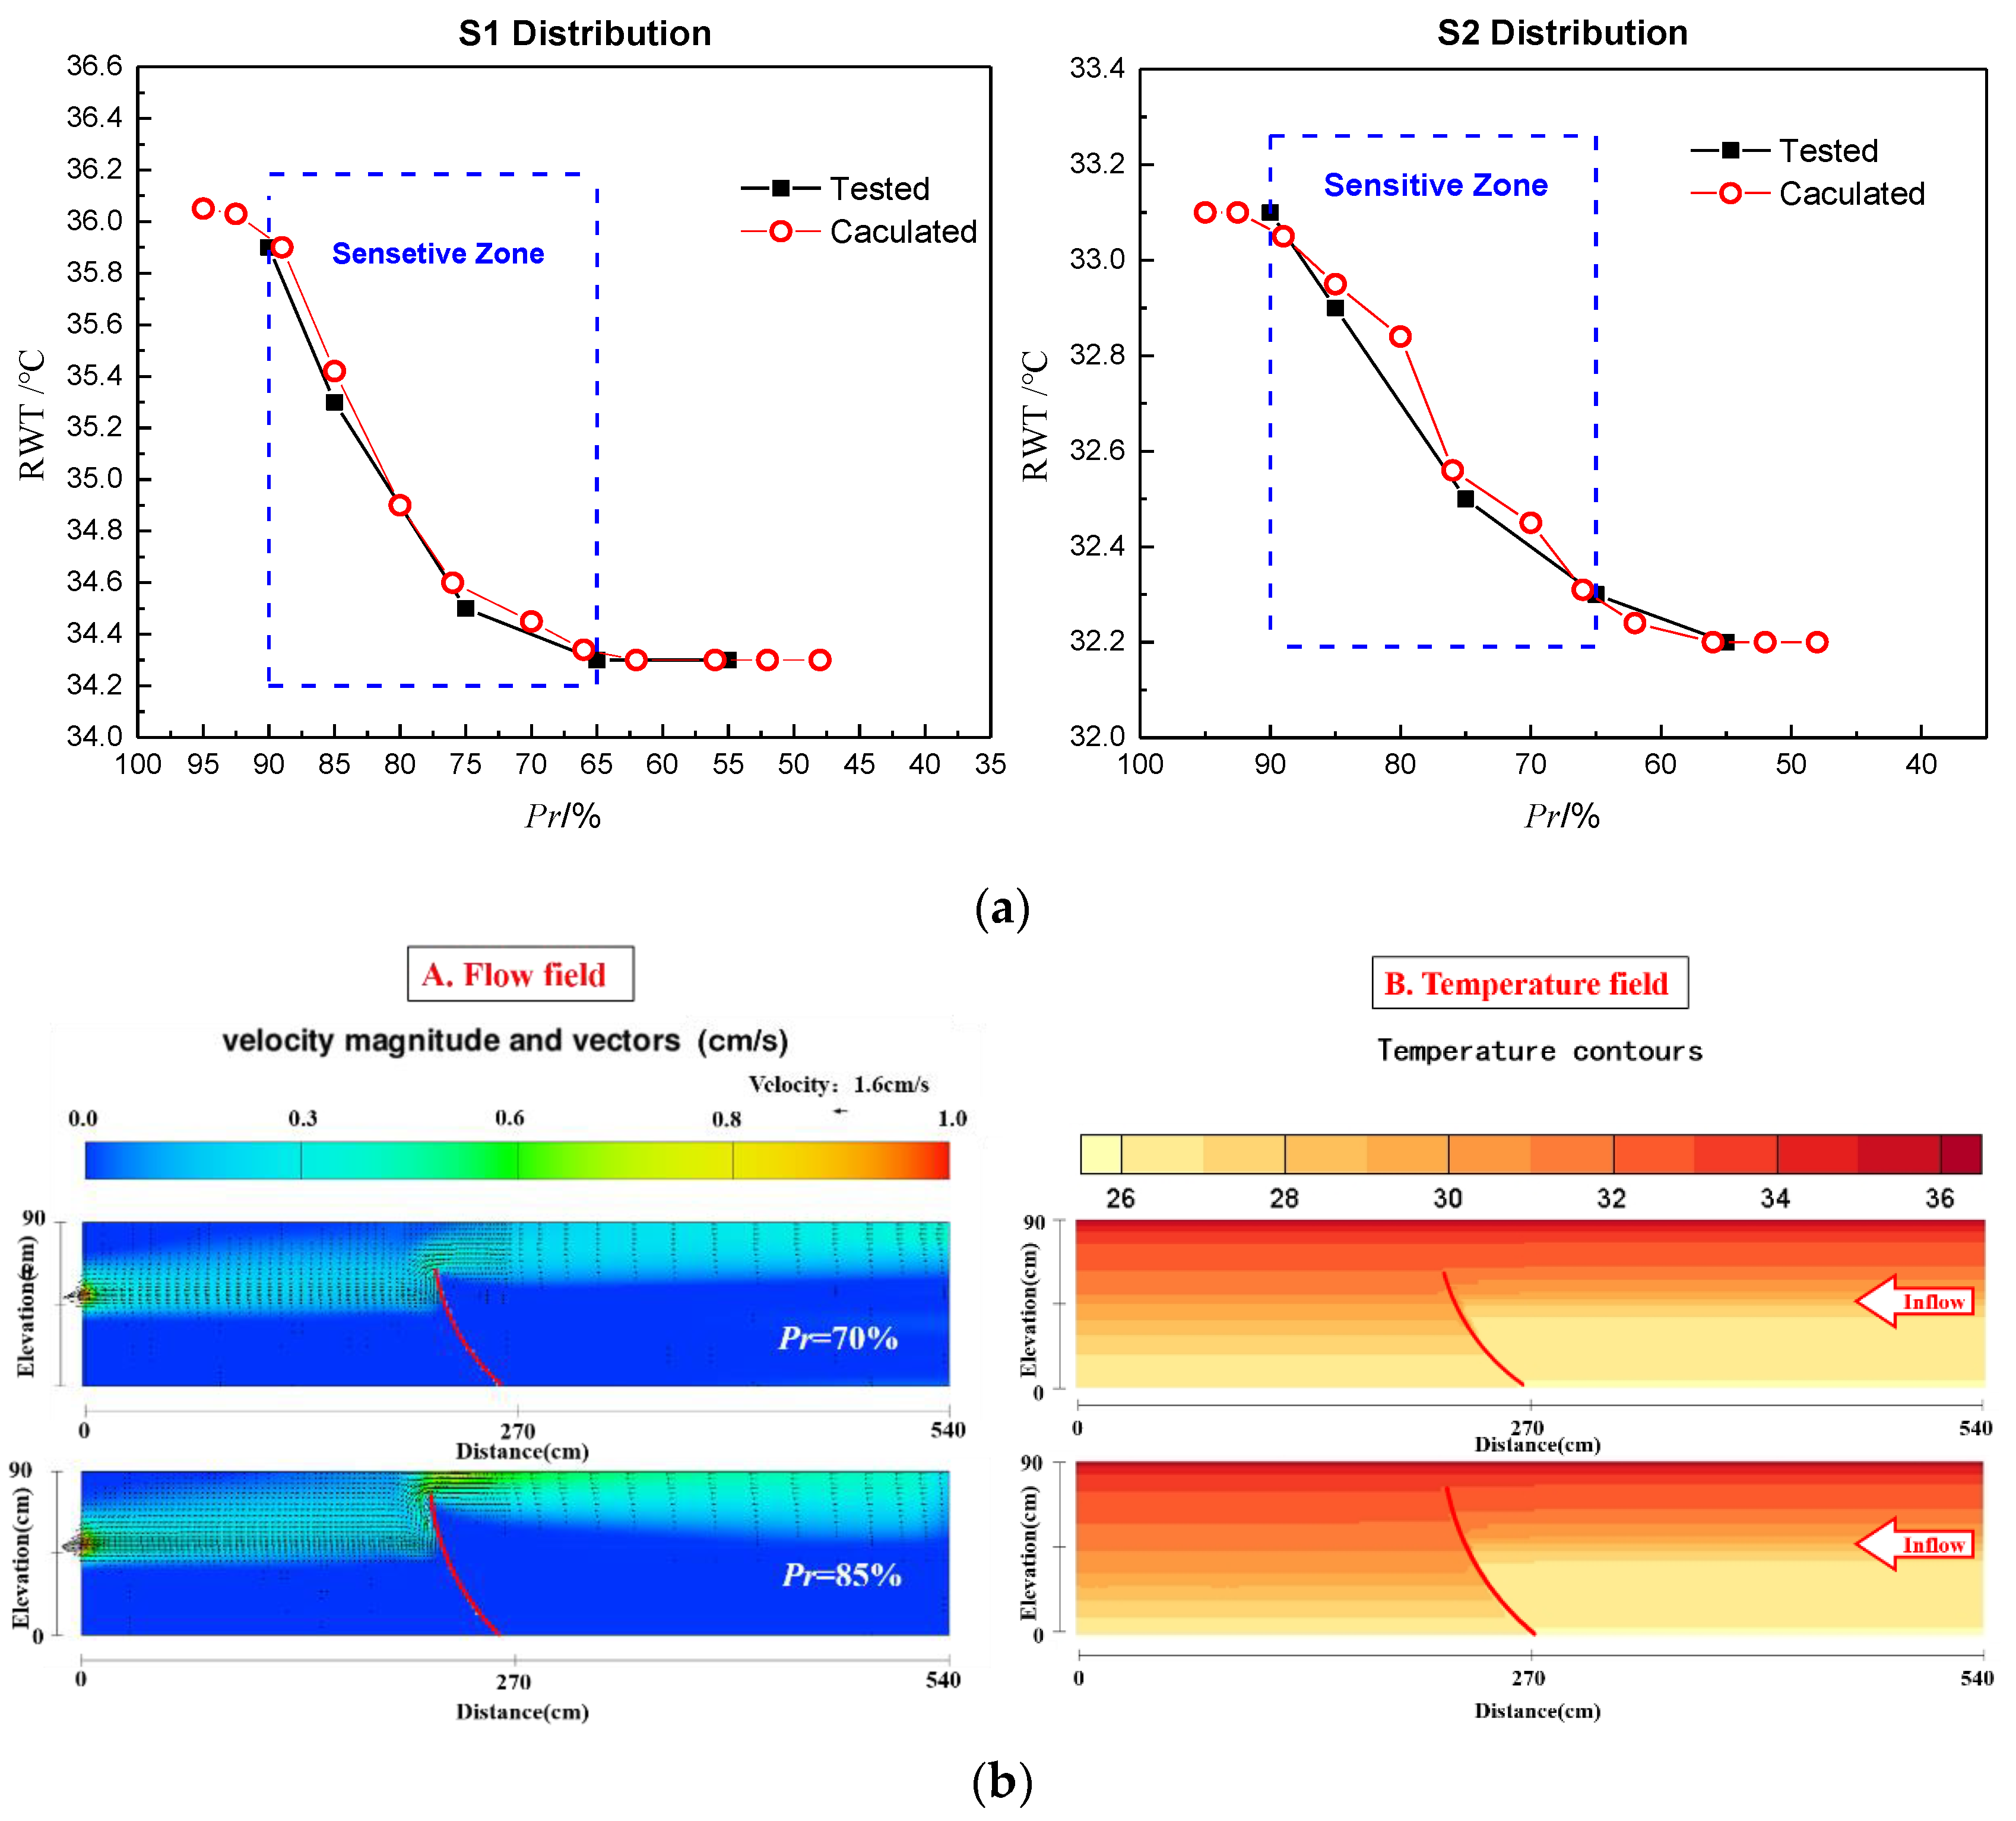
4.2.2. Effect of Pr
4.2.3. Effect of OSD
4.2.4. Effect of RQ
4.2.5. Construction Principle of TCC
5. Conclusions
- The regulating effects of TCC on the RWT is closely related to the temperature structure of waters. In S1 distribution, the maximum temperature increased by up to 8.3 °C, while this is only 3.5 °C under the S2 distribution.
- The CP has a little difference on RWT, the position of TCC should be determined after considering the complex terrains, economic condition, waterway transport, and other specific cases in actual engineering.
- The Pr directly affects the vertical range of water entering the discharge water. As the Pr increases, more upper, high-temperature water flows to the downstream of TCC drawn by the force of outlet. But there are critical values of Pr: When the value is out of the range 90%~65%, the impacts of Pr on RWT is negligible.
- When the water is released by spillway, variation of OSD has little effect on the thermal stratification of the forebay, which causes little impact on improving RWT.
- The change of RQ has a great influence on the flow field, and reduces the time that the forebay water takes to reach stability. But the effect of RQ on RWT is small; thus, in practical engineering, the variation of RQ can be decided by other complex factors and will not influence the improvement effect of RWT.
Author Contributions
Funding
Conflicts of Interest
Appendix A


References
- Bartholow, J.; Hanna, R.B.; Saito, L.; Lieberman, D.; Horn, M. Simulated limnological effects of the Shasta Lake temperature control device. Environ. Manag. 2001, 27, 609–626. [Google Scholar] [CrossRef]
- Palancar, M.C.; Aragon, J.M.; Sanchez, F.; Gil, R. Effects of warm water inflows on the dispersion of pollutants in small reservoirs. J. Environ. Manag. 2006, 81, 210–222. [Google Scholar] [CrossRef] [PubMed]
- Gelda, R.K.; Effler, S.W. Simulation of operations and water quality performance of reservoir multilevel intake configurations. J. Water Res. Plan. Manag. 2007, 133, 78–86. [Google Scholar] [CrossRef]
- Chao, X.; Jia, Y.; Shields, F.D.; Wang, S.S.Y.; Cooper, C.M. Three-dimensional numerical simulation of water quality and sediment-associated processes with application to a Mississippi Delta lake. J. Environ. Manag. 2010, 91, 1456–1466. [Google Scholar] [CrossRef] [PubMed]
- Arbat-Bofill, M.; Sanchez-Juny, M.; Blade, E.; Ninerola, D.; Dolz, J.; Palau, A. Hydrodynamics of Ribarroja Reservoir (Ebro River, NE Spain): Water Temperature, Water Velocities and Water Age. In Proceedings of the 7th International Conference on Fluvial Hydraulics-River Flow, Lausanne, Switzerland, 3–5 September 2014; pp. 1737–1744. [Google Scholar]
- Wang, S.; Qian, X.; Han, B.; Luo, L.; Hamilton, D.P. Effects of local climate and hydrological conditions on the thermal regime of a reservoir at Tropic of Cancer, in southern China. Water Res. 2014, 46, 2591–2604. [Google Scholar] [CrossRef] [PubMed]
- Lian, J.; Yao, Y.; Ma, C.; Guo, Q. Reservoir Operation Rules for Controlling Algal Blooms in a Tributary to the Impoundment of Three Gorges Dam. Water 2014, 6, 3200–3223. [Google Scholar] [CrossRef]
- Zouabi-Aloui, B.; Adelana, S.M.; Gueddari, M. Effects of selective withdrawal on hydrodynamics and water quality of a thermally stratified reservoir in thethe southern side of the Mediterranean Sea: A simulation approach. Environ. Monit. Assess. 2015, 187, 292. [Google Scholar] [CrossRef]
- Lindim, C.; Pinho, J.L.; Vieira, J.M.P. Analysis of spatial and temporal patterns in a large reservoir using water quality and hydrodynamic modeling. Ecol. Model. 2011, 222, 2485–2494. [Google Scholar] [CrossRef]
- Milstein, A.; Zoran, M. Effect of water withdrawal from the epilimnion on thermal stratification in deep dual purpose reservoirs for fish culture and field irrigation. Aquac. Int. 2001, 9, 81–86. [Google Scholar] [CrossRef]
- Foley, B.; Jones, I.D.; Maberly, S.C.; Rippey, B. Long-term changes in oxygen depletion in a small temperate lake: Effects of climate change and eutrophication. Freshw. Biol. 2001, 57, 278–289. [Google Scholar] [CrossRef]
- Butcher, J.B.; Nover, D.; Johnson, T.E.; Clark, C.M. Sensitivity of lake thermal and mixing dynamics to climate change. Clim. Chang. 2015, 129, 295–305. [Google Scholar] [CrossRef]
- Huang, B. Numerical Modeling Study of Discharge Water Temperature. Bull. Sci. Technol. 2015, 31, 45–48. [Google Scholar]
- Zhang, X.; Qian, A.; Wang, P.; Wang, Q.; Ge, D.; An, G. Impact of Temperature of Discharge Water from Jiasajiang I Hydropower Station on Fishes. Environ. Impact Assess. 2016, 38, 22–23. (In Chinese) [Google Scholar]
- Zhang, S.; Gao, X. Effects of Selective Withdrawal on Temperature of Water Released of Glen Canyon Dam. In Proceedings of the 2010 4th International Conference on Bioinformatics and Biomedical Engineering, Chengdu, China, 18–20 June 2010; pp. 1–4. [Google Scholar]
- Bohac, C. Underwater dam and embayment aeration for striped bass refuge. J. Environ. Eng. 1989, 115, 428–446. [Google Scholar] [CrossRef]
- Yu, Z.; Wang, L. Factors influencing thermal structure in a tributary bay of Three Gorges reservoir. J. Hydrodyn. 2011, 23, 407–415. [Google Scholar] [CrossRef]
- Yang, Z.; Liu, D.; Ji, D.; Xiao, S. Influence of the impounding process of the Three Gorges Reservoir up to water level 172.5 m on water eutrophication in the Xiangxi Bay. Sci. China Technol. Sci. 2010, 53, 1114–1125. [Google Scholar] [CrossRef]
- Anohin, V.V.; Imberger, J.; Romero, J.R.; Ivey, G.N. Effect of Long Internal Waves on the Quality of Water Withdrawn from a Stratified Reservoir. J. Hydraul. Eng. 2006, 132, 1134–1145. [Google Scholar] [CrossRef]
- Stevens, C.; Imberger, J. The initial response of a stratified lake to a surface shear stress. J. Fluid Mech. 1996, 312, 39–66. [Google Scholar] [CrossRef]
- Bohan, J.P.; Grace, J.L. Mechanics of Flow from Stratified Reservoirs in the Interest of Water Quality: Hydraulic Laboratory Investigation; US Army Engineer Waterways Experiment Station: Vicksburg, MS, USA, 1969. [Google Scholar]
- Bohan, J.P.; Grace, J.L. Mechanics of stratified flow through orifices. J. Hydraul. Div. 1970, 96, 2401–2416. [Google Scholar]
- Gao, X.; Li, G.; Han, Y. Effect of Flow Rate of Side-Type Orifice Intake on Withdrawn Water Temperature. Sci. World J. 2014, 2014, 1–7. [Google Scholar] [CrossRef]
- Gao, X.; Li, Y.; Song, H. Numerical study on hydraulic characteristics of the multi-level intake of Nuozhadu hydropower station. J. Hydroel. Eng. 2010, 29, 132–137. [Google Scholar]
- Shifei, T. Analysis of the operation of stratified water intake for laminated beam gate of Guangzhao Hydropower Station. Guizhou Water Power 2011, 4, 18–21. [Google Scholar]
- Marcela, P.; Marcela, H.; Larry, J.W. A numerical study of the temperature dynamics at McNary Dam. Ecol. Model. 2008, 212, 408–421. [Google Scholar]
- Vermeyen, T. Application of Flexible Curtains to Control Mixing and Enable Selective Withdrawal in Reservoirs. In Proceedings of the 5th International Symposium on Stratified Flows, Vancouver, BC, Canada, 10–13 July 2000. [Google Scholar]
- Shammaa, Y.; Zhu, D.Z. Experimental Study on Selective Withdrawal in a Two-Layer Reservoir Using a Temperature-Control Curtain. J. Hydraul. Eng. 2009, 136, 234–246. [Google Scholar] [CrossRef]
- Asaeda, T.; Priyantha, D.G.N.; Saitoh, S.; Gotoh, K. A new technique for controlling algal blooms in the withdrawal zone of reservoirs using vertical curtains. Ecol. Eng. 1996, 7, 95–104. [Google Scholar] [CrossRef]
- Rheinheimer, D.E.; Null, S.E.; Lund, J.R. Optimizing Selective Withdrawal from Reservoirs to Manage Downstream Temperatures with Climate Warming. J. Water Res. Plan. Manag. 2015, 1141, 1943–5452. [Google Scholar] [CrossRef]
- He, W.; Lian, J.; Liu, F.; Ma, C.; Pan, S. Experimental and Numerical Study on the Thrust of Water-retaining Curtain. J. Hydroinform. 2017, 20, 316–331. [Google Scholar] [CrossRef]
- Lian, J.; Du, H.; Ma, C. Effects of temperature control curtain on water releases in deep water reservoirs. Hydraul. Eng. 2016, 47, 942–948. [Google Scholar]
- He, W. Effect of Temperature-Control Curtain on the Outflow Temperature and its Thrust Force in a deep Stratified Reservoir. Doctor’s Thesis, Tianjin University, Tianjin, China, 2018. [Google Scholar]
- Lee, H.; Chung, S.; Ryu, I.; Choi, J. Three-dimensional modeling of thermal stratification of a deep and dendritic reservoir using ELCOM model. J. Hydro-Env. Res. 2013, 7, 124–133. [Google Scholar] [CrossRef]
- Moriasi, D.N.; Arnold, J.G.; Van Liew, M.W.; Bingner, R.L.; Harmel, R.D. Model Evaluation Guidelines for Systematic Quantification of Accuracy in Watershed Simulation. Trans. ASABE 2007, 50, 885–900. [Google Scholar] [CrossRef]
- Ibarra, G.; de la Fuente, A.; Contreras, M. Effects of hydropeaking on the hydrodynamics of a stratified reservoir: The Rapel Reservoir case study. J. Hydraul. Res. 2015, 53, 760–772. [Google Scholar] [CrossRef]
- Vinuesa, R.; Schlatter, P.; Nagib, H.M. Secondary flow in turbulent ducts with increasing aspect ratio. Phys. Rev. Fluids 2018, 3, 054606. [Google Scholar] [CrossRef]
- Vinuesa, R.; Schlatter, P.; Nagib, H.M. Role of data uncertainties in identifying the logarithmic region of turbulent boundary layers. Exp. Fluids 2014, 55, 1751. [Google Scholar] [CrossRef]


| Number | CP (m) | Pr (%) | OSD (cm) | RQ (m3/h) | Vertical Temperature Distribution | RWT (°C) |
|---|---|---|---|---|---|---|
| A0 | — | — | 40 | 6.4 | S1 | 27.5 |
| A1 | 3.5 | 85 | 40 | 6.4 | S1 | 35.3 |
| A2 | 2.5 | 85 | 40 | 6.4 | S1 | 35.4 |
| A3 | 1.0 | 85 | 40 | 6.4 | S1 | 35.3 |
| A4 | 3.5 | 90 | 40 | 6.4 | S1 | 35.9 |
| A5 | 3.5 | 75 | 40 | 6.4 | S1 | 34.5 |
| A6 | 3.5 | 65 | 40 | 6.4 | S1 | 34.3 |
| A7 | 3.5 | 55 | 40 | 6.4 | S1 | 34.3 |
| A8 | 3.5 | 85 | 36 | 6.4 | S1 | 35.6 |
| A9 | 3.5 | 85 | 32 | 6.4 | S1 | 35.7 |
| A10 | 3.5 | 85 | 28 | 6.4 | S1 | 35.8 |
| A11 | 3.5 | 85 | 24 | 6.4 | S1 | 35.8 |
| A12 | 3.5 | 85 | 40 | 1.6 | S1 | 35.2 |
| A13 | 3.5 | 85 | 40 | 4.0 | S1 | 35.3 |
| A14 | 3.5 | 85 | 40 | 8.8 | S1 | 35.6 |
| A15 | 3.5 | 85 | 40 | 11 | S1 | 35.6 |
| B0 | — | — | 40 | 6.4 | S2 | 29.7 |
| B1 | 3.5 | 85 | 40 | 6.4 | S2 | 32.9 |
| B2 | 2.5 | 85 | 40 | 6.4 | S2 | 32.8 |
| B3 | 1.0 | 85 | 40 | 6.4 | S2 | 32.9 |
| B4 | 3.5 | 90 | 40 | 6.4 | S2 | 33.1 |
| B5 | 3.5 | 75 | 40 | 6.4 | S2 | 32.5 |
| B6 | 3.5 | 65 | 40 | 6.4 | S2 | 32.3 |
| B7 | 3.5 | 55 | 40 | 6.4 | S2 | 32.2 |
| B8 | 3.5 | 85 | 36 | 6.4 | S2 | 33.0 |
| B9 | 3.5 | 85 | 32 | 6.4 | S2 | 33.0 |
| B10 | 3.5 | 85 | 28 | 6.4 | S2 | 33.2 |
| B11 | 3.5 | 85 | 24 | 6.4 | S2 | 33.2 |
| B12 | 3.5 | 85 | 40 | 1.6 | S2 | 32.7 |
| B13 | 3.5 | 85 | 40 | 4.0 | S2 | 32.8 |
| B14 | 3.5 | 85 | 40 | 8.8 | S2 | 33.1 |
| B15 | 3.5 | 85 | 40 | 11 | S2 | 33.1 |
| Parameters | The Size of Grid | RWT (°C) | Variation in RWT |
|---|---|---|---|
| Vertical | Original × 0.5 | 35.4 | +0.3% |
| Original × 2 | 34.8 | −1.5% | |
| Longitudinal | Original × 0.5 | 35.5 | +0.6% |
| Original × 2 | 34.6 | −2.0% |
© 2019 by the authors. Licensee MDPI, Basel, Switzerland. This article is an open access article distributed under the terms and conditions of the Creative Commons Attribution (CC BY) license (http://creativecommons.org/licenses/by/4.0/).
Share and Cite
Lian, J.; Li, P.; Yao, Y.; He, W.; Shao, N. Experimental and Numerical Study on the Effect of the Temperature-Control Curtain in Thermal Stratified Reservoirs. Appl. Sci. 2019, 9, 5354. https://doi.org/10.3390/app9245354
Lian J, Li P, Yao Y, He W, Shao N. Experimental and Numerical Study on the Effect of the Temperature-Control Curtain in Thermal Stratified Reservoirs. Applied Sciences. 2019; 9(24):5354. https://doi.org/10.3390/app9245354
Chicago/Turabian StyleLian, Jijian, Peiyao Li, Ye Yao, Wei He, and Nan Shao. 2019. "Experimental and Numerical Study on the Effect of the Temperature-Control Curtain in Thermal Stratified Reservoirs" Applied Sciences 9, no. 24: 5354. https://doi.org/10.3390/app9245354
APA StyleLian, J., Li, P., Yao, Y., He, W., & Shao, N. (2019). Experimental and Numerical Study on the Effect of the Temperature-Control Curtain in Thermal Stratified Reservoirs. Applied Sciences, 9(24), 5354. https://doi.org/10.3390/app9245354