Article

Mechanical Response and Fracture Behavior of Brittle Rocks Containing Two Inverted U-Shaped Holes under Uniaxial Loading

1
School of Resources and Safety Engineering, Central South University, Changsha 410083, China
2
Department of Mining and Geological Engineering, The University of Arizona, Tucson, AZ 85721, USA
3
The Robert M. Buchan Department of Mining, Queen’s University, Kingston, ON K7L3N6, Canada
*
Authors to whom correspondence should be addressed.
Appl. Sci. 2019, 9(24), 5327; https://doi.org/10.3390/app9245327
Submission received: 5 November 2019 / Revised: 2 December 2019 / Accepted: 4 December 2019 / Published: 6 December 2019
(This article belongs to the Section Mechanical Engineering)

Abstract

:
Hole defects embedded in rocks have a crucial influence on their stability and failure mechanism. The purpose of this research is to explore the mechanical response and fracture behavior around inverted U-shaped openings in rocks under compressive stress. To begin with, a multitude of uniaxial compression experiments on prismatic sandstone samples with one single or two inverted U-shaped openings with different configurations were carried out. In the experiments, the advanced DIC (digital image correlation) and AE (acoustic emission) apparatus was combinedly utilized to monitor the crack growth and determine the threshold stresses involved in fracture behavior. After that, the stress distributions around the openings under unidirectional stress were simulated by a numerical study. Test results suggest that the presence of openings strongly degrades the strength and deformation parameters, and the reduction degree depends on the number and configuration of openings. During the fracture process, five sorts of cracks, namely the elementary tensile crack, posterior tensile crack, slabbing crack, shear crack and spalling crack, are formed around the openings. For the samples containing two openings, three categories of hole coalescence appear: slabbing coalescence, shear coalescence and tensile coalescence. The failure mode of the samples containing one single or two diagonal openings is dominated by shear cracks, while that of the other samples is tensile-shear failure. Stress analysis shows that the concentrated stresses at the peripheries of the openings can better explain the fracture behavior.

1. Introduction

As a typical heterogeneous solid material, rock consists of different kinds of mineral grains and various native defects. On the basis of the geometric shape, the defects fall into two categories: holes and cracks. Literature manifests that the embedded defects in the rock lead to a noticeable deterioration of mechanical properties, such as the rigidity and strength [1,2]. That is why the stability of the large-scale rock mass is worse than that of the small-sized rock sample. Since stress concentration is easy to form in the vicinity of the defect, the probability of rock instability is higher under high in-situ stress [3]. Hence the frequency and amplitude of roof fall, rib slabbing and rock burst increase in deep rock engineering [4,5,6,7,8]. Essentially, rock failure is a process of crack evolution, namely cracks first originate at the corners of defects, then grow along the orientation of maximum principal stress and finally coalesce with nearby cracks [9]. Thus, investigating the crack propagation around the defects under loads is of tremendous significance to understand the failure mechanism of rock engineering and control their stability.
Study of crack growth has always been a hotspot in rock fracture mechanics. Over the past six decades, substantial experimental, numerical and theoretical attempts have been made to examine the mechanical properties and cracking behavior of rock or rock-like samples containing various crack flaws under different types of loads [10,11,12,13,14,15,16,17,18,19,20,21,22]. Results indicated that strength attenuation and failure pattern are codetermined by a series of factors, e.g., the length, angle, quantity and configuration of cracks, the inclination and length of rock bridge, the material properties and the loading methods. Those efforts provide strong support for revealing the failure mechanisms of jointed rocks under different stress states. Moreover, recent studies investigated the fracture assessment of rock materials in presence of notches and cracks as well. For instance, Razavi et al. [23] performed different modes of loading tests on asymmetric four-point-bend granite specimens containing a pre-crack to explore the fracture behavior, and the fracture loads were predicted using average strain energy density criterion. Wang and Hu [24] proposed a method to determine the tensile strength and fracture toughness of brittle rock material using small notched three-point-bend specimens.
Similarly, the effect of hole defects on mechanical behavior and failure characteristics of rocks has also received increasing attention in recent decades. For samples that contain a single circular opening in biaxial loading with low confining stresses, it is universally held that three sorts of cracks appear at the periphery of the opening; that is, elementary-tensile cracks located on the top and bottom, slabbing cracks formed on both sidewalls and remote (posterior-tensile) cracks distributed at the corners [25,26,27,28]. The occurrence sequence of these cracks depends on the opening size and confining stress. As the confining stress increases, both the elementary cracks and remote cracks are arrested and gradually disappear. Based on RFPA numerical modeling, Tang and his collaborators [29,30] concluded that the tensile cracks are far more likely to develop in narrow samples containing a large circular opening than that in wide samples containing a small one. Dzik and Lajtai [31] conducted uniaxial compression tests on granite samples with a circular opening of different radii, and found that the propagation characteristic of the tensile cracks is size dependent. Martin et al. [32] fitted a formula for the depth of a V-shaped notch caused by slabbing failure at the sidewall of a circular opening, which is a function of the opening radius, uniaxial compressive strength and maximum tangential stress. Besides, some researchers have also revealed the effect of opening size on crack initiation stress by attaching a large number of strain gauges round the circular opening [26,27,28]. However, it is difficult to arrange the strain gauges because we do not know where the cracks appear beforehand. By using acoustic emission (AE) technique and PFC software, Fakhimi et al. [33] carried out biaxial compression tests on Berea sandstone samples with a circular opening, reproducing the loading-induced failure round opening underground. Furthermore, the impact of lateral stress coefficient, rock homogeneity index, high-temperature treatment, tensile and dynamic loads on crack growth from a circular opening has also been analyzed experimentally and numerically [34,35,36,37,38,39]. In addition to one circular opening, Jespersen et al. [40], Lin et al. [41] and Huang et al. [42] further studied the cracking responses of samples containing multiple circular openings subjected to uniaxial compression. They stated that the failure is induced by the coalescence of partial openings, and the coalescence behavior is collectively controlled by the rock material, openings and loads.
To reflect the actual failure characteristic of openings in rock engineering, more non-circular shapes for openings in specimens were considered in previous studies, such as ellipse, inverted U-shape, trapezoid and rectangle [43,44,45,46,47,48,49,50], which have shed new light on the failure process of pre-holed rocks. Based on the literature review above, we can make a conclusion that the failure behavior of specimens with circular openings has been basically grasped, but that of the specimens with complex shaped openings has not been thoroughly realized. In mining and tunneling engineering, it is extremely common that two parallel roadways or tunnels are designed adjacent to each other. This makes the failure mechanism more complicated due to the interaction between openings. However, to date, only Yang et al. [51], Han [52] and Zhou et al. [53] reported the crack evolution in rock specimens containing two oval or rectangular openings under uniaxial or dynamic loading. Thus, we were inspired to conduct uniaxial compression tests on sandstone samples containing two openings with different configurations to explore the cracking behavior. In addition, the intact specimens and specimens with one single opening, acted as references for fracture analysis, were also tested. The cross-sectional shape of the fabricated openings was designed to be inverted U-shape given that it is widely used for openings in practice. During the tests, we applied the advanced digital speckle and AE techniques to monitor fracture development. An additional numerical study was also performed to simulate the stress distribution round the openings, which is rewarding to explain the fracture mechanism.

2. Material and Methods

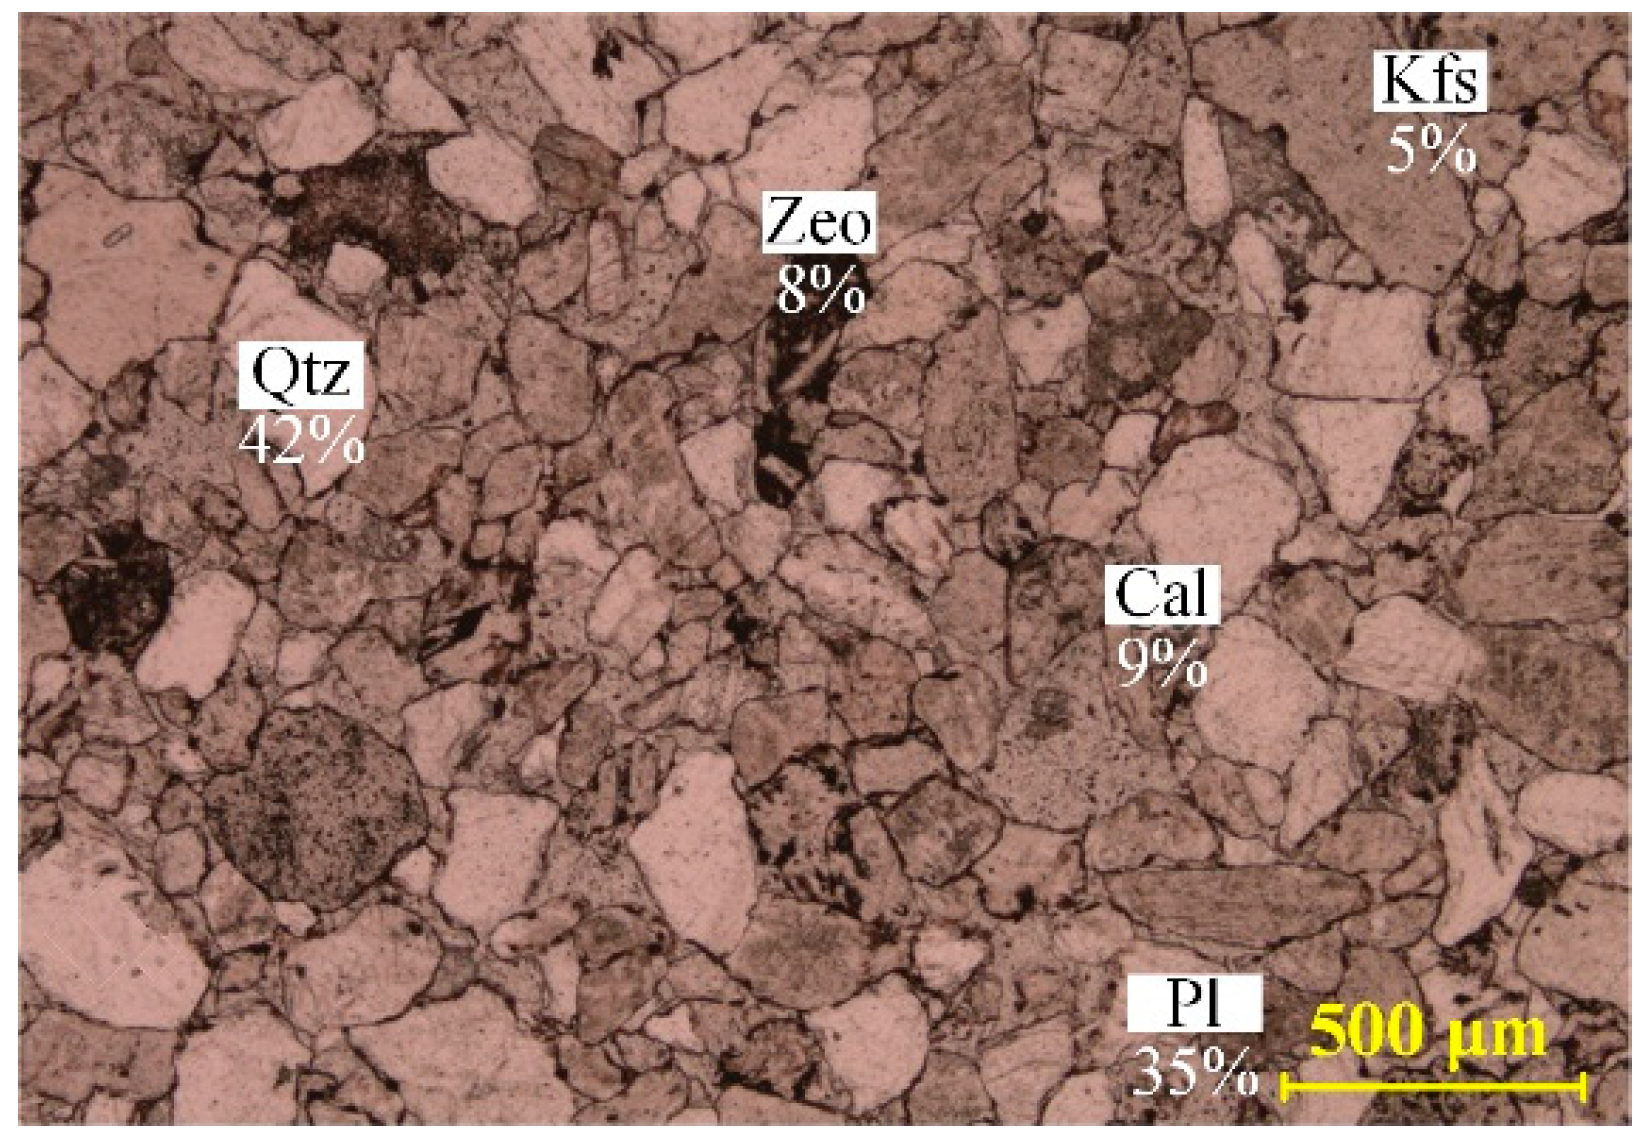
2.1. Sample Description

All the samples used for laboratory experiments were provided by a professional rock manufacturing company located in Liuyang county of China. The lithologic character of the selected rock material was tuffaceous feldspar quartz sandstone, which was formed in Cambrian Period, and the color was reddish brown. Compared with other types of rock material, this sandstone has relatively good homogeneity, continuity and isotropy [54]. The mineralogical analysis demonstrates that this rock is mainly made up of five types of minerals, as presented in Figure 1 [4]. Particles of the rock are medium-to-fine in size (0.15–0.50 mm), and the structure belongs to massive.
To obtain the basic mechanical parameters of this rock, according to the specifications for rock testing issued by the ISRM (International Society for Rock Mechanics and Rock Engineering) [55], many kinds of specimens were prepared. These specimens include three cylindrical specimens with a diameter of 50 mm and a height of 100 mm for uniaxial compression tests, three disk specimens with dimensions of 25 mm × 50 mm (thickness × diameter) for Brazilian tests, 15 cuboid specimens with dimensions of 50 mm × 50 mm × 50 mm for inclined plane shear tests, and three semi-circular bend (SCB) specimens with a thickness and a radius of 25 mm for three-point bend tests. All tests were conducted under displacement-control mode at a rate of 0.1 mm/min. The test results are given in Table 1. Note that the values of the cohesion and angel of internal friction were fitted by Mohr–Coulomb criterion on the basis of the results of the inclined plane shear tests.
Since three-dimensional cracks are difficult to form in thin plates, surface cracks can be devoted to characterizing their internal fracture. Thus, samples were designed to be a rectangular prismatic shape, and the length, thickness and width were set as 150 mm, 25 mm and 100 mm, respectively. All the surfaces of the samples shall be ground to ensure that the perpendicularity and parallelism meet the requirements of rock mechanics testing specifications [55]. A total number of 15 samples manufactured were equally categorized into five groups, as named C, S, H, D and V, respectively. Group C used as a reference contained three intact samples, while Group S denoted the samples with a single inverted U-shaped opening. In contrast, Groups H, D and V referred to the samples containing two inverted U-shaped openings with a rock bridge inclination of 0°, 45° and 90°, respectively. During sample preparation, a 50 HC cantilever waterjet 3-axis cutting machine was utilized to excavate the central holes, and the rock bridge length between the two openings was fixed to 20 mm. Figure 2 illustrates the detailed dimensions of the openings. Prior to loading, we adopted Vaseline to smooth the upper and lower surfaces of the samples before they were put on the loading platform. The purpose was to decrease the lateral friction between the samples and the compression platens.

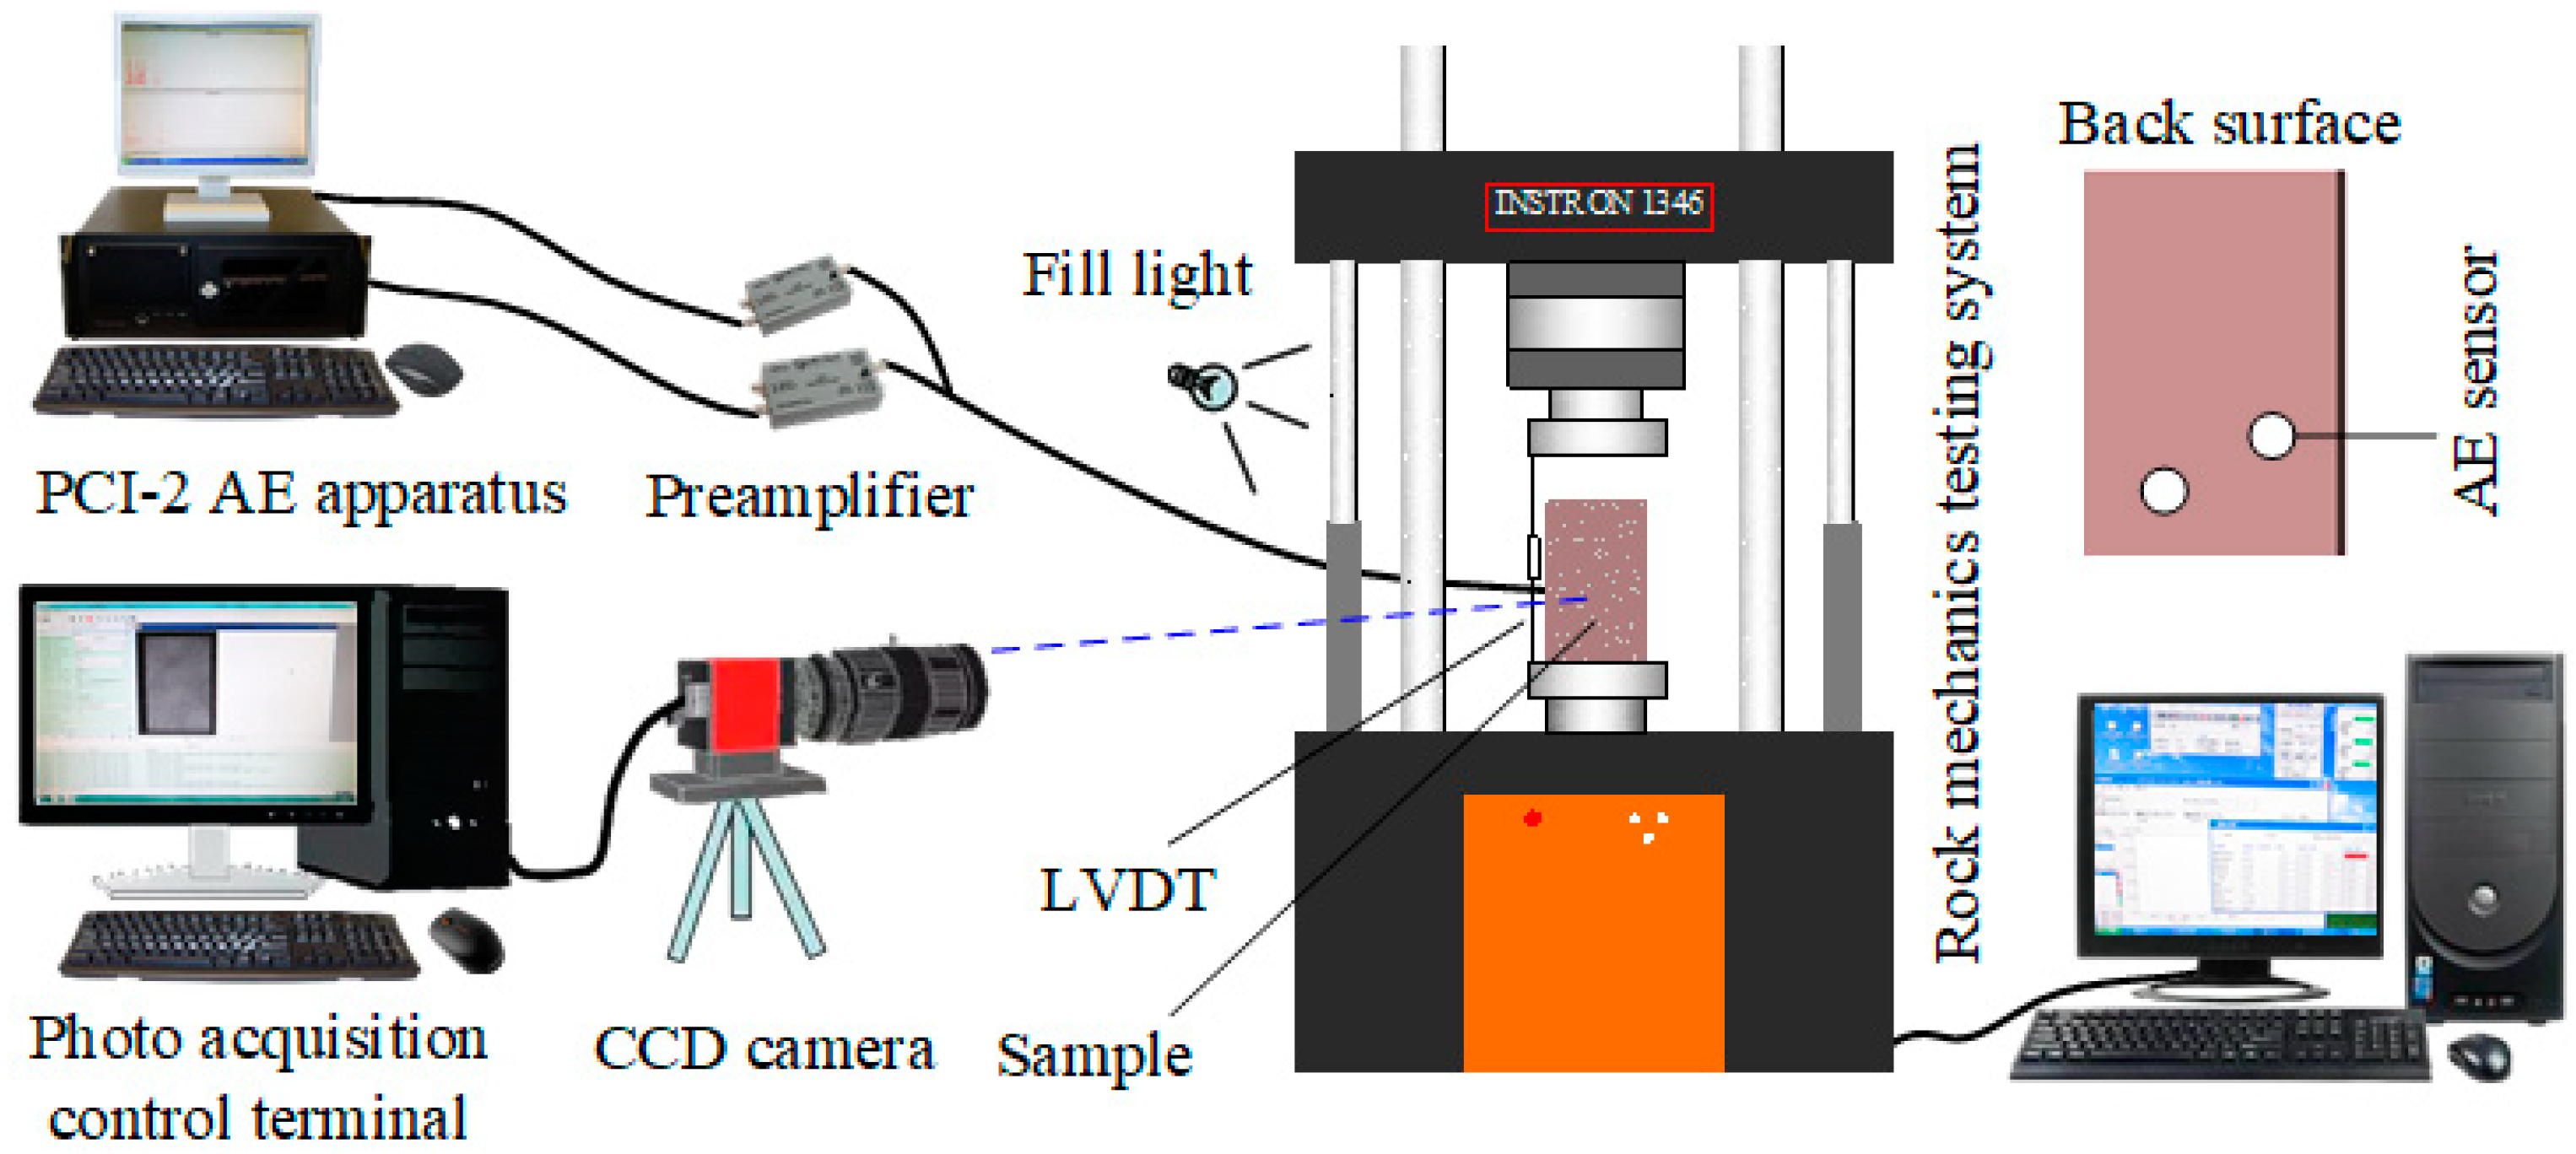
2.2. Experimental Facilities and Parameter Settings

Figure 3 presents the equipment used for laboratory experiments. It was made up of a set of servo-controlled loading device, a set of AE monitoring device and a set of DIC2D (digital image correlation) monitoring device. In order to ensure the time correspondence of different monitoring parameters, these devices need to be turned on simultaneously.
In this research, a high-capacity universal material testing system (Instron model 1346) at Central South University was applied to carry out the uniaxial compression tests. This apparatus can also perform other types of tests, such as the biaxial compression test, inclined plane shear test, tension test and flexure test. Its load precision and force capacity reach ±0.5% and 450,000 lbf, respectively. By using displacement-controlled loading method, loads were continuously exerted on the samples until failure occurred. The loading speed was 0.01 mm/s. Additionally, a LVDT deflection sensor was placed between the two compression platens to monitor the real-time displacements of the samples during the tests.
Due to the mighty merits like non-contact, non-intervention, high-precision, simple apparatus and easy operation, DIC approach was widespread devoted to monitoring the full-field deformation of rock samples under different loads. The calculation principle of this method is that, by comparing the photos of the sample before and after deformation, the new locations of all the points on the surface can be searched using correlation criteria, and then the displacement and strain can be calculated and visualized via digital image processing. To effectively distinguish the points, a speckle field was required to cover the monitoring surface of the sample before testing. The speckle distribution was random, which can be generated by subtly spraying the black and white paint on the observation surface. For more information regarding the speckle production, please refer to references [47,50]. In general, strain concentration occurs before the crack appears, i.e., strain localized areas indicate impending cracks. Consequently, we adopted a set of DIC device to monitor the crack development in this study. The main components of this device were charge coupled device (CCD) camera, photo acquisition control terminal and fill light. The model of the camera used was Basler piA2400-17gm, which could deliver 17 frames per second at 5 MP resolution; it was placed about one meter directly in front of the sample. With the aid of an operation software installed on the photo acquisition control terminal, the sizes of photos and sampling rate were set to 1100 (width) pixels × 1500 (length) pixels and 15 FPS, respectively. Besides, a LED lamp served as fill light was arranged next to the sample to provide illumination for picking high-resolution photos. Based on the consecutively collected photos, both the strain and displacement of the sample under any load can be visually presented through GOM Correlate software.
Currently, it is universally accepted that the damage of rock samples during loading can be evaluated based on AE signals [56,57,58]. This is because elastic wave will be generated when fracture occurs in samples. Thus, an AE device composed of an PCI-2 AE apparatus (including AE-win operating software), two MISTRAS 2/4/6 preamplifiers with a gain of 40 decibels and two pico-type resonant sensors with 250 KHz frequency was employed to detect the AE activities. An adhesive tape coupled with Vaseline was used to fix the sensors at the back surface of the specimen. Some basic AE acquisition parameters set for the tests are shown in Table 2.

3. Experimental Results and Analysis

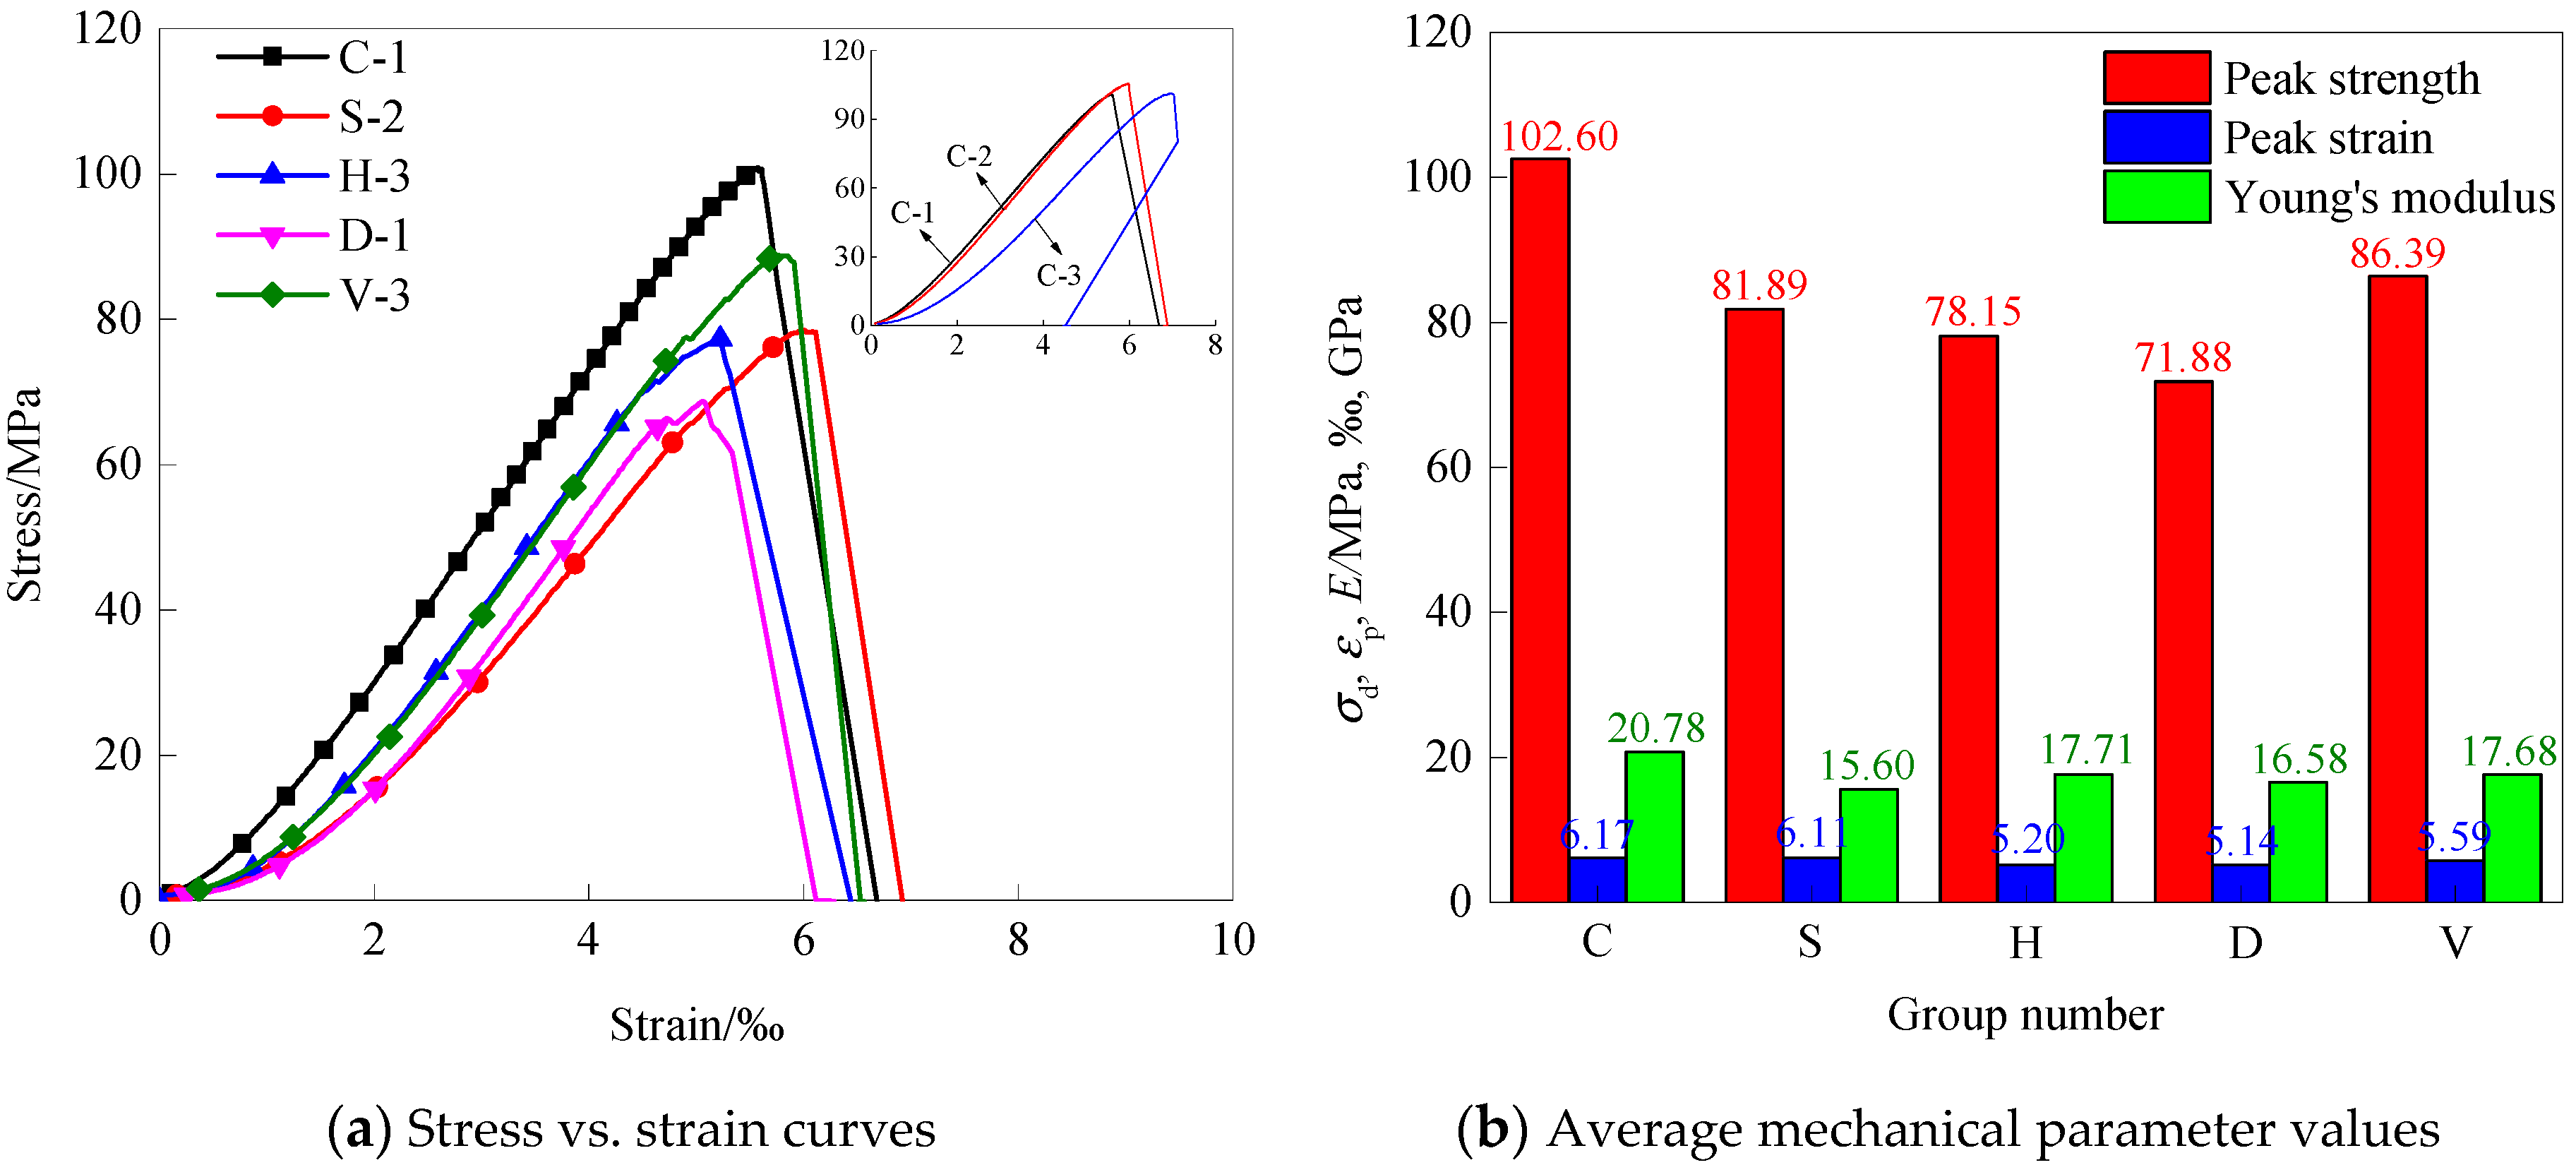
3.1. Strength and Deformation Properties

Based on the recorded data from uniaxial compression tests, the curves of stress versus strain of these rock samples can be easily plotted, which are presented in Figure 4a. It is observed that these curves were concave-upward at the initial loading stage, indicating the gradual shut of native cracks and pores in the samples under the action of compressive loads. When the elastic deformation stage was reached, the curves turned into straight lines; that is, the stress increased linearly with the increase of the axial strain. Afterwards, the curves became convex. This suggests the specimens experienced plastic deformation resulting from the initiation and development of cracks. After the peak point, the specimens lose their bearing capacity quickly, showing significant brittleness. Therefore, the whole deformation process contains four typical phases: native defects closure, elastic deformation, plastic deformation and post-peak failure. Besides, it can be seen that the curves of the pre-holed specimens fluctuate when approaching the peak point. This is caused by the sudden occurrence of cracks, which will be interpreted at length in the next section.
Details of the physical dimensions and mechanical parameters of all the samples are shown in Table 3. In which, σp, εp and E denote the uniaxial compressive strength, peak strain and Young’s modulus, respectively. Note that the Young’s modulus was defined as the slope of the elastic deformation portion of the stress–strain curve, which can be obtained by linear fitting. As seen in Table 3, the peak strength of the three intact specimens was 100.9 MPa, 105.6 MPa and 101.3 MPa, respectively, with the coefficient of variation of 2.49%. Moreover, the corresponding three values of the Young’s modulus were also very close. This manifests that the sandstone possessed a relatively high degree of homogeneity. However, compared with the specimens CS-1 and CS-2, the axial strain of the specimen C-3 at the initial loading stage was large (see Figure 4a), which may result from the poor parallelism of the specimen ends or the loose contact between the LVDT and compression platens.
Figure 4b illustrates the average mechanical parameter values of different groups of samples. It was found that the mechanical properties of the samples with openings, including the σp, εp and E, were much lower than those of the intact samples, and the degree of weakening was closely associated with the configuration of openings. For the uniaxial compressive strength, the reduction rate ranged from 15.80% to 29.94%, and the values of these groups could be ordered from large to small as: C (102.60 MPa) > V (86.39 MPa) > S (81.89 MPa) > H (78.15 MPa) > D (71.88 MPa). Interestingly, observations demonstrate that the average strength of Group V was even higher than that of Group S. This behavior was attributed to different stress distributions round the openings, which would be detailedly illustrated in the numerical study section. In terms of the Young’s modulus, the average value of Group C was the largest, followed by Groups H, V, D and S, with a decrease extent of 14.76%–24.93%. Besides, compared with the intact rock samples, the peak strains of the holed samples were also reduced to varying degrees. Among them, Group S had the largest peak strain (6.11‰), while the strain of Group D was the smallest. In conclusion, both the quantity and configuration of the openings exerted a significant influence on the strength and deformation properties.

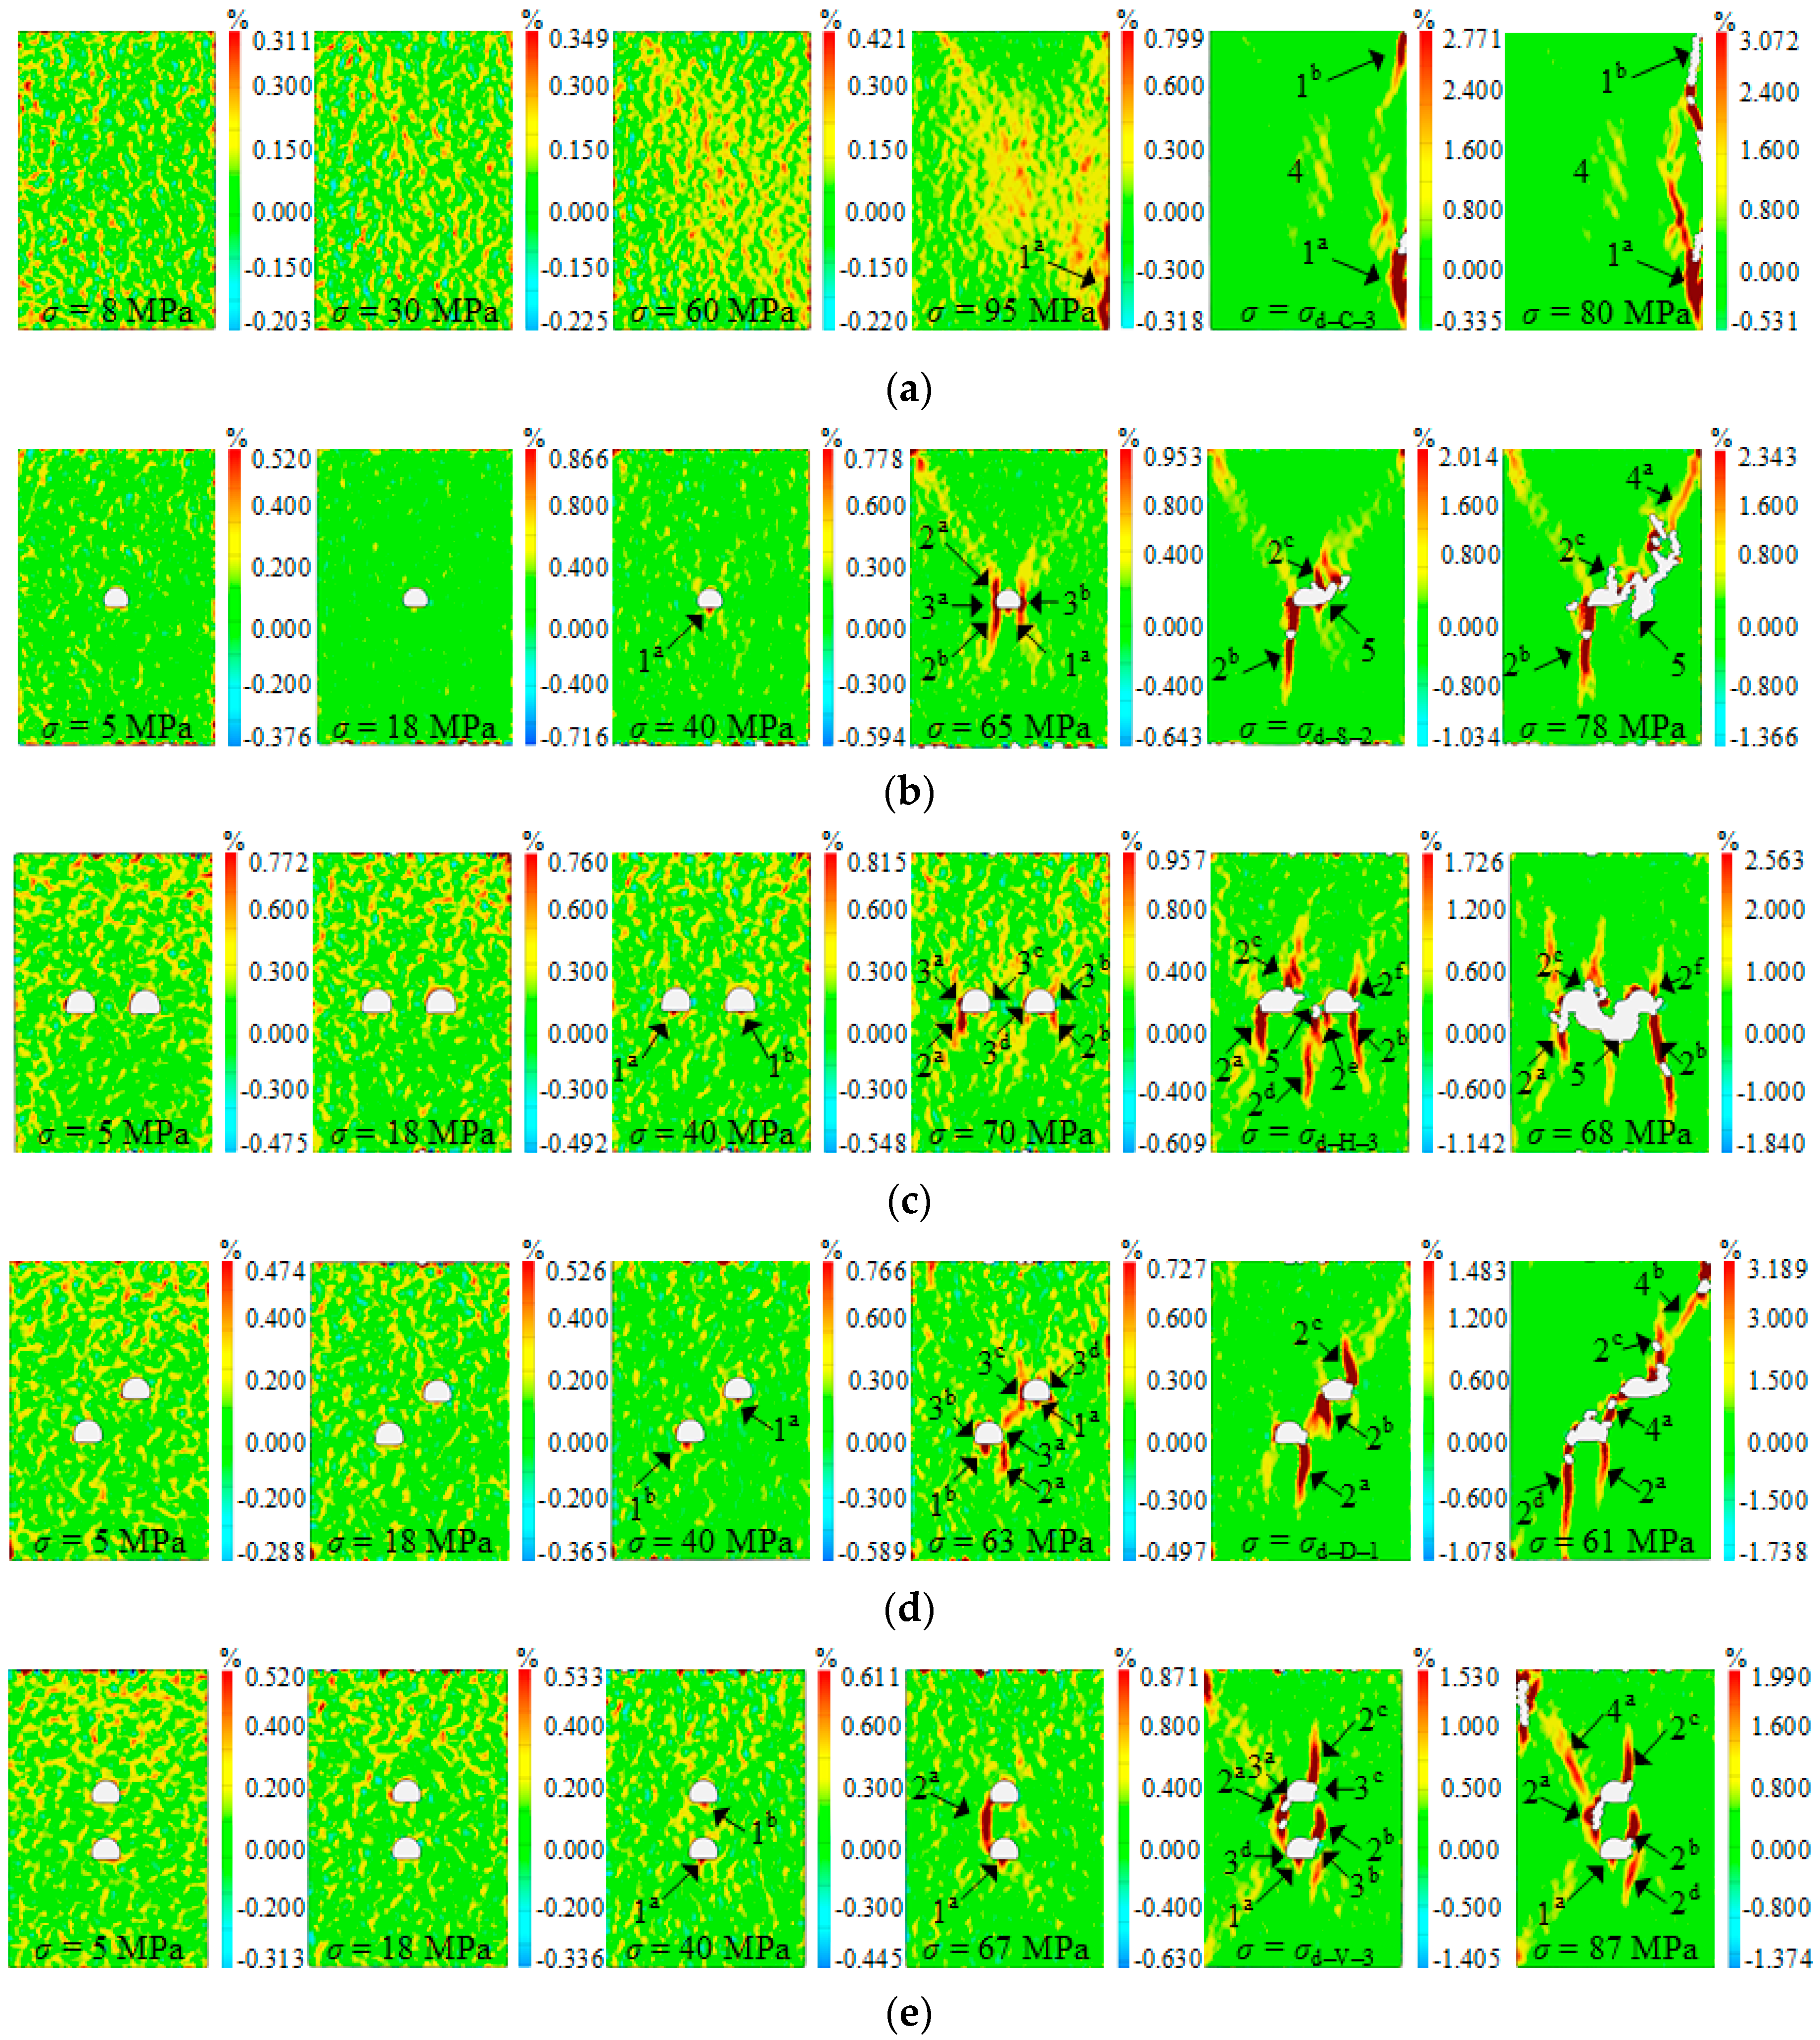
3.2. Fracture Development and Failure Patterns

Generally, under the action of loads, the compressive stress or tensile stress will concentrate around the opening. As the applied load increases, the stress concentration factor rises accordingly. As a consequence, tensile or shear cracks will occur when the tensile strength or cohesion is surpassed. Meanwhile, strain localization is gradually formed at the stress concentration zones. Therefore, the DIC technology was used to monitor the fracture process of samples under uniaxial loading. By importing the recorded speckle photos into GOM Correlate software, both the real-time strain and displacement distributions of each sample can be visualized. Figure 5 shows the principal strain contours of five representative samples during uniaxial loading. In the figure, the numbers 1, 2, 3, 4 and 5 marked represent the elementary tensile cracks, posterior tensile cracks, sidewall slabbing cracks, shear cracks and surface spalling cracks, respectively. For the lowercase letters that located on the upper-right corner of the number, they denote the occurrence sequence of the same pattern of cracks.
(1) Sample C-3
In Figure 5a, the fracture growth of the sample C-3 in uniaxial compression is clearly shown. At 8 MPa, plenty of yellow and red spots with high strain appeared on the surface of the sample because of the shut of the native micro defects under compression. When the applied stress increased to 30 MPa, it was found that the quantity of these spots went up accordingly. This is because some new micro cracks emerged near the native defects in the elastic deformation stage. At a stress level of 60 MPa, the high strain spots were observed to distribute in the vicinity of the main diagonal of the sample. As the axial stress mounted further, high strain areas gradually gathered along the principal diagonal and the right end. At 95 MPa, a tensile crack 1a emanating from the lower-right corner of the sample grows along the loading direction. When reaching the peak stress, the other tensile crack 1b symmetric with the crack 1a appeared in the upper-right corner of the sample. These two cracks propagated towards each other, and finally get coalesced at the post-peak failure stage. Besides, it could be seen that a shear band 4 occurred in the center of the sample. It would develop into a shear crack along the counter diagonal and intersect with the connected two tensile cracks at the end of the test.
(2) Sample S-2
Figure 5b illustrates the principal strain distributions of the sample S-2 at six representative stress levels. Based on that, the fracture process can be summarized as follows. At the first loading stage, the strain distribution was similar to that of the sample C-3. When the elastic deformation stage was approached, only a few spots appeared, indicating the quantities of the formed micro cracks were relatively small. After that, an elementary tensile crack 1a initiated from the floor of the opening and propagated slowly towards the direction of the maximum compression. When the axial stress was 65 MPa, it was found that the sidewall slabbing cracks 3a and 3b occurred on the two sides of the opening, resulting in the appearance of V-shaped notches. Two posterior tensile cracks 2a and 2b were also gradually formed at the upper-left and lower-left corners of the opening in turn. However, compared to the situation at 40 MPa, the length of the crack 1a was shortened. At the peak point, the cracks 1a and 2a disappeared completely, while the crack 2b was getting longer. Additionally, another posterior tensile crack 2c at the upper-right corner of the opening was observed, and some surface spalling cracks 5 appeared on the right side of the opening because of the high level of concentrated compressive stress. At 78 MPa after the peak, the spalling area enlarges and a shear crack 4a emerged in the upper-right corner of the sample. This shear crack would continue propagating along the counter diagonal until it merged with the right V-shaped notch. After that, the other shear crack 4b appeared in the lower-left corner of the sample and intersects with the left V-shaped notch, leading to the sample instability.
(3) Sample H-3
The variation of the principal strain field in the sample H-3 with the axial stress is given in Figure 5c. At the first two loading stages, the strain change laws were consistent with those of the samples C-3 and S-2. In the plastic deformation stage, two elementary tensile cracks 1a and 1b first occurred on the bottom of the opening simultaneously. Then the V-shaped notches occurred one by one on both sides of the two openings owing to the emergence of sidewall slabbing cracks (3a–3d). Afterwards, two vertical posterior tensile cracks 2a and 2b appeared at the lower-left corner of the left opening and the lower-right corner of the right opening, respectively. Note that, in this period, the cracks 1a and 1b gradually disappeared as the posterior tensile cracks grew. When the stress rose to the peak, the other four posterior tensile cracks (2c–2f) emerged at the corners of the openings and propagated in parallel with the compression direction. When the stress dropped from the peak to 68 MPa, the two openings coalesced due to the connection between the two adjacent V-shaped notches, then the sample failed when the shear crack emerging at the lower-left corner of the sample reached to the left opening and the crack 2c propagated to the upper end of the sample.
(4) Sample D-1
As shown in Figure 5d, the fracture development around the two openings in the sample D-1 subjected to uniaxial compression was distinctly reproduced. Likewise, the primary pores and fine fissures in the sample would close under the action of a small load. Correspondingly, numerous yellow spots occurred in the sample at the start of the test. During the elastic deformation, some micro cracks might be formed round these defects owing to stress concentration. At 40 MPa, two elementary tensile cracks 1a and 1b emerged at the floors of the two openings, but the crack 1a initiated first. As the stress continued increasing, the slabbing failure happened on the sides of the openings and the V-shaped notches came into being. Next, a posterior tensile crack 2a parallel to the orientation of the load appeared at the lower-right corner of the lower-left opening. With the growing of the stress to the maximum stress, the length of the crack 2a increased, and the other two posterior tensile cracks 2b and 2c were formed round the upper-right corner opening. After the peak, the two openings got linked via an initiated shear crack 4a. Additionally, the other shear crack 4d occurred in the upper-right corner of the sample and would link with the V-shaped notch on the right side of the upper-right opening at last.
(5) Sample V-3
Figure 5e displays the principal strain states of the observation surface of the sample V-3 in the process of uniaxial loading. Similarly, several types of cracks appeared sequentially at the periphery of the two openings during sample loading. In other words, firstly, two elementary tensile cracks 1a and 1b occurred on the bottom of the lower and upper openings, respectively. Secondly, a posterior tensile crack 2a initiated from the lower-left corner of the upper opening and propagated straight to the opening below with the increasing stress. At the peak stress, it was observed that the other two posterior tensile cracks 2c and 2d had emerged at the upper-right corners of the two openings. During the propagation of these posterior tensile cracks, the slabbing cracks were found to appear on the opening sides. At the post-peak failure stage, a shear crack appeared in the upper-left corner of the specimen. Once it gets connected with the crack 2a and the new formed posterior tensile crack 2d at the lower-right corner of the lower opening, the failure would take place.
Based on the DIC experimental technique, we could also visualize the displacement contours of these samples at different loading times. Figure 6 presents the horizontal displacement states of the above samples at the same stresses. The displacement symbol is defined as: if rock particles move to the right, the displacement is positive. Otherwise, the displacement is negative. In Figure 6a, the displacement of the left blue part of the sample C-3 was negative at the early loading stages, suggesting that this part of rock moved towards the left. As the stress grows, a yellow curved area with positive displacement was gradually formed near the right border. It was symmetrically distributed with the blue curved area near the left end. Due to the end friction, the displacements of regions near the loading ends were basically zero. As a result, the shear band 4 would be formed on the diagonal and the right yellow part would be split when the two cracks 1a and 1b get connected. For the sample S-2, first, a triangular cyan area with negative displacement on the left side of the opening gradually appeared as the stress rose. At 40 MPa, it could be seen that there was a short dividing line between the green and cyan areas on the floor of the opening. This formed boundary was the crack 1a. At 65 MPa, the cyan area evolved into a trapezoidal blue area. Obviously, the right boundary of this area represents the cracks 2a and 2b. Meanwhile, a triangular yellow area with positive displacement appears on the right side of the opening. At the maximum stress, it was found that the boundary of the cyan area at the upper-left corner of the opening disappeared, while that at the lower-left corner prolongs. This proved that the crack 2b lengthened. Besides, at the upper-right corner, a vertical line representing the crack 2c emerged as well. At 78 MPa after the peak, a yellow shear band appeared in the upper-right corner of the sample. Similarly, according to the displacement distributions of the rest samples in Figure 6b–e, it can be summarized that the displacement variation during the loading was agreeable with the fracture development. That is to say, the dividing lines between two different color areas on the sample surface would occur at the places where the cracks appear.
From the above description, we could reach a conclusion that five sorts of cracks, namely, elementary tensile crack, posterior tensile crack, sidewall slabbing crack, shear crack and surface spalling crack, were formed in the samples containing inverted U-shaped openings during uniaxial compression. For the samples containing two openings, three categories of hole coalescence were observed in this research: the slabbing coalescence, the shear coalescence and the tensile coalescence. The final failure modes of the above five samples are shown in Figure 7. In the figure, the red line means the failure path, and the black dotted line denotes the appeared crack, which is not easy to identify using the naked eye. To sum up, the failure mode of the samples S-2 and D-1 was shear-dominated failure, while that of the other three samples belonged to tensile-shear failure. To put it differently, the instability of the sample S-2 was attributed to the intersection of the shear cracks (4a and 4b) and the V-shaped notches, while that of the sample D-1 was induced by the coalescence of the shear cracks 4a, 4b and 4c. For the intact sample C-3, the failure resulted from the connection between the shear crack 4 and the merged tensile cracks 1a and 1b. With regard to the samples H-3 and V-3, the coalescence of the shear cracks and the posterior tensile cracks gives rise to the final instability. Since the brittleness of the rock was extremely remarkable, the failure of these samples was violent and rapid. As a result, the collected photos of the samples after the peak were relatively few, and the post-peak failure behavior was hard to monitor. Besides, at the end of the tests, it was found that partial posterior tensile cracks propagated further toward the upper or lower ends. However, when approaching the loading ends of the sample, the propagation direction of the posterior tensile cracks was deflected because of the end friction. The other shear cracks also appeared on the diagonal and propagated towards the opening sidewalls. It is noted that some unmarked cracks are observed in Figure 7, which were formed after failure, and did not take charge of the eventual failure.

3.3. AE Activity and Threshold Stress

In AE tests, the ringing count represents the number of signal oscillations that cross the detection threshold. It can be used for reflecting both the frequency and intensity of the AE signal. Thus, in this study, the ringing count and cumulative ringing count were selected as the evaluation indexes of the AE activity. The curves of the applied stress, AE count and cumulative AE count versus the loading time are plotted in Figure 8.
Based on the crack development of the samples under uniaxial compression, the corresponding AE activity can be classified into five stages. The characteristics of the stages are described as follows:
Stage I: At this stage, the native defects slowly shut under the action of loads, which will not generate a great amount of strain energy. As a consequence, the AE activity is not very active. Thus, the quantity of detected AE count is relatively small and the cumulative AE count grows nonlinearly.
Stage II: As the stress rises, the samples deform elastically in this stage. Moreover, some micro cracks occur round the tips or corners of the natural defects. This gives rise to the growing increase of the released strain energy. Therefore, both the AE count and the cumulative AE count increase to varying degrees. In terms of the sample D-1, the reason why the AE signals are not remarkable at this stage may be that the coupling between the sensor and the rock sample is not very good during loading.
Stage III: In this stage, the AE count of the sample remains basically the same and the cumulative AE count increases linearly. This is because the elementary tensile cracks appear and propagate stably along the loading direction under increasing loads. Therefore, this stage can be named the stable crack growth stage.
Stage IV: During this stage, the slabbing crack and posterior tensile crack occur rapidly. Consequently, the AE activity is extremely active, accompanying by several significant jump of AE count. This is induced by the rapid appearance of cracks or coalescence between cracks. It is noted that when the posterior tensile crack propagates to the V-shaped notch, the stress fluctuation is corresponded. Hence this stage is unstable cracking stage.
Stage V: At the last stage, the shear cracks are formed and then intersect with the V-shaped notch or the posterior tensile crack. This triggers the instability of rock samples. Accordingly, the AE count increases drastically and the axial stress decreases to zero in a short time.
Clearly, the variation of AE signals was agreeable with the crack development shown in Figure 6. Besides, according to the divided stages, it was obvious that several stress thresholds were related between the adjacent stages, namely, the crack closure stress (σc) between the stages I and II, the crack initiation stress (σi) between the stages II and III and the crack damage stress (σd) between the stages III and IV as well as the peak stress (σp) between the stages IV and V. For the σc, it corresponds to the axial stress when the stress–strain curve turns from nonlinearity to linearity. In regard to the rest stress thresholds, they can be determined by combining the crack development and AE signals; that is, if the strain localization and significant AE count occur simultaneously, new crack initiates or crack coalescence occurs. Table 4 lists the threshold stress values of the above five samples subjected to uniaxial compression.
As shown in Table 4, the σc of the sample C-3 was 23.89% of the σp, whilst that of the samples containing inverted U-shaped openings was within the range of (12.50%–17.83%)σp. The reason may be that the excavation of the openings at the center of the samples gives rise to the decrease in the numbers of natural defects. In respect of the σi, it corresponded to the axial stress when the crack 1a started to initiate. The value of the sample C-3 was 0.44σp. In contrast, the values of the other samples ranged from 0.27σp to 0.30σp. The order of the initiation stress of the samples with openings could be ranked as: sample V-3 > sample H-3 > sample S-2 > sample D-1. This is because the tensile cracks occurred more easily around the openings than in the intact sample, and the crack initiation stress was attributed to the stress state of the roof or floor of the opening, which would be illustrated in detail in the next section. With regard to the σd, for the samples with openings, it corresponded to the stress when the slabbing crack or the posterior tensile crack emerged, and their values were 0.65–0.78 times the peak stresses. This would also be deeply analyzed in Section 4.

4. Stress Distribution around Opening

As stated above, the initiation position and sequence of the cracks, especially the elementary tensile cracks, rely on the surrounding stress around the opening under loads. To grasp the mechanism of crack development, a numerical study was conducted to simulate the stress states around the openings under uniaxial compressive loads.
Since the crack occurred in stage Ⅲ is related to the surrounding stress of the opening, it is meaningful to analyze the surround stress of the opening at the elastic deformation stage. Therefore, this problem is simplified into solving the stress distribution at the periphery of the opening in elastic plate under a constant uniaxial compressive stress. In this section, FLAC software was used for numerical simulation. Considering the difficulty in numerical modeling, the Midas/GTS software was used to build the model, and then imported it into FLAC software for post-processing. To reduce boundary effect, the sizes of the numerical model were determined as 150.0 m (length) × 0.5 m (thickness) × 150.0 m (height). They were more than ten times the maximum dimensions of the opening. To accurately reflect the true stress states, by means of grid seeding, the dimension of the grid near the opening was 0.1 m, while that away from the opening was 5 m.
To study only the elastic stress distribution, both the shear and bulk moduli of the model were given a large value, and the elastic model was selected as the rock constitutive model. Moreover, the gravity of the model was neglected. The velocity of the surrounding surfaces was fixed along their axial direction, and the exerted compressive stress was 20 MPa. During modeling, twenty-four monitoring points with 30° intervals were uniformly arranged on the boundary of the opening in the counterclockwise direction. The polar angle of the starting point P1 was 15°, while that of the last point P24 was 360°. Figure 9a shows the layout of the monitoring points in the model with an inverted U-shaped opening. Based on the simulated stresses of the model along x-direction and y-direction, the tangential stresses of the monitoring points could be solved. In fact, if the shape of the two holes is exactly the same, the surrounding stress distributions are identical. Our previous research shows that the stress distribution round the inverted U-shaped opening can be acquired utilizing the complex variable approach [59]. As the shape of the opening in this study was the same as that in our previous research, the hoop stress concentration factors of the 24 monitoring points could be obtained directly. The good consistency between the numerical and theoretical results in Figure 9b indicates that the FLAC software was feasible and reliable for stress simulation. It is pointed out that the discrepancy might be related to the grid size. In fact, we could only monitor the stress of the element in FLAC software; that is, the obtained stress resides in the center of the element rather than the monitoring points. Thus, the smaller the dimension of the element, the closer the two points are, but the computer will take a long time to calculate [60].
Likewise, the hoop stress concentration factors of monitoring points on the boundaries of the two inverted U-shaped openings with different configurations are shown in Figure 10. Based on the stress distributions round the openings, the crack growth and coalescence mechanism were clearly revealed in the Discussion Section.

5. Discussion

As shown in Figure 9 and Figure 10, tensile stress concentrated on the top and bottom of the opening under unidirectional compression, whilst the sides of the opening were concentrated by compressive stress. The stress concentration factor was related to the number and configuration of openings.
For the intact sample, it is ideal that tensile cracks parallel to the compression direction occur in the sample and lead to splitting failure. However, the end friction changed the stress state of the ends from one dimension to three dimensions, which resulted in the formation of shear plane (crack) on the diagonal. This is why the tensile-shear failure pattern of the intact sample appeared.
With respect to the sample containing an inverted U-shaped opening, numerical results show that the maximum stress concentration factors (SCF) on the roof and floor of the opening were −0.87 and −0.93, respectively. Obviously, the elementary tensile crack 1a grew first from the bottom. However, it was observed that no tensile crack occurred on the top, this might be because the radius of the semicircle was very small [26]. The crack 1a developed slowly with the increasing stress. Nevertheless, as the distance from the opening rose, the concentrated tensile stress became smaller and smaller. Once it decreased to zero, the critical stress condition shifted to both sides of the elementary tensile crack and resulted in the occurrence of the posterior tensile cracks. During this period, the slabbing cracks emerged due to the increasing concentrated compressive stresses with a SCF of 2.52 p on the sides of the opening. It was also found that, as the posterior tensile crack expanded, the elementary tensile crack became shorter and shorter until it disappeared. This was caused by the lateral compression of the posterior tensile crack. When the constraint was lifted at the end of the test, the elementary tensile crack appeared again. Moreover, the end friction force increased with the rising load, leading to the emergence of the shear bands on the diagonal. After the maximum stress, the shear bands developed into macro cracks. Afterwards, the failure would take place if the shear cracks and the V-shaped notch or the posterior tensile crack were connected.
In regard to the sample containing two horizontal inverted U-shaped openings, the SCFs at the centers of the roofs and floors were −0.81 and −0.91, respectively. By contrast, the maximum SCFS on the left sidewall of the left opening and the right sidewall of the right opening were both 2.53, and those on the right sidewall of the left opening and the left sidewall of the right opening were equal to 2.49. Therefore, the cracks 1a and 1b were formed firstly at the floors of the two openings, and then the slabbing cracks 3a–3d occurred on their sides. With the growing of the exerted stress, the two adjacent V-shaped notches were gradually connected. Similar to the sample with an opening, after the elementary tensile cracks stopped growing, the posterior tensile cracks 2a–2f would appear one after another due to the transferred critical stress condition. The shear bands on the diagonal would also grow into shear cracks after the peak point. When the shear crack intersected with the V-shaped notch of the left opening and the posterior tensile crack on its upper-right corner propagated to the upper surface of the sample, the failure happened. Concerning the appearance of the spalling cracks, they were caused by the local high compressive stress.
By contrast, the mechanism of crack development in the samples containing two diagonal or vertical openings was similar, but the sequences of the initiated cracks were different. In regard to the sample with two diagonal openings, the SCFs on the roofs of the lower-left and upper-right openings were −0.88 and −0.93, respectively, whilst those on the floors were −0.97 and −1.03, respectively. Thus, the elementary tensile crack occurred first on the floor of the upper-right opening, followed by that on the bottom of the lower-left opening. No elementary tensile crack occurred on the roofs of the openings because of the small size of the opening. The corresponding maximum SCFs on the sides of the two openings were 2.59, 2.64, 2.58 and 2.49, respectively, whose order was consistent with the initiation sequence of the slabbing cracks. With respect to the sample containing two vertical openings, the maximum SCFs on the roofs (−0.78 and −0.66) and floors (−0.76 and −0.86) of the upper and lower openings were relatively small because the opening falls in the unloading areas of each other. This also proved that the crack initiation stresses of the samples V-3 and D-2 were the largest and lowest, respectively. Besides, the maximum SCFs on the sides of the upper and lower openings were all approximately 2.30, which were smaller than those of the samples with two horizontal and diagonal openings. Consequently, the slabbing cracks of the sample containing two vertical openings appeared after the posterior tensile cracks. In summary, the elastic stress distributions round the openings effectively illustrated the development mechanism of the cracks. However, to get close to the true stress state of tunnel in rock engineering, further investigations on the samples with openings under biaxial and triaxial compression would be conducted in the future work. In addition, more inclination angles and lengths of rock bridge would be considered.

6. Conclusions

In this research, to increase the understanding of fracture behavior around openings, a host of sandstone specimens, including three groups of specimens containing two inverted U-shaped openings (H, D and V), one group of intact specimens (C) and one group of specimens containing one single inverted U-shaped opening (S), were loaded in uniaxial compression combining the DIC and AE experimental techniques. Moreover, a numerical investigation was further conducted to simulate the stress distributions around the openings. Based on the experimental and numerical results, several conclusions could be drawn as follows.
(1)
Both the number and configuration of openings noticeably affected the strength and deformation properties of rock specimens. The uniaxial compressive strength of these groups could be ordered from large to small as: C > V > S > H > D, and the degree of attenuation ranged from 15.80% to 29.94%. For the Young’s modulus, Group C had the largest value, followed by Groups H, V, D and S, with a decrease extent of 14.76%–24.93%. Besides, the peak strains of the pre-holed specimens also showed a different degree of reduction from the intact specimen.
(2)
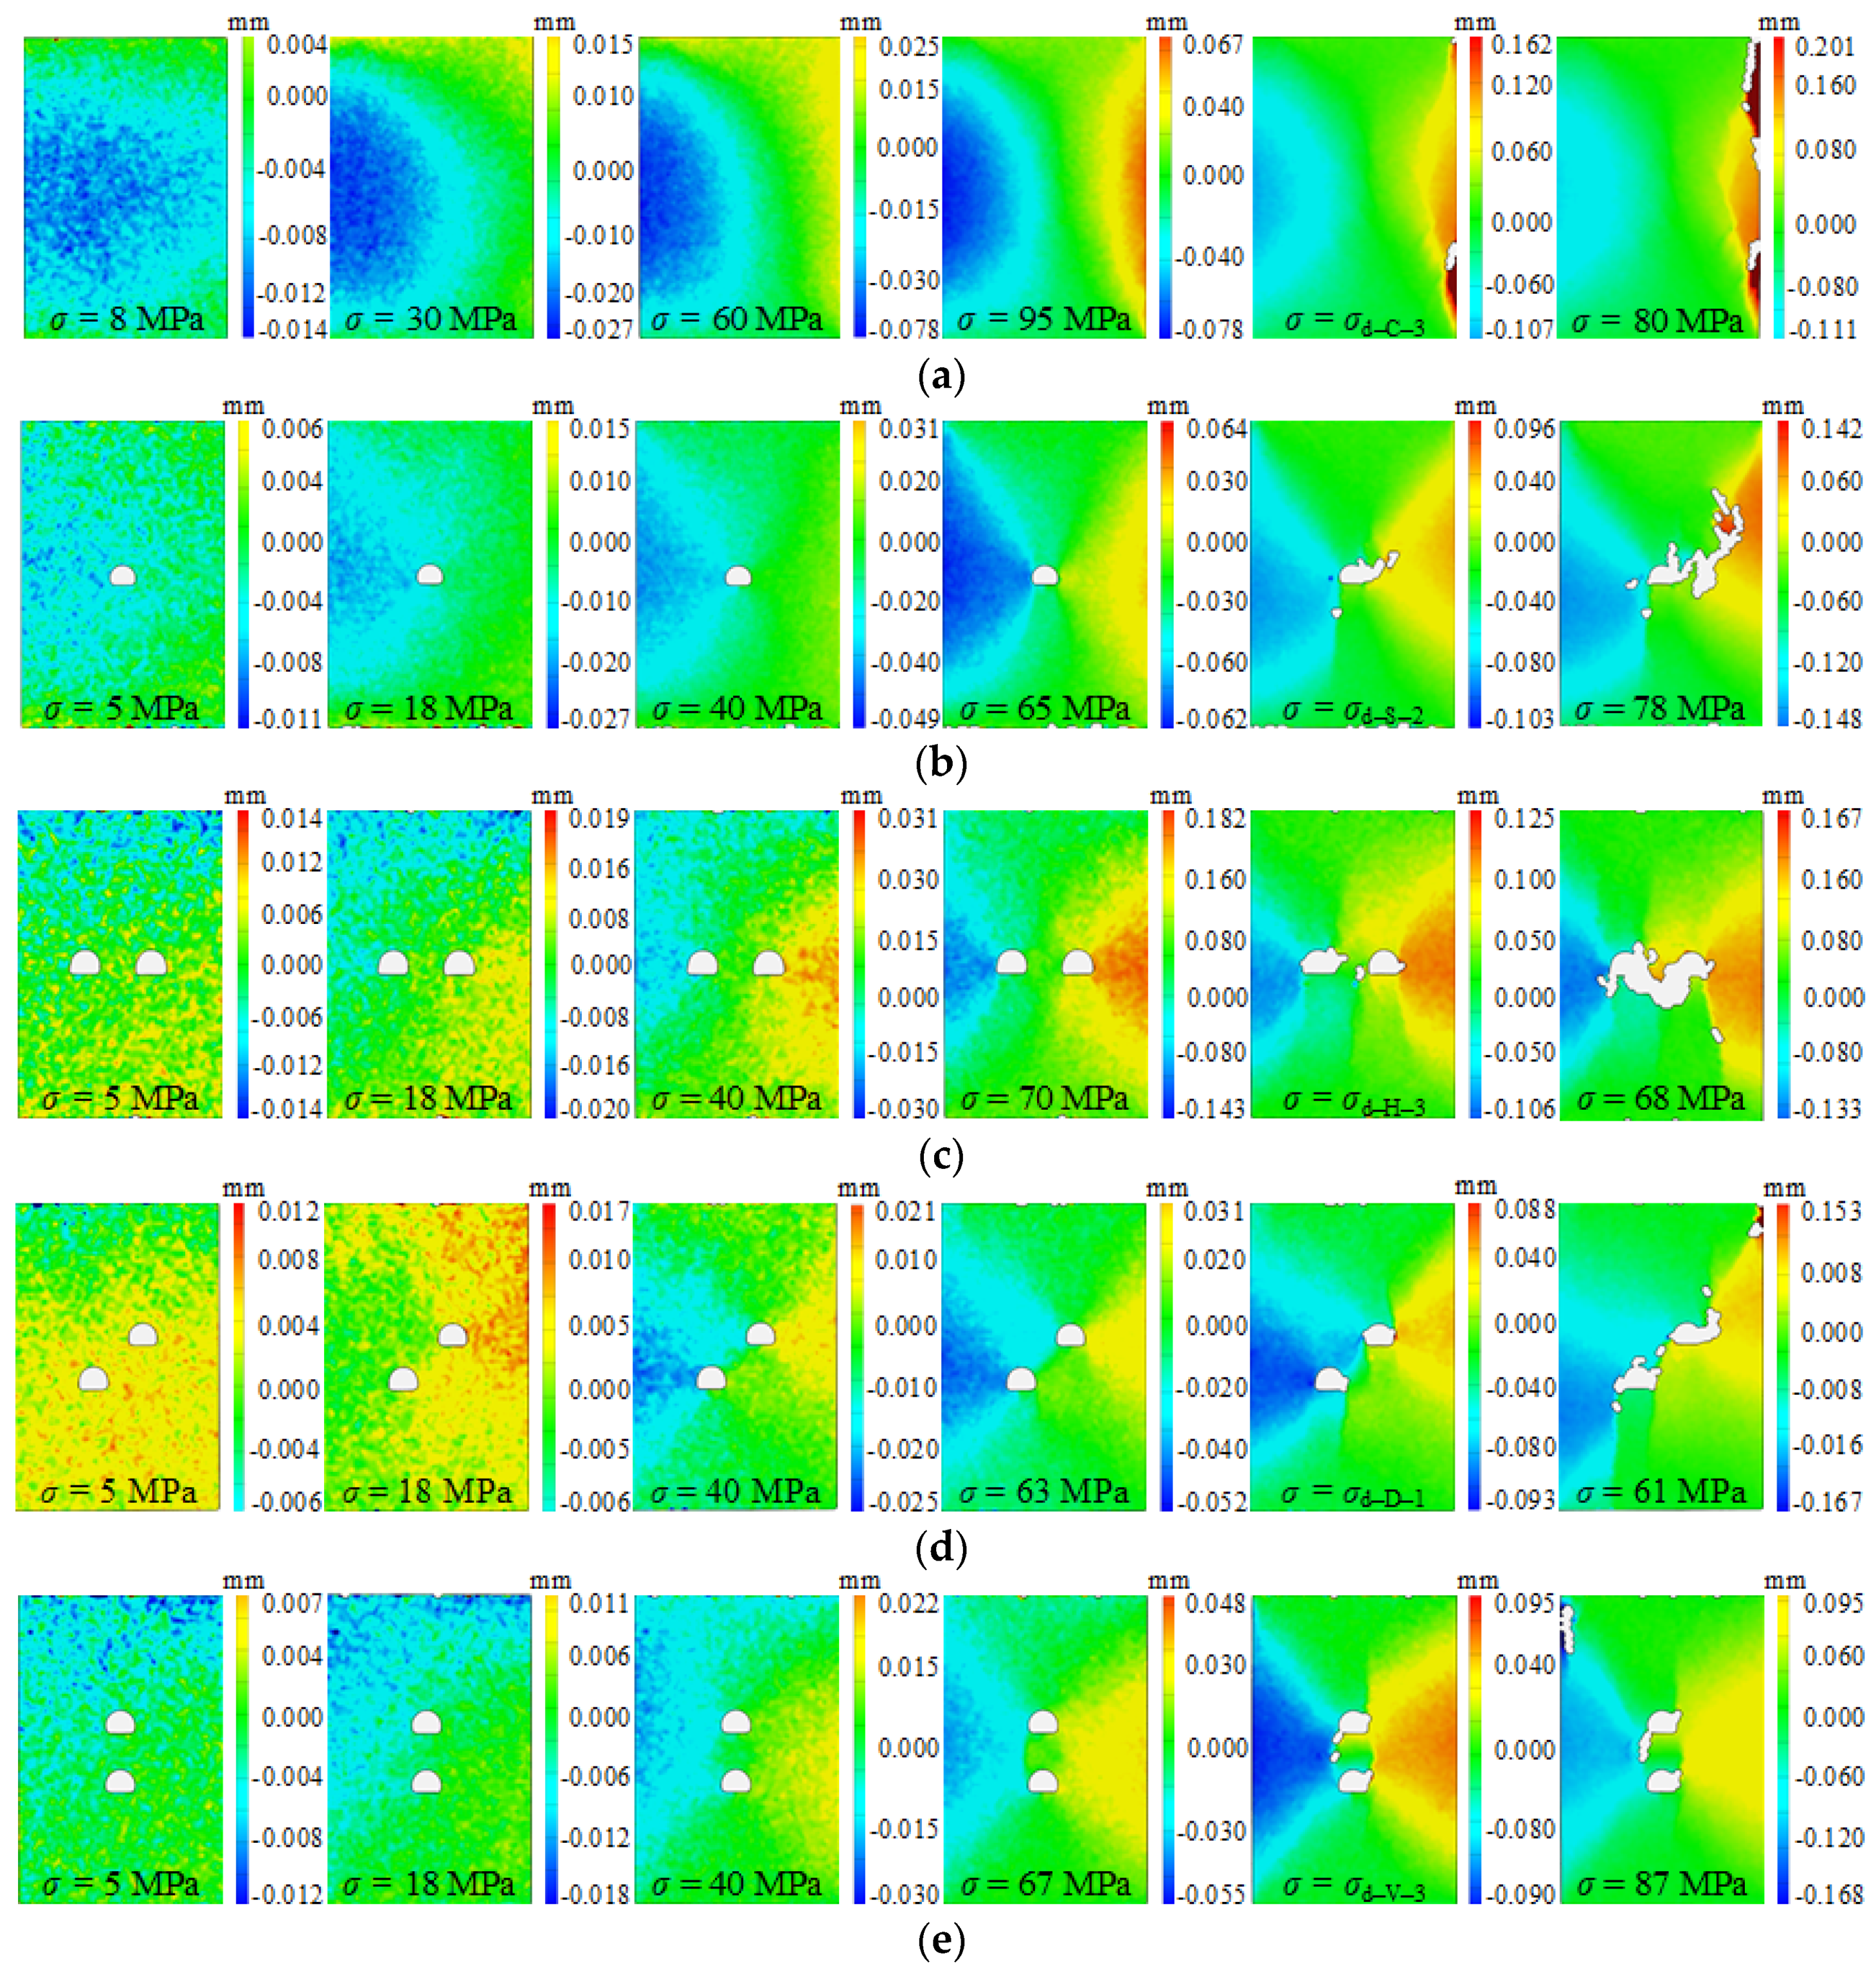
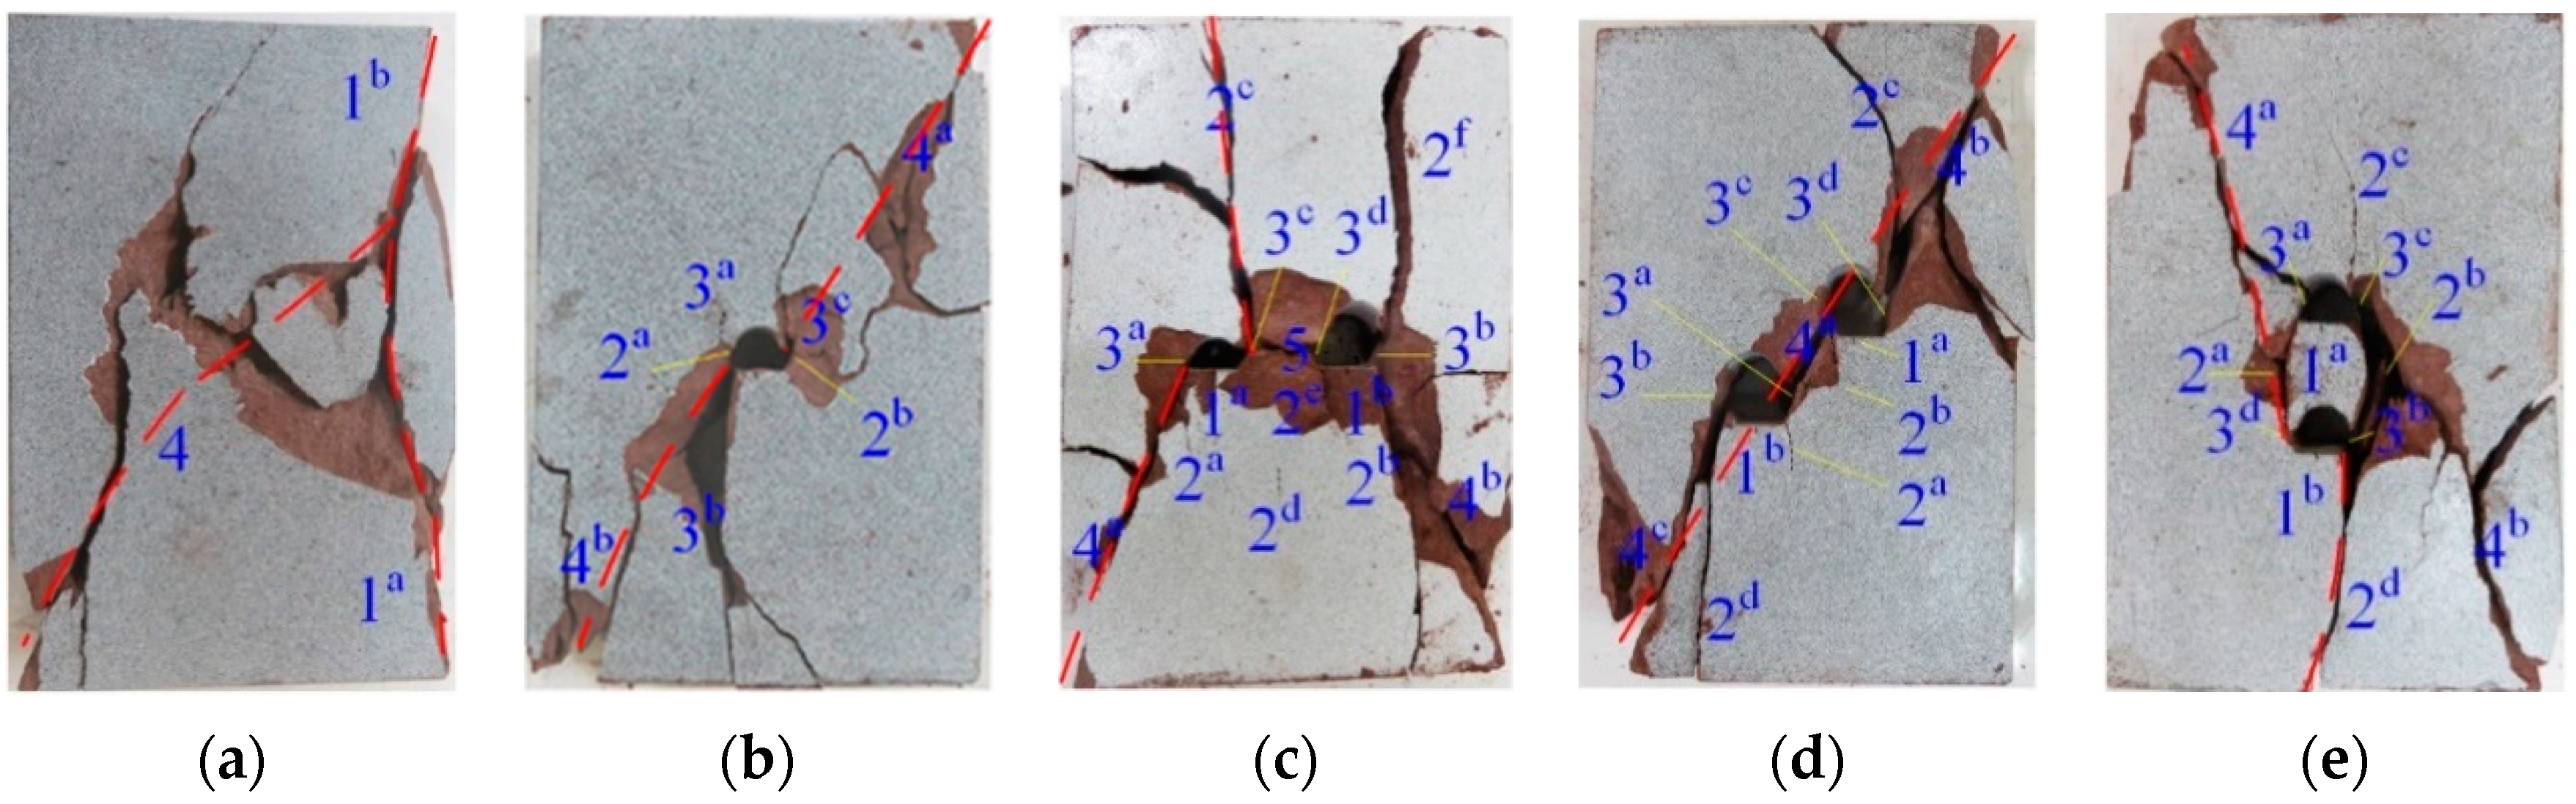
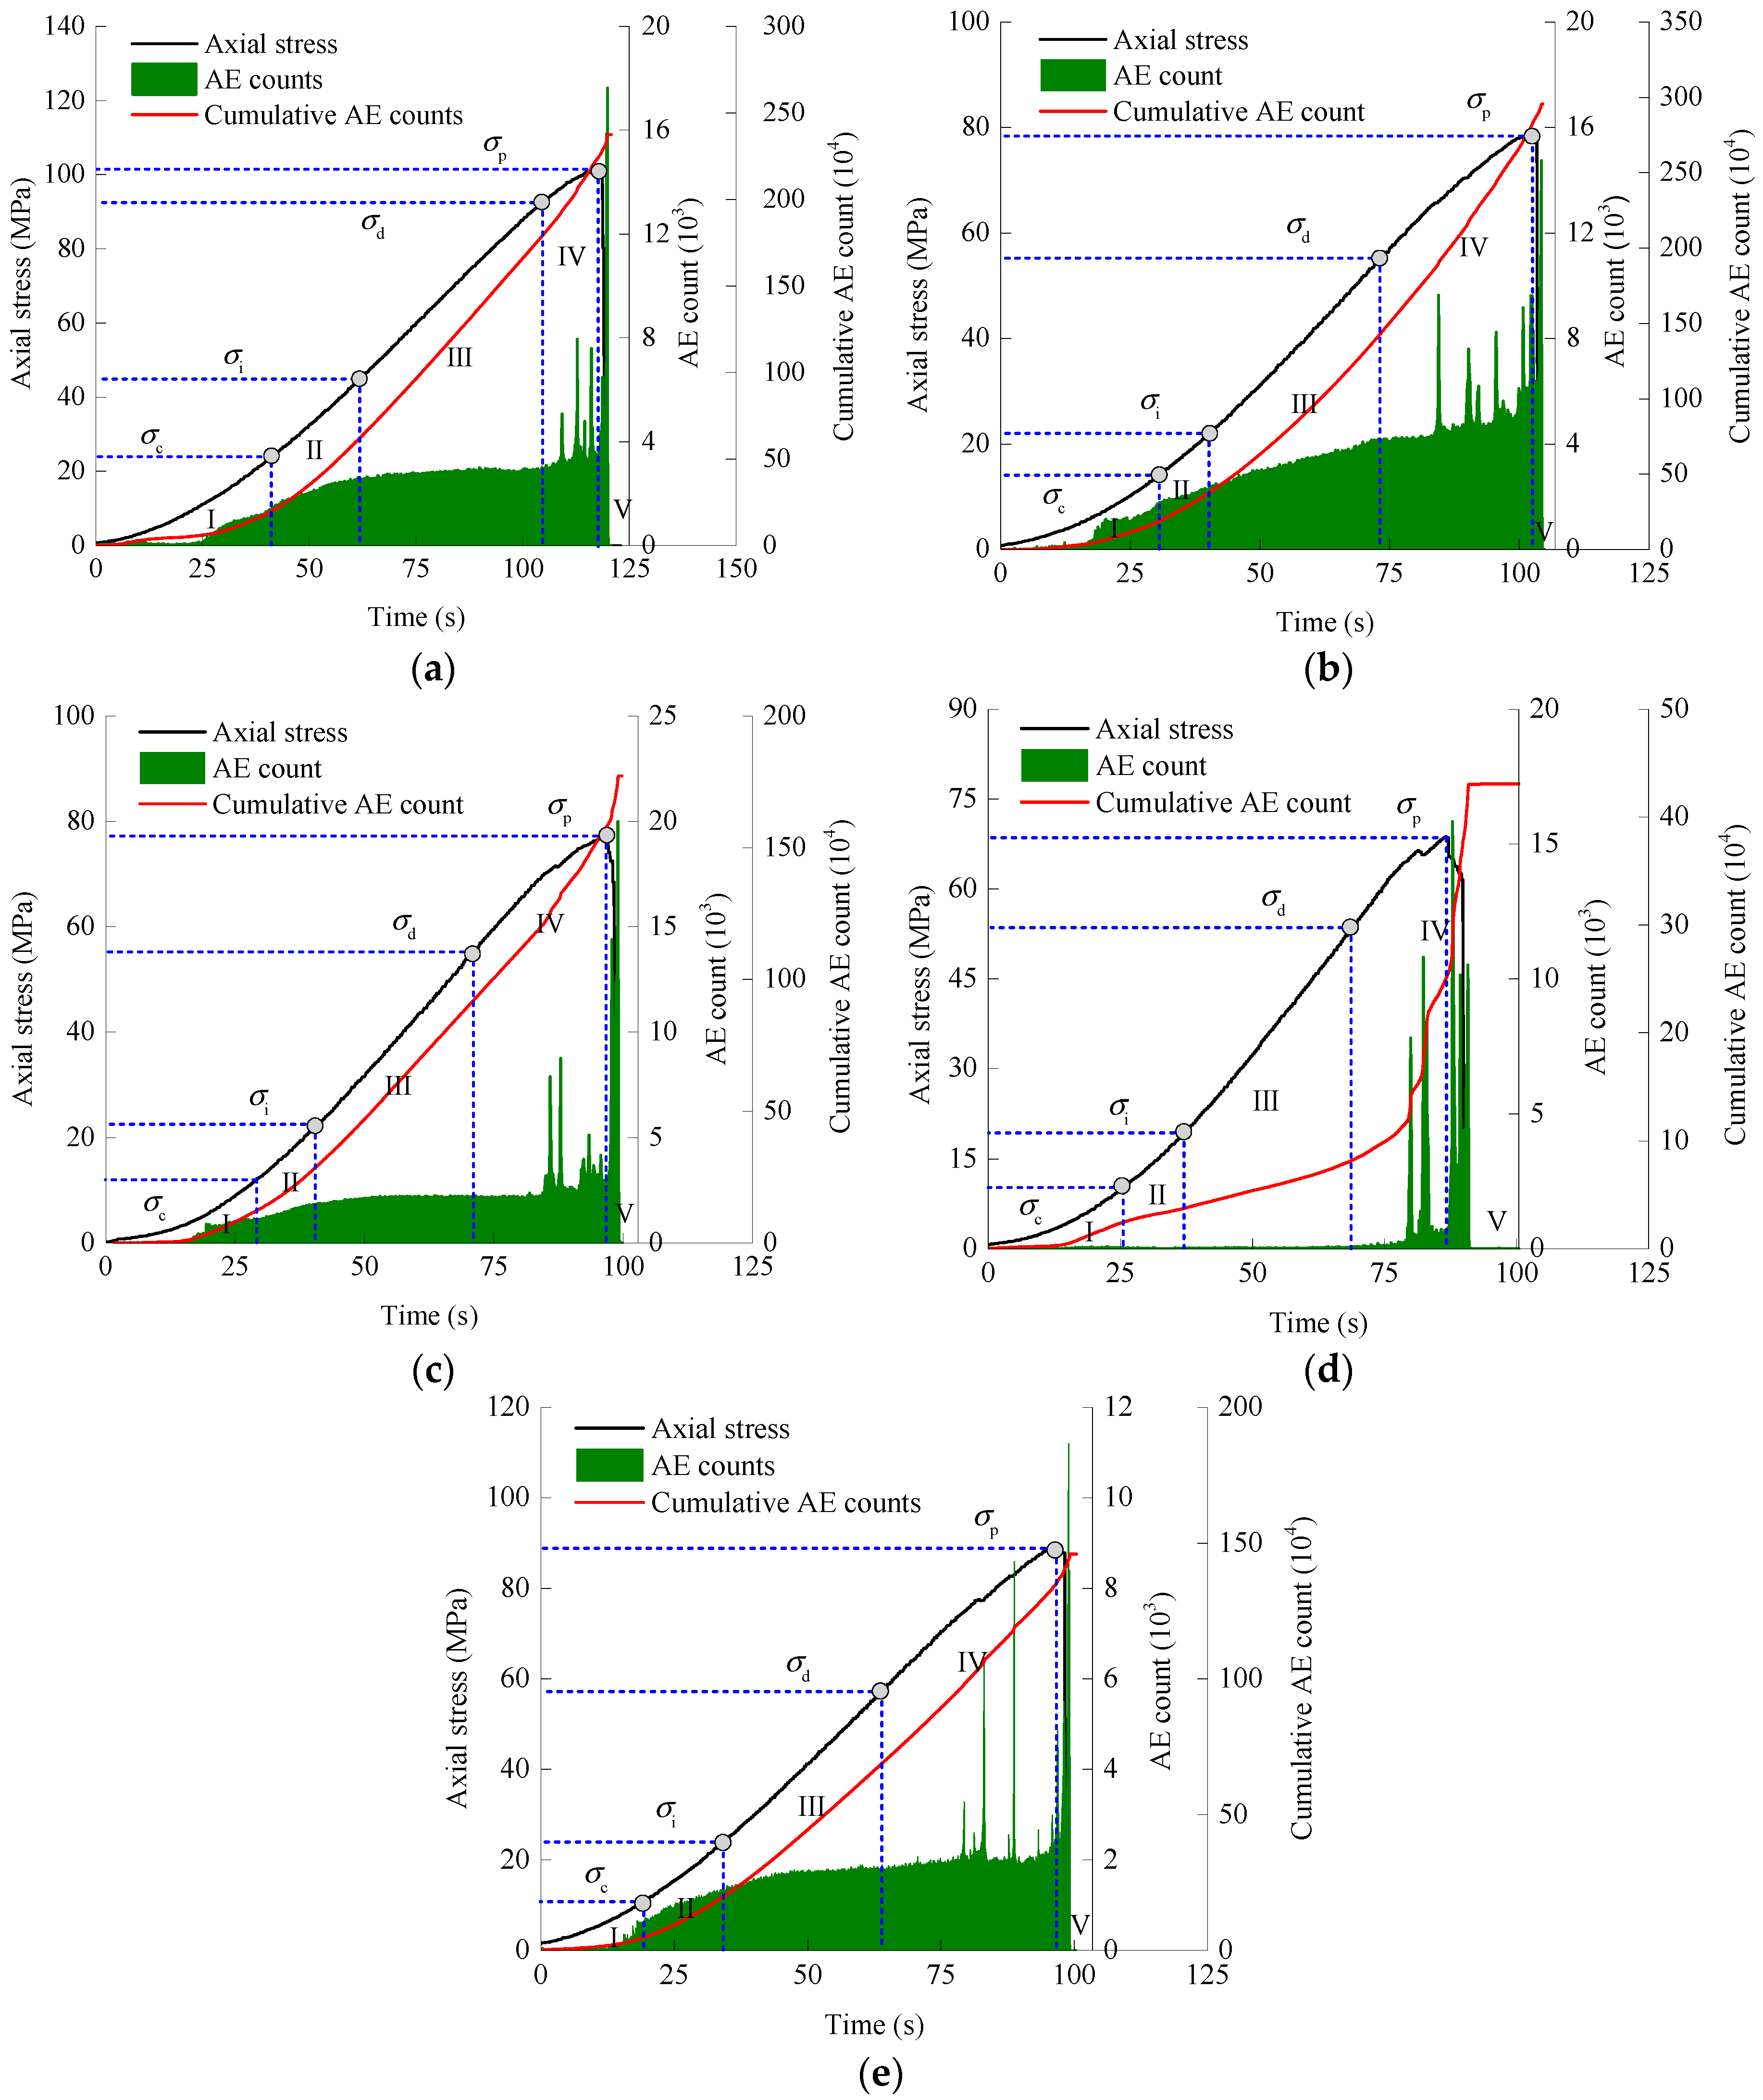
According to the distribution of strain localization and the variation of AE signals during loading, the crack development around the openings under increasing loads was clarified. Five sorts of cracks appeared around the openings, i.e., elementary tensile crack, posterior tensile crack, slabbing crack, shear crack and spalling crack. For specimens with two openings, three categories of hole coalescence, namely slabbing coalescence for Group H, shear coalescence for Group D and tensile coalescence for Group V, were formed. The failure mode of Groups S and D was shear failure, whilst that of the others was tensile-shear failure. With regard to the threshold stresses in the fracture process, the initiation stress of the intact specimen was 44.8 MPa, while that of the specimens with one single or two openings were 21.2 MPa, 22.9 MPa, 18.8 MPa and 24.6 MPa, respectively. Moreover, the damage stress of the intact specimen was 91% of the peak stress, while that of the specimens with openings was (0.65–0.78) times their peak stresses.
(3)
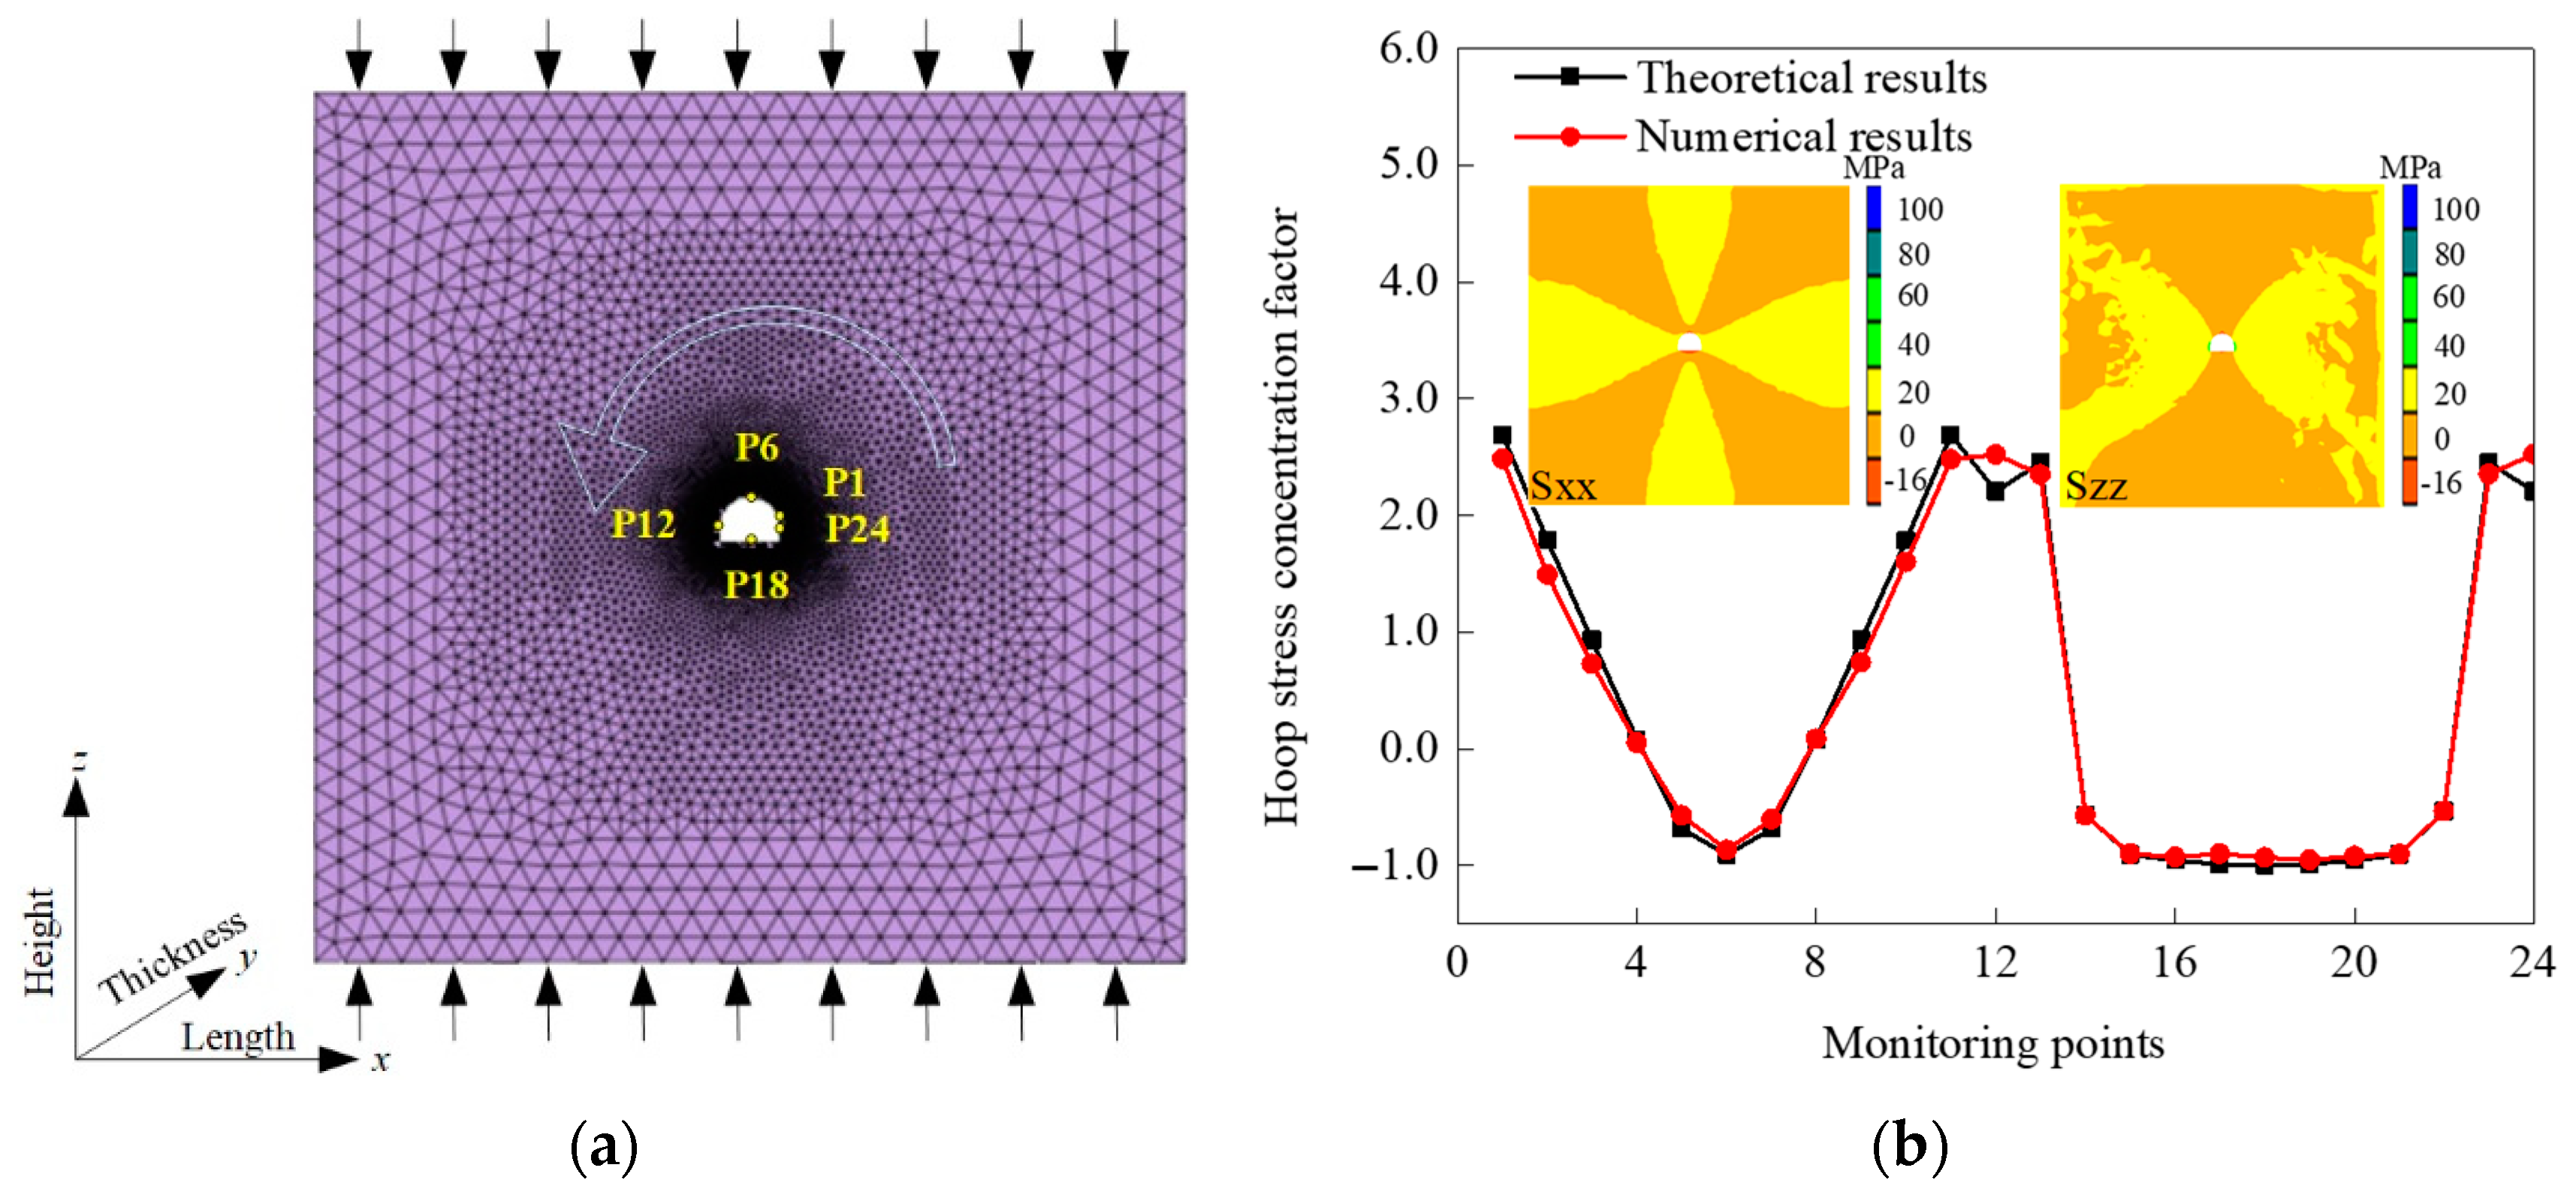
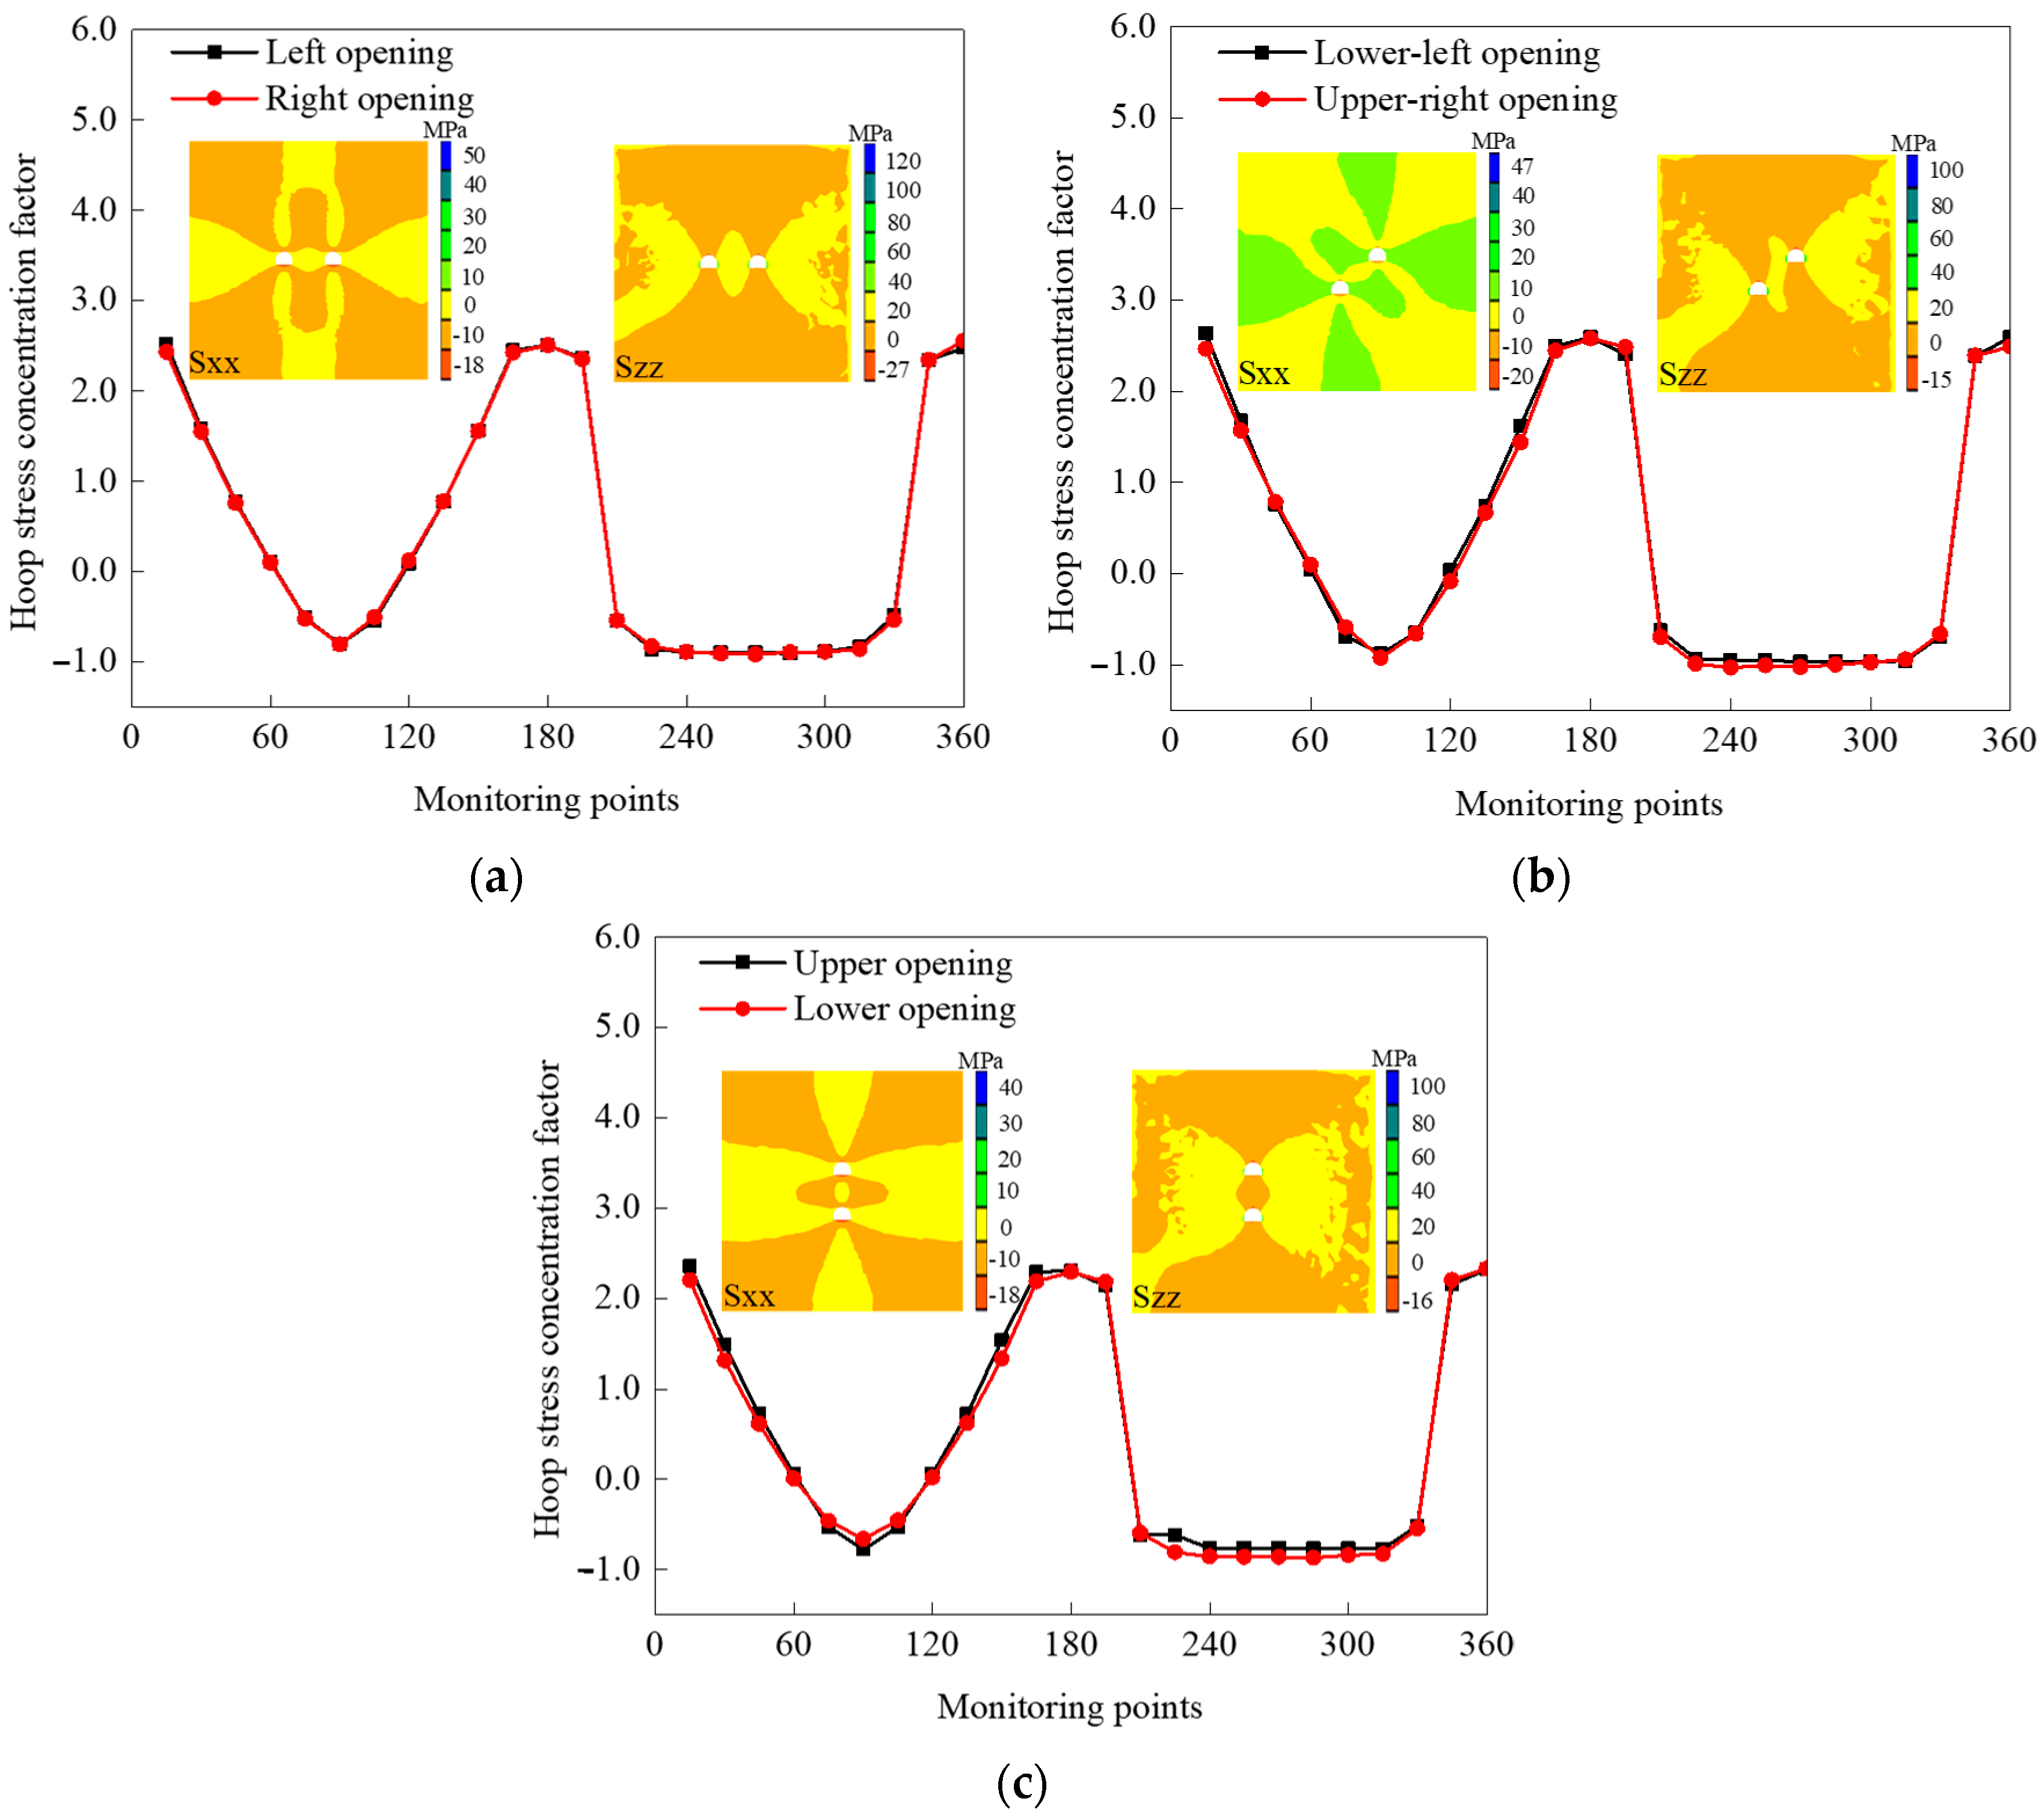
Under unidirectional compressive loads, tensile and compressive stresses concentrate on the roof-floor and both sides of the opening, respectively. The hoop SCFs on the boundaries of the two diagonal openings was the largest, while those of the two vertical openings were the smallest. On the whole, the stress distribution at the periphery of the opening could effectively interpret the formation, initiation location and sequence of the cracks. The order of the crack initiation stresses of the specimens with openings could also be verified on the basis of the magnitude of the SCF on the roofs or floors of the openings.

Author Contributions

H.W. conducted the laboratory tests and numerical simulation, analyzed the results and wrote the paper. G.Z. designed the experimental scheme and revised the paper. W.L. helped to perform stress analysis, collect literature and process data.

Funding

This research was funded by National Natural Science Foundation of China (51774321), National Key Research and Development Program of China (2018YFC0604606) and Fundamental Research Funds for the Central Universities of Central South University (2018zzts215).

Acknowledgments

Special thanks should be given to Enjie Wang for his strong support on the laboratory experiments.

Conflicts of Interest

The authors declare no conflict of interest.

References

  1. Saadat, M.; Taheri, A. A numerical approach to investigate the effects of rock texture on the damage and crack propagation of a pre-cracked granite. Comput. Geotech. 2019, 111, 89–111. [Google Scholar] [CrossRef]
  2. Zhou, X.P.; Wang, Y.T.; Xu, X.M. Numerical simulation of initiation, propagation and coalescence of cracks using the non-ordinary state-based peridynamics. Int. J. Fract. 2016, 201, 213–234. [Google Scholar] [CrossRef]
  3. Zhao, Y.L.; Zhang, L.Y.; Wang, W.J.; Pu, C.Z.; Wan, W.; Tang, J.Z. Cracking and stress-strain behavior of rock-like material containing two flaws under uniaxial compression. Rock Mech. Rock Eng. 2016, 49, 2665–2687. [Google Scholar] [CrossRef]
  4. Luo, Y.; Gong, F.Q.; Liu, D.Q.; Wang, S.Y.; Si, X.F. Experimental simulation analysis of the process and failure characteristics of spalling in D-shaped tunnels under true-triaxial loading conditions. Tunn. Undergr. Space Technol. 2019, 90, 42–61. [Google Scholar] [CrossRef]
  5. Liang, W.Z.; Zhao, G.Y.; Wang, X.; Zhao, J.; Ma, C.D. Assessing the rockburst risk for deep shafts via distance-based multi-criteria decision making approaches with hesitant fuzzy information. Eng. Geol. 2019, 260, 105211. [Google Scholar] [CrossRef]
  6. Liang, W.Z.; Zhao, G.Y.; Wu, H.; Chen, Y. Optimization of mining method in subsea deep gold mines: A case study. Trans. Nonferr. Met. Soc. 2019, 29, 2160–2169. [Google Scholar] [CrossRef]
  7. Su, G.S.; Zhai, S.B.; Jiang, J.Q.; Zhang, G.L.; Yan, L.B. Influence of radial stress gradient on strainbursts: An experimental study. Rock Mech. Rock. Eng. 2017, 50, 2659–2676. [Google Scholar] [CrossRef]
  8. Wu, H.; Kulatilake, P.H.S.W.; Zhao, G.Y.; Liang, W.Z.; Wang, E.J. Fracturing behaviour of sandstone specimens with a cavity formed by intersecting excavations under compression: Experimental study and numerical modelling. Strain 2019, 55, e12316. [Google Scholar] [CrossRef]
  9. Ranjith, P.G.; Zhao, J.; Ju, M.H.; De Silva, R.V.S.; Rathnaweera, T.D.; Bandara, A.K.M.S. Opportunities and challenges in deep mining: A brief review. Engineering-PRC 2017, 3, 546–551. [Google Scholar] [CrossRef]
  10. Martini, C.D.; Read, R.S.; Martino, J.B. Observations of brittle failure around a circular test tunnel. Int. J. Rock Mech. Min. Sci. 1997, 34, 1065–1073. [Google Scholar] [CrossRef]
  11. Bobet, A.; Einstein, H.H. Fracture coalescence in rock-type materials under uniaxial and biaxial compression. Int. J. Rock Mech. Min. Sci. 1998, 35, 863–888. [Google Scholar] [CrossRef]
  12. Wong, R.H.C.; Chau, K.T. Crack coalescence in a rock-like material containing two cracks. Int. J. Rock Mech. Min. Sci. 1998, 35, 147–164. [Google Scholar] [CrossRef]
  13. Sagong, M.; Boet, A. Coalescence of multiple flaws in a rock-model material in uniaxial compression. Int. J. Rock Mech. Min. Sci. 2002, 39, 229–241. [Google Scholar] [CrossRef]
  14. Wong, L.N.Y.; Einstein, H.H. Systematic evaluation of cracking behavior in specimens containing single flaws under uniaxial compression. Int. J. Rock Mech. Min. Sci. 2009, 46, 239–249. [Google Scholar] [CrossRef]
  15. Lee, H.; Jeon, S. An experimental and numerical study of fracture coalescence in pre-cracked specimens under uniaxial compression. Int. J. Solids Struct. 2011, 48, 979–999. [Google Scholar] [CrossRef] [Green Version]
  16. Bahaaddini, M.; Sharrock, G.; Hebblewhite, B.K. Numerical investigation of the effect of joint geometrical parameters on the mechanical properties of a non-persistent jointed rock mass under uniaxial compression. Comput. Geotech. 2013, 49, 206–225. [Google Scholar] [CrossRef]
  17. Yang, X.X.; Kulatilake, P.H.S.W.; Chen, X.; Jing, H.W. Particle flow modeling of rock blocks with nonpersistent open joints under uniaxial compression. Int. J. Geomech. 2016, 16, 04016020. [Google Scholar] [CrossRef]
  18. Haeri, H.; Khaloo, A.; Marji, M.F. Experimental and numerical analysis of Brazilian discs with multiple parallel cracks. Arab. J. Geosci. 2015, 8, 5897–5908. [Google Scholar] [CrossRef]
  19. Feng, P.; Dai, F.; Liu, Y.; Xu, N.W.; Fan, P.X. Effects of coupled static and dynamic strain rates on mechanical behaviors of rock-like specimens containing pre-existing fissures under uniaxial compression. Can. Geotech. J. 2018, 55, 640–652. [Google Scholar] [CrossRef] [Green Version]
  20. Gao, Y.H.; Feng, X.T. Study on damage evolution of intact and jointed marble subjected to cyclic true triaxial loading. Eng. Fract. Mech. 2019, 215, 224–234. [Google Scholar] [CrossRef]
  21. Dang, W.G.; Konietzky, H.; Frühwirt, T.; Herbst, M. Cyclic Frictional Responses of Planar Joints Under Cyclic Normal Load Conditions: Laboratory Tests and Numerical Simulations. Rock Mech. Rock Eng. 2019. [Google Scholar] [CrossRef]
  22. Dang, W.G.; Konietzky, H.; Chang, L.F. Velocity-frequency-amplitude-dependent frictional resistance of planar joints under dynamic normal load (DNL) conditions. Tunn. Undergr. Space Technol. 2018, 79, 27–34. [Google Scholar] [CrossRef]
  23. Razavi, S.M.J.; Aliha, M.R.M.; Berto, F. Application of an average strain energy density criterion to obtain themixed mode fracture load of granite rock tested with the cracked asymmetric four-point bend specimens. Theor. Appl. Fract. Mech. 2018, 97, 419–425. [Google Scholar] [CrossRef]
  24. Wang, Y.S.; Hu, X.Z. Determination of tensile strength and fracture toughness of granite using notched three-point-bend samples. Rock Mech. Rock Eng. 2017, 50, 17–28. [Google Scholar] [CrossRef]
  25. Cao, R.H.; Cao, P.; Lin, H.; Fan, X.; Zhang, C.Y.; Liu, T.Y. Crack Initiation, propagation, and failure characteristics of jointed rock or rock-like specimens: A review. Adv. Civ. Eng. 2019, 2019, 6975751. [Google Scholar] [CrossRef]
  26. Carter, B.J.; Lajtai, E.Z.; Petukhov, A. Primary and remote fracture around underground cavities. Int. J. Numer. Anal. Methods Geomech. 1991, 15, 21–40. [Google Scholar] [CrossRef]
  27. Carter, B.J.; Lajtai, E.Z.; Yuan, Y.G. Tensile fracture from circular cavities loaded in com-pression. Int. J. Fract. 1992, 57, 221–236. [Google Scholar]
  28. Zhao, X.D.; Zhang, H.X.; Zhu, W.C. Fracture evolution around pre-existing cylindrical cavities in brittle rocks under uniaxial compression. Trans. Nonferr. Met. Soc. 2014, 24, 806–815. [Google Scholar] [CrossRef]
  29. Tang, C.A.; Wong, R.H.C.; Chau, K.T.; Lin, P. Modeling of compression-induced splitting failure in heterogeneous brittle porous solids. Eng. Fract. Mech. 2005, 72, 597–615. [Google Scholar] [CrossRef]
  30. Wong, R.H.C.; Lin, P.; Tang, C.A. Experimental and numerical study on splitting failure of brittle solids containing single pore under uniaxial compression. Mech. Mater. 2006, 38, 142–159. [Google Scholar] [CrossRef]
  31. Dzik, E.J.; Lajtai, E.Z. Primary fracture propagation from circular cavities loaded in compression. Int. J. Fract. 1996, 9, 49–64. [Google Scholar] [CrossRef]
  32. Martin, C.D.; Kaiser, P.K.; Mccreath, D.R. Hoek–Brown parameters for predicting the depth of brittle failure around tunnels. Can. Geotech. J. 1999, 34, 136–151. [Google Scholar] [CrossRef]
  33. Fakhimi, A.; Carvalho, F.; Ishida, T.; Labuz, J.F. Simulation of failure around a circular opening in rock. Int. J. Rock Mech. Min. Sci. 2002, 39, 507–515. [Google Scholar] [CrossRef]
  34. Wang, S.Y.; Sloan, S.W.; Sheng, D.C.; Tang, C.A. Numerical analysis of the failure process around a circular opening in rock. Comput. Geotech. 2012, 39, 8–16. [Google Scholar] [CrossRef]
  35. Wang, S.Y.; Sun, L.; Yang, C.; Yang, S.Q.; Tang, C.A. Numerical study on static and dynamic fracture evolution around rock cavities. J. Rock Mech. Geotech. Eng. 2013, 5, 262–276. [Google Scholar] [CrossRef] [Green Version]
  36. Yin, Q.; Jing, H.W.; Ma, G.W. Experimental study on mechanical properties of sandstone specimens containing a single hole after high-temperature exposure. Geotech. Lett. 2015, 5, 43–48. [Google Scholar] [CrossRef]
  37. Weng, L.; Li, X.B.; Taheri, A.; Wu, Q.H.; Xie, X.F. Fracture evolution around a cavity in brittle rock under uniaxial compression and coupled static–dynamic loads. Rock Mech. Rock Eng. 2018, 51, 531–545. [Google Scholar] [CrossRef]
  38. Li, X.B.; Feng, F.; Li, D.Y. Numerical simulation of rock failure under static and dynamic loading by splitting test of circular ring. Eng. Fract. Mech. 2018, 118, 184–201. [Google Scholar] [CrossRef]
  39. Haeri, H.; Khaloo, A.; Marji, M.F. Fracture analyses of different pre-holed concrete specimens under compression. Acta Mech. Sin. -PRC 2015, 31, 855–870. [Google Scholar] [CrossRef]
  40. Jespersen, C.; Maclaughlin, M.; Hudyma, N. Strength, deformation modulus and failure modes of cubic analog specimens representing macroporous rock. Int. J. Rock Mech. Min. Sci. 2010, 47, 1349–1356. [Google Scholar] [CrossRef]
  41. Lin, P.; Wong, R.H.C.; Tang, C.A. Experimental study of coalescence mechanisms and failure under uniaxial compression of granite containing multiple holes. Int. J. Rock Mech. Min. Sci. 2015, 77, 313–327. [Google Scholar] [CrossRef]
  42. Huang, Y.H.; Yang, S.Q.; Tian, W.L. Cracking process of a granite specimen that contains multiple pre-existing holes under uniaxial compression. Fatigue Fract. Eng. Mater. Struct. 2019, 42, 1341–1356. [Google Scholar] [CrossRef]
  43. Zhu, W.C.; Liu, J.; Tang, C.A.; Zhao, X.D.; Brady, B.H. Simulation of progressive fracturing processes around underground excavations under biaxial compression. Tunn. Undergr. Space Technol. 2005, 20, 231–247. [Google Scholar] [CrossRef]
  44. Li, X.B.; Weng, L. Numerical investigation on fracturing behaviors of deep-buried opening under dynamic disturbance. Tunn. Undergr. Space Technol. 2016, 54, 61–72. [Google Scholar] [CrossRef]
  45. Li, D.Y.; Zhu, Q.Q.; Zhou, Z.L.; Li, X.B.; Ranjith, P.G. Fracture analysis of marble specimens with a hole under uniaxial compression by digital image correlation. Eng. Fract. Mech. 2017, 183, 109–124. [Google Scholar] [CrossRef]
  46. Zeng, W.; Yang, S.Q.; Tian, W.L. Experimental and numerical investigation of brittle sandstone specimens containing different shapes of holes under uniaxial compression. Eng. Fract. Mech. 2018, 200, 430–450. [Google Scholar] [CrossRef]
  47. Wu, H.; Zhao, G.Y.; Liang, W.Z. Investigation of cracking behaviour and mechanism of sandstone specimens with a hole under compression. Int. J. Mech. Sci. 2019, 163, 105084. [Google Scholar] [CrossRef]
  48. Liu, J.P.; Li, Y.H.; Xu, S.D.; Xu, S.; Jin, C.Y. Cracking mechanisms in granite rocks subjected to uniaxial compression by moment tensor analysis of acoustic emission. Theor. Appl. Fract. Mech. 2015, 75, 151–159. [Google Scholar]
  49. Zhou, L.; Zhu, Z.M.; Dong, Y.Q.; Fan, Y.; Zhou, Q.; Deng, S. The influence of impacting orientations on the failure modes of cracked tunnel. Int. J. Impact Eng. 2019, 125, 134–142. [Google Scholar] [CrossRef]
  50. Zhu, Q.Q.; Li, D.Y.; Han, Z.Y.; Li, X.B.; Zhou, Z.L. Mechanical properties and fracture evolution of sandstone specimens containing different inclusions under uniaxial compression. Int. J. Rock Mech. Min. Sci. 2019, 115, 33–47. [Google Scholar] [CrossRef]
  51. Yang, S.Q.; Huang, Y.H.; Tian, W.L.; Zhu, J.B. An experimental investigation on strength, deformation and crack evolution behavior of sandstone containing two oval flaws under uniaxial compression. Eng. Geol. 2017, 217, 35–48. [Google Scholar] [CrossRef]
  52. Zhou, Z.L.; Tan, L.H.; Cao, W.Z.; Zhou, Z.Y.; Cai, X. Fracture evolution and failure behaviour of marble specimens containing rectangular cavities under uniaxial loading. Eng. Fract. Mech. 2017, 184, 183–201. [Google Scholar] [CrossRef]
  53. Han, Z.Y.; Li, D.Y.; Zhu, Q.Q.; Liu, M.; Sun, Z. Dynamic fracture evolution and mechanical behavior of sandstone containing non-coplanar elliptical flaws under impact loading. Adv. Civ. Eng. 2018, 2018, 5649357. [Google Scholar]
  54. Wu, H.; Kulatilake, P.H.S.W.; Zhao, G.Y.; Liang, W.Z. Stress distribution and fracture evolution around a trapezoidal cavity in sandstone loaded in compression. Theor. Appl. Fract. Mech. 2019, 104, 102348. [Google Scholar] [CrossRef]
  55. Ulusay, R.; Hudson, J.A. The Complete ISRM Suggested Methods for Rock Characterization, Testing and Monitoring: 1974–2006; ISRM Turkish National Group: Ankara, Turkey, 2007. [Google Scholar]
  56. Liu, X.L.; Li, X.B.; Hong, L.; Yin, T.B.; Rao, M. Acoustic emission characteristics of rock under impact loading. J. Cent. South Univ. 2015, 22, 3571–3577. [Google Scholar] [CrossRef]
  57. Eberhardt, E.; Stead, D.; Stimpson, B.; Read, R.S. Changes in acoustic event properties with progressive fracture damage. Int. J. Rock Mech. Min. Sci. 1997, 34, 71.e1–71.e12. [Google Scholar] [CrossRef]
  58. Shan, P.F.; Lai, X.P.; Liu, X.M. Correlational analytical characterization of energy dissipation-liberation and acoustic emission during coal and rock fracture inducing by underground coal excavation. Energies 2019, 12, 2382. [Google Scholar] [CrossRef] [Green Version]
  59. Wu, H.; Kulatilake, P.H.S.W.; Zhao, G.Y.; Liang, W.Z.; Wang, E.J. A comprehensive study of fracture evolution of brittle rock containing an inverted U-shaped cavity under uniaxial compression. Comput. Geotech. 2019, 116, 103219. [Google Scholar] [CrossRef]
  60. Dang, W.G.; Wu, W.; Koniezky, H.; Qian, J.Y. Effect of shear-induced aperture evolution on fluid flow in rock fractures. Comput. Geotech. 2019, 114, 103152. [Google Scholar] [CrossRef]
Figure 1. Type and content of minerals in sandstone slice (Cal–calcite; Kfs–K-feldspar; Pl–plagioclase; Qtz–quartz; Zeo–zeolite).
Applsci 09 05327 g001
Figure 2. Dimensions of sandstone samples and fabricated openings (unit: mm): (a) Group C; (b) Group S; (c) Group H; (d) Group D and (e) Group V.
Applsci 09 05327 g002
Figure 3. Equipment for laboratory experiments.
Applsci 09 05327 g003
Figure 4. Mechanical behavior of different groups of sandstone samples under uniaxial loading.
Applsci 09 05327 g004
Figure 5. Variation of principal strain with the stress during uniaxial loading: (a) Sample C-3; (b) Sample S-2; (c) Sample H-3; (d) Sample D-1 and (e) Sample V-3.
Applsci 09 05327 g005
Figure 6. Variation of horizontal displacement with the stress during uniaxial loading: (a) Sample C-3; (b) Sample S-2; (c) Sample H-3; (d) Sample D-1 and (e) Sample V-3.
Applsci 09 05327 g006
Figure 7. Crack types and final failure modes of different groups of samples in uniaxial compression tests: (a) Sample C-3; (b) Sample S-2; (c) Sample H-3; (d) Sample D-1 and (e) Sample V-3.
Applsci 09 05327 g007
Figure 8. AE responses of different groups of samples in uniaxial compression tests: (a) Sample C-3; (b) Sample S-2; (c) Sample H-3; (d) Sample D-1 and (e) Sample V-3.
Applsci 09 05327 g008
Figure 9. Stress simulation by the numerical method: (a) arrangement of monitoring points and (b) comparison of the theoretical and numerical results.
Applsci 09 05327 g009
Figure 10. Hoop stress concentration factors on the boundaries of openings under vertical compressive stress (a) H-model; (b) D-model and (c) V-model.
Applsci 09 05327 g010
Table 1. Several rock mechanics parameters of brown sandstone.
v/(m/s)ρ/(kg/m3)σt/MPaσp/MPaE/GPaμc/MPaϕ/°KIC/(MPa·m½)
3174.52472.25.399.324.40.2619.040.40.6
Notes: v, ρ, σt, σp, E, μ, c, ϕ and KIC denote the P-wave velocity, density, tensile strength, uniaxial compression strength, Young’s modulus, Poisson’s ratio, cohesion, angel of internal friction and fracture toughness, respectively.
Table 2. AE acquisition parameters for uniaxial compression tests.
Detection Threshold/dBSampling Rate/MspsSampling Time/kPtT/μsPDT/μsHDT/μsHLT/μs
451052565020300
Notes: PtT, PDT, HDT and HLT mean the pre-trigger time, peak definition time, hit definition time and hit lockout time.
Table 3. Specific sizes, strength and deformation parameters of rock samples.
Sample No.Length (mm)Thickness (mm)Width (mm)Density (kg·m−3)σp (MPa)εp (‰)E (GPa)
C-1150.125.0100.12391.4100.95.5721.63
C-2150.524.999.62427.5105.65.9621.63
C-3150.724.8100.72385.5101.36.9719.07
S-1150.325.5100.42462.289.226.0816.90
S-2151.024.7100.82415.478.506.0114.95
S-3151.124.9100.82404.677.956.2314.95
H-1150.325.1100.12407.182.445.1718.36
H-2150.325.199.92390.374.735.2217.46
H-3150.425.199.92362.777.285.2217.32
D-1150.625.299.82370.268.745.0615.63
D-2150.825.299.82380.270.444.9316.76
D-3150.425.199.92362.777.285.2217.32
V-1149.925.099.32360.787.015.8818.06
V-2150.425.199.52358.283.355.4317.37
V-3150.524.999.72401.588.825.7717.60
Table 4. Threshold stress values involved in rock fracture subjected to uniaxial loading.
Sample No.σc (MPa)σi (MPa)σd (MPa)σp (MPa)
C-324.244.892.2101.3
S-214.021.255.278.5
H-312.022.955.177.3
D-110.218.853.668.7
V-311.124.657.388.8

