Article

Convergence Analysis of Capacities for Photovoltaics and Energy Storage System Considering Energy Self-Sufficiency Rates and Load Patterns of Rural Areas

Next Generation Photovoltaic Module and Power System Research Center, Konkuk University, 1 Hwayang-Dong, Gwangjin-Gu, Seoul 143-701, Korea
*
Author to whom correspondence should be addressed.
Appl. Sci. 2019, 9(24), 5323; https://doi.org/10.3390/app9245323
Submission received: 30 October 2019 / Revised: 21 November 2019 / Accepted: 29 November 2019 / Published: 6 December 2019
(This article belongs to the Section Energy Science and Technology)

Abstract

:
This work is a case study of 905 households, to present methods for optimizing the capacity of photovoltaic sytems (PVs)/energy storage systems (ESSs) for household to reach a desired energy self-sufficiency (70% to 90%). In order to calculate the capacity of PV and ESSs that would enhance the energy self-sufficiency of families in rural areas, the solar radiance data of the target area for the last five years and the average monthly power usage in the previous year were collected. Then, households with an average energy consumption of 250 kWh per month were chosen for this research. According to the simulation done using Solar Pro, the optimized capacities of PVs and ESSs are 2.67 kW and 7.15 kW, respectively, in order to achieve 90% energy self-sufficiency. We visualized the change in the optimum capacity of PVs and ESSs for the desired energy self-sufficiency. This study would be the base work for forming a grid-distributed energy network system by expanding the system to a national scale.

1. Introduction

Currently, countries around the globe are developing policies to encourage people to harness power from various types of renewable energy sources to solve environmental problems caused by global warming, such as abnormal temperature rise [1,2,3]. Until now, these policies were only focused on the quantity of energy, but future policies will need to be focused on enhancing the stability of the generated power and methods to utilize it [4]. An energy storage system (ESS), which is connected to a grid to store energy during the absence of power generation, is crucial for addressing such problems [5]. Recently, ESSs using lithium-ion batteries (LIBs) have become popular, and are expected to be key in addressing issues such as sudden blackouts caused by unstable power supplies or for control of the power demand [6,7,8,9]. In the case of reclaimed land and reservoirs that are suitable for large power generation (around 100 MW), there have been challenges in connecting the power generation facilities to the main power grid. Such cases have the advantage of increasing the economic feasibility and reducing costs. However, they still create with problems when installed in large-scale renewable energy systems, such as needing to get approval from residents, a lack of reliability of the quality of the generated energy, and the expansion of the blackout area.
To find an alternative solution for securing a stable energy system, the government and main power distributor changed their target to rural farming areas and energy self-sufficient households/towns. A system with an adequate capacity for photovoltaic system (PVs) and ESSs for household load patterns would become a microgrid renewable energy source that can handle following problems: difficulties in choosing a suitable place for generating renewable energy, environmental issues, difficulty in connecting to the power grid of the main power distributor, and a decrease in power quality due to climate change.
The government and main power distributor expect that an ideal distributed network will form between connected towns, which is an extended concept of a “prosumer” (producer and also consumer) that minimizes production and energy consumption losses to enhance energy self-sufficiency [10,11,12,13]. Then, by analyzing the scale and power usage pattern of each house, an entire island can become a prosumer with energy self-sufficiency [14]. Various environmental conditions of the installation sites should be considered in order to accurately predict the output, which would lead to the optimization of the capacities of PVs/ESS [15,16].
An announcement was made by the government, declaring to supply and install 3-kW sized PV systems with an efficiency over 18% to 6700 households around the country in 2019 [17], and by 2017, 220,000 households had already been supplied with a PV system. The price of PVs with 3 kW was set to about $5000, and for a system with less than a 2-kW capacity, the price was set to about $4000. This could show that installing PVs and ESSs on a bigger scale or in a group would be more favorable to minimize the unit cost of the system. If the cost of the main components of PVs and ESSs, such as the module, battery, and power conditioning systems (PCS), can be regulated, then a competitive energy source for households can be realized. A reduction in large-scale nuclear and thermal power generation, as intended by the government, will, in turn, be able to reduce the renewable energy certificate (REC), thus resulting in a minimization of the system marginal price (SMP) rise [18,19].
In this paper, a calculation and analysis method of the optimum capacities of PVs and ESSs for rural areas for various load usage patterns is presented. Load patterns and environmental data, such as the insolation of certain areas, were analyzed. Then, we visualized how the optimum capacity of the PVs and ESSs would change in different energy self-sufficiency from 70% to 93%, and obtained the relationship between the capacity of PVs and ESSs.

2. Data Collection from the Target Area

2.1. Area Data of Energy Self-Sufficient Households

The target town, which was designed to secure 90% energy self-sufficiency by minimizing power usage and the number of sunless days, consisted of approximately 70% farming and 30% fishing households. Out of a total of 905 households, 207 were fishing, 346 were farming, and 352 were sustained by both farming and fishing. Figure 1 shows detailed information about the 905 target households, such as the method of classifying them into five villages. “Building” indicates the number of households in the villages that installed PVs on the rooftop or at the side of the residential building. “Land” indicates the number of households in the villages that installed PVs in their yard or at other sites near their house because the residential building was too fragile to install PVs on it. “Forest/Farmland” indicates the number of PVs installed in households that live off farming, for example, PVs installed in barns. “Mobile” indicates the number of PVs installed in a mobile rack or frame so that they could be moved to places that consume power occasionally, such as a greenhouse.

2.2. Study of the Monthly Average Energy Use of 905 Households

Table 1 depicts the average energy consumption of the 905 households for every month of 2017. The maximum value of energy consumption took place in August, showing 262 kWh, whereas the minimum value took place in March, showing 205 kWh. The total and average power usage of the 905 samples in 2017 were 2712 kWh and 226 kWh respectively. When compared with the average energy consumption of a metropolitan area, which is around 1000 kWh, the number is quite low. This is because the characteristics of the people living in rural areas—such as the size of a family, which generally does not exceed three, and that people in rural areas tend to avoid owning and using electrical devices—show very few activities after sunset, resulting in a very small power consumption for lighting purposes.
Table 2 and Figure 2 show the proportion of energy usage of the 905 target households. Out of the 905 households, 304 (33.59%) had an average energy usage between 200 and 300 kWh in 2017, which was the biggest portion of the whole samples. Households using less than 100 kWh accounted for only 1.66%, and those using over 700 kWh were only 0.22%, which made them the minority cases.

2.3. Examination on Counter-Traded Power for Households Using an Average of 250 kWh in a Month

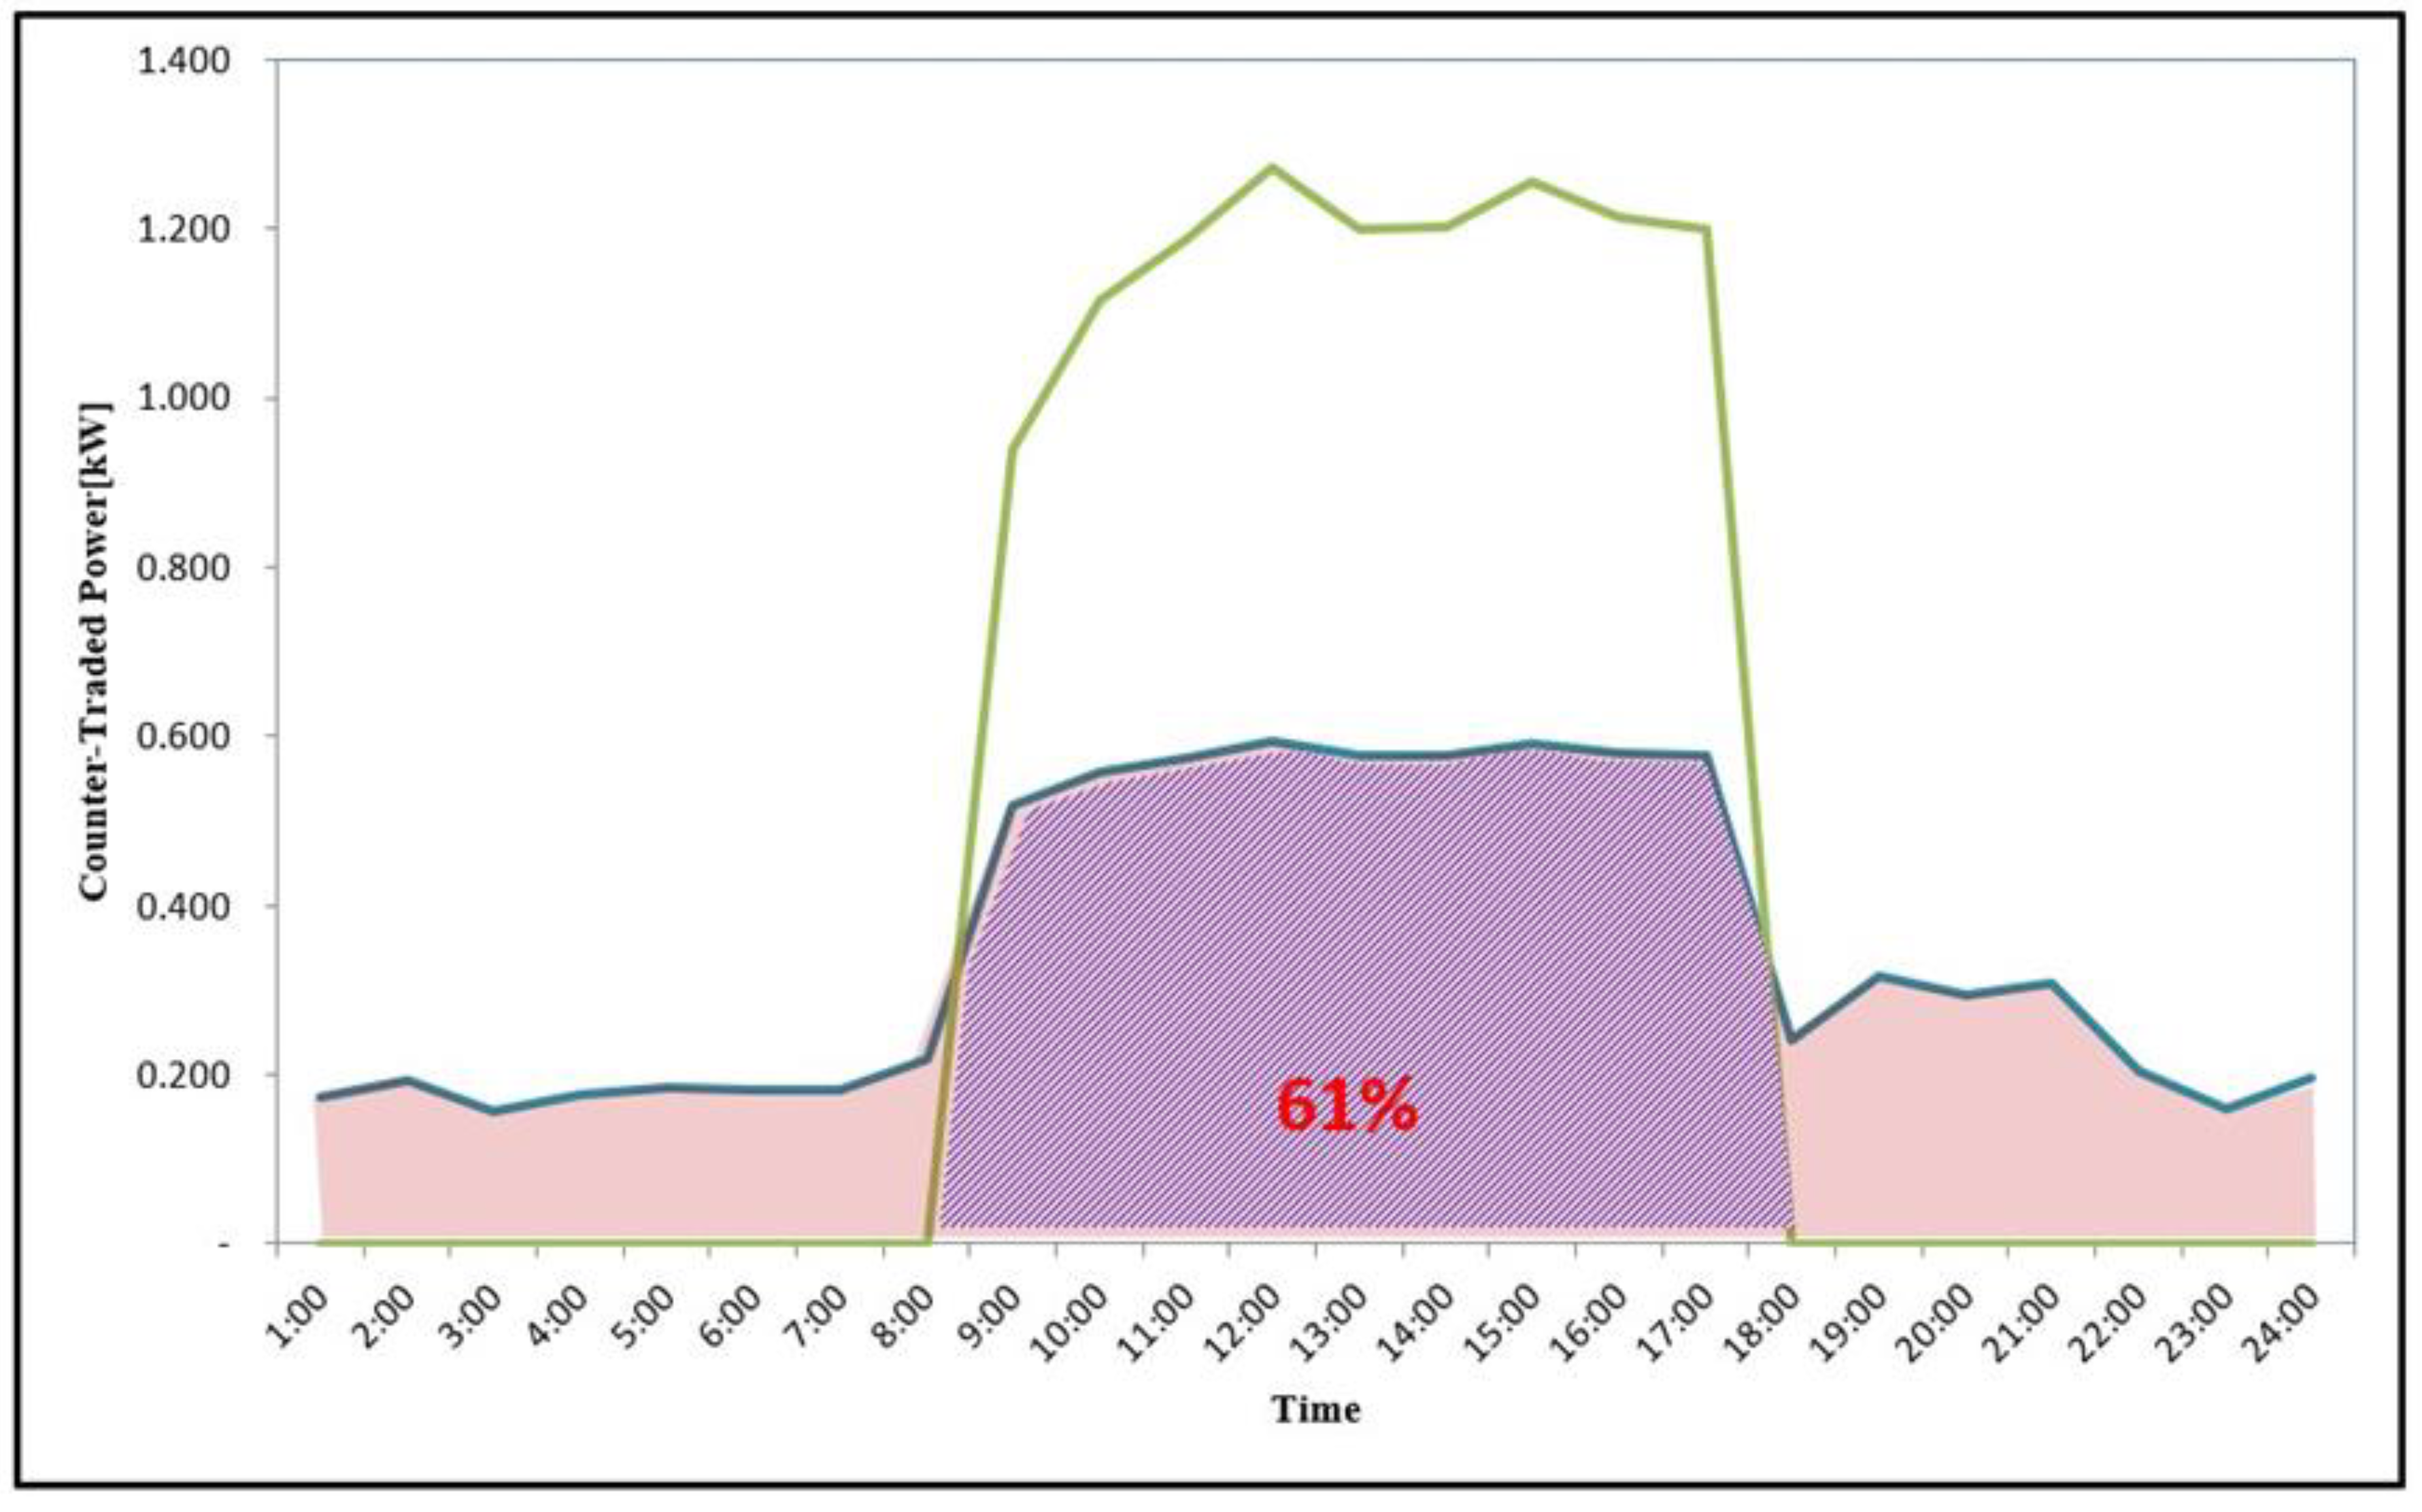
Figure 3 was made by overlapping the estimated solar power generated by 3-kW PVs in a day (green line), and the hourly power usage pattern of households using an average of 250 kWh in a month (blue line). The overlapped area (purple) indicates the counter-traded power to help illustrate how installing PVs could affect enhancing energy self-sufficiency. Counter-traded power is calculated by subtracting the power generated by PVs from the power consumed during the same time period. This way, users can see how much electricity charge could be saved by installing PVs. Assuming that households have the same power usage pattern, the hourly power usage patterns could be predicted for cases where PVs are not installed [20]. If the load pattern of the household can be altered so that more power usage could be placed within the generating time of the PVs, then the portion for counter-traded energy would rise by over 61%, as shown in Figure 3, resulting in improved economic feasibility. Therefore, in this work, counter-traded power was taken into account when selecting the adequate capacity of the ESS. Minimizing the capacity of the ESS is crucial for decreasing the initial construction costs and increasing economic feasibility. Modifying the daily load pattern of the households to be placed within the generation time of the PVs will result in a rise of counter-traded power to over 61%, and help with deciding the economically suitable capacities of the ESS.
The load patterns of certain rural farming household areas were analyzed. The data concerning the insolation of the target area for the last five years and the monthly average power usage of the households in the previous year were collected. Once the PV module and inverter were selected, then, with the simulations from the SolarPro Program and/or modeling method [21], the average power generation per day could be calculated with different environmental conditions. By combining these data with the application and correlation coefficient between the PVs and ESSs, the optimized capacities of the PVs and ESSs can be derived [22].
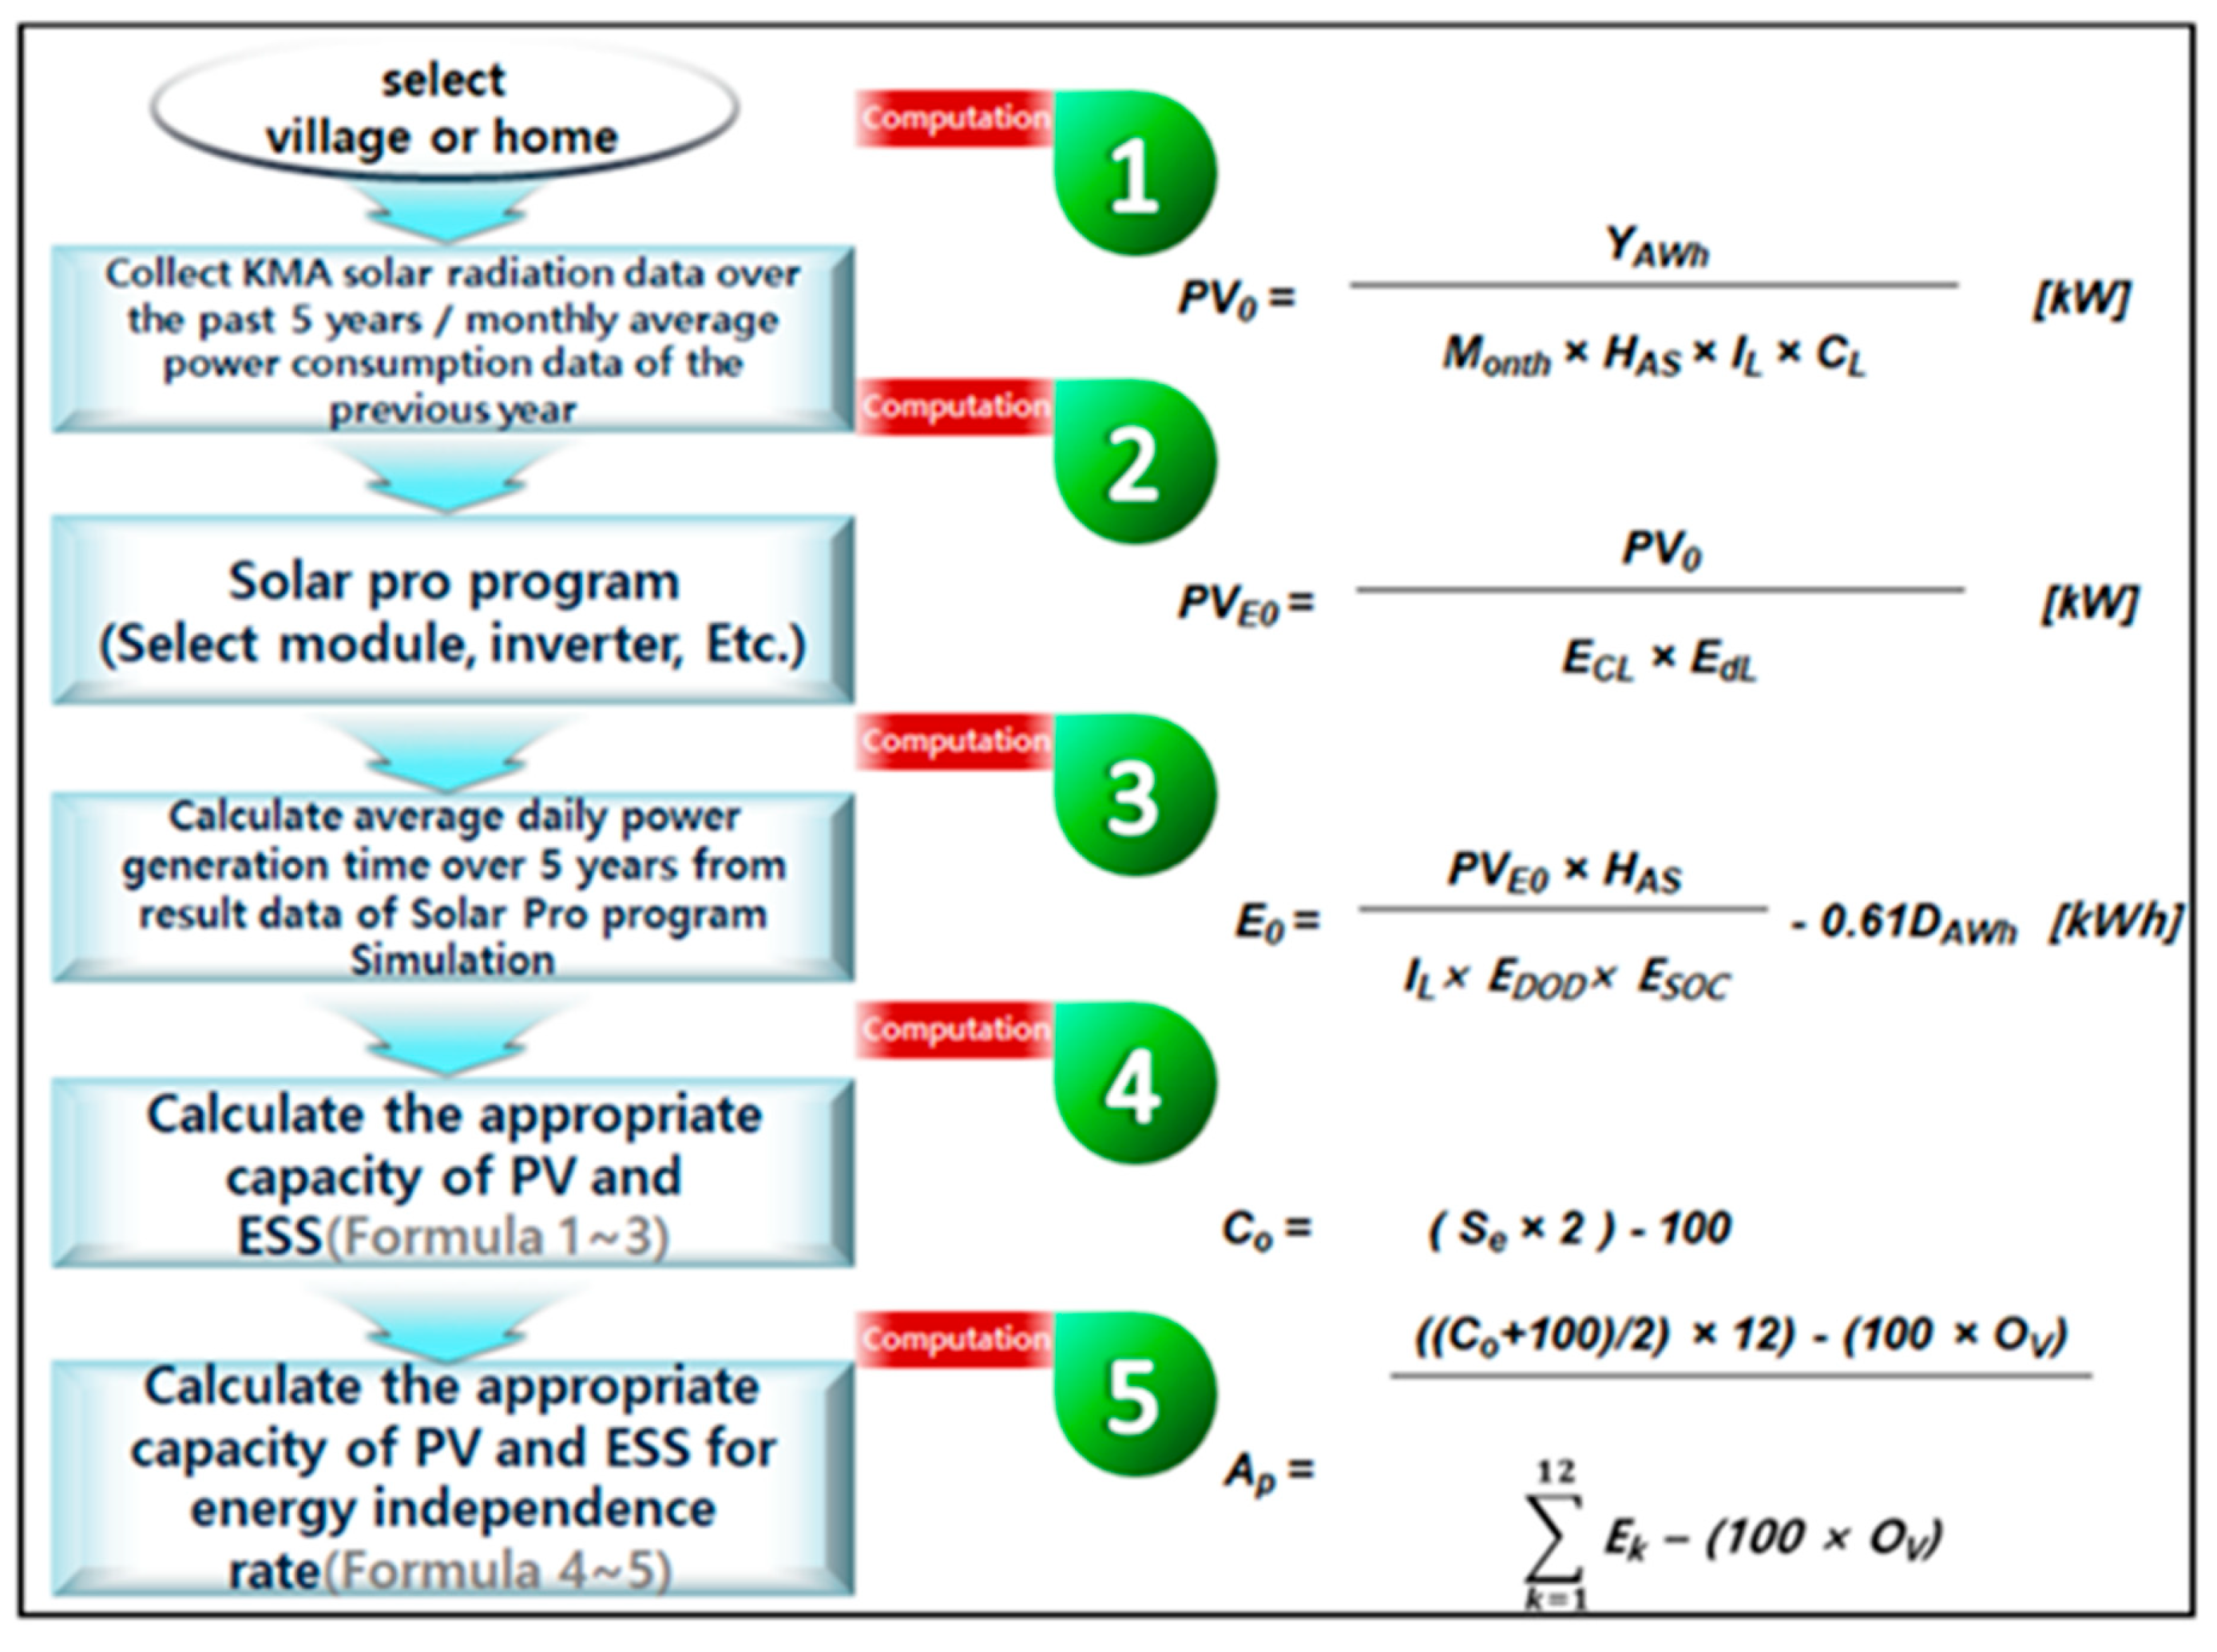
Figure 4 shows the procedure for optimizing the capacity of the ESS, using Equations (1)–(5), by considering the load pattern of a rural area.
Table 3 shows the amount of power generated by the 3 kW PVs per day for each month in 2017. When eight years of data for the same target area (2009–2016) were analyzed, the average number of generating hours showed 3.56 h. The average generation efficiency is a percentage of the generation hour when 3.56 h was set as 100%. When the power generation efficiency exceeded 100%, it could cause errors in deciding the optimum capacity of the ESS. Therefore, for those months when the generating efficiencies were over 100%, the upper limit was regulated to 100%.

3. Calculation Method for the Optimized Capacity of the PV and ESSs with 90% Energy Self-Sufficiency

3.1. Calculation Method for Optimized PVs Capacity

P V o = Y A W h   M o n t h   ×   H A S   ×   I L ×   c L   [ k W ]
  • PV0 = Optimized capacity of PVs
  • YAWh = Average energy usage per month in last year (kWh)
  • Month = 1 month (365/12; day)
  • HAS = Daily insolation hour of the area in the last year (h)
  • IL = Power loss in Inverter (0.965)
  • CL = Power loss in Cable (0.9926)
P V E o = P V 0   E C L   ×   E d L     ( k W h )
  • PVEo = Optimized capacity of PVs considering the charge/discharge losses
  • ECL = Energy loss in charging ESS
  • EDL = Energy loss in discharging ESS

3.2. Calculation Method for Optimized ESS Capacity

E 0 = P V E 0   ×   H A S P L   ×   E D O D   ×   E S O C   0.61 D A W h   ( k W h )
  • EO = Optimized capacity of ESS
  • PVEO = Optimized capacity of PVs
  • PL = PCS loss (0.965)
  • HAS = Daily average insolation of the area in the previous year (h)
  • Dawh = Daily average power usage (kWh)
  • EDOD = Depth of discharge (0.9)
  • ESOC = State of charge (0.9)
The factors presented above were calculated so that the errors in optimizing the capacity of the ESS would be minimized. The values for each factor were calculated by analyzing data of the target area for eight years.

4. Calculation of Generation Time for Energy Self-Sufficiency of 90% with PVs and ESSs

  • C0 = (Se × 2) − 100
  • C0 = Correlation coefficient
  • Se = self-sufficiency (%)
A p = ( ( C 0 + 100 ) / 2 )   ×   12 )     ( 100   ×   O v ) k = 1 12 E k ( 100 × O v )
  • Ap = Application coefficient
  • Ov = Number of households that had over a 100% generation time efficiency per month
  • Ek = Sum of efficiency from January to December
The following equation used to set the energy self-sufficiency of the target household as 90%.
  • C0 = (90 × 2)−100 = 80
A p = ( ( 80 + 100 ) / 2 )   ×   12 )     ( 100   ×   5 ) 1116.19     ( 100   ×   5 ) = 580 616.19   = 0.9412651
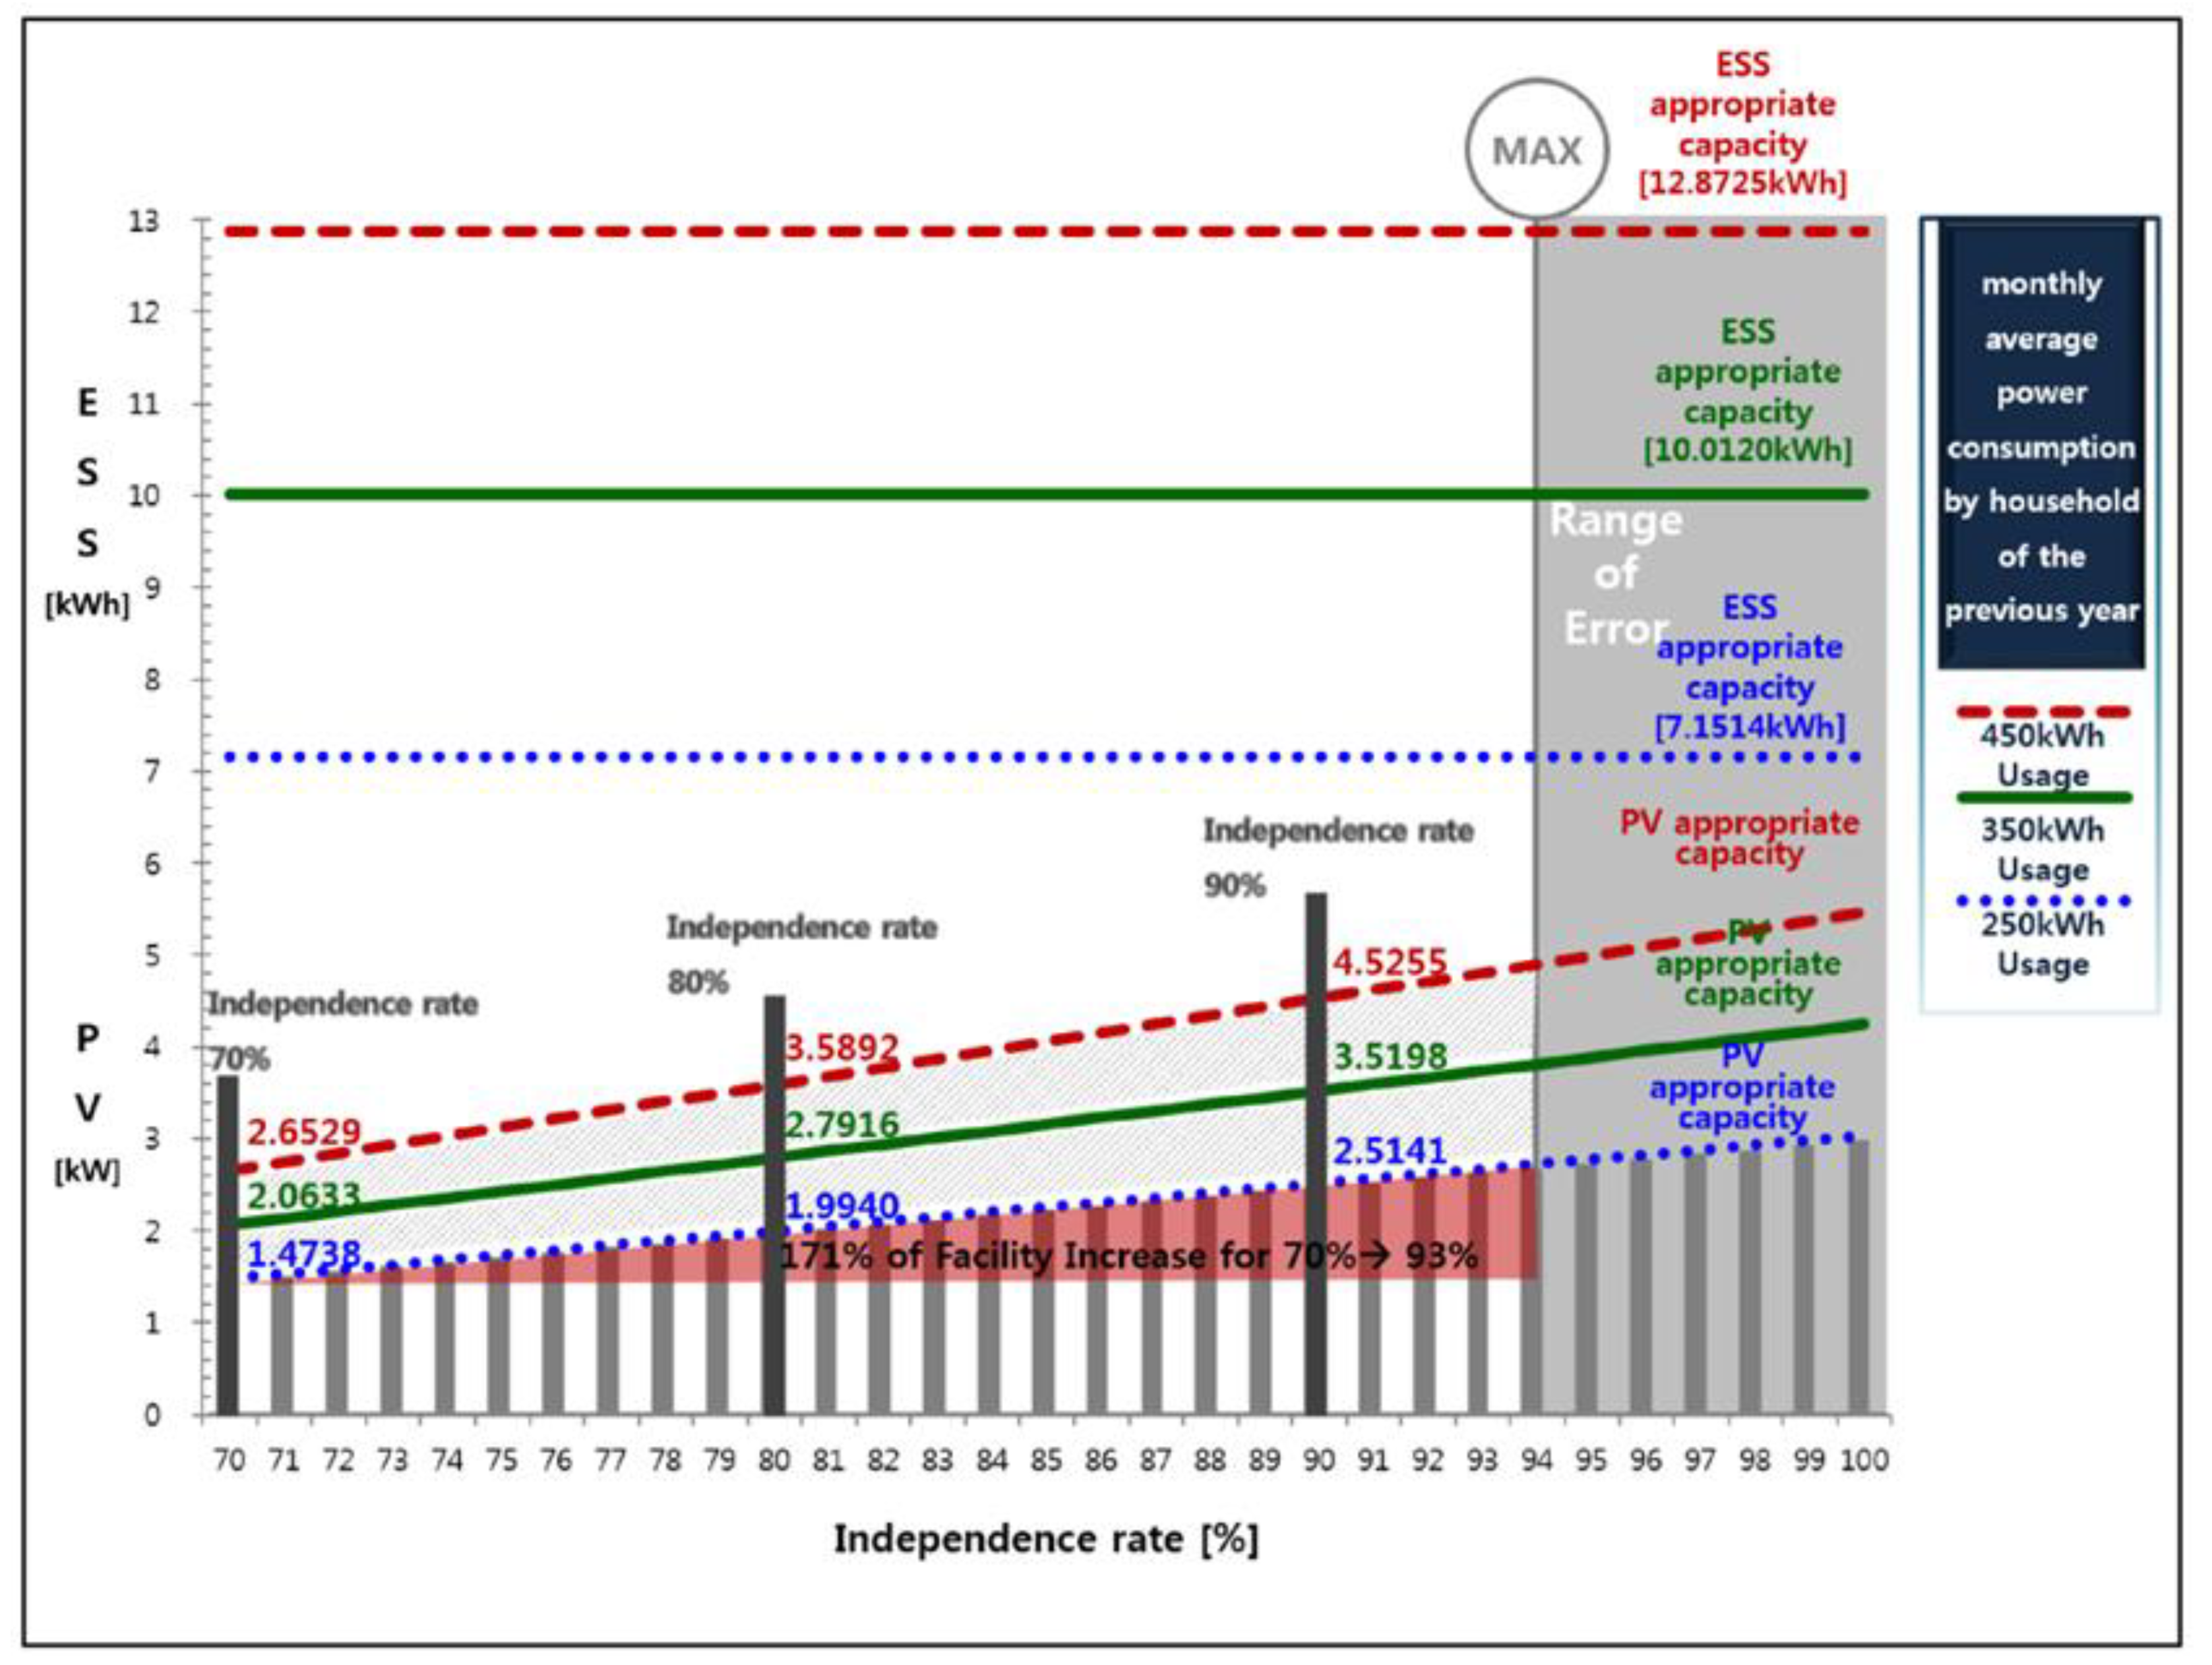
As shown in Table 4, for those months when the self-sufficiency was over 100%, the values were limited to 100%. Under this condition, by using the derived application coefficient, a 90% energy self-sufficiency could be verified. In the case of households that used an average of 250 kWh per month in the last year, the energy self-sufficiency increased from 73% to 93%, and the optimized capacity of the PVs increased from 1.65 to 2.82 kW, which is an approximately 71% rise. For households with 350 and 450 kWh energy usages, the capacities of the PV facilities increased from 2.32 to 3.95 kW, and 2.98 to 5.28 kW, respectively. Both cases showed an approximately 70% rise in PVs capacity, as presented in Figure 5.
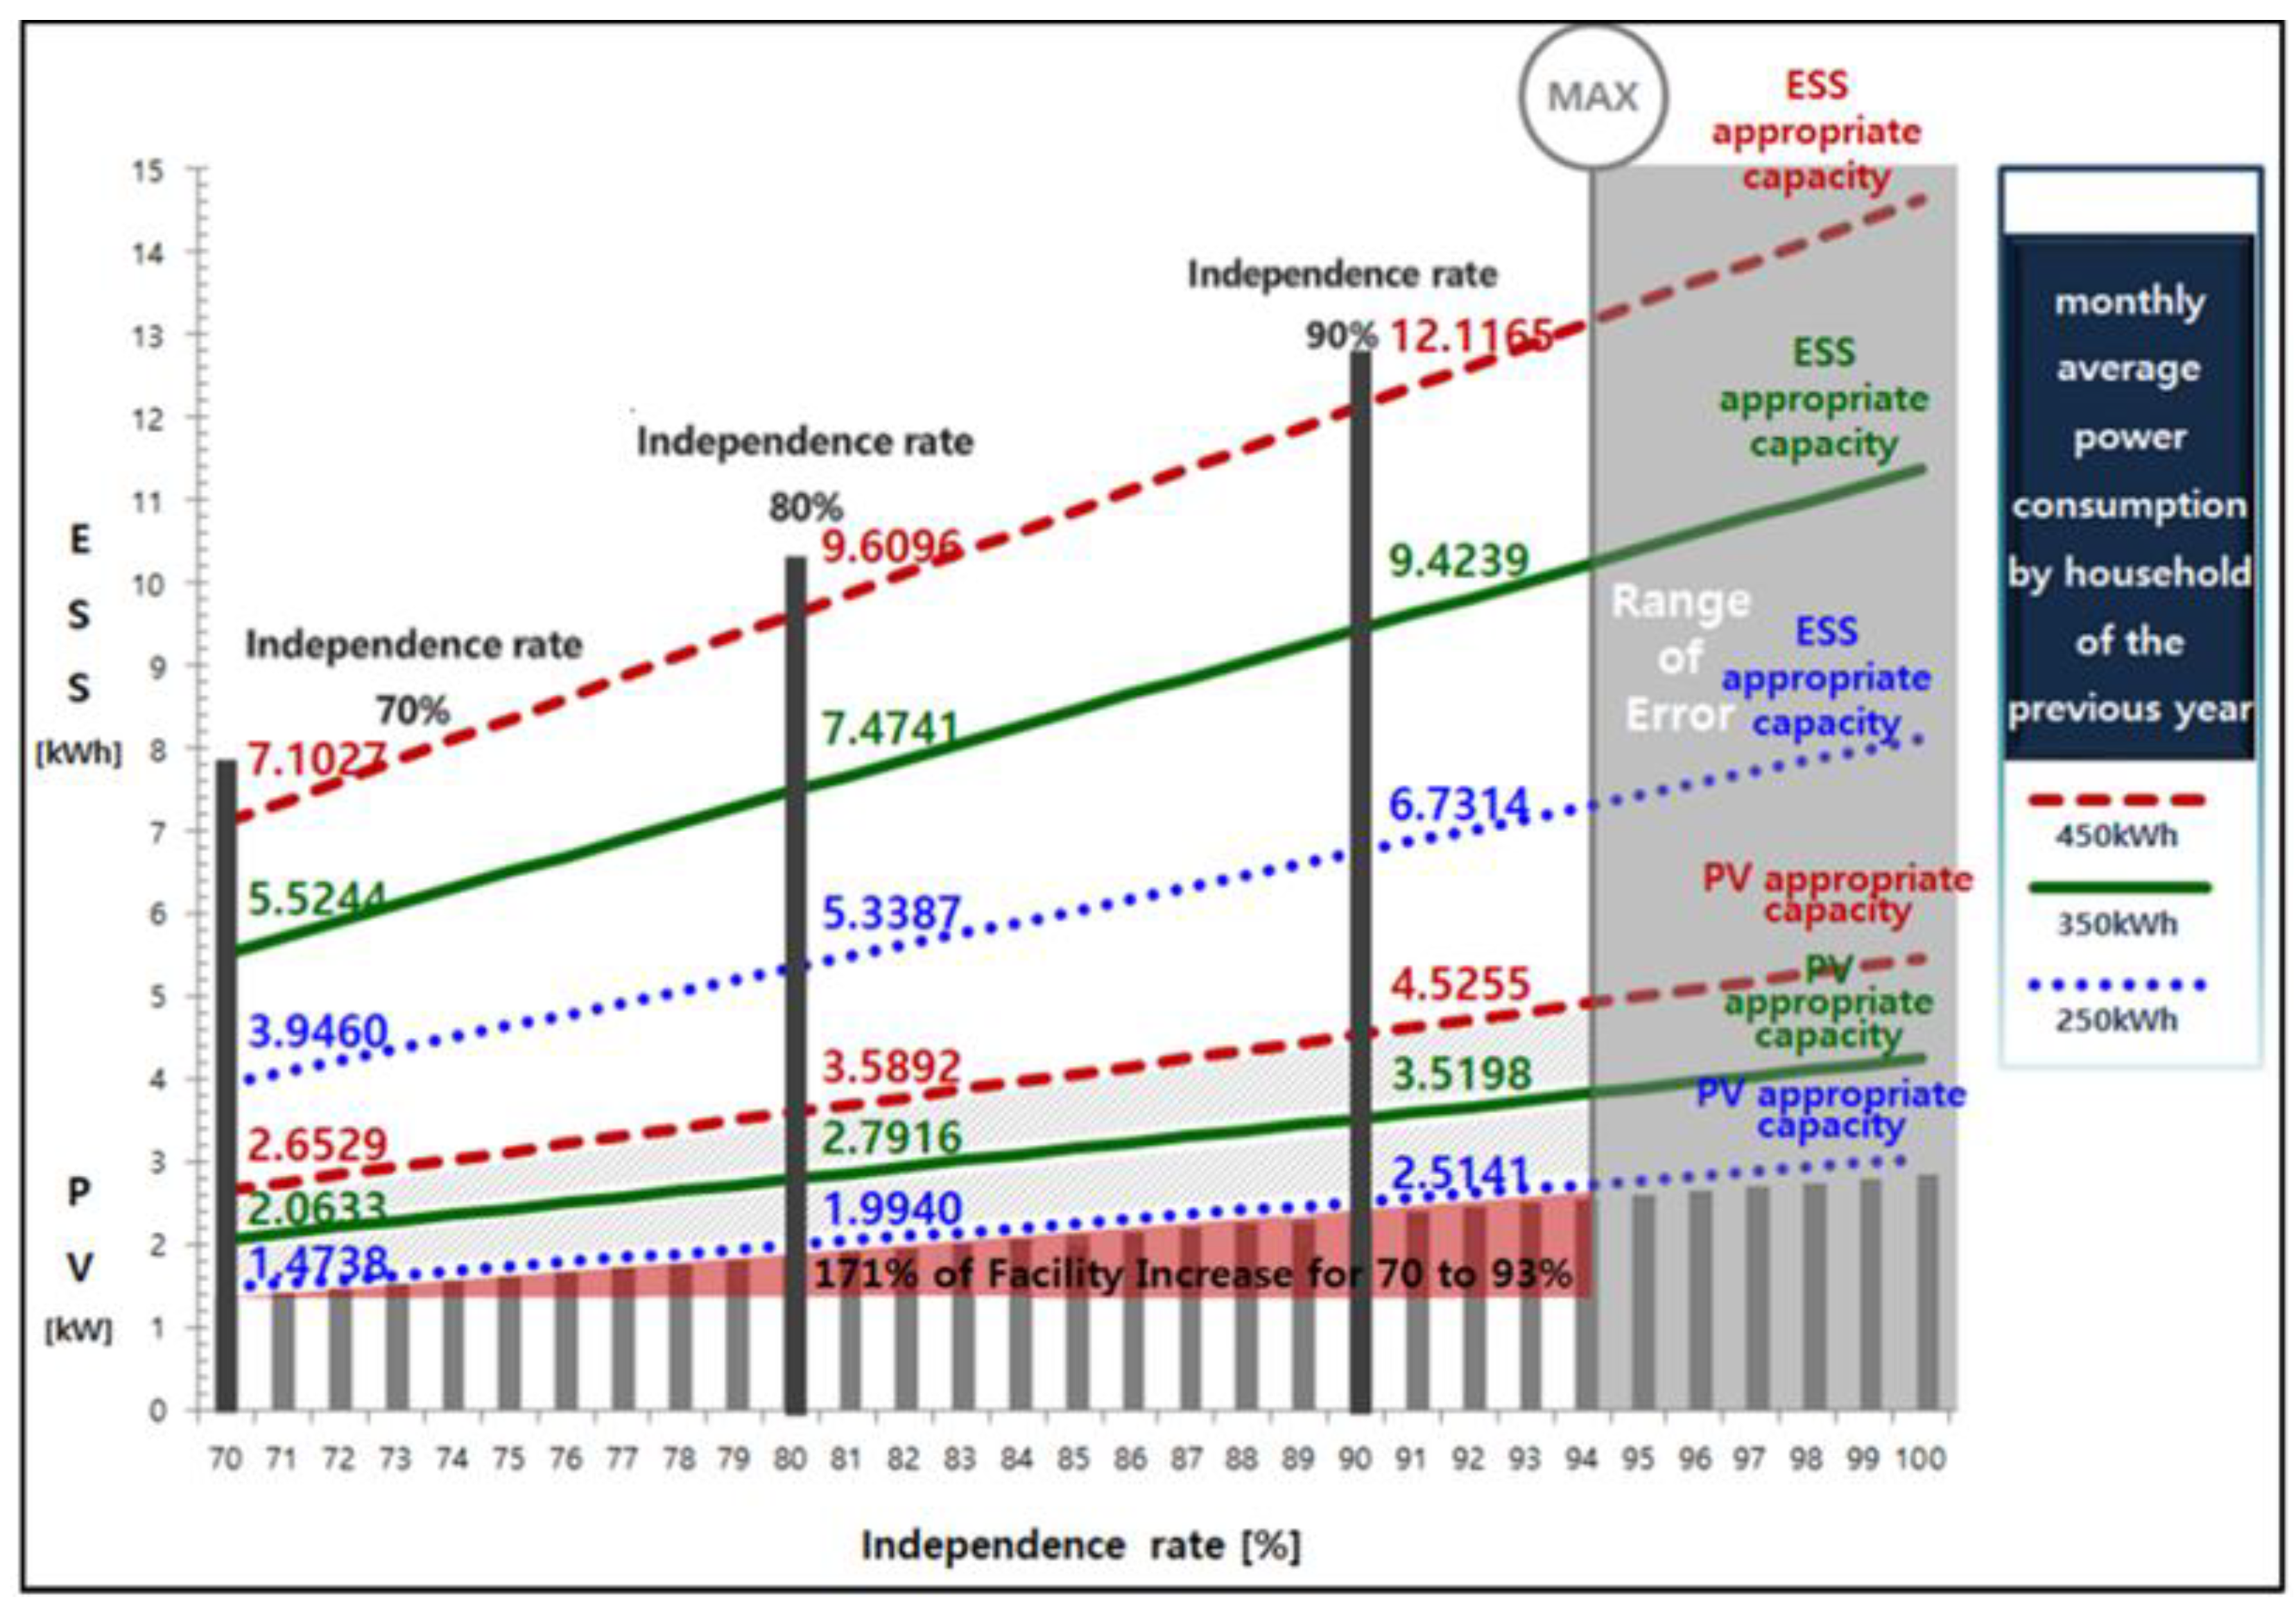
According to the results of the research and the simulations, when the energy self-sufficiency of a household exceeds 93%, errors are inevitable; therefore, the optimum capacity of the PVs and ESSs must be selected in the limited condition of a below 93% energy self-sufficiency. As shown in Figure 5, the optimum capacity of the ESS for a household using 250 kWh per month is approximately 7.15 kWh, and does not change, as the energy self-sufficiency varies between 70% and 90%. For households with an average power usage of 350 and 450 kWh, the optimum capacities of the ESS are 10.01 and 12.87 kWh, respectively. When energy self-sufficiency is set between 70% and 100%, hourly increases are generated as the capacity of the PVs decreases, resulting in a steady value for the capacity of the ESS. With Equations (1)–(3) used to derive the optimum capacities of the PVs and ESS, a large range of errors were found. Further analyzation was conducted, and when the energy self-sufficiency increased from 70% to 94%, the capacity of the ESS was shown to be 267.74% of the capacity of the PVs at a whole range. The optimum capacity of the ESS must thus be set as 267.74% of the PVs capacity, to compensate for such errors. Therefore, as the energy self-sufficiency increased from 70% to 100%, the optimum capacity of the ESS also increased proportionally. Figure 6 shows the re-adjusted values of the ESS capacities as the energy self-sufficiency rate rises.

5. Conclusions

Under the national policy, the PVs capacity is generally set to either 3 kW or 5 kW, regardless of the power usage pattern of each household or town. If a PVs with a capacity of 5 kW generates for an average of 3.6 h per day for a month, the generated power would be 540 kWh. If a PVs with a capacity of 3 kW generates under the same condition, the generated power would be 324 kWh. In both cases, there are households that do not fit into the system. To reduce such problems and enhance the economic feasibility of the system, a case study of 905 households was done to design the proper method of deriving the optimum capacity of PVs and ESSs that is proportional to the scale of the energy self-sufficiency of 70–90%.
Out of the 905 households in a rural farming area on the west coast of Korea, households that used an average of 250 kWh energy per month were chosen for the study, because these were the most abundant demographic. As obtaining the precise data for the number of sunless days and the exact dates of maximum/minimum energy usage is impossible, insolation data for the last 10 years achieved from Meteorological Administration Agency was used to calculate the optimum capacity of the PVs and ESSs for each household [20]. This was to prevent the decrease in economic feasibility due to the excessive capacity of the PVs and ESSs, or the decrease in energy self-sufficiency from a lack of adequate capacity. A visualization of the optimized capacity for PVs and ESSs, as the desired energy self-sufficiency changed from 70% to 93%, for a household consuming 250, 350, and 450 kWh per month, was made. The optimized capacities of the PVs and ESSs for a household consuming 250 kWh per month were 2.67 and 7.15 kW, respectively, when the generation time estimated from the insolation data was considered. The energy self-sufficiency could be increased by 90% if the load usage pattern was adjusted so that it would be positioned within the generation time, which would then result in the increase of the counter-traded power. This would help to create a system to decide the capacities of the PVs and ESSs, with high efficiency and economic feasibility. With the proposed method, the optimized capacity of the PVs and ESSs could be obtained for the desired energy self-sufficiency. However, when energy self-sufficiency was near 100%, an error would occur. For those cases, we suggest the concept of a distributed network and prosumer, so that households could cover for the shortage or surplus of electricity generated.
Generally, rural areas over the country show similar load patterns, because they tend to share a similar pattern of life. Therefore, this research would be compatible with rural areas around the nation [14]. However, the load patterns of rural areas would not have the exact match with other places, so the same approach should be taken for unknown load patterns. This research could then be expanded to the national scale. The result of applying the proposed method to other rural areas could be confirmed in our previous research on designing a carbon free renewable energy system [23]. This research would be a base project for a national project of establishing a future type of grid distributed network.

Author Contributions

C.Y.C.: conceptualization, methodology, writing-original draft preparation; W.L.: data curation, writing-review and editing, formal analysis; B.G.B.: visualization, validation; J.C: resources, software; S.H.L: data curation, investigation; S.C.W.: methodology; H.K.A.: project administration, supervision.

Funding

This work was supported by the New and Renewable Energy Technology Program of the Korea Institute of Energy Technology Evaluation and Planning(KETEP), granted financial resources by the Ministry of Trade, Industry and Energy, Republic of Korea (No. 20183010014260)

Conflicts of Interest

The authors declare no conflict of interest.

References

  1. Zafar, U.; Rashid, T.U.; Khosa, A.A.; Khalil, M.S.; Rashid, M. An overview of implemented renewable energy policy of Pakistan. Renew. Sustain. Energy Rev. 2018, 82, 654–665. [Google Scholar] [CrossRef]
  2. Fernando, Y.; Bee, P.S.; Jabbour, C.J.C.; Thomé, A.M. Understanding the effects of energy management practices on renewable energy supply chains: Implications for energy policy in emerging economies. Energy Policy 2018, 118, 418–428. [Google Scholar] [CrossRef]
  3. Karunathilake, H.; Perera, P.; Ruparathna, R.; Hewage, K.; Sadiq, R. Renewable energy integration into community energy systems: A case study of new urban residential development. J. Clean. Prod. 2018, 173, 292–307. [Google Scholar] [CrossRef]
  4. He, J.; Zhao, C.; Cai, L.; Cheng, P.; Shi, L. Practical closed-loop dynamic pricing in smart grid for supply and demand balancing. Automatica 2018, 89, 92–102. [Google Scholar] [CrossRef]
  5. Das, S.; Akella, A.K. Power flow control of PV-wind-battery hybrid renewable energy systems for stand-alone application. Int. J. Renew. Energy Res. (IJRER) 2018, 8, 36–43. [Google Scholar]
  6. Chung, D.W.; Yang, S.H. SOC estimation of lithium-ion battery based on kalman filter algorithm for energy storage system in microgrids. E3S Web Conf. 2018, 57, 02006. [Google Scholar] [CrossRef]
  7. Berrueta, A.; Heck, M.; Jantsch, M.; Ursúa, A.; Sanchis, P. Combined dynamic programming and region-elimination technique algorithm for optimal sizing and management of lithium-ion batteries for photovoltaic plants. Appl. Energy 2018, 228, 1–11. [Google Scholar] [CrossRef]
  8. Park, S.; Kim, Y.M.; Lee, P.Y.; Kim, J. A study on application of the Lithium-ion battery for coping with extended station blackout. In Proceedings of the 2018 53rd International Universities Power Engineering Conference (UPEC), Glasgow, UK, 4–7 September 2018; pp. 1–5. [Google Scholar]
  9. Ibrahim, H.; Ilinca, A.; Perron, J. Energy storage systems—Characteristics and comparisons. Renew. Sustain. Energy Rev. 2008, 12, 1221–1250. [Google Scholar] [CrossRef]
  10. Liu, N.; Cheng, M.; Yu, X.; Zhong, J.; Lei, J. Energy-sharing provider for pv prosumer clusters: A hybrid approach using stochastic programming and stackelberg game. IEEE Trans. Ind. Electron. 2018, 65, 6740–6750. [Google Scholar] [CrossRef]
  11. Palm, J.; Eidenskog, M.; Luthander, R. Sufficiency, change, and flexibility: Critically examining the energy consumption profiles of solar PV prosumers in Sweden. Energy Res. Soc. Sci. 2018, 39, 12–18. [Google Scholar] [CrossRef]
  12. Wu, X.; Hu, X.; Teng, Y.; Qian, S.; Cheng, R. Optimal integration of a hybrid solar-battery power source into smart home nanogrid with plug-in electric vehicle. J. Power Sources 2017, 363, 277–283. [Google Scholar] [CrossRef] [Green Version]
  13. Wu, X.; Hu, X.; Yin, X.; Zhang, C.; Qian, S. Optimal battery sizing of smart home via convex programming. Energy 2017, 140, 444–453. [Google Scholar] [CrossRef]
  14. Lee, C.; Bhang, B.; Kim, D.; Lee, S.; Cha, H.; Ahn, H. Estimation of load pattern for optimal planning of stand-alone microgrid networks. Energies 2018, 11, 2012. [Google Scholar] [CrossRef] [Green Version]
  15. Cha, H.L.; Bhang, B.G.; Park, S.Y.; Choi, J.H.; Ahn, H.K. Power prediction of bifacial Si PV module with different reflection conditions on rooftop. Appl. Sci. 2018, 8, 1752. [Google Scholar] [CrossRef]
  16. Lee, H.G.; Kim, G.-Y.; Bhang, B.G.; Kim, D.K.; Park, N.; Ahn, H.-K. Design Algorithm for Optimum Capacity of ESS Connected with PVs Under the RPS Program. IEEE Access 2018, 6, 45899–45906. [Google Scholar] [CrossRef]
  17. Renewable Energy Certificate. Available online: https://www.knrec.or.kr/business/rps_guide.aspx (accessed on 20 February 2019).
  18. Greenhome Project. Available online: http://greenhome.kemco.or.kr/index.do (accessed on 9 April 2019).
  19. System Marginal Price. Available online: http://www.kemco.or.kr/web/kem_home_new/info/dictionary/voca/kem_view.asp?sch_search=&sch_key=dic_word&sch_value=%EA%B3%84%ED%86%B5%ED%95%9C%EA%B3%84%EA%B0%80%EA%B2%A9&h_page=1&q=1426 (accessed on 20 February 2019).
  20. Khatib, T.; Mohamed, A.; Sopian, K. A review of photovoltaic systems size optimization techniques. Renew. Sustain. Energy Rev. 2013, 22, 454–465. [Google Scholar] [CrossRef]
  21. Kim, G.G.; Choi, J.H.; Park, S.Y.; Bhang, B.G.; Nam, W.J.; Ahn, H.K. Prediction model for PV performance with correlation analysis of environmental variables. IEEE J. Photovolt. 2019, 9, 832–841. [Google Scholar] [CrossRef]
  22. Wang, F.; Li, K.; Wang, X.; Jiang, L.; Ren, J.; Mi, Z.; Shafie-khah, M.; Catalão, J. A distributed PV system capacity estimation approach based on support vector machine with customer net load curve features. Energies 2018, 11, 1750. [Google Scholar] [CrossRef] [Green Version]
  23. Cho, C.-Y.; Kim, S.-S.; Lee, H.G.; Ko, J.-W.; Lim, J.-R.; Woo, S.C.; Cha, H.-L.; Kim, D.K.; Ahn, H.K. Optimal design of renewable energy resources considering electric load control for carbon free Jeju island in Korea. In Proceedings of the European Photovoltaic Solar Energy Conference and Exhibition, Munich, Germany, 21 June 2016. [Google Scholar]
Figure 1. Family distribution in the western coast of Chungnam Province.
Applsci 09 05323 g001
Figure 2. Average energy consumption per household for the 905 study subject households in 2017.
Applsci 09 05323 g002
Figure 3. Average counter-traded power in a day when 3-kW photovoltaics (PVs) are installed.
Applsci 09 05323 g003
Figure 4. Flow diagram for finding the optimum capacity of PV and energy storage systems (ESSs).
Applsci 09 05323 g004
Figure 5. PVs and ESSs capacity change graph with a 70–100% self-sufficiency.
Applsci 09 05323 g005
Figure 6. Variation in the ESS capacity of 267.74% relative to the PV optimum with a 70–100% self-sufficiency.
Applsci 09 05323 g006
Table 1. Monthly energy consumption of the 905 households in 2017 (unit: kWh).
Households 12904905Average
Month
January55489~130144232
February88249179107236
March44162135103205
April66148142117222
May207184137114216
June77254149127213
July78349158186230
August97428165198262
September76400130151220
October103246142116225
November43368149115225
December45315158121226
Total97935921.77415992712
Table 2. Average energy consumption ratio per household for the 905 households in 2017.
CategoryNumber of HouseholdsPortion
50–100 kWh151.66%
100–200 kWh13414.81%
200–300 kWh30433.59%
300–400 kWh25728.40%
Table 3. Monthly energy generation of the 905 households in 2017 (unit: kWh).
CategoryAverage Power Generated (kWh/day)Average Number of Generating Hour (h/day)Average of Generation EfficiencyGeneration Efficiency Limited to 100%
January8.733.1588.6188.61
February9.613.4797.5797.57
March11.704.23118.75100.00
April11.724.23118.94100.00
May12.524.52127.09100.00
June11.384.11115.48100.00
July9.043.2791.7491.74
August9.523.4496.6396.63
September10.303.72104.51100.00
October9.753.5298.9298.92
November7.062.5571.6271.62
December7.012.5371.1071.10
Average9.863.56100.0893.02
Table 4. Average power generated by 3-kW PVs per day for each month over the last eight years.
CategoryAverage Generating Hour per Day (h)Calculation Method
(Ap = 0.9412651)
Average of Self-Sufficiency Set to 90% (%)
January3.15(3.15/3.56) × 0.9413 × 10083.40
February3.47(3.47/3.56) × 0.9413 × 10091.83
March4.23100.00100.00
April4.23100.00100.00
May4.52100.00100.00
June4.11100.00100.00
July3.27(3.27/3.56) × 0.9413 × 10086.35
August3.44(3.44/3.56) × 0.9413 × 10090.95
September3.72100.00100.00
October3.52(3.52/3.56) × 0.9413 × 10093.11
November2.55(2.55/3.56) × 0.9413 × 10067.41
December2.53(2.53/3.56) × 0.9413 × 10066.92
Average3.56-90.00