Article

Development of Detection System with Low Predictive Errors for Determining Vitamin C Content of Indian Jujube

Graduate Institute of Precision Engineering, National Chung Hsing University, No.145, Xingda Rd., South Dist., Taichung 402, Taiwan
*
Author to whom correspondence should be addressed.
Appl. Sci. 2019, 9(24), 5317; https://doi.org/10.3390/app9245317
Submission received: 31 October 2019 / Revised: 2 December 2019 / Accepted: 2 December 2019 / Published: 6 December 2019
(This article belongs to the Special Issue Joint Special Issue With OPTIC 2019)

Abstract

:
Herein, we developed a nondestructive detection system with low prediction errors for determining the vitamin C content in Indian jujube. This system comprises a Ge photodetector, a halogen lamp and five near-infrared (NIR) bandpass filters. The detection of vitamin C is enabled by the absorption of its OH and CH2 bonds in the NIR region. The light beams of our system were parallel-polarized and designed to be incident on the fruit at the Brewster angle (θB), which reduces reflectance noise from the fruit’s skin and enhances the OH and CH2 absorption signals of the fruit’s flesh. After the reflectance signal was analyzed by the partial least squares (PLS) algorithm to obtain the predicted vitamin C content of each fruit, the coefficient of prediction ( r p 2 ) and root-mean-square error of prediction (RMSEP) were calculated. When wavelengths of 1200, 1400, 1450, 1500 and 1550 nm were used for probing, r p 2 and RMSEP of the system detecting vitamin C were 0.84 and 1.65 mg/100 g, respectively. In summary, the vitamin C content of Indian jujube was predicted using a low-cost NIR detection system having a high r p 2 and low RMSEP; further, it comprises five parallel-polarized NIR beams and the PLS algorithm.

1. Introduction

Indian jujube is a typical high value crop in Asia; it is rich in vitamin C, an essential trace element that serves as an antioxidant and neutralizes free radicals in the human body [1]. Hence, Indian jujube is a popular fruit. However, the vitamin C content of Indian jujube can vary significantly, which may affect consumer purchase intentions significantly. Currently, the determination of a fruit’s vitamin C content typically requires destructive methods, for example, high-performance liquid chromatography (HPLC) analysis, where the fruit is sliced, squeezed and filtered to produce an extract for HPLC analysis [2]. This method is highly time consuming and the damaged fruits cannot be sold. In current state-of-the-art nondestructive measurement systems, fruits are graded using spectroscopic systems and large conveyor belts. However, these systems are large and expensive [3]. In portable nondestructive measurement systems, light from a halogen lamp is channeled through optical fibers to generate a reflectance spectrum of the fruit’s skin. The resulting spectrum is then analyzed to predict the fruit quality. However, these testing systems are costly owing to their built-in spectrometers [4], which has hindered the spread of their use in fruit collection centers and consumer applications.
Research has shown that the vitamin C (or ascorbic acid) content of a fruit is strongly correlated with the second overtone absorptions of OH and CH2 vibrations (1000–1650 nm) [5,6,7,8]. Furthermore, most of the existing nondestructive techniques (NDTs) for vitamin C determination rely on spectroscopy and algorithmic models to predict fruit quality.
The most typically used algorithms in NDTs are multiple linear regression (MLR) and partial least squares (PLS) regression and the calculations are performed by substituting the energy absorbed by the fruits’ flesh (which is derived from the intensity of the reflected light waves) into these algorithms. In MLR, the intensities of a few specified wavelengths are linearly combined to predict some variables. However, in spectroscopic analysis, the presence of multicollinearity between the variables will negatively affect the MLR performance [9,10]. Jaiswal et al. [11] indicated that the calibrated and predicted results of the MLR model can differ significantly, which indicates that MLR predictions are not reliable. PLS extracts the orthogonal factors with the maximum predictive power, which may then be used to predict the variable. Many previous studies have employed PLS models to predict vitamin C content. For example, Yang et al. [12] used a PLS model to determine vitamin C content based on Fourier transform near-infrared (FT-NIR) and FT-Raman spectra. Liao [13] used PLS regression to construct a model for quantifying the vitamin C content of navel oranges via NIR diffuse reflectance spectroscopy. In addition, Qing et al. [14] and Zude et al. [15] used PLS models to calculate fruit soluble solid content (SSC) and fruit flesh firmness. Based on the results of these studies, we decided to use the PLS algorithm to analyze our spectroscopic data.
According to the current market needs, a high accuracy, low prediction error and low-cost nondestructive detection system has great potential. The novelty of this study lies in the construction of a parallel-polarized NIR nonconstructive detection system for determining the vitamin C content in Indian jujube. In this study, the OH and CH2 bonds absorb the parallel-polarized waves substantially [16] and light sources reduce the reflectance of fruit skin and increase detection accuracy at the Brewster’s angle (θB) of incidence [17].
In the present study, the light sources were constructed by using five NIR parallel-polarized wavelength combinations and a Ge photodetector, which greatly reduced the production cost of equipment. Therefore, the optoelectronic detection system achieves high accuracy, a low prediction error and low production cost.

2. Materials and Methods

2.1. Indian Jujube Samples

In this study, parallel-polarized NIR light was used to determine the vitamin C content of Indian jujube in a nondestructive manner. A total of 180 fruits were purchased for this study and the number of Indian jujube samples used in this study was based on the number of samples used by Qing et al. [14] and Magwaza et al. [18] (120 samples). All of the samples were purchased in February 2019 from a retail market in Taichung, Taiwan. The samples of the calibration and prediction sets were both stored in an air-conditioned environment (the laboratory) for a day to ensure that the test conditions of both sets were identical. The temperature in this environment varied between 20 °C and 23 °C and the samples were stored away from strong light. The number of Indian jujube samples in each set and their vitamin C contents are shown in Table 1.

2.2. Experimental Procedures

This study comprises three experimental procedures, as shown in Figure 1. First, we selected wavelengths in NIR range that correspond to the second overtone absorptions of OH and CH2 groups in vitamin C (1000–1650 nm) as probing light sources. The probing light sources were constructed using a parallel-polarized halogen light source and NIR bandpass filters. The central wavelength of the bandpass filters were varied in 50 nm intervals, which allowed us to determine the optimal combination of wavelengths for vitamin C determination.
In the second step, a predictive model for the nondestructive measurement of vitamin C in Indian jujube was constructed. The optimal wavelengths provided in Step 1 were parallel-polarized and designed to be incident at the Brewster angle (i.e., θi = θB) on the 120 Indian jujube samples of the calibration set. HPLC analysis was then performed to determine the vitamin C contents of these samples, while the PLS algorithm was used to relate the reflectance of the fruits’ flesh with their vitamin C contents to construct a predictive model for the vitamin C contents of Indian jujube fruits in the calibration set.
In the third step, the predictive model that was created using the calibration set was used to perform nondestructive vitamin C measurements on fruits in the prediction set. The reflectances of the 60 Indian jujube samples in the prediction set were substituted in the aforementioned predictive model to predict the vitamin C value of each Indian jujube fruit. Destructive vitamin C measurements (HPLC analysis) were then performed to obtain the actual vitamin C values of the fruits in the prediction set. The coefficient of prediction ( r p 2 ) and root-mean-square error of prediction (RMSEP) of the predicted values were then calculated.

2.3. Structure of the Nondestructive Detection System

The block diagram of our parallel-polarized light-based nondestructive measurement system is shown in Figure 2a. Our system comprises a halogen lamp, a parallel polarizer, several NIR bandpass filters, an NIR photodetector and a signal processing module. The signal processing module is connected to the stepper motor that rotates the NIR bandpass filters and the NIR photodetector and it controls the switching of the various bandpass filters and light source. A lens and polarizer were installed at the light source to parallel-polarize the light source. The p-wave is then filtered by one of the several NIR bandpass filters to emit NIR light of a certain wavelength band onto the flesh of the Indian jujube fruit. The NIR photodetector will collect the light reflected by the flesh of the Indian jujube fruit and convert it into an electrical voltage signal. This signal will be digitalized by the signal processing module and then transmitted to an external computer via a communication interface. Finally, the computer will calculate the r p 2 and RMSEP of the detection system with respect to the vitamin C content of the Indian jujube fruits.
Figure 2b shows the structural diagram of our system. The halogen lamp, polarizer, bandpass filters, photodetector and signal processing module are all integrated inside a single housing and the top of the housing contains an opening where the Indian jujube sample is to be placed for vitamin C measurements. The light source and photodetector were both housed inside a sealed chamber (indicated by dotted lines in Figure 2a. The housing was designed such that the light source and photodetector are both oriented towards the center of the housing’s opening, with the angle between the light source and sample normal being the Brewster angle (θB). Figure 2b shows the paths of the p-waves. The light source and photodetector are located on the same measurement plane; further, the p-waves will pass through air (Medium 1) before entering the flesh of the Indian jujube fruit (Medium 2) with its polarization parallel to the plane of incidence. Therefore, due to the above-mentioned reasons, the penetration of p-waves into the fruit’s flesh will be maximized if the angle of incidence of the light source θi is θB. Furthermore, having θi = θB minimizes the interference caused by reflections from the fruit’s skin.

2.3.1. Light Source, LENS and Polarizer

A 20-watt Osram halogen lamp was used as the light source and a lens (Thorlabs S-LAH64, AL1512, 500–2000 nm) was set up in front of the light source to focus its light rays. The light was then passed through an Edmund IR polarizer (#47-327, 650–1700 nm) and the polarized light beams were then passed through an NIR bandpass filter to obtain a narrow band of NIR light in the subsequent experiments.

2.3.2. NIR Bandpass Filter

The NIR bandpass filters were selected according to the range of wavelengths that correspond to the second overtone absorptions of OH and CH2 groups in vitamin C (1000–1650 nm) to create several narrow bands of wavelengths to probe the optical characteristics of the Indian jujube fruit flesh, using an NIR photodetector. The specifications of each NIR bandpass filter are shown in Table 2.

2.3.3. Photodetector

Our system was equipped with a Thorlabs PDA50B2 NIR photodetector (spectral range: 800–1800 nm), which has a Ge photodiode with a surface area of 19.6 mm2 and a spectral range that encompasses the aforementioned range of wavelengths (min: 1050 nm, max: 1650 nm). Additionally, this NIR photodetector contains a high-gain amplification circuit.

2.3.4. Signal Processing Module

The signal processing module comprises four parts—five switches, a lowpass filter, a signal amplifier and a microcontroller. The switches (Vishay IRF530, Malvern, PA, USA) were connected to a Direct current (DC) power supply (Agilent E3464A, Santa Clara, CA, USA) and the aforementioned light source and disc-shaped bandpass filter holder. A microcontroller (ATMEL MEGA328P, Microchip Corporation, San Jose, CA, USA) was used to control the state of each switch (open or close) and the bandpass filter holder. Once the NIR photodetector receives the light reflected by the fruit’s flesh, this light is converted into an electrical voltage signal. A low-pass filter is used to eliminate high-frequency noise while a signal amplifier (LM324, Texas Instruments, Dallas, TX, USA) amplifies the signal. The microcontroller then samples the signal, performs an analog-to-digital conversion and packages the data into a readable format before sending the data to an external computer via a communication interface. LabVIEW is then used to perform the necessary numerical computations to calculate r p 2 and RMSEP and store the data.

2.4. Angle of Incidence and Polarization for Measuring Vitamin C Content of Indian Jujube

In this study, the reflectance of the Indian jujube fruits was calculated from the total reflectance (Rtotal) of the incident light. Rtotal is the sum of reflections from the fruit’s skin (Rsurface) and backscattered light (Rbackscatter), as shown in Equation (1). Based on Equation (2), the backscattered light is the multiplicative product of the absorption coefficient (µa), backscatter coefficient (µs) and transmittance (T) of the Indian jujube fruit’s flesh. As µa and µs are constants, the backscatter is directly proportional to T.
R total = R surface + R backscatter
R backscatter = T μ a μ s .
Based on Equations (1) and (2), one may surmise that increasing the transmittance of the fruit’s flesh will increase the intensity of the backscattered light, thus improving the accuracy of the measurements. According to Fresnel’s law, the reflectance of p-waves (Rp) is related to their transmittance (Tp) by Equations (3) and (4) [19]. If the p-waves encounter a boundary between two media (i.e., the boundary between medium 1 and medium 2, whose refractive indices are n1 and n2, respectively) and the angle of incidence (θi) on medium 2 is arctan (n2/n1), then θB, Rp will be minimized while Tp will be maximized. By reducing the interfacial reflection between n1 and n2 to the minimum (Rp = 0), the reflectance signal from the fruit’s skin will be reduced to the minimum; the vibrational absorptions of chemical bonds within the fruit’s flesh (including those of its vitamin C contents) will then manifest in the reflectance signal captured by the NIR photodetector.
R p = ( n 2 cos θ i n 1 cos θ t n 2 cos θ i + n 1 cos θ t ) 2 .
T p = 1 R p

2.5. Calibration of Detection System and Construction of a Predictive Algorithm Model

The following procedure was used to construct a predictive model for the vitamin C contents of the calibration set:
Step 1—Nondestructive measurement of the reflectance of Indian jujube fruit flesh. The calibration set consisted of 120 Indian jujube samples and the light emitted by the halogen light source was parallel-polarized and bandpass-filtered before being projected onto the flesh and skin of these samples at θi = θB. Subsequently, the NIR photodetector captured the light reflected by each sample at each wavelength. The resulting electrical voltage signal was sampled and converted by the signal processing module before being sent to a computer to compute the total reflected light intensity and Rtotal.
Step 2—The vitamin C content of Indian jujube is its ascorbic acid (AA) content. The flesh of each Indian jujube fruit was juiced and filtered to produce an extract for HPLC analysis such that its AA content can be measured. The HPLC system was a Hitachi model L-2000 liquid chromatograph equipped with a Hitachi L-2420 UV-vis detector (set to 254 nm) and a Hitachi D-2500 data processor. Chromatography was performed with a LiChroCART 250-4 LiChrospher 100 RP-18e (5 μm) column. The isocratic mobile phase consisted of 1.55 mL 0.5 M tetrabutylammonium hydroxide, 30 mL of methanol and 970 mL of 0.01 M potassium dihydrogen phosphate (pH 4.0). The flow rate was 1.0 mL/min [20].
The test solution was diluted to 1/5 with 1% metaphosphoric acid immediately before use and 10 μL of the diluted sample was injected into the column. The chromatographic peak that corresponds to AA can be determined by comparing its retention time to that of a standard. Hence, co-chromatography was performed with a standard solution of AA and the sample. To verify the presence of interfering substances in the AA chromatographic peak, peak purity was tested by pretreating the fruit extract with 1 unit/mL of L-ascorbate oxidase at 20 °C. A calibration curve was prepared using standard AA solutions to determine the relationship between peak area and AA concentration.
The AA concentration in the fruit was calculated in mg/100 g fresh weight (FW), according to the following equation [21]:
AA F = AA E ( 10 W / 100 + 20 ) 100 / 10 = AA E ( W + 200 ) ,
where AAF is the AA concentration in the fruit (mg/100 g FW), AAE is the AA concentration in the undiluted extract (mg/mL) and W is the water content (%).
Step 3—Calculation of the correlation coefficient of calibration ( r c 2 ) and root-mean-square error of calibration (RMSEC). The PLS algorithm in the SmartPLS 3 (Hamburg, Germany) software was used to calculate the r c 2 and RMSEC between the reflectance of each wavelength and the actual vitamin C content of the Indian jujube fruits. The criterion for the latent variable setting in PLS should be stop in 10−5.
The reflectance of each wavelength combination were then matched with the actual vitamin C values of the fruits in the calibration set to construct a predictive model for the fruits’ vitamin C content. The r c 2 and RMSEC of the model for the calibration set were calculated using Equations (6) and (7), respectively.
r c 2 = i = 1 n c ( y pi y mi ) 2 i = 1 n c ( y pi y mean ) 2
RMSEC = i = 1 n c ( y pi y mi ) 2 n c .
In these equations, n c is the number of test samples in the calibration set, y pi is the vitamin C predicted with nondestructive testing, y mi is the vitamin C measured with destructive testing and y mean is the mean vitamin C of the calibration set.

2.6. Predictions by the Detection System and Verification of the Predictive Algorithm Model

The vitamin C values of the prediction set were predicted using the optimal combination of parallel-polarized wavelengths for the calibration set. First, nondestructive measurements were performed on the 60 Indian jujube samples of the prediction set to obtain the reflectance of each wavelength in these samples. The predictive model that was established based on the calibration set was then used to predict the vitamin C content of each Indian jujube sample. Next, HPLC analysis was performed to obtain the actual vitamin C value of each sample. The r p 2 and RMSEP values of the predictive model for the prediction set were calculated using Equations (8) and (9).
r p 2 = i = 1 n p ( y pi y mi ) 2 i = 1 n p ( y pi y mean ) 2
RMSEP = i = 1 n p ( y pi y mi ) 2 n p .
In these equations, n p is the number of test samples in the prediction set, y pi is the Vitamin C predicted with nondestructive testing, y mi is the Vitamin C measured with destructive testing and y mean is the mean Vitamin C of the prediction set.

3. Results

3.1. Distribution of Rtotal Values for p-Waves Incident at θB

Based on the equation that relates Brix to the refractive index (n), which was provided by the International Commission for Uniform Methods of Sugar Analysis [22], an SSC of 14° Brix corresponds to n = 1.354. Therefore, the refractive index of medium 1 and medium 2 are n1 = 1.000 and n2 = 1.354, respectively. According to Fresnel’s law of reflection, the angle of incidence that minimizes Rp (i.e., θB) is 53.55°. Because the thickness of the skin of Indian jujube is only 0.1–0.15 mm and 700–1600 nm light is known to penetrate 3–4 mm of fruit flesh [23], it may be assumed that the skin’s influence on reflectance is negligible and that all of the NIR light had penetrated into the fruits’ flesh.
P-waves and unpolarized light were used to probe the reflectance of Indian jujube fruits, with the angle of incidence being θB. The resulting Rtotal values were then recorded. When these measurements are performed with p-waves and an angle of incidence of θB = 53.55°, Rsurface will be minimized (according to Fresnel’s law, Rp = 0 and Tp = 1), as shown in Figure 3. Therefore, all of the light will penetrate into the flesh of the Indian jujube fruits, thus maximizing the absorption of incident light by chemical bonds within the fruit, which will manifest in the reflectance signal measured by the NIR photodetector.
To confirm that polarization affects transmittance, we examined whether Rtotal changed with the polarization of the light source while maintaining the angle of incidence at θB. Indian jujube fruits with the same SSC (SSC = 14° Brix) were used in this experiment and Rtotal was measured using p-waves and nonpolarized waves, 30 times each.
The resulting Rtotal values are shown in Figure 4a,b, which show that the nonpolarized waves and parallel-polarized waves resulted in Rtotal values of 0.42–0.67 and 0.47–0.57, respectively (all Rtotal values have been normalized). Because the Rtotal values that were obtained with p-waves are less scattered than those obtained with unpolarized waves, one may conclude that the use of p-waves at θi = θB can effectively reduce the interference caused by reflections from the Indian jujube fruits’ skin.

3.2. Correlation between the Vitamin C Contents of the Calibration Set and the Reflectances of the Characteristic Wavelength Combinations

In the following experiment, the vitamin C content of Indian jujube was measured using a variety of wavelengths that were obtained using NIR bandpass filters. The r c 2 and RMSEC values of each wavelength with p-waves and nonpolarized waves are shown in Table 3.
As shown in Table 3, the errors of the predictions based on p-waves are generally lower than those of nonpolarized waves. Hence, it may be inferred that the use of p-waves can effectively suppress the influence of surface reflections from the samples, which increases the strength of OH and CH2 absorptions in the reflectance signal, thus improving accuracy and reducing the RMSEC [16,17].
Wavelengths whose reflectances correlate most strongly with the vitamin C contents of Indian jujube are 1200, 1400 and 1450 nm. This indicates that the chemical bonds of vitamin C absorb most significantly at these wavelengths, which resulted in high r c 2 values. The 1300, 1350 and 1650 nm wavelengths correlate more poorly with vitamin C content; this is because the chemical bonds of vitamin C do not absorb significantly at these wavelengths, thus resulting in low r c 2 values.
Characteristic wavelengths that have the largest correlation coefficients were selected to form combinations of wavelengths and were then used to determine the vitamin C content of Indian jujube. Once the reflectance signals at these wavelengths were acquired by the NIR photodetector, the PLS algorithm was used to quantify the vitamin C content of each fruit. The correlation of each wavelength combination was then calculated. The r c 2 and RMSEC values of each wavelength combination (which comprises the most strongly correlated wavelengths) are shown in Table 4.
The results of the PLS calculations indicate that the r c 2 and RMSEC of combination A were 0.86 and 1.44 mg/100 g, respectively. Combinations B and C (N = 4) resulted in r c 2 of 0.87 and 0.86, respectively, as well as RMSEC values of 1.39 mg/100 g and 1.42 mg/100 g, respectively. Although combinations B and C have similar r c 2 values, the RMSEC of combination B was slightly lower. Therefore, another wavelength was added to combination B to form five-wavelength combinations (N = 5). Among combinations D, E and F (N = 5), D has the highest r c 2 ( r c 2 = 0.89) and lowest RMSEC (1.31 mg/100 g). Because the correlation of 1600 nm with vitamin C content is rather low ( r c 2 = 0.55), the inclusion of this wavelength failed to enhance the accuracy of combination E and F. Another wavelength was added to combination D to form N = 6 combinations, thus forming combinations G, H and I, which all have slightly higher r c 2 values than the N = 5 combinations. However, upon further analysis, it was discovered that the r c 2 and RMSEC values of the N = 6 combinations were slightly better than those of the N = 5 combinations. We speculate that this is because the r c 2 values of 1050 nm and 1150 nm are relatively low (0.70 and 0.68, respectively); therefore, the inclusion of these wavelengths in a wavelength combination did not significantly improve the r c 2 of the combination.
The wavelengths of combination D (1200, 1400, 1450, 1500 and 1550 nm) correlated strongly with OH and CH2 absorptions. This result is consistent with the NIR absorptions of OH and CH2 that were observed by López et al. [24], Aenugu et al. [25], Fox et al. [26], Rajan et al. [27] and Bento et al. [28].
Based on these results and the practical requirements of actual detection systems (e.g., size, cost and performance), we decided to use combination D (N = 5) in our detection system, whose r c 2 and RMSEC are 0.89 and 1.31 mg/100 g, respectively. The results obtained using combination D are shown in Figure 5. This combination was then used to measure the vitamin C contents of the prediction set. The corresponding r p 2 and RMSEP values were then calculated.

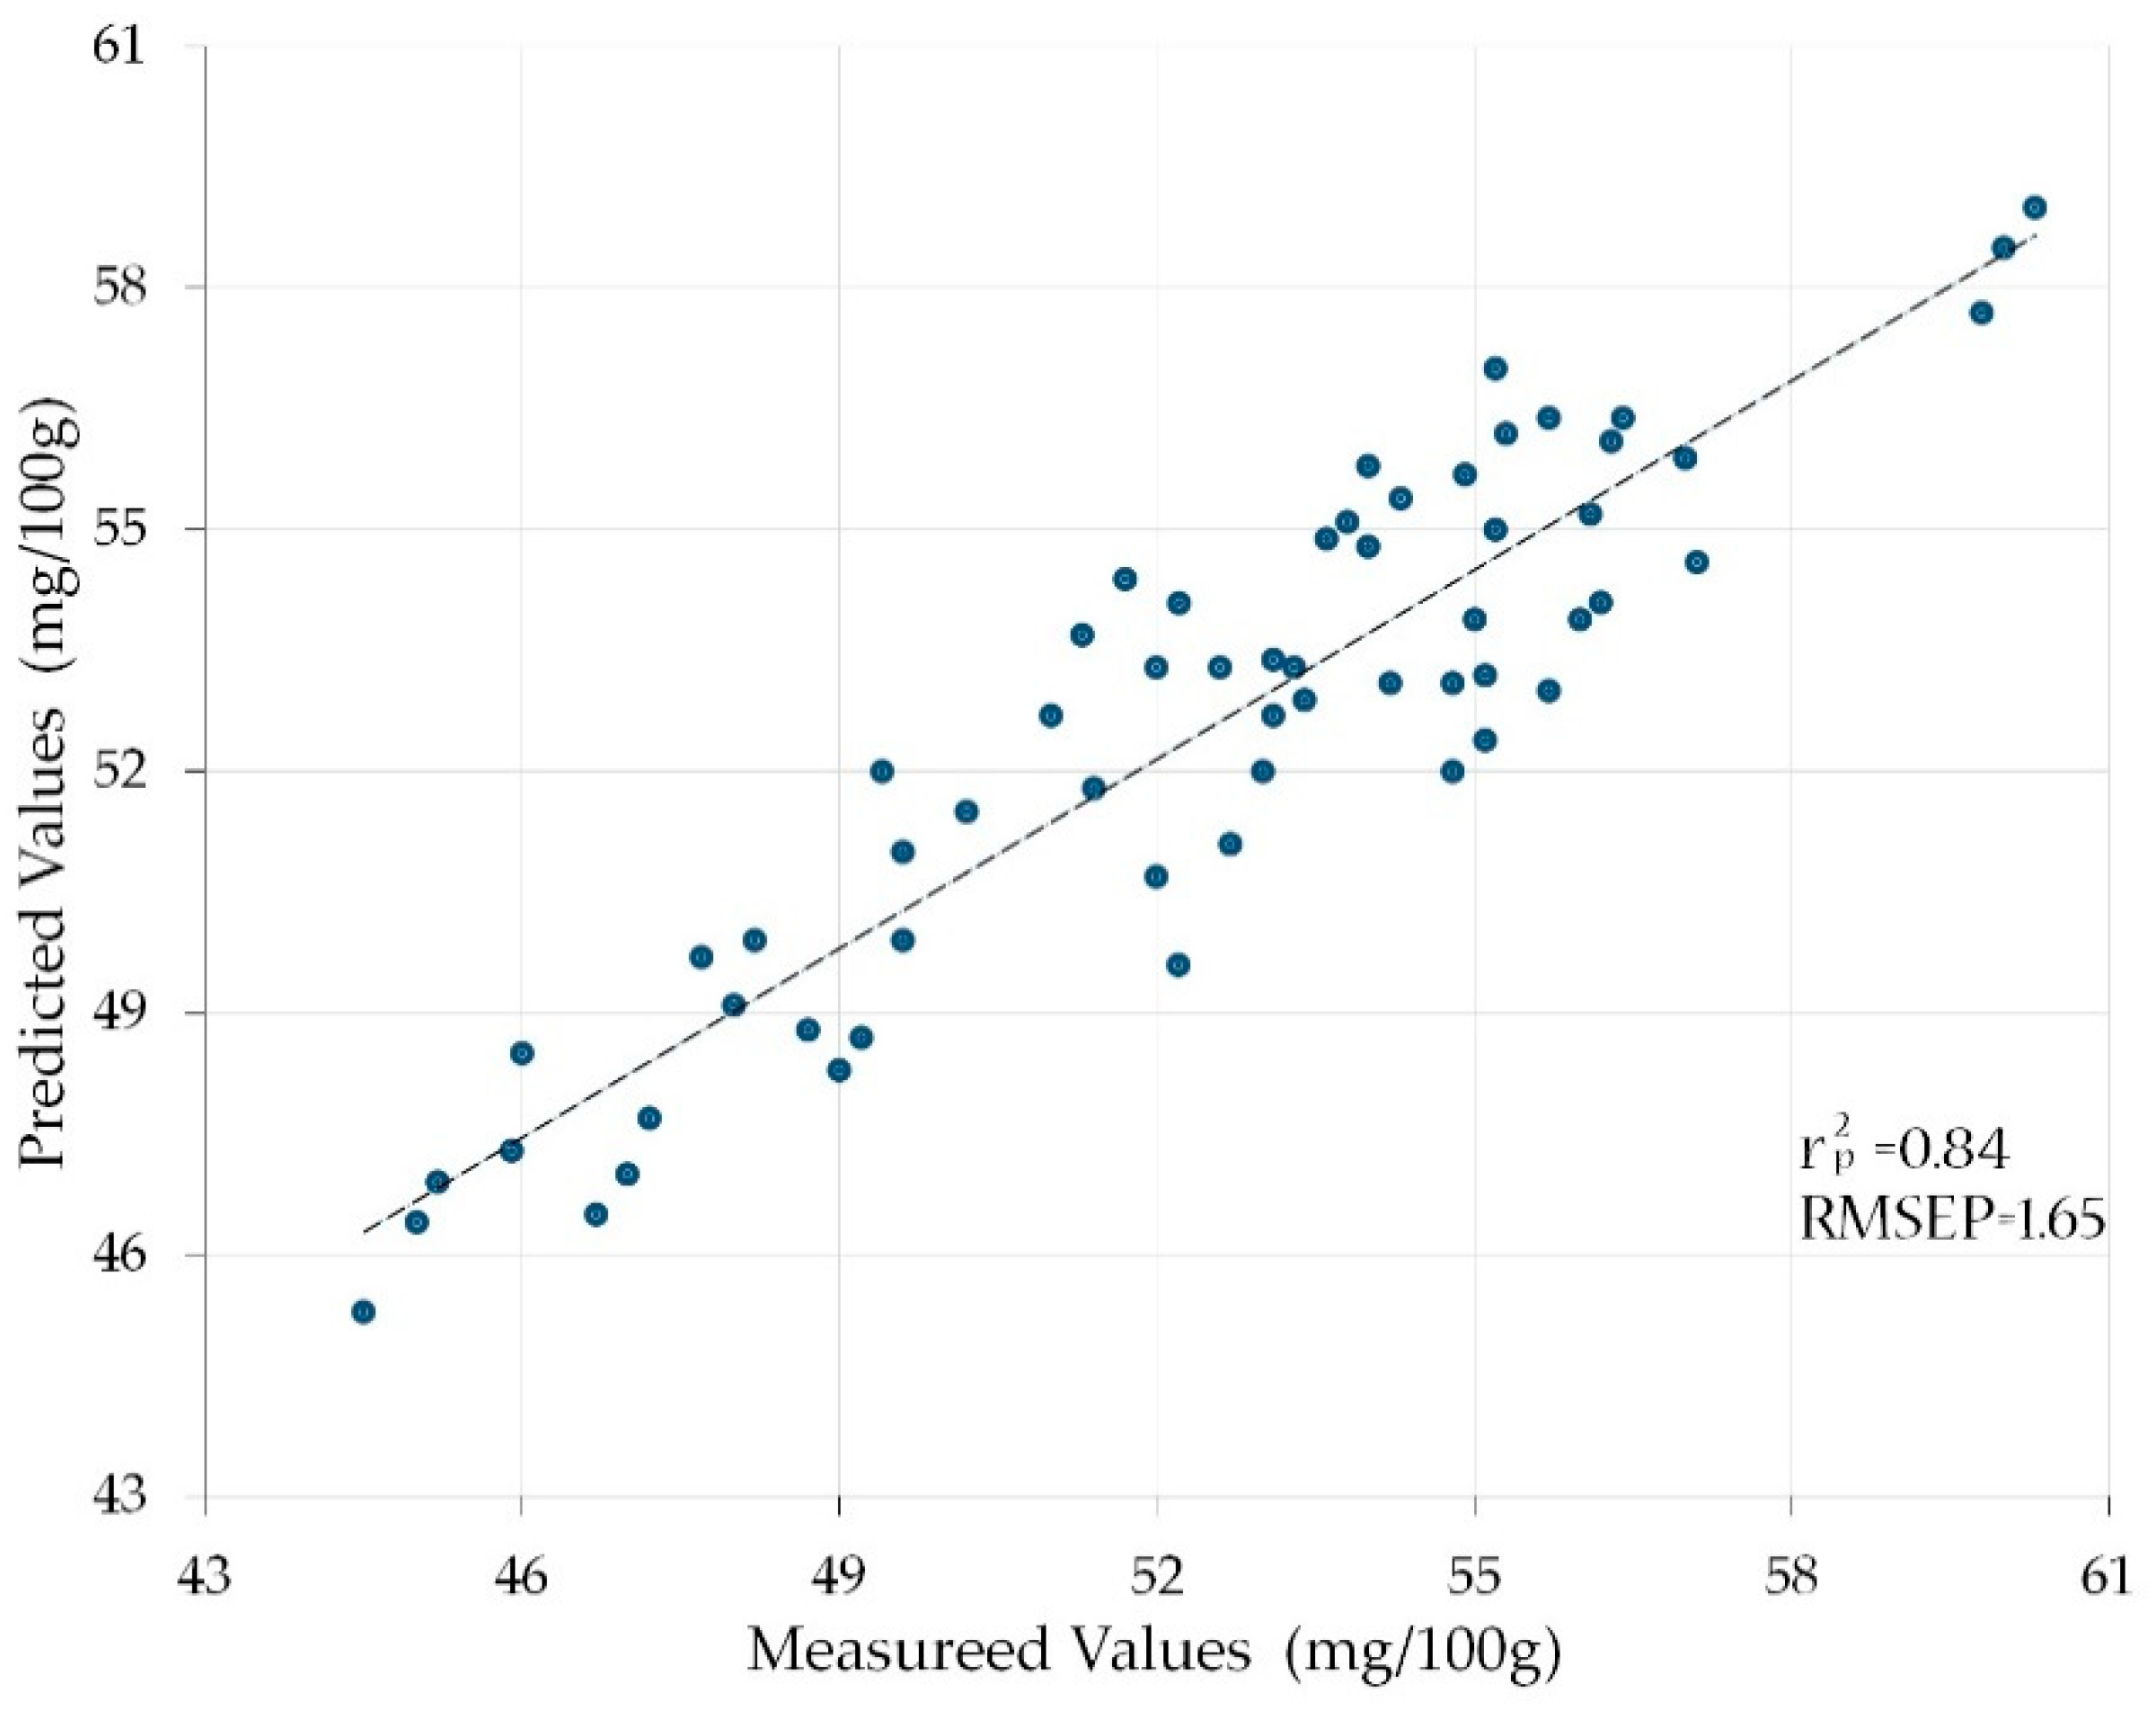
3.3. Analyzing the Predicted Vitamin C Contents of the Prediction Set

Combination D (1200, 1400, 1450, 1500 and 1550 nm), which is the optimal combination of wavelengths for the calibration set, was used to predict the vitamin C contents of the prediction set. After nondestructive measurements and destructive HPLC analysis were performed on the 60 Indian jujube samples of the prediction set, the r p 2 and RMSEP values of the predicted values were calculated, as shown in Table 5. The r p 2 and RMSEP of combination D were are 0.84 and 1.65 mg/100 g for the prediction set, respectively. These values are similar to the r c 2 and RMSEC values of this combination with the calibration set. The correlation between the predicted and measured vitamin C values is illustrated in Figure 6. Here, it is shown that our detection system and predictive model performs excellently and is highly robust, as it has a high r p 2 value and low RMSEP.

4. Discussion

In this study, a parallel-polarized light source and several NIR bandpass filters were combined to predict the vitamin C content of Indian jujube with a combination of wavelengths. The probing wavelengths were designed to be incident on the fruit at θB, to increase r p 2 and reduce RMSEP. The r p 2 and RMSEP values of our detection system were 0.84 and 1.65 mg/100 g, respectively, for the vitamin C contents of Indian jujube fruits in the prediction set. Furthermore, our system is significantly cheaper than currently available portable vitamin C measurement systems, as it simply uses a halogen light source with NIR bandpass filters and an NIR photodetector instead of a costly Fourier transform spectrometer.
The predictive accuracy of our system is equal to or better than that of other NDT systems. For example, r p 2 values of 0.81 and 0.87 were obtained by an FT-NIR-based detection system for the vitamin C content of oranges and kiwifruit, respectively, with RMSEP values of 5.9 mg/100 g and 6.4 mg/100 g, respectively [18,29]. The r p 2 values of a system based on visible NIR spectroscopy in measuring the vitamin C content of carrots and tangerines were 0.72 and 0.82, respectively and the corresponding RMSEP values were 4.3 mg/100 g and 2.3 mg/100 g, respectively [30,31]. Another system that is based on NIR spectroscopy obtained r p 2 values of 0.80 and 0.70 and RMSEP values of 4.0 mg/100 g and 16.0 mg/100 g when measuring the vitamin C contents of apples and infant cereals, respectively [32,33].
In the future, we plan to improve the performance of our system using bandpass filters with special specifications and different full-width half-maxima to improve the quality of the reflectance signals. Furthermore, we will develop a chipset that will perform the necessary numerical analyses and other algorithmic operations such that our system can display the predicted vitamin C value of a fruit without being connected to another computer.

5. Conclusions

In this study, we developed a low-cost, nondestructive fruit testing system based on parallel-polarized NIR light sources, which comprises a halogen lamp, a parallel polarizer, several NIR bandpass filters and an NIR photodetector. The probing wavelengths used in this system are a combination of wavelengths whose reflectances correlate strongly with the vitamin C content of Indian jujube—1200, 1400, 1450, 1500 and 1550 nm. The probing light sources were parallel-polarized and designed to be incident on the fruit’s flesh at θB, which reduced interference from the fruit’s skin and increased the transmittance and backscatter intensity of the incident light. The light reflected by the fruit’s flesh was then collected by an NIR photodetector. This approach increased the accuracy of the vitamin C measurement and reduced errors. The r p 2 and RMSEP of the PLS predictions were 0.84 and 1.65 mg/100 g, respectively.
As compared to current NIR spectroscopy-based nondestructive testing systems, our detection system is small, relatively cheap, consumes little power and has a competitively high r p 2 value while retaining a low RMSEP. The varieties of fruit that can be tested by this detection system could be increased in the future, so that our system can be widely applied in fruit quality inspections.

Author Contributions

Conceptualization, S.-H.H.; methodology, S.-H.H., P.H.; validation, S.-H.H., H.-C.H.; data curation, S.-H.H., H.-C.H.; writing—original draft preparation, S.-H.H.; writing—review and editing, S.-H.H., P.H.; funding acquisition, P.H.

Funding

This work was supported by the Ministry of Science and Technology (MOST) of Taiwan under contract number MOST 107-2221-E-005-059-MY3 and in part by the National Chung Hsing University, Taiwan.

Conflicts of Interest

The authors declare no conflict of interest.

References

  1. Gorton, H.C.; Javis, K. The effectiveness of vitamin C in preventing and relieving the symptoms of virus-induced respiratory infections. J. Manip. Physiol. Ther. 1999, 22, 530–533. [Google Scholar] [CrossRef]
  2. Mattila, P.H.; Hellström, J.; McDougall, G.; Dobson, G.; Pihlava, J.M.; Tiirikka, T.; Stewart, D.; Karjalainen, R. Polyphenol and vitamin C contents in European commercial blackcurrant juice products. Food Chem. 2011, 127, 1216–1223. [Google Scholar] [CrossRef] [PubMed]
  3. Nicolaı, B.M.; Beullens, K.; Bobelyn, E. Nondestructive measurement of fruit and vegetable quality by means of NIR spectroscopy: A review. Postharvest Biol. Technol. 2007, 46, 99–118. [Google Scholar]
  4. McGlone, V.A.; Kawano, S. Firmness, dry-matter and soluble-solids assessment of postharvest Kiwifruit by NIR spectroscopy. Postharvest Biol. Technol. 1998, 13, 131–141. [Google Scholar] [CrossRef]
  5. Alander, J.T.; Bochko, V.; Martinkauppi, B.; Saranwong, S.; Mantere, T. A review of optical nondestructive visual and near-infrared methods for food quality and safety. Int. J. Spectrosc. 2013, 2013, 341402. [Google Scholar] [CrossRef]
  6. Fu, X.; Ying, Y.; Lu, H.; Yu, H.; Liu, Y. Evaluation of vitamin C content in kiwifruit by diffuse reflectance FT-NIR spectroscopy. Proc. SPIE Opt. Sens. Sens. Syst. Nat. Resour. Food Saf. Qual. 2005, 5996, 1–10. [Google Scholar] [CrossRef]
  7. Xia, J.; Li, P.; Li, X.; Wang, W.; Ding, X. Effect of different pretreatment method of nondestructive measure vitamin C content of umbilical orange with near-infrared spectroscopy. Trans. CSAM 2007, 38, 107–111. [Google Scholar]
  8. Xia, J.; Li, X.; Li, P.; Wang, W.; Ding, X. Approach to nondestructive measurement of vitamin c content of orange with near-infrared spectroscopy treated by wavelet transform. Trans. CSAE 2007, 23, 170–174. [Google Scholar]
  9. Peiris, K.H.S.; Dull, G.G.; Leffler, R.G. Near-infrared spectrometric method for nondestructive determination of soluble solids content of peaches. J. Am. Soc. Hortic. Sci. 1998, 123, 898–905. [Google Scholar] [CrossRef] [Green Version]
  10. Elmasry, G.; Wang, N.; Elsayed, A. Hyperspectral imaging for nondestructive determination of some quality attributes for strawberry. J. Food Eng. 2007, 81, 98–107. [Google Scholar] [CrossRef]
  11. Jaiswal, P.; Jha, S.N.; Bharadwaj, R. Non-destructive prediction of quality of intact banana using spectroscopy. Sci. Hortic. 2012, 135, 14–22. [Google Scholar] [CrossRef]
  12. Yang, H.; Irudayaraj, J. Rapid determination of vitamin C by NIR, MIR and FT-Raman techniques. J. Pharm. Pharmacol. 2002, 54, 1247–1255. [Google Scholar] [CrossRef] [PubMed]
  13. Liao, Y.B.; Huang, L.S.; Chen, X.L.; Liao, L. Rapid quantification of vitamin C in navel oranges by near-infrared diffuse reflectance spectroscopy. Appl. Mech. Mater. 2014, 602, 1534–1537. [Google Scholar] [CrossRef]
  14. Qing, Z.S.; Ji, B.P.; Zude, M. Wavelength selection for predicting physicochemical properties of apple fruit based on near-infrared spectroscopy. J. Food Qual. 2007, 30, 511–526. [Google Scholar] [CrossRef]
  15. Zude, M.; Herold, B.; Roger, J.M. Non-destructive tests on the prediction of apple fruit flesh firmness and soluble solids content on tree and in shelf life. J. Food Eng. 2006, 77, 254–260. [Google Scholar] [CrossRef]
  16. Sutherland, G.B.B.M.; Jones, A.V. Use of polarized radiation in infra-red analysis. Nature 1947, 160, 567–568. [Google Scholar] [CrossRef]
  17. Tsepulin, V.G.; Perchik, A.V.; Tolstoguzov, V.L. Thin film thickness measurement error reduction by wavelength selection in spectrophotometry. J. Phys. Conf. Ser. 2015, 584, 012011. [Google Scholar] [CrossRef]
  18. Magwaza, L.S.; Opara, U.L.; Terry, L.A.; Landahl, S.; Cronje, P.J.; Nieuwoudt, H.H.; Hanssense, A.; SaeyseBart, W.; Nicolaï, B.M. Evaluation of fourier transform-NIR spectroscopy for integrated external and internal quality assessment of Valencia oranges. J. Food Compos. Anal. 2013, 31, 144–154. [Google Scholar] [CrossRef]
  19. Mack, C.A. Field Guide to Optical Lithography; SPIE Press: Bellingham, WA, USA, 2006. [Google Scholar]
  20. Daood, H.G.; Biacs, P.A.; Dakar, M.A.; Hajdu, F. Ion-pair chromatography and photodiode-array detection of vitamin C and organic acids. J. Chromatogr. Sci. 1994, 32, 481–487. [Google Scholar] [CrossRef]
  21. Nishiyama, I.; Yamashita, Y.; Yamanaka, M.; Shimohashi, A.; Fukuda, T.; Oota, T. Varietal difference in vitamin C content in the fruit of kiwifruit and other Actinidia species. J. Agric. Food Chem. 2004, 52, 5472–5475. [Google Scholar] [CrossRef]
  22. De Whalley, H.C.S. ICUMSA Methods of Sugar Analysis; Elsevier Publishing Company: Amsterdam, The Netherlands, 1964. [Google Scholar]
  23. Lu, R. Nondestructive measurement of firmness and soluble solids content for apple fruit using hyperspectral scattering images. Sens. Instrum. Food Qual. Saf. 2007, 1, 19–27. [Google Scholar] [CrossRef]
  24. López, M.G.; García-González, A.S.; Franco-Robles, E. Carbohydrate analysis by NIRS-Chemometrics. Dev. Near Infrared Spectrosc. 2017, 10, 67208. [Google Scholar]
  25. Aenugu, H.P.R.; Kumar, D.S.; Srisudharson, N.P.; Ghosh, S.; Banji, D. Near infra-red spectroscopy—An overview. Int. J. ChemTech Res. 2011, 3, 825–836. [Google Scholar]
  26. Fox, G.P.; O’Donnell, N.H.; Stewart, P.N.; Gleadow, R.M. Estimating hydrogen cyanide in forage sorghum (Sorghum bicolor) by near-infrared spectroscopy. J. Agric. Food Chem. 2012, 60, 6183–6187. [Google Scholar] [CrossRef]
  27. Rajan, G.; Bhattacharjee, H.; Bedi, S.; Reo, J. Primer on NIR spectroscopy as a PAT tool in the tablet manufacture process. Am. Pharm. Rev. 2010, 13, 128–135. [Google Scholar]
  28. Bento, A.C.; Dias, D.T.; Olenka, L.; Medina, A.N.; Baesso, M.L. On the application of the photoacoustic methods for the determination of thermo-optical properties of polymers. Braz. J. Phys. 2002, 32, 483–494. [Google Scholar] [CrossRef]
  29. Ciccoritti, R.; Paliotta, M.; Amoriello, T.; Carbone, K. FT-NIR spectroscopy and multivariate classification strategies for the postharvest quality of green-fleshed kiwifruit varieties. Sci. Hortic. 2019, 257, 108622. [Google Scholar] [CrossRef]
  30. Rady, A.; Sugiharto, S.; Adedeji, A.A. Evaluation of carrot quality using visible-near infrared spectroscopy and multivariate analysis. J. Food Res. 2018, 7, 80–93. [Google Scholar] [CrossRef]
  31. Sun, X.; Chen, X.; Liu, Y.; Gao, B. Vis-NIR measurement of vitamin C in mandarin by PLS regression and wavelength selection. Adv. Biomed. Photonics Imaging 2008, 114–119. [Google Scholar] [CrossRef]
  32. Pissard, A.; Fernández Pierna, J.A.; Baeten, V.; Sinnaeve, G.; Lognay, G.; Mouteau, A.; Dupont, P.; Rondia, A.; Lateur, M. Non-destructive measurement of vitamin C, total polyphenol and sugar content in apples using near-infrared spectroscopy. J. Sci. Food Agric. 2013, 93, 238–244. [Google Scholar] [CrossRef]
  33. Volery, P.; Nzabonimpa, R.; Bessas, N. Quantitative determination of vitamin C at sub-percent level in infant cereals by NIR spectroscopy. In Near Infrared Spectroscopy: Proceedings of the 11th International Conference; NIR Publications: Chichester, UK, 2004. [Google Scholar]
Figure 1. The experimental procedures of this study.
Applsci 09 05317 g001
Figure 2. (a) System diagram and (b) Schematic of the light path of p-wave light source.
Applsci 09 05317 g002
Figure 3. Transmittance and reflectance of p-waves at each angle of incidence.
Applsci 09 05317 g003
Figure 4. Comparison between the total reflection (Rtotal) of (a) non-polarized waves (NP) and (b) parallel-polarized waves (p-waves).
Applsci 09 05317 g004
Figure 5. Predicted and measured vitamin C values of the calibration set.
Applsci 09 05317 g005
Figure 6. Correlation between the predicted and measured values of the prediction set.
Applsci 09 05317 g006
Table 1. Statistics of the weight and vitamin C of Indian jujube.
Calibration Set (120 Samples)Prediction Set (60 Samples)
MinMaxMeanS.D.MinMaxMeanS.D.
Weight (g)1201671455.81161551406.5
Vitamin C (mg/100 g)4560532.54560522.3
S.D.: Standard Deviation.
Table 2. Specifications of the near infrared (NIR) bandpass filters.
ItemWavelength (nm)Part No.Full Width at Half Maximum Manufacturer
11050FB1050-10±10 nmThorlabs
21100FB1100-10±10 nmThorlabs
31150FB1150-10±10 nmThorlabs
41200FB1200-10±10 nmThorlabs
51250FB1250-10±10 nmThorlabs
61300FB1300-12±12 nmThorlabs
71350FB1350-12±12 nmThorlabs
81400FB1400-12±12 nmThorlabs
91450FB1450-12±12 nmThorlabs
101500FB1500-12±12 nmThorlabs
111550FB1550-12±12 nmThorlabs
121600FB1600-12±12 nmThorlabs
131650FB1650-12±12 nmThorlabs
Table 3. Root-Mean-Square Error of Calibration (RMSEC) and Coefficient of Calibration ( r c 2 ) of the vitamin C contents predicted by each wavelength with parallel-polarized waves and nonpolarized waves.
Wavelength (nm)Nonpolarized WaveParallel-Polarized Wave
Coefficient of Calibration ( r c 2 ) Root-Mean-Square Error of Calibration (RMSEC) (mg/100 g)Coefficient of Calibration ( r c 2 ) Root-Mean-Square Error of Calibration (RMSEC) (mg/100 g)
10500.653.070.702.10
11000.523.280.582.49
11500.643.140.682.17
12000.793.020.851.49
12500.553.370.612.39
13000.543.140.592.46
13500.573.090.642.30
14000.803.070861.43
14500.783.120.831.58
15000.743.150.781.80
15500.773.060.811.67
16000.733.090.761.88
16500.553.280.602.43
Table 4. Coefficient of calibration ( r c 2 ) and Root-Mean-Square Error of Calibration (RMSEC) values of each wavelength combination with respect to the actual vitamin C contents of Indian jujube fruits.
Wavelength Combinations (nm)Coefficient of Calibration ( r c 2 ) Root-Mean-Square Error of Calibration (RMSEC) (mg/100 g)
AN = 31200, 1400, 14500.861.44
BN = 41200, 1400, 1450, 15000.871.39
CN = 41200, 1400, 1450, 15500.861.42
DN = 51200, 1400, 1450, 1500, 15500.891.31
EN = 51200, 1400, 1450, 1500, 16000.881.34
FN = 51200, 1400, 1450, 1550, 16000.881.32
GN = 61150, 1200, 1400, 1450, 1500, 15500.901.33
HN = 61050, 1200, 1400, 1450, 1500, 15500.911.32
IN = 61200, 1400, 1450, 1500, 1550, 16000.921.30
Table 5. Coefficient of Prediction ( r p 2 ) and Root-Mean-Square Error of Prediction (RMSEP) of vitamin C.
Wavelengths CombinationPrediction Set
Coefficient of Prediction ( r p 2 ) Root-Mean-Square Error of Prediction (RMSEP) (mg/100 g)
DN = 51200, 1400, 1450, 1500, 1550 nm0.841.65

