Article

Optimizing the Spectral Characterisation of a CMYK Printer with Embedded CMY Printer Modelling

1
School of Printing and Packaging, Wuhan University, Wuhan 430079, China
2
Shen Zhen Research Institute, Wuhan University, Shenzhen 518000, China
3
School of Design, University of Leeds, Leeds LS2 9JT, UK
4
State Key Laboratory of Modern Optical Instrumentation, Zhejiang University, Hangzhou 310058, China
*
Author to whom correspondence should be addressed.
Appl. Sci. 2019, 9(24), 5308; https://doi.org/10.3390/app9245308
Submission received: 16 November 2019 / Revised: 29 November 2019 / Accepted: 3 December 2019 / Published: 5 December 2019
(This article belongs to the Special Issue Digital Transformation in Manufacturing Industry)

Abstract

:
In the digital printing process, reliable colour reproduction is commonly achieved by printer characterisation, which defines the correspondence between the input device control values and the output colour information. The cellular Yule–Nielsen spectral Neugebauer model, together with its variants, is widely adopted in this topic because of its superb colorimetric and spectral accuracy. However, it seems that current studies have neglected an inconspicuous defect in such models when characterising printers equipped with black ink. That is, the cellular structure of these models overemphasises the sampling for dark-tone colours, and thus leads to relatively large errors in light tones. In this paper, taking a CMYK printer as an example, a simple and effective solution is proposed with no need of extra sampling. With the aid of a newly built cellular spectral Neugebauer model for the embedded CMY printer, this approach optimises the printer characterisation for light tones, slightly improves the precision for middle tones while it maintains the accuracy for dark tones. The performance of the proposed method was evaluated with regard to three different kinds of substrates and the experimental results validated its improvement in spectral printer characterisation.

1. Introduction

Printer characterisation aims to reveal the relationship between the input and the output of the halftone printing process, and thus generates the optimal ink combination for a target colour [1,2,3,4,5,6]. The first half of printer characterisation relates to a forward modelling in which a colour prediction model [7,8,9,10] is set up to predict the printed colours from the device control values (i.e., the dot areas). The second half of printer characterisation, which is termed as a backward process, aims at to invert the forward model by certain optimization algorithms and decomposes the target colour into control values of individual inks such as cyan, magenta, yellow and black (CMYK). Therefore, in several studies such a model is also named as a colour separation model [11,12,13,14]. In addition, since the technical progress in digital imaging has activated the concept of spectral colour reproduction for the reduction of metamerism [15,16,17,18], the studies of printer characterisation have also been extended to the spectral domain [19,20,21].
Many mathematical models have been adopted for forward modelling, which includes a least-squares based polynomial function [22], the Kubelka–Munk model [23], the artificial neural network (ANN) [24], the spectral Neugebauer model [25], etc. Among these models, the cellular Yule–Nielsen spectral Neugebauer (CYNSN) model, together with its variants, is perhaps the most preeminent model due to its intuition and precision [19,20,26,27,28]. Such models calculate the printed reflectance spectrum with a weighted sum of participating Neugebauer-primary spectra and take several influential effects into consideration, such as mechanical and optical dot gain [7]. Moreover, its cellular structure provides many more sub-models and primaries and thus remarkably improves the prediction accuracy.
Mathematically speaking, backward modelling is the inverted implementation of forward models and thus the forward accuracy directly impacts the backward accuracy. That is, one cannot set up a sound separation model unless this prediction model is precise. Until now, several optimization algorithms have been proposed for backward modelling which unexceptionally provide acceptable colour separation performance [11,13,14]. Meanwhile, as for the backward modelling for CYNSN models, specific algorithms are needed to target the optimal subdomain (namely, the optimal cell), as the colour separation process eventually takes place in a defined cellular region [19,21,27].
At present, the high accuracy of the CYNSN-based spectral printer characterisation could be easily achieved by increasing the sampling nodes in the cellular structure. For instance, based on several 7-grid-points CYNSN models, Wang et al. set up a multi-ink printer characterisation workflow and achieved excellent forward and backward modelling accuracy [27,28]. However, in that contribution more than 10,000 colour samples were printed and measured, which is definitely impractical for daily applications. Therefore, several researchers have focused on reducing the amount of modelling samples while maintaining an acceptable precision by using some nonuniformly sampling approaches [29,30]. Unfortunately, it is not easy to apply those nonuniform sampling methods into CYNSN models due to their cellular structures, which actually raise challenges for related studies. According to current studies, to achieve the final colour reproduction accuracy of ¬1 CIE DE2000 unit [31], at least 1000 training samples are needed [19,27,28].
In our recent work, an effective and efficient modelling workflow was proposed which systematically optimised several crucial steps in spectral printer characterisation [19,32,33]. For forward modelling, a backward propagation artificial neural network (BPANN) modified CYNSN model was proposed in order to simulate the nonlinearity between different ink mixtures and the optical dot gain. With the help of such a modification, we could make the performance of a 5-grid point CYNSN model match that of a 6-grid-point CYNSN model, while reducing the modelling samples by more than one quarter. In the backward modelling process, a sequential gamut judging method was raised, which significantly accelerated the optimal cell searching process. Finally, the superiority of the entire workflow was demonstrated by comparing our methods with other typical methods [19].
Basing on our previous workflow, in this paper we further optimised the spectral characterisation of a CMYK printer with the aid of an embedded CMY-printer modelling. Our key insight in this contribution is to improve the printer characterisation in light-tone regions which is limited by the cellular-sampling manner of CYNSN models together with the influence of the black ink. This paper is organised as follows. Section 2 briefly reviews several key procedures of spectral printer characterisation and then introduces our proposed method. Section 3 describes the experimental details while Section 4 discusses the feasibility of our proposed methods based on the experimental results. Finally, Section 5 summarizes the conclusions of the paper.

2. Methodology

In this section, we first describe how to maintain the ink amount within a reasonable level for different substrates, which is of crucial importance for digital colour printing. Then we briefly review the CYNSN-based forward and backward modelling. Finally, the embedded CMY printer modelling approach is introduced.

2.1. Ink Limitation

For different ink combinations, there are always limitations for the maximum total ink amount. When such thresholds are exceeded, the printed artefacts such as ink bleeding and bronzing occur, which significantly deteriorate the print quality. To avoid this, printer manufacturers and colour management software suppliers always provide an embedded ink limitation module in their products, by which users can print some ink limitation ramps and set the ink limits themselves. As for researchers, they tend to develop their own ink limitation algorithms so that the inks can be controlled more thoroughly [11,33,34]. Among current algorithms, the multilinear interpolation method [34] proposed by Urban et al. is typical and it is highly related to CYNSN models. According to this approach, the ink limitation process T ink-limitation could be depicted as Equation (1), in which Ω d e v i c e and Ω ink-limitation respectively, denote the original device-value space and the printable region for a printer equipped with n inks, Φ represents the device control values after ink limitation, Φ t o t a l m a x denotes the maximum total ink amount, a ( i ) is the dot area of the i th Neugebauer primary defined by the Demichel equation [35], g ( i ) defines the control values of the Neugebauer primaries.
T ink-limitation = { Ω d e v i c e Ω ink-limitation Φ = i = 0 2 n 1 a ( i ) min ( Φ t o t a l m a x 1 g ( i ) 1 g ( i ) 1 ,
For instance, for a CM printer whose device control values are respectively denoted as c and m , the Demichel equation could be written as follows, where a ( 0 ) a ( 3 ) represent the four Neugebauer primaries, respectively.
a ( 0 ) = ( 1 c ) ( 1 m ) ;    a ( 1 ) = c ( 1 m ) ; a ( 2 ) = ( 1 c ) m ;    a ( 3 ) = cm ; ,
In addition, in this case g ( i ) in Equation (1) could be defined as
g ( 0 ) = ( 0 , 0 ) ;    g ( 1 ) = ( 1 , 0 ) ; g ( 2 ) = ( 0 , 1 ) ;    g ( 3 ) = ( 1 , 1 ) ; ,
For instance, assumed that the maximum total ink amount Φ t o t a l m a x for the CM printer is (0.6, 0.6), then according to Equation (1) the output for an input value (c, m) = (0.8, 0.7) could be computed as
a ( 0 ) = 0.06 ; min ( Φ total-max 1 , g ( 0 ) 1 ) g ( 0 ) 1 g ( 0 ) = 0 × ( 0 , 0 ) ; a ( 1 ) = 0.24 ; min ( Φ total-max 1 , g ( 1 ) 1 ) g ( 1 ) 1 g ( 1 ) = 1 × ( 0 , 1 ) ; a ( 2 ) = 0.14 ; min ( Φ total-max 1 , g ( 2 ) 1 ) g ( 2 ) 1 g ( 2 ) = 1 × ( 1 , 0 ) ; a ( 3 ) = 0.56 ; min ( Φ total-max 1 , g ( 3 ) 1 ) g ( 3 ) 1 g ( 3 ) = 1.2 2 × ( 1 , 1 ) = ( 0.6 , 0.6 ) ( c , m ) output = 0.06 × ( 0 , 0 ) + 0.24 × ( 0 , 1 ) + 0.14 × ( 1 , 0 ) + 0.56 × ( 0.6 , 0.6 ) = ( 0.476 , 0.576 )
Therefore, in this condition an input value of (c, m) = (0.8, 0.7) will be restricted to (c, m) = (0.476, 0.576) according to the ink limitation algorithm as well as the maximum total ink amount.

2.2. CYNSN-Based Forward Modelling

In general, the plain Yule–Nielsen modified spectral Neugebauer (YNSN) model could be stated as follows,
R ( λ ) = ( i a e f f , i R i ( λ ) 1 n ) n ,
where R ( λ ) is the predicted spectral reflectance at wavelength λ , R i ( λ ) denotes the spectral reflectance of the i th Neugebauer primary, n is an exponent proposed by Yule and Nielsen with the aim of accounting for optical dot gain in the halftone printing process [36,37] and and a e f f represents the effective dot area of each Neugebauer primary, which is defined by the Demichel equation as shown in Equation (2). Note that when calculating a e f f , the original device control values (i.e., the dot areas), c , m and y are replaced with the effective dot area c e f f , m e f f and y e f f respectively so as to compensate for the mechanical dot gain caused by the ink spreading effect [7].
Taking the cyan colorant as an example, the effective dot area c e f f is computed by a least-square method, as shown in Equation (6):
c e f f = ( R ( λ ) R p ( λ ) ) / ( R s ( λ ) R p ( λ ) ) ,
in which R ( λ ) , R p ( λ ) and R s ( λ ) denote the spectral reflectance of the colour sample, the substrate (with a control value of 0), and the solid (with a control value of 1), respectively.
As there are only two control values (0 and 1 in CMYK space) for the YNSN model, for a four-ink printing system only 2 × 2 × 2 × 2 = 16 Neugebauer primaries are adopted in Equation (5) to predict the printed spectrum, which indeed limits the model’s performance. Therefore, to further increase the spectral prediction accuracy, the cellular Yule–Nielsen modified spectral Neugebauer (CYNSN) was derived [38]. According to such a model, the device colour space is uniformly divided into several subdomains (or cells) so that more Neugebauer primaries are generated. For instance, for a five-grid point CYNSN model, there are five sampling nodes (0, 0.25, 0.5, 0.75, and 1) in each ink channel, which results in 5 × 5 × 5 × 5 = 625 colour samples.
The calculating protocol of the CYNSN model is quite similar to that of YNSN model, with the only exception that the original control values should firstly be scaled into a certain subdomain. For instance, for the cyan ink, the scaled control value c c e l l should be computed by Equation (7), where c represent the original control value while c u and c l denote the upper and lower limit of the subdomain, respectively.
c c e l l = ( c c l ) / ( c u c l ) ,
The above-mentioned implementations constitute the main workflow for setting up the CYNSN model. However, as such a model is based on several theoretical assumptions (e.g., it is assumed that the ink spreading and light scattering among different ink mixtures is always consistent), which, in fact, are not perfectly true, it still suffers from several limitations when spectrally characterising a printer. Therefore, to further optimise the performance of the CYNSN model, much effort has been made [19,20,26].
In 2010, Rossier et al. proposed the ink spreading CYNSN model (shortened as IS-CYNSN [26]) which can be considered as an effective modification of the plain CYNSN model. The performance of such a model is actually better, as it not only considers the ink spreading effect for an ink directly printed on the substrate, but also accounts for the condition of such an ink being in superposition with other solid inks. Meanwhile, it should be noticed that to build this IS-CYNSN model, more samples are needed for updating the effective dot area curves.
In a recent work, Sun et al. revisited the optimization of the CYNSN model [20]. However, the accuracy of their CYNSN model was obviously lower than that of other relevant studies [19,26], which we believe is possibly due to insufficient consideration being given to the Yule–Nielsen n value. For relevant works [19,26,27,28], the optimal n value was usually determined by minimizing the average predicting error for several training samples of the CYNSN model. However, in Sun’s work, the n value was defined merely by optimizing the performance of the YNSN model and then it was directly applied to the CYNSN model. Since the light scattering effect (i.e., the optical dot gain) of halftone printing actually varies with the ink superposition conditions, it is quite likely that the optimal n value for the YNSN model will not have the best performance for the CYNSN model.
As discussed above, the Yule–Nielsen n value was proposed to compensate for the optimal dot gain during halftone printing [36]. As it is a measure relating to the light scattering effect in halftone prints, it is easy to infer that the optimal n value should not be consistent among different ink mixtures. From this point of view, a backward propagation artificial neural network (BPANN) approach was proposed in our previous work, with the aim of dynamically predicting the optimal n values for different ink combinations and our experiments showed that the CYNSN model modified by this BPANN approach (shorted as BPn-CYNSN) achieved a sound balance between accuracy and efficiency [19].

2.3. CYNSN-Based Backward Modelling

As mentioned above, backward modelling is the reverse process of forward modelling, which can be expressed as follows,
m i n δ R M S E ( R t , F ( δ ) ) ,
where δ denotes the control values of the printer, R t is the target spectral reflectance to be reproduced, F represents the forward model and R M S E is the root-mean-square error [39] between the predicted and target spectral reflectance. For colorimetric colour reproduction, the RMSE could be substituted by a colour difference metric, such as the CIEDE2000 [31].
Up to now, many algorithms have been proved to be effective in inverting the YNSN model, for instance, the work of Taplin [40], Li and Luo [14], Wang et al. [27], etc. However, since in the CYNSN model the colour separation process eventually takes place in a certain cell, the optimal cell must be targeted before separation. To solve this, one approach is to try every cell to find the best one, which is definitely impractical due to the large number of cells. In 2010, Guo et al. proposed a method which first chose several candidates among all the cells based on the colour difference between the target spectral reflectance and the reflectance of the imaginary cell centre, and then targeted the optimal cell according to the backward modelling accuracy [21]. In our recent work, such a method was optimised by a gamut judging method [19]. In that study, we first divided the printer into several larger subdomains, named supercells, and then adopted that gamut judging method to decide whether or not the target colour was located inside the gamut of those supercells. After that, the candidates containing the target colour were further divided into small cells and the optimal small cell was eventually selected by a similar method of Guo et al., with the only exception that the imaginary middle point reflectance of each cell was predicted by a BPn-CYNSN model, instead of the point-averaging method of Guo et al.

2.4. Embedded CMY Printer Modelling

The separation approaches described above are all based on the backward modelling accuracy (quantified by the difference between target colour and model predicted colour). However, it must be mentioned that such accuracy is actually not the final colour reproduction accuracy (quantified by the difference between target colour and actually printed colour), but only refers to the smallest error between the target and the predicted colour according to a forward model, as shown in Equation (8). Therefore, if the accuracy of the forward model is problematic, it is quite possible that the optimal control values cannot be accurately targeted and thus the final colour reproduction will not be so precise.
For instance, when setting up the CYNSN model (or its variants) for a CMYK printer, a certain number of colour samples are generated in CMYK colour space by uniform sampling (the cellular nodes) and random sampling (the training samples). However, such sampling in CMYK space actually could not lead to uniformly distributed colours in a device independent colour space, such as CIELAB [41], due to the strong light absorption of the black ink. Meanwhile, the overprint of cyan, magenta and yellow may also result in a dark grey colour. Thus, it is obvious that the sampling of a CYNSN model indeed overemphasises the colour sampling in dark tones while relatively neglecting the sampling in light tones. Therefore, it is quite possible that the accuracy of the CYNSN model for the light tones is not as robust as that for the dark tones.
Basing on this consideration, the proposed optimization was developed, as illustrated in Figure 1. The core of our proposed method is an embedded CMY printer modelling, which is simple but effective. That is, a cellular spectral Neugebauer (CSN) model for the embedded CMY colour space was built up, using the existing colour samples whose control values for the black channel were zero.
As we believed, such a CMY-CSN model could also provide better forward modelling performance in the light tones. As no extra training samples were generated with the aim of maintaining modelling efficiency, the Yule–Nielsen n value for this model was uniformly set to 1. Afterwards, two lightness thresholds were empirically defined by which the printer gamut was divided into light tones, middle tones and dark tones. Such thresholds corresponded to the lightness values in CIELAB space (D50/2) of the colour samples with the control values of 0.3 and 0.7 in the cyan, magenta and yellow channel. For instance, for a CMYK printer and a given substrate, if the lightness of the target colour is higher than the lightness of (c = 0.3, m = 0.3, y = 0.3, k = 0), then it locates in the light-tone region; if the lightness of the target colour is lower than the lightness of (c = 0.7, m = 0.7, y = 0.7, k = 0), then it is a dark-tone colour; otherwise, that colour is considered as a middle-tone colour. In the work of Littlewood et al., similar division approach was adopted [24].
In this method, the colour separation protocol is modified as follows. When a target spectral colour is to be reproduced, we first decide which tone it belongs to according to its CIELAB lightness value. If it is a light-tone colour, then the CMY-CSN model is inverted to calculate the device control values; if it is a dark tone colour, then the BPn-CYNSN model for the CMYK printer was inverted. Meanwhile, as for a mid-tone colour, both the CMY model and CMYK model are inverted, and the device values with a better backward modelling accuracy will be finally selected. Such an implementation for the middle tone is intended to avoid the possible colour shift around the threshold regions.

3. Experiments

In the experiment, a Canon IPF 5100 printer equipped with 12 ink sets was employed. Since only the CMYK inks were used, the other ink channels were switched off by the Onyx Production House 10 software, which also enabled us to control the CMYK channels independently. During the test, the printing resolution was set to 2400 × 1200 dpi and a stochastic screening method was adopted for the halftone process. To test the robustness of the proposed approach, three different kinds of substrate were used, including Black Diamond 220 g canvas paper, Canon 170 g glossy photo paper and Pinnacle 245 g water colour paper. An X-Rite i1iSis automated spectrophotometer was employed to obtain the spectral reflectances (from 380 nm to 730 nm in 10 nm intervals) of the printed colours.
In the ink limitation stage, the above mentioned multilinear interpolation method [34] proposed by Urban et al. was adopted. As for each substrate, sixteen 21-level uniformly sampled Neugebauer primary ramps were printed and the maximum total ink amount Φ t o t a l m a x for each ramp, as defined in Equation (1), was determined by visual judgment. Note that we only implemented such ink limitation before sending the device control values to the printer. As for forward and backward modelling, the corresponding original control values ranging from 0 to 1 were used, which is more straightforward and convenient.
To build the forward models, 1111 colour samples were printed and measured, which included four uniformly sampled single-ink ramps for obtaining the effective dot gain curves described in Equation (6) (11 levels each, 44 samples in total), the sampling nodes corresponding to a five-grid point CYNSN model (5 × 5 × 5 × 5 = 625 colour samples) as well as 442 randomly generated colour samples in CMYK space in order to train the model. Three models were built based on these samples for each substrate. For the plain CMYK-CYNSN model, the optimal n value was fitted by minimizing the average prediction error for the 442 training samples, while for the CMYK-BPn-CYNSN model, the 442 training samples were used to fit 442 optimal n values corresponding to each ink combination and thus for training a neural network [19]. The embedded CMY-CSN model was set up based on the existing colour samples whose control values for the black channel were zero (i.e., 3 single-ink ramps for the effective dot gain curves and the sampling nodes corresponding to a five-grid point cellular model with 5 × 5 × 5 = 125 colour samples). As noted above, the Yule–Nielsen n value for this model was uniformly set to 1 since no extra samples were generated to fit the optimal n value for this model. By this setting, we intended to demonstrate that the proposed approach could perform better while maintaining the modelling efficiency.
To test the performance of the forward models, for each substrate 100 colour samples were randomly generated in CMY and CMYK spaces. After printing, the forward modelling accuracy could be obtained by calculating the colour and spectral differences between the predicted reflectances and the printed reflectances.
For backward modelling, 100 in-gamut colours were printed and considered as the targets. The same approach proposed in our previous study [19] was employed to implement the spectral separation, which used a sequential gamut judging method to target the optimal cell and a sequential quadratic programming algorithm [42] to invert the forward model in the subdomain. Afterwards, the final reproduction accuracy was obtained by computing the colour and spectral difference between the printed and target reflectances. Note that no out-gamut colours were adopted, as for such colours the true characterisation accuracy would be masked by the errors introduced by gamut mapping. In addition, to avoid the above-mentioned oversampling problem in dark tones, a moderate modification was implemented. That is, we randomly generated 50 samples both in CMY and CMYK colour spaces and printed those 100 colours through an ICC workflow [43] provided by the Onyx software. As that ICC workflow had its own mechanism for colour transformation, we were blind to the exact control values sent to the printer but could guarantee that the colours it generated indeed located inside the gamut. Additionally, as the majority of the colour samples in CMY space located in light and middle tones, such a setting made the sampling more uniform in CIELAB colour space.

4. Results and Discussion

Table 1 reveals the maximum total ink amount for the 16 Neugebauer Primary Ramps, as defined in Equation (1), where canvas, glossy and water colour, respectively, refer to the Black Diamond 220 g canvas paper, the Canon 170 g glossy photo paper and the Pinnacle 245 g water colour paper.
From this table, it is clear to see that the glossy paper could hold the most ink while the water colour paper held the least ink. Since the spectral reflectances of these three substrates do not vary significantly, the gamut of those substrates is mainly dependent on the maximum ink amounts. Therefore, the glossy paper exhibits the largest gamut while the water colour paper exhibits the smallest gamut.
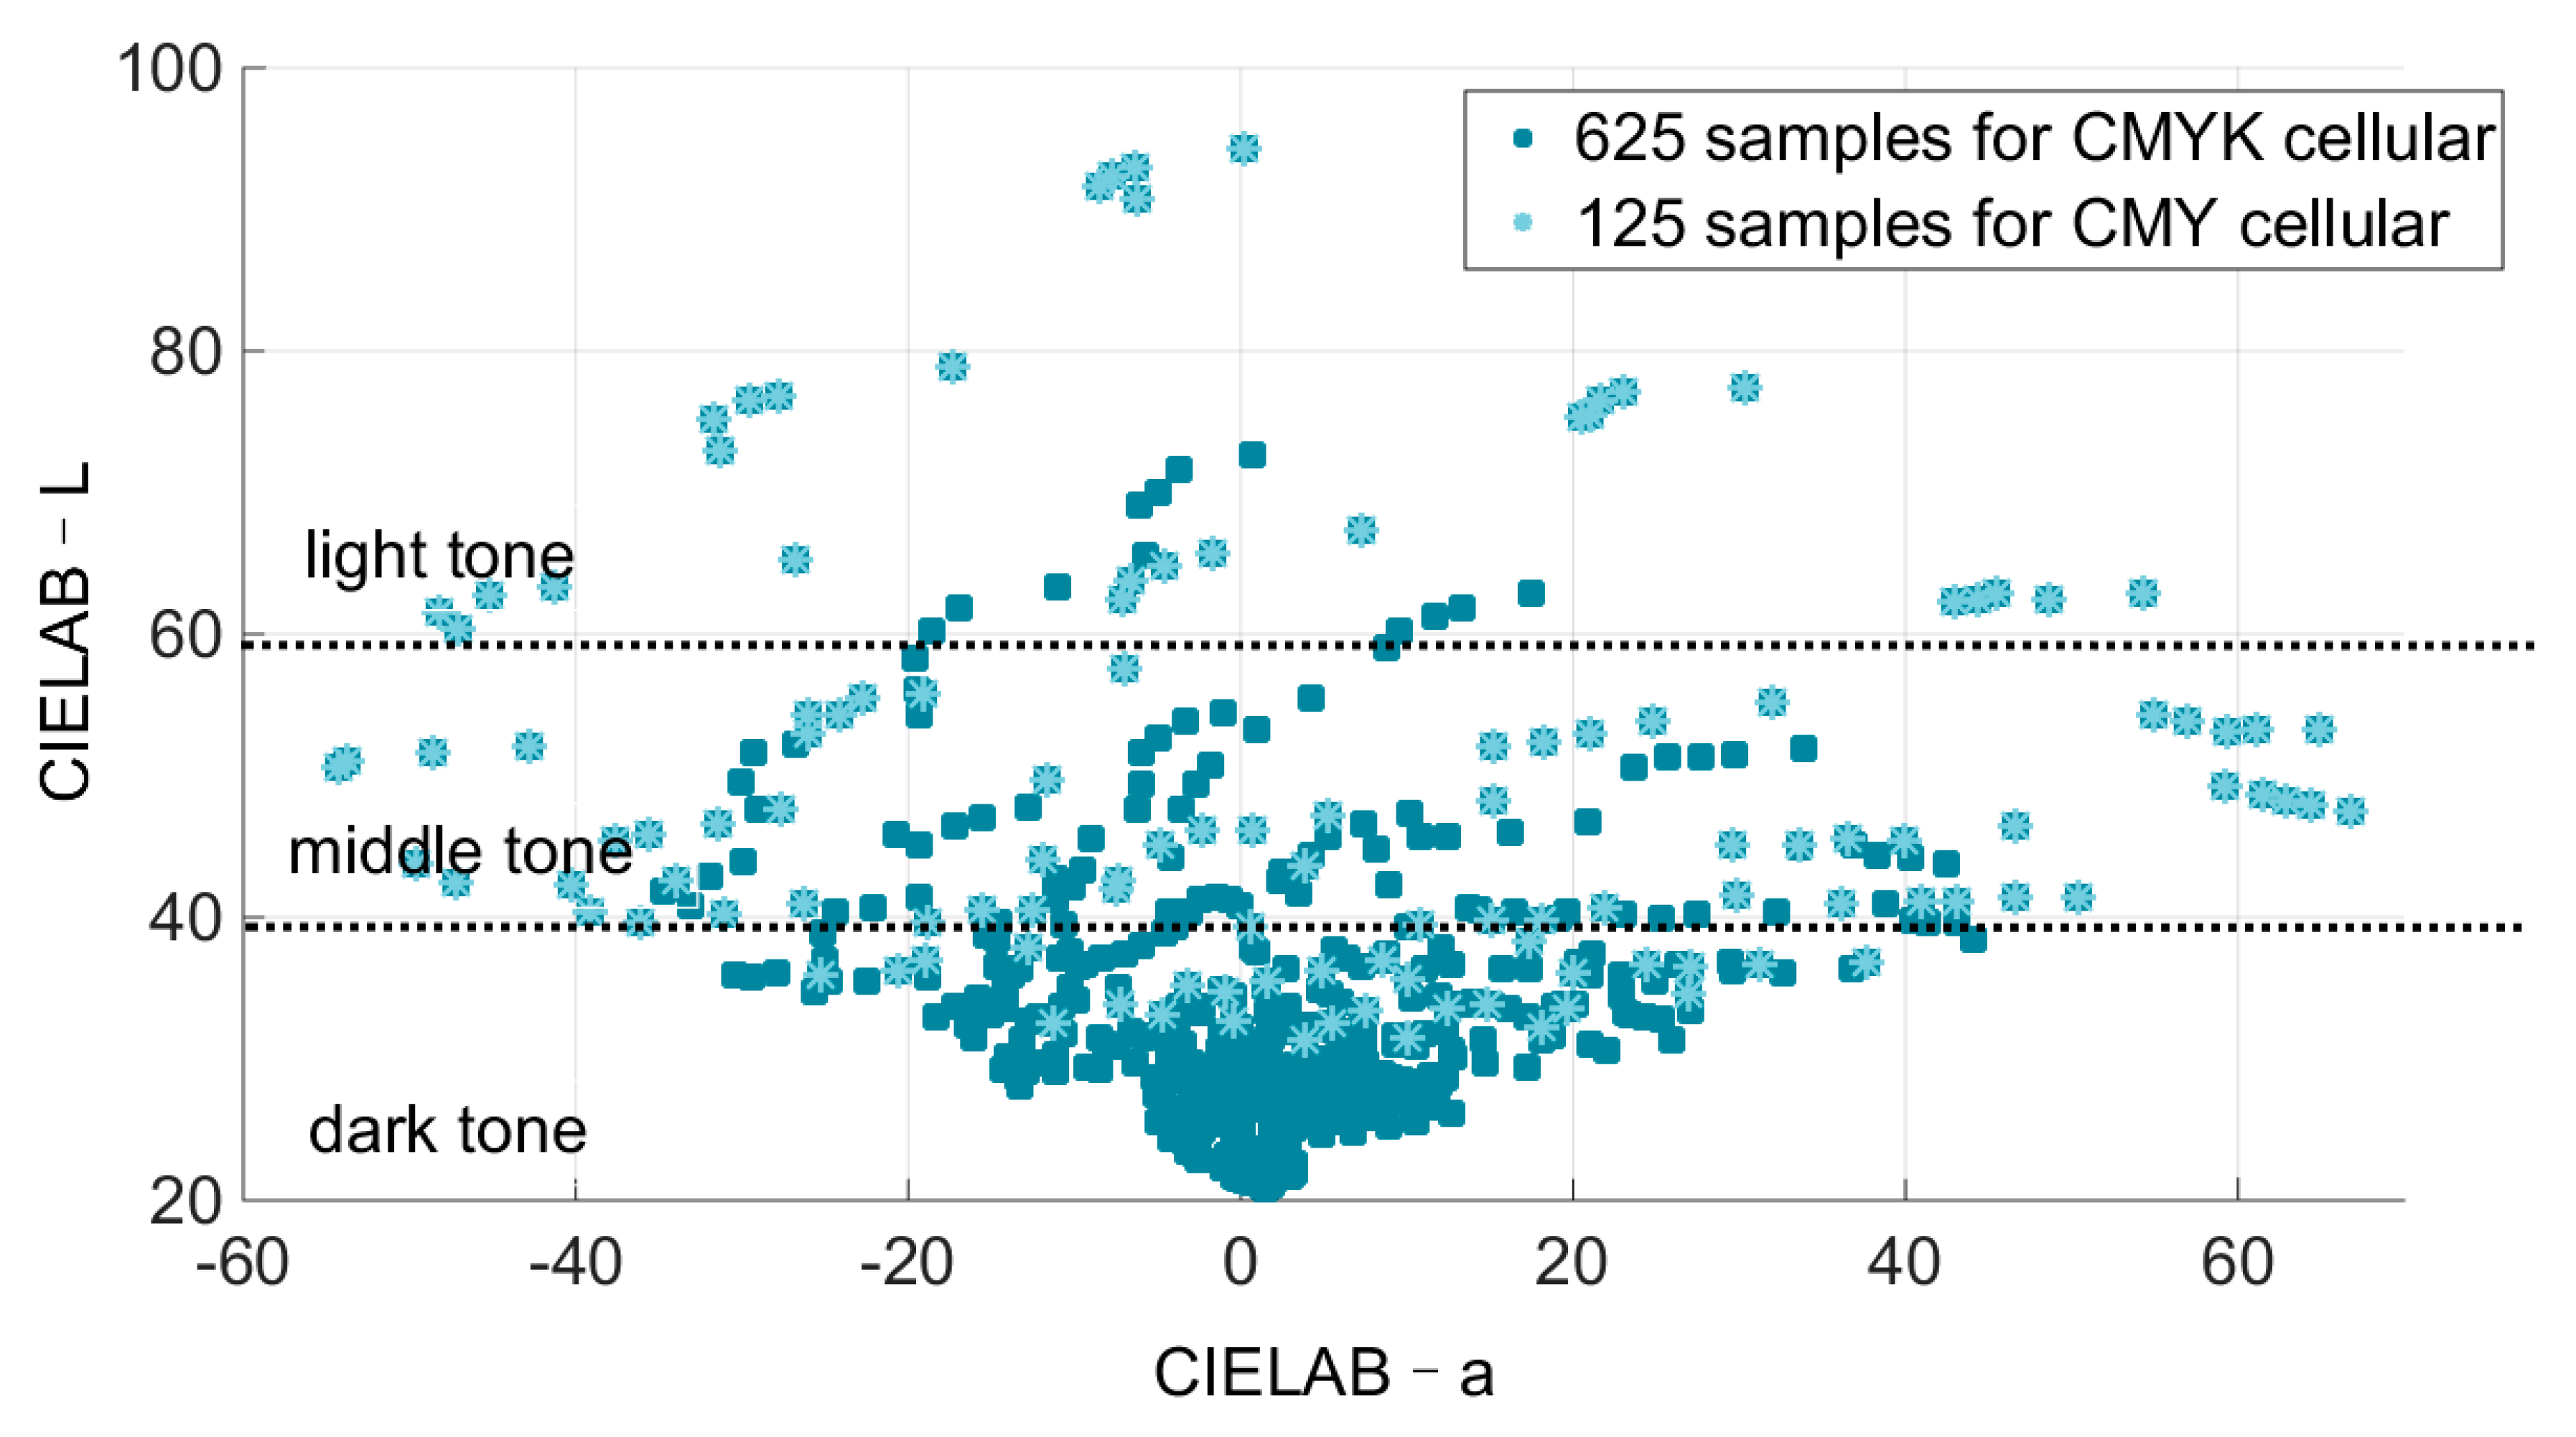
Figure 2 shows the spectral and colorimetric accuracy of the three forward models when predicting the 100 testing samples as described in Section 3. Note that for CMYK and CMY models, different groups of samples were adopted. Since the results regarding to these three substrates are quite consistent, only the case for the canvas papers is presented. The root mean square error (RMSE) [39] and the CIEDE2000 colour difference [31] under the D50/2 condition were adopted to denote the spectral and colorimetric accuracy respectively. As stated above, the light tone, middle tone and dark tone were defined by dividing the whole gamut with two thresholds, which refer to the lightness of (c = 0.3, m = 0.3, y = 0.3, k = 0) and (c = 0.7, m = 0.7, y = 0.7, k = 0). In this case, such two lightness values are 59 and 39 in CIELAB colour space (D50/2) respectively.
From Figure 2, it is clear that our formerly proposed BPn-CYNSN model obviously outperformed the plain CYNSN model for the CMYK printer, which is consistent with our previous work [19]. Besides, it can be concluded that those models always encountered relatively large errors for light-tone regions while exhibiting the best performance for dark tones, which indeed highlights our concern upon the accuracy for light tones.
For the light-tone colours, the embedded CMY-CSN model exhibited the best performance despite the fact that this model is of the lowest level among the three (i.e., without Yule–Nielsen n value modification). As far as we are concerned, such a finding could be ascribed to the nonuniform sampling of those CYNSN models. Figure 3 depicts the colour distribution of the training and testing samples for the canvas paper, where the ordinate denotes the percentage of different colour tones. As described above, 625 samples were printed for the CMYK printer, whereas 125 samples were printed for the embedded CMY printer when building the cellular structure of these models. In addition, there were 100 testing samples for the CMYK and CMY models respectively. From Figure 3, it can be seen that the training and testing samples for the CMYK models mostly located in the dark tone regions due to the strong light absorption of the black ink. On the contrary, few light-tone colours were generated. As those models computed the printed reflectance by a weighted sum of those primary reflectances, such sampling overemphasised the dark tones while resulting in relatively large errors for the light tones. Similarly, as for the proposed embedded CMY printer modelling, as many more light-tone colours were generated, the prediction performance for this region should become significantly better.
In addition to this, the colour coordinates of the 625 samples for CMYK models as well as the 125 samples (a subset of the 625 samples) for CMY models were plotted in CIELAB colour space, as shown in Figure 4. By that figure, the above statements are further validated. Meanwhile, another significant finding is that the colour gamut of the CMY printer in light and middle tones approximately matches that of the CMYK printer while for dark tones it is quite obvious that the gamut of CMY printer is much smaller, especially for the extreme dark tones.
Note that although the embedded CMY printer modelling emphasised the sampling in middle tones and de-emphasised the sampling in dark tones, the corresponding accuracy did not vary considerably when compared to the CMYK models. In our opinion, several possible reasons mutually contribute to this phenomenon, including the modelling protocols of these three models, the magnitude of the spectral reflectance of different tones, the nonlinearity between the spectral accuracy and colorimetric accuracy as well as the measurement error in the extremely dark regions [19,27]. Moreover, it should be mentioned that the CMY and CMYK models actually employed different sets of testing samples with different colour gamut for dark tones (very similar to the condition depicted in Figure 4), therefore the performance comparison for dark region in this condition is actually not very meaningful; regardless, the aim of this study is to optimise the performance of CYNSN-based forward and backward models with black ink, so it is quite obvious that the colour gamut of a CMY printer is too small for the dark tone.
As mentioned above, 100 in-gamut colour samples were reproduced in order to test the performance of different separation methods. Table 2 depicts the mean separation accuracy of the CMYK-BPn-CYNSN-based backward model and the CMY-CSN-based backward model for different colour tones on different substrates. As the superiority of CMYK-BPn-CYNSN-based spectral separation over that of CMYK-CYNSN model had been comprehensively proved by our previous work [19], in this study the CMYK-CYNSN model was not inverted.
It is obvious in Table 2 that the results for these three substrates are quite consistent. For light tones, the separation accuracy of the CMY-based model always outperformed that of the CMYK based model while for middle tone colours, the improvement was not so significant. Meanwhile, as for the performance of the CMYK based separation, the accuracy of the dark tones was always higher than that of the middle tones while the accuracy for the light tones was always the worst. Such findings actually correlate well with the results of the forward modelling, as shown in Figure 2. Similarly, they could also be attributed to the nonuniform sampling of the CYNSN models as well as the strong light absorption of the black ink.
In addition, from Table 2 it was found that the separation accuracy of CMY-based separation model exhibited much larger errors in dark tones. This could be explained by the fact that some of the colours in this region were so dark that they located outside the gamut of the embedded CMY printer, as indicated in Figure 4. To further illustrate this statement, three examples are provided in Figure 5, where the spectral colours from different colour tones were respectively reproduced by CMY-based separation and CMYK based separation. In the dark-tone case, the overprint of the CMY printer could not achieve a colour with extreme darkness. Fortunately, since the accuracy of CMYK based separation for the dark tones is already excellent and the proposed CMY modelling is only adopted in light and middle tones, there is no need to be concerned about this problem.
Besides, the ink limitation settings as mentioned in Table 1 had strong influence on the accuracy of those models. From Table 1 and Table 2, it is obvious that the glossy paper, which holds the most black ink, always suffered from the largest errors. Such a finding, as mentioned above, should be attributed to the measuring error of the colour measurement device for extremely dark tones [19,27,28]. Meanwhile, it was found that for the glossy paper, the errors of the CMY model in dark tones were relatively smaller than those of the other substrates. A possible explanation is that the moderate ink limitation of the CMY inks for this substrate to some extent enabled three such inks to synthesize the colour of the black ink.
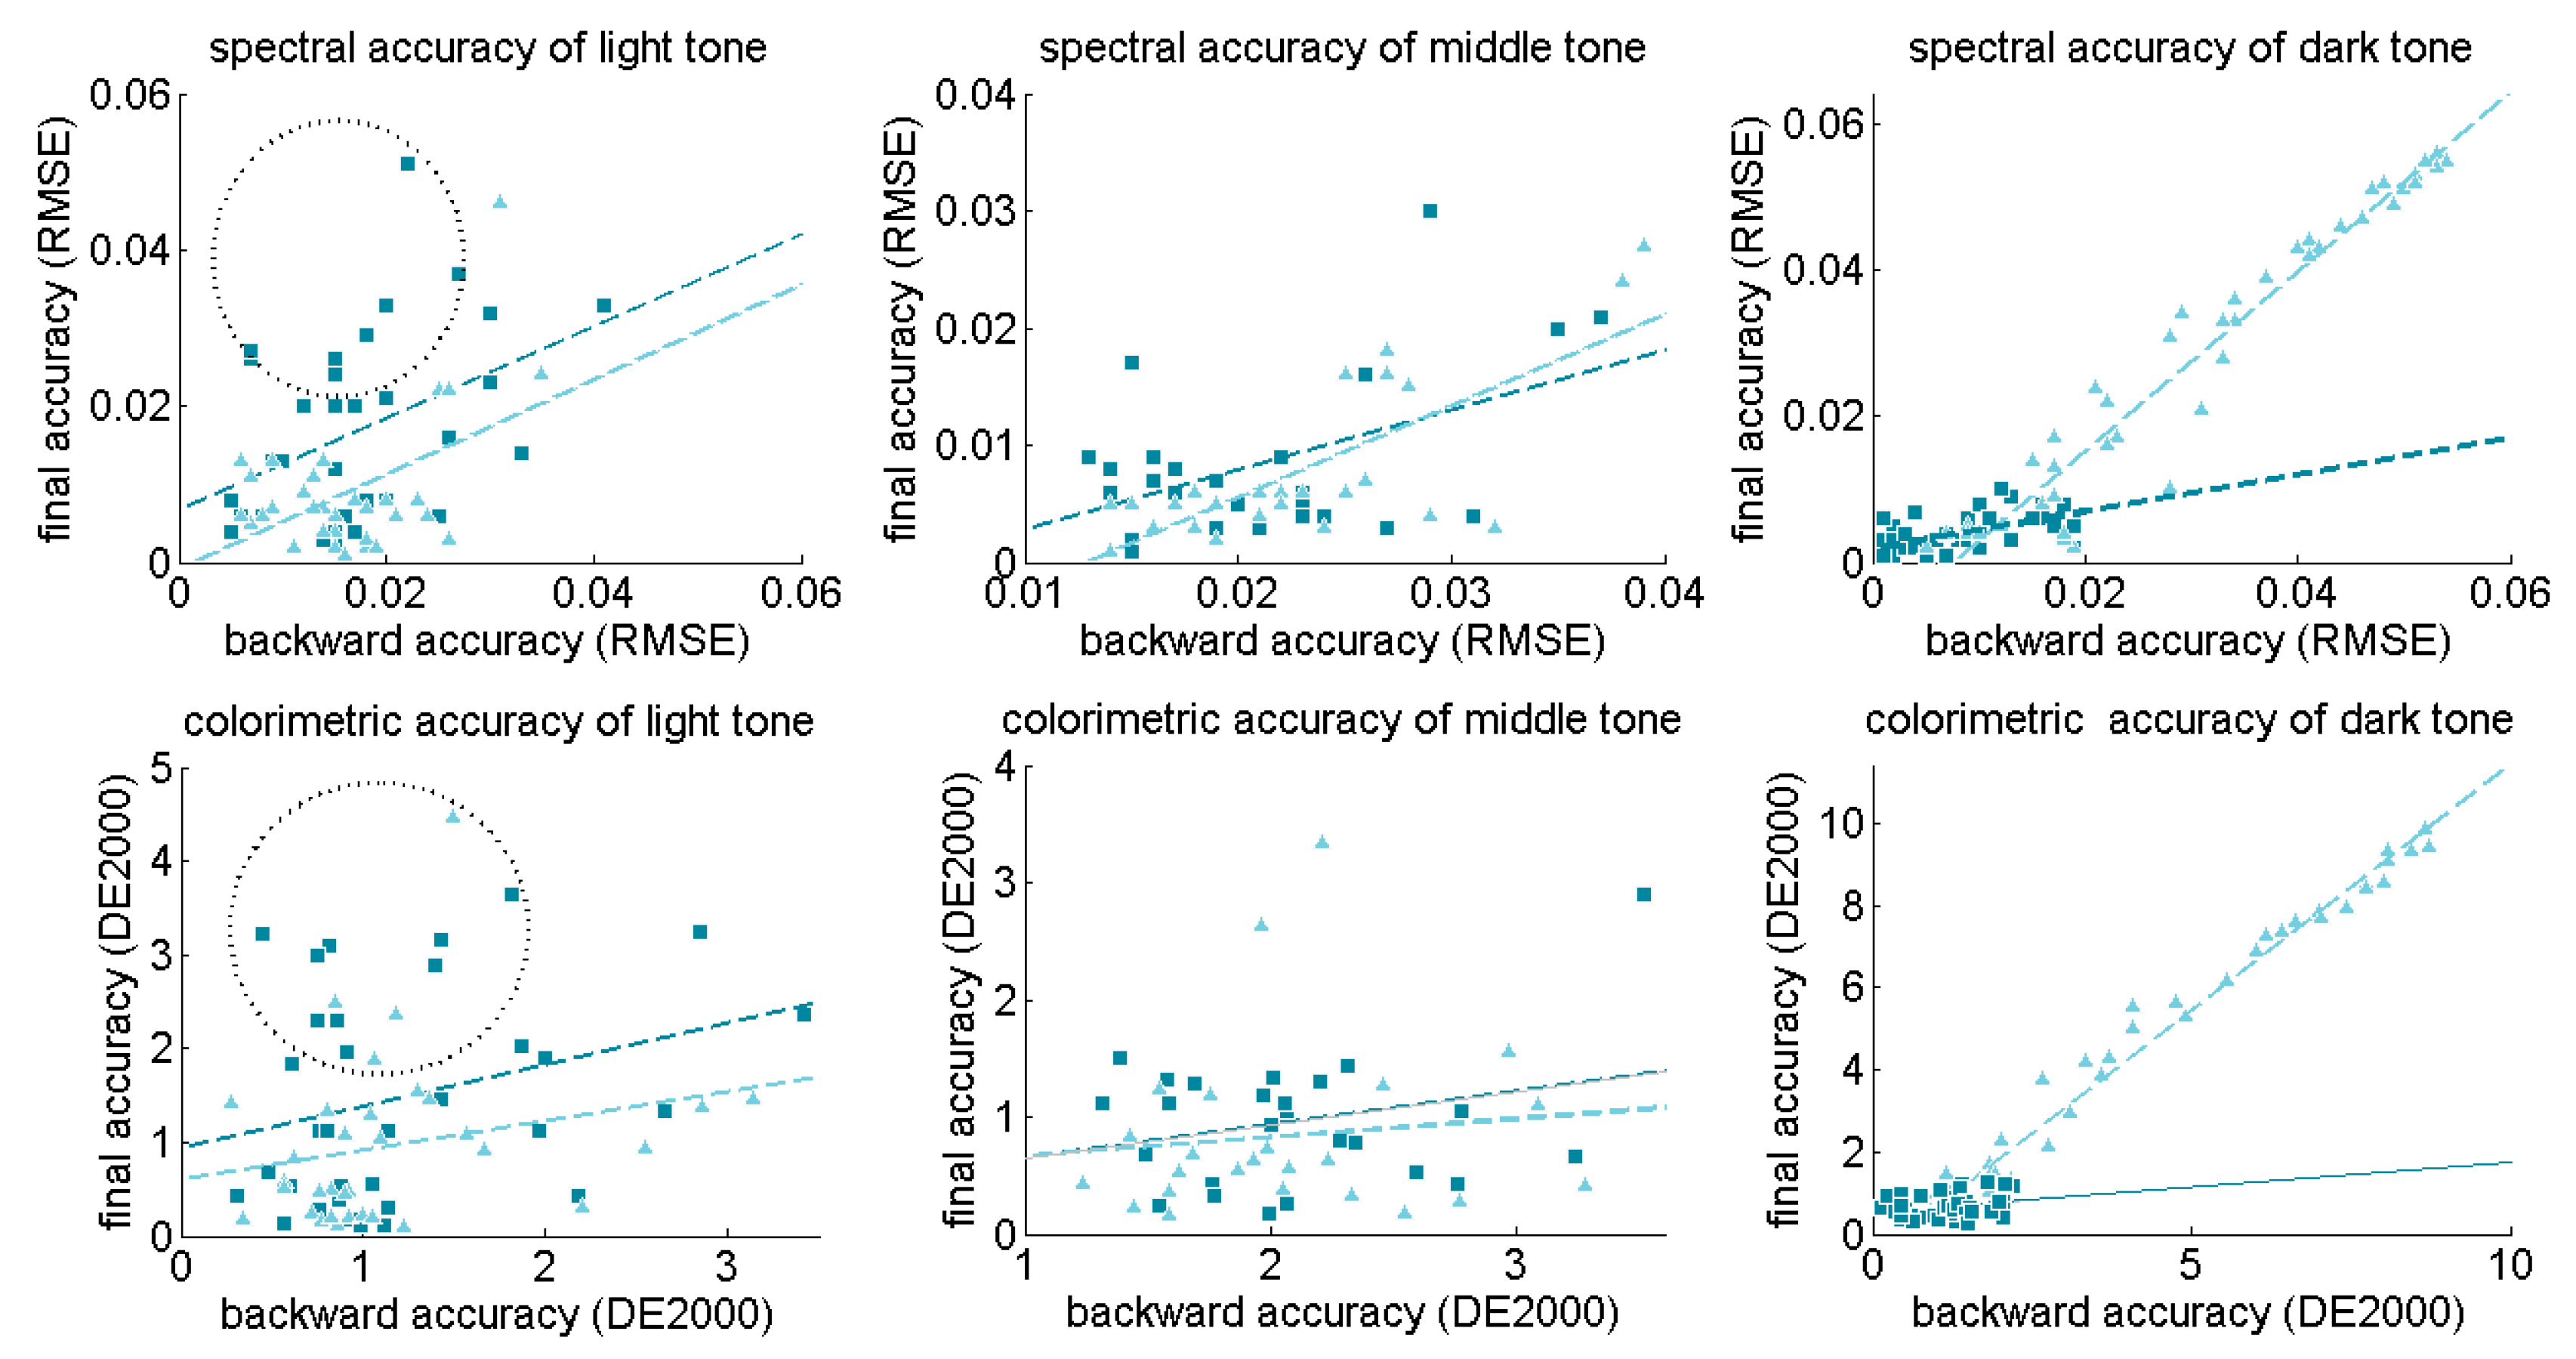
Figure 6 further demonstrates why the proposed method adopted the embedded CMY model for the characterisation in light and middle tones while maintaining the CMYK model for the dark tones. In this figure, taking the canvas paper as an example, the relationship between the backward accuracy and the final separation accuracy for different colour tones are illustrated. It is quite clear that the testing colour samples are more uniform among different colour tones when compared to the case of Figure 3, because we have modified the sampling for test colour samples as described in Section 3.
As stated before, current separation methods always inverted the CYNSN models based on the backward accuracy, which merely refers to the smallest error between the target and the predicted colour according to the forward model. However, if the forward model is problematic, the corresponding separation may not target the optimal control values. In that condition, a failure in final colour reproduction will occur.
From Figure 6, it can be concluded that other than the case of the CMY-CSN-based colour separation for dark tone colours, there is always some obvious difference between the values of the backward accuracy and the final accuracy. (For instance, the samples in the dashed ellipses in Figure 6, which exhibit sound backward accuracy but relative lower final accuracy.) Such a finding indeed highlights the importance of the accuracy of the forward model. In other words, when the final colour separation accuracy is within a small error range (e.g., mean RMSE less than 0.02, mean DE2000 less than 2), the influence of the errors of the forward model should not be neglected when the highest precision is required.
To be specific, it is clear that for the light tones the embedded CMY-based separation tends to lead to better performance. According to the least-square-fitting lines, for the same backward accuracy the CMY-based separation may correspond to a higher final accuracy (lower RMSE or DE2000). Such results soundly validate the rationality of the proposed method.
For the middle tones, it can be concluded that the two models performed almost equally. In fact, from the viewpoint of mean values, the performance of the CMY-based separation only provided a very small improvement. Therefore, for the middle tones it is not quite essential to replace the CMYK separation with CMY separation. As mentioned above, our optimal device values-choosing strategy (i.e., to choose by the backward modelling accuracy) is only intended for avoiding the possible colour shift around the threshold regions. In fact, since the final errors for this condition are quite small, it is highly possible that human observers could not discriminate so small colour shift if there is any.
As depicted in Figure 6, the results of the two separations for the dark tones are completely different. Since the dark colours actually located outside the CMY gamut, there is no doubt that the CMYK separation should be adopted in this condition. Meanwhile, the slope and the Y-intercept of the CMYK least-square-fitting line are quite small, which soundly validates the performance of the CMYK based separation for this condition.
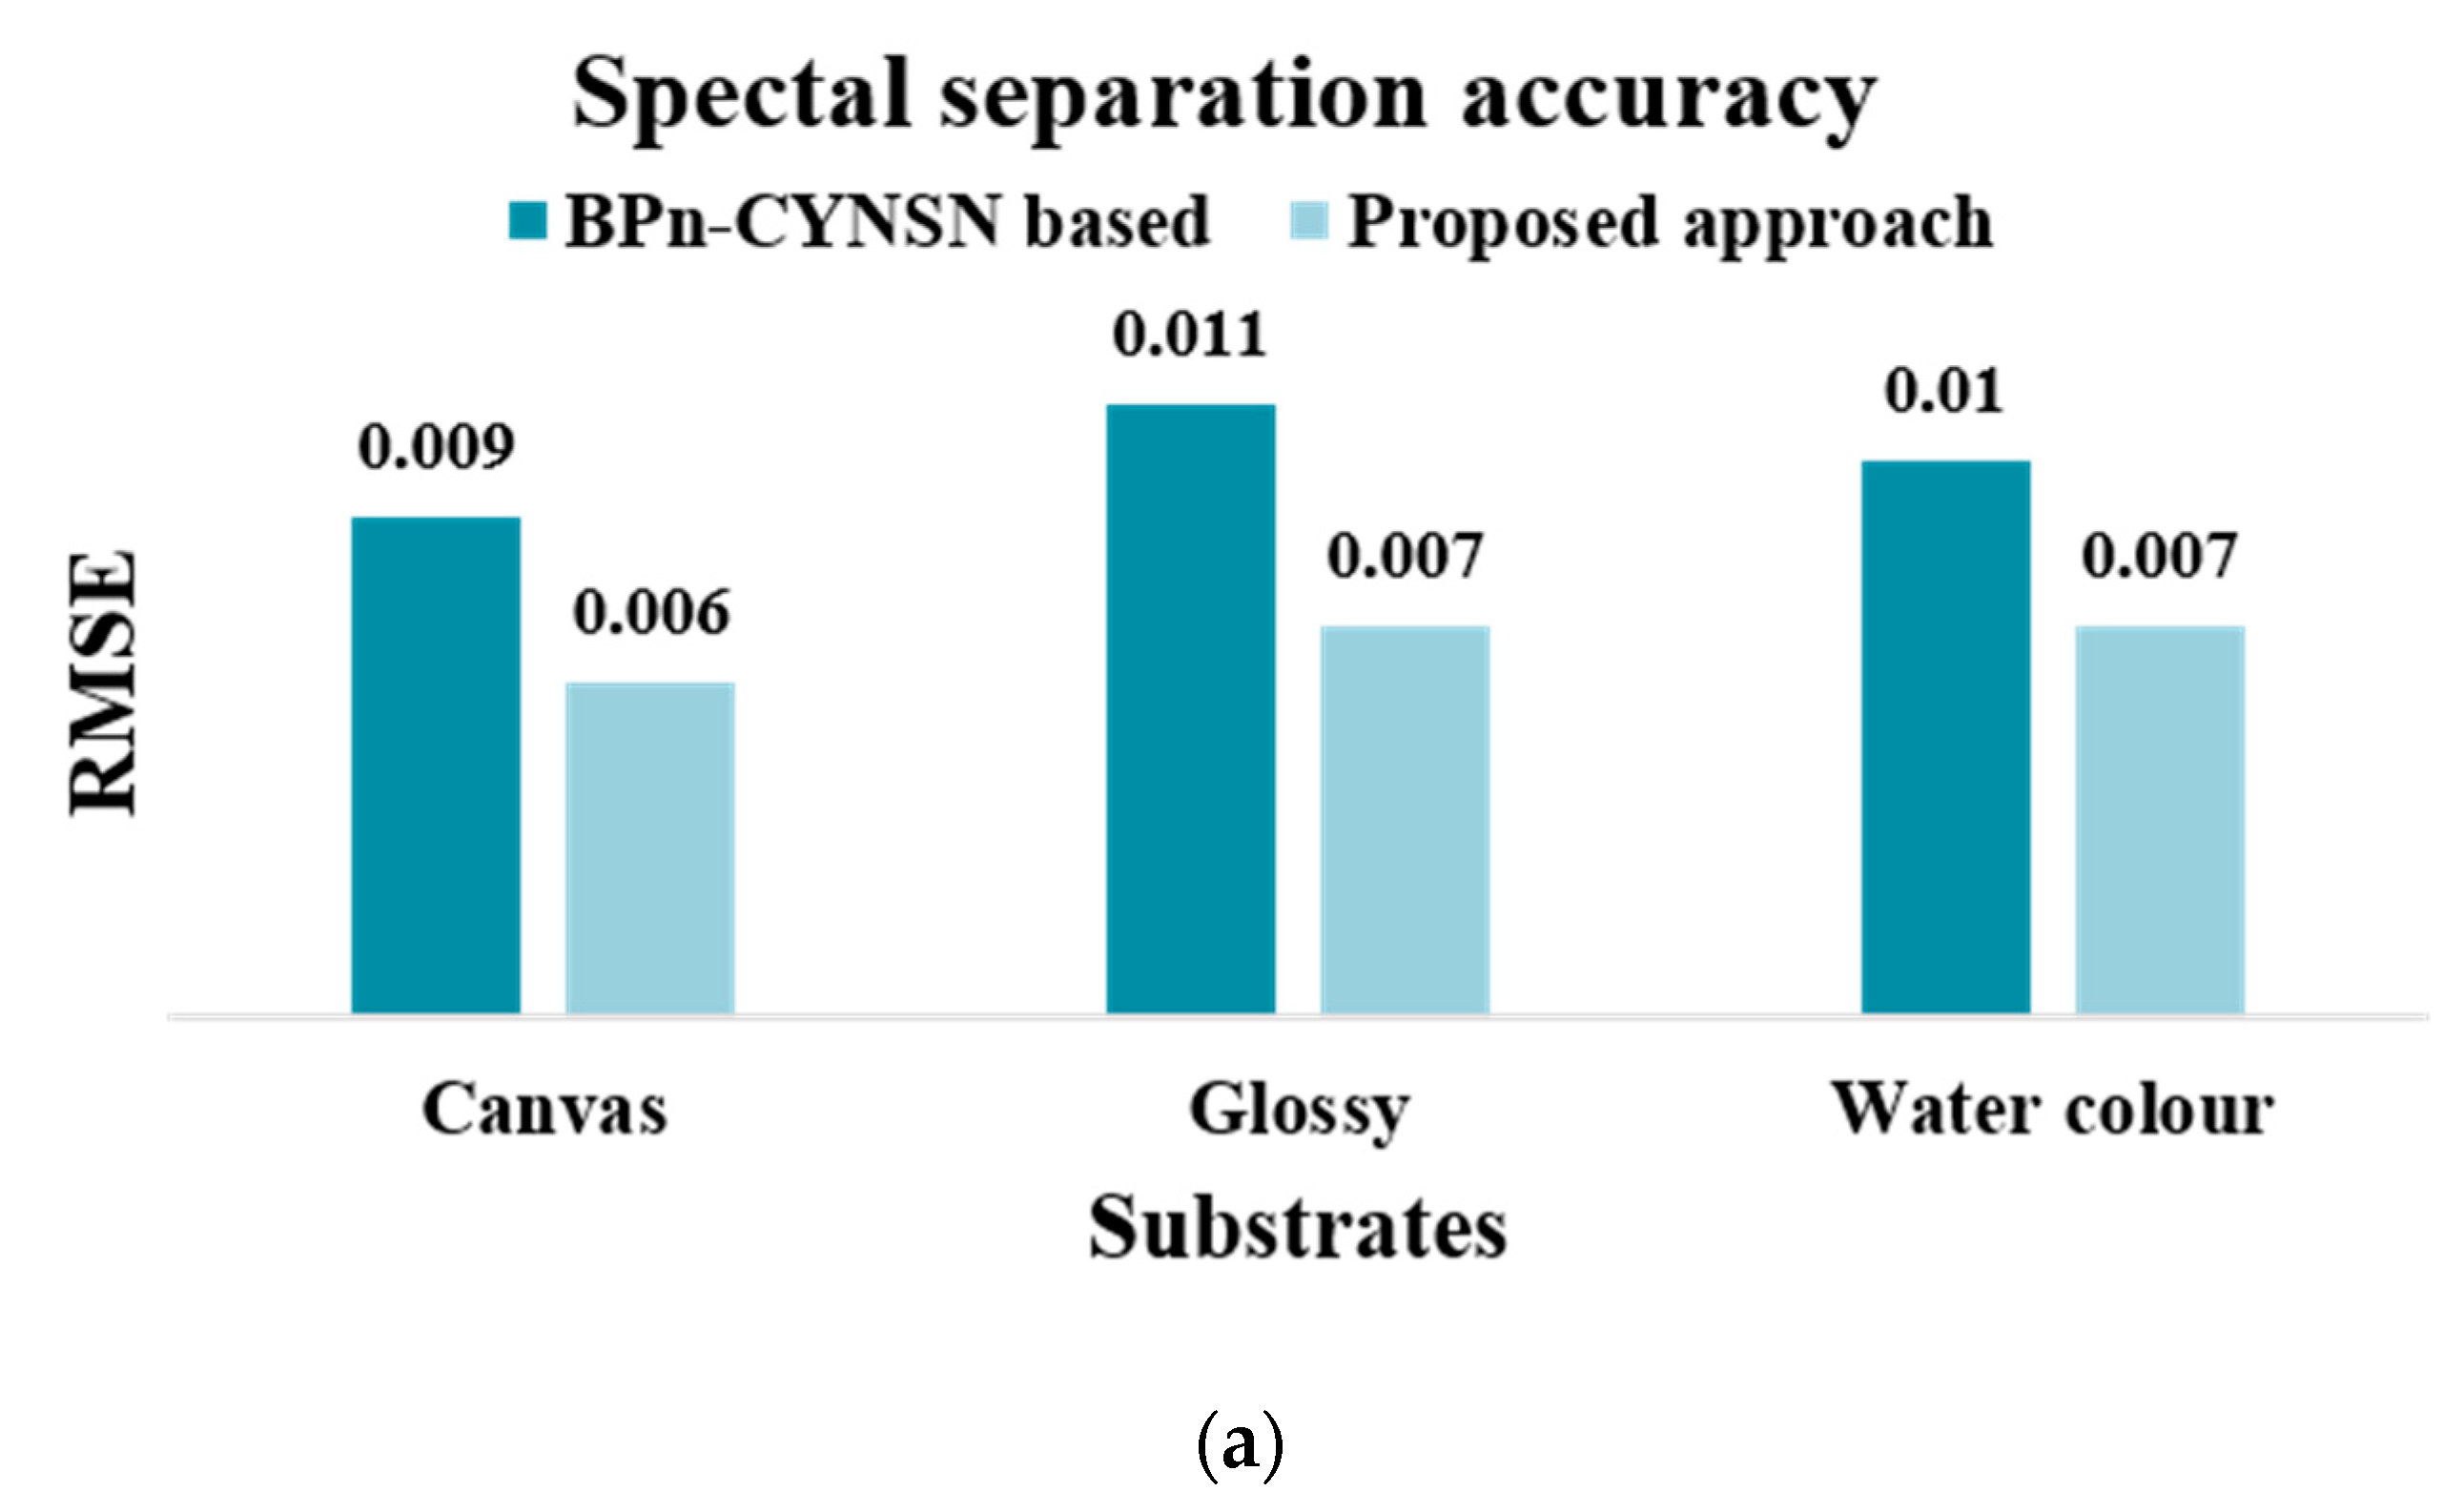
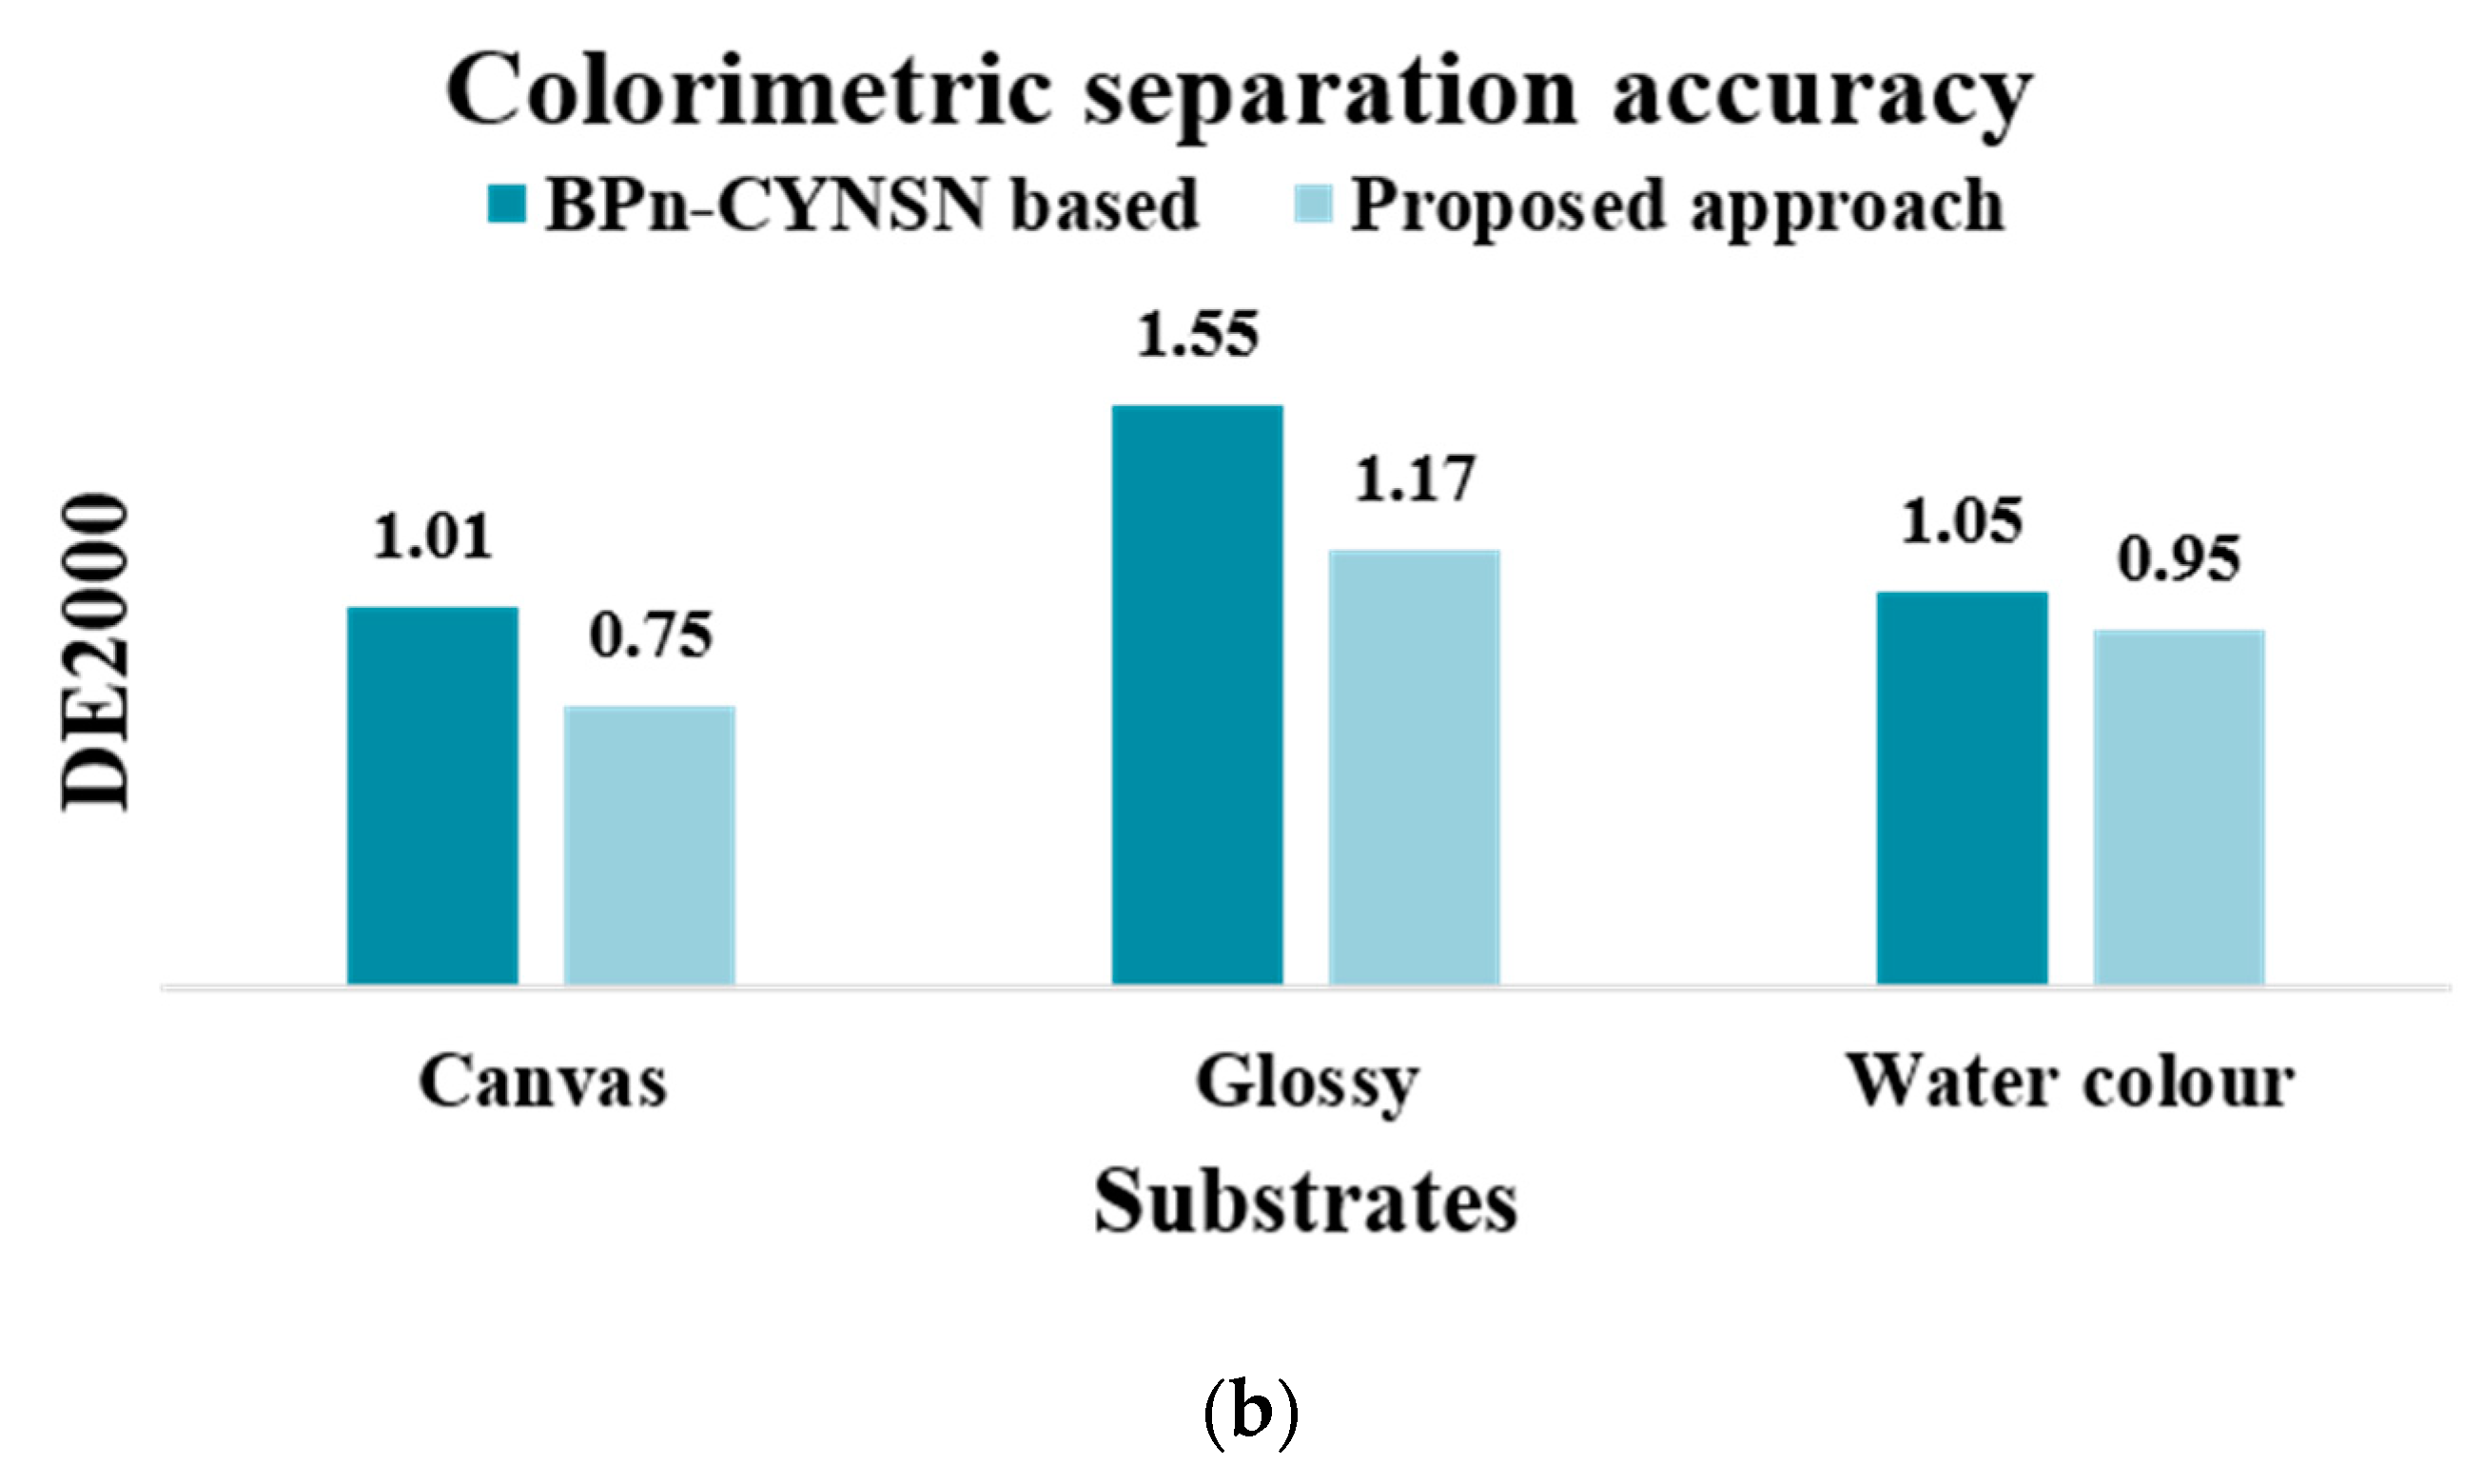
Lastly, the ultimate comparison of our formerly proposed CMYK-BPn-CYNSN-based separation [19] and the proposed CMY optimization approach is depicted in Figure 7. It is quite clear that for the three experimental substrates, the proposed method in this study outperformed its counterpart, with an error reduction of 10–30%. It should be mentioned that such comparison was based on the 100 testing samples, where the sampling for the light and middle tones had been emphasised. It is easy to infer that the proposed method will become more useful when there are more light-tone colours in the original image. On the contrary, if the majority of the target colours located in dark-tone regions, the improvement may turn out to be insignificant.

5. Conclusions

In this paper, we proposed a novel approach to optimise our formerly built spectral printer characterisation workflow, with no need of extra sampling. Our key insight is to improve the characterisation for the light tones with an embedded CMY printer modelling. By the results of experiments involving three different substrates, the defects of the CYNSN-based CMYK printer characterisation have been demonstrated and the feasibility of our proposed method has also been verified.
The optimization used may also apply to other ink combinations as long as a CYNSN-based method and a black are adopted. In fact, there are actually several studies that divided a multi-ink printer into several sub-printers equipped with a black ink, with the aim of efficient modelling and acquiring maximum gamut [18,27,28,44,45]. Obviously, the proposed approach will further improve the performance of these models.
In addition, it is worth mentioning that the proposed method also contributes to printer characterisation adjustment [23,24,28]. In this topic, several corrective models were derived in order to update the printer characterisation in response to the systematic changes in printer device behaviour. We have found that such adjustment methods for the CYNSN-based workflow also depend on the forward accuracy and suffer from the same problem in light tones. Based on this contribution, we have also developed an approach for that issue. Details of this work will be reported in another paper.
At last, please note that just like most of the cited studies, in this work only one printer were used. Although our main concern towards the negative influence of the oversampling for dark tones could be demonstrated theoretically and has been validated by our experiments with multiple substrates, to make a robust approach, further testing with different kinds of printers should still be encouraged.

Author Contributions

Conceptualisation, Q.L. and Z.H.; methodology, Q.L. and Z.H.; validation, Q.L. and M.R.P.; formal analysis, Q.L.; investigation, Q.L. and Z.H.; resources, M.R.L.; data curation, Q.L.; writing—original draft preparation, Q.L.; writing—review and editing, Q.L., M.R.P. and M.R.L.; funding acquisition, Q.L.

Funding

This research was funded by the National Natural Science Foundation of China, grant number 61505149; and the Young Talent Foundation of Wuhan City of China, grant number 2016070204010111.

Conflicts of Interest

The authors declare no conflicts of interest.

References

  1. Deshpande, K.; Green, P.; Pointer, M.R. Characterisation of the n-colour printing process using the spot colour overprint model. Opt. Express 2014, 22, 31786–31800. [Google Scholar] [CrossRef] [PubMed]
  2. Liang, J.; Huang, H.; Lian, Y.S.; Ning, S.Y.; Sun, L. Study of the Multi-Spectral Characterization Model for Inkjet Printing System and Its Application. Spectrosc. Spectr. Anal. 2018, 38, 1213–1218. [Google Scholar]
  3. Sharma, G. Digital Color Imaging Handbook; CRC: New York, NY, USA, 2002; Volume 11. [Google Scholar]
  4. Morovic, J.; Morovic, P.; Arnabat, J. HANS: Controlling Ink-Jet Print Attributes Via Neugebauer Primary Area Coverages. IEEE Trans. Image Process. 2012, 21, 688–696. [Google Scholar] [CrossRef] [PubMed]
  5. Liu, Q.; Huang, Z.; Li, Q.; Peng, R.; Xun, Y. Updating a Spectral Printer Characterization Model Based on Ink Limitation Samples. Spectrosc. Spectr. Anal. 2018, 38, 3182–3187. [Google Scholar]
  6. Gerbl, A.; Lewin, M.; Zeiske, T.; Ziegert, M.; Schwarz, F.B.; Hamm, B.; Scheel, M.; Jahnke, P. Characterization of office laser printers for 3-D printing of soft tissue CT phantoms. J. Med Imaging 2019, 6, 021602. [Google Scholar] [CrossRef]
  7. Wyble, D.R.; Berns, R.S. A critical review of spectral models applied to binary color printing. Color Res. Appl. 2000, 25, 4–19. [Google Scholar] [CrossRef]
  8. Xi, S.; Zhang, Y. Neugebauer reflectance model of frequency modulation halftone image. Optik 2013, 124, 2103–2105. [Google Scholar] [CrossRef]
  9. Zhang, Y.; Shi, G. Empirical and probability models of the spectral reflectance for the frequency modulated halftoning imaging. Opt.-Int. J. Light Electron Opt. 2012, 124, 28–30. [Google Scholar] [CrossRef]
  10. Zhang, Y.; Xing, W. Reflectance prediction model of frequency modulation halftone image copied by variable dot-volume press. Opt.-Int. J. Light Electron Opt. 2012, 124, 1730–1735. [Google Scholar] [CrossRef]
  11. Chen, Y.; Berns, R.S.; Taplin, L.A.; Imai, F. Six color printer characterization using an optimized cellular Yule-Nielsen spectral Neugebauer model. J. Imaging Sci. Technol. 2004, 48, 519–528. [Google Scholar]
  12. Chen, Y.; Berns, R.; Taplin, L.; Imai, F. Multi-ink color-separation algorithm improving image quality. J. Imaging Sci. Technol. 2008, 52, 20604. [Google Scholar] [CrossRef]
  13. Urban, P.; Grigat, R.R. Spectral based color separation using linear regression iteration. Color Res. Appl. 2006, 31, 229–238. [Google Scholar] [CrossRef]
  14. Li, C.; Luo, M.R. Further accelerating the inversion of the yule-nielson modified neugebauer model. In Proceedings of the 16th Color Imaging Conference: Color Science and Engineering Systems, Technologies, and Applications, Portland, OR, USA, 6–9 November 2001; pp. 84–88. [Google Scholar]
  15. Liu, Z.; Liu, Q.; Gao, G.-A.; Li, C. Optimized spectral reconstruction based on adaptive training set selection. Opt. Express 2017, 25, 12435–12445. [Google Scholar] [CrossRef] [PubMed]
  16. Gerhardt, J.; Hardeberg, J.Y. Spectral color reproduction minimizing spectral and perceptual color differences. Color Res. Appl. 2008, 33, 494–504. [Google Scholar] [CrossRef]
  17. Zhang, X.; Wang, Q.; Li, J.; Yang, P.; Yu, J. The interim connection space based on human color vision for spectral color reproduction. J. Opt. Soc. Am. A Opt. Image Sci. Vis. 2012, 29, 1027–1034. [Google Scholar] [CrossRef]
  18. Urban, P.; Berns, R. Paramer Mismatch-Based Spectral Gamut Mapping. IEEE Trans. Image Process. 2010, 20, 1599–1610. [Google Scholar] [CrossRef]
  19. Liu, Q.; Wan, X.; Xie, D. Optimization of spectral printer modeling based on a modified cellular Yule–Nielsen spectral Neugebauer model. JOSA A 2014, 31, 1284–1294. [Google Scholar] [CrossRef]
  20. Sun, B.; Liu, H.; Zhou, S.; Cao, C.; Zheng, Y. Modified Spectral Neugebauer Model for Printer Characterization. Spectrosc. Lett. 2015, 48, 660–668. [Google Scholar] [CrossRef]
  21. Guo, J.; Xu, H.; Luo, M.R. Novel spectral characterization method for color printer based on the cellular Neugebauer model. Chin. Opt. Lett. 2010, 8, 1106–1109. [Google Scholar]
  22. Shen, H.L.; Zheng, Z.H.; Jin, C.C.; Du, X.; Shao, S.J.; Xin, J.H. Adaptive characterization method for desktop color printers. J. Electron. Imaging 2013, 22, 023012. [Google Scholar] [CrossRef] [Green Version]
  23. Shaw, M.; Sharma, G.; Bala, R.; Dalal, E.N. Color printer characterization adjustment for different substrates. Color Res. Appl. 2003, 28, 454–467. [Google Scholar] [CrossRef]
  24. Littlewood, D.; Subbarayan, G. Updating a CMYK printer model using a sparse data set. J. Imaging Sci. Technol. 2006, 50, 556–566. [Google Scholar] [CrossRef]
  25. Son, C.H.; Jang, I.S.; Lee, T.H.; Ha, Y.H. Photo-inkjet printing method based on limited colorant amount and dot-visibility ordering. IEEE Trans. Consum. Electron. 2010, 56, 280–288. [Google Scholar] [CrossRef]
  26. Rossier, R.; Bugnon, T.; Hersch, R.D. Introducing Ink Spreading within the Cellular Yule-Nielsen Modified Neugebauer Model; Society for Imaging Science and Technology: Springfield, WV, USA, 2010. [Google Scholar]
  27. Wang, B.; Xu, H.; Luo, M.R.; Guo, J. Spectral-based color separation method for a multi-ink printer. Chin. Opt. Lett. 2011, 9, 063301. [Google Scholar] [CrossRef]
  28. Wang, B.; Xu, H.; Luo, M.R.; Guo, J. Maintaining accuracy of cellular Yule–Nielsen spectral Neugebauer models for different ink cartridges using principal component analysis. JOSA A 2011, 28, 1429–1435. [Google Scholar] [CrossRef]
  29. Bianco, S.; Schettini, R. Sampling optimization for printer characterization by direct search. IEEE Trans. Image Process. 2012, 21, 4868–4873. [Google Scholar] [CrossRef]
  30. Morovic, J.; Arnabat, J.; Richard, Y.; Albarran, A. Sampling optimization for printer characterization by greedy search. IEEE Trans. Image Process. 2010, 19, 2705–2711. [Google Scholar] [CrossRef]
  31. Luo, M.R.; Cui, G.; Rigg, B. The development of the CIE 2000 colour-difference formula: CIEDE2000. Color Res. Appl. 2001, 26, 340–350. [Google Scholar] [CrossRef]
  32. Liu, Q. Research on Key Issues for Spectral-Based Inkjet Color Reproduction; Wuhan University: Wuhan, China, 2013. [Google Scholar]
  33. Liu, Q.; Wan, X.X.; Xu, H.P. Study on ink restriction of ink-jet printing based on spectral gamut maximization. Spectrosc. Spectr. Anal. 2013, 33, 1636–1641. [Google Scholar] [CrossRef]
  34. Urban, P. Ink limitation for spectral or color constant printing. In Proceedings of the 11th Congress of the Int’l. Colour Assn, Sydney, Australia, 18–26 January 2009. [Google Scholar]
  35. Demichel, E. Le Procédé. Société Française de Photographie 1924, 26, 17–21. [Google Scholar]
  36. Yule, J.A.C.; Nielsen, W.J. The Penetration of Light into Paper and Its Effect on Halftone Reproduction; Institute of Science and Technology, Linkping University: Norrköping, Sweden, 1951. [Google Scholar]
  37. Rogers, G. Analysis of the Yule-Nielsen effect with the multiple-path point spread function in a frequency-modulated halftone. J. Opt. Soc. Am. A 2018, 35, 916. [Google Scholar] [CrossRef] [PubMed]
  38. Balasubramanian, R. Optimization of the spectral Neugebauer model for printer characterization. J. Electron. Imaging 1999, 8, 156–166. [Google Scholar] [CrossRef]
  39. Imai, F.H.; Rosen, M.R.; Berns, R.S. Comparative study of metrics for spectral match quality. In Proceedings of the CGIV, Poitiers, France, 2–5 April 2002; pp. 492–496. [Google Scholar]
  40. Taplin, L.A. Spectral Modeling of a Six-Color Inkjet Printer; Rochester Institute of Technology: Rochester, NY, USA, 2001. [Google Scholar]
  41. Schanda, J. CIE Colorimetry; Wiley Online Library: Hoboken, NJ, USA, 2007. [Google Scholar]
  42. Chong, E.K.; Zak, S.H. An Introduction to Optimization; Wiley: Chichester, UK, 2013. [Google Scholar]
  43. ICC. ICC Specification. Available online: www.color.org (accessed on 16 November 2019).
  44. Tzeng, D.Y. Spectral-Based Color Separation Algorithm Development for Multiple-Ink Color Reproduction; Citeseer: Forest Grove, OR, USA, 1999. [Google Scholar]
  45. Urban, P.; Rosen, M.R.; Berns, R.S. Spectral gamut mapping framework based on human color vision. In Conference on Colour in Graphics, Imaging, and Vision; Society for Imaging Science and Technology: Cambridge, MA, USA, 2008; Volume 2008. [Google Scholar]
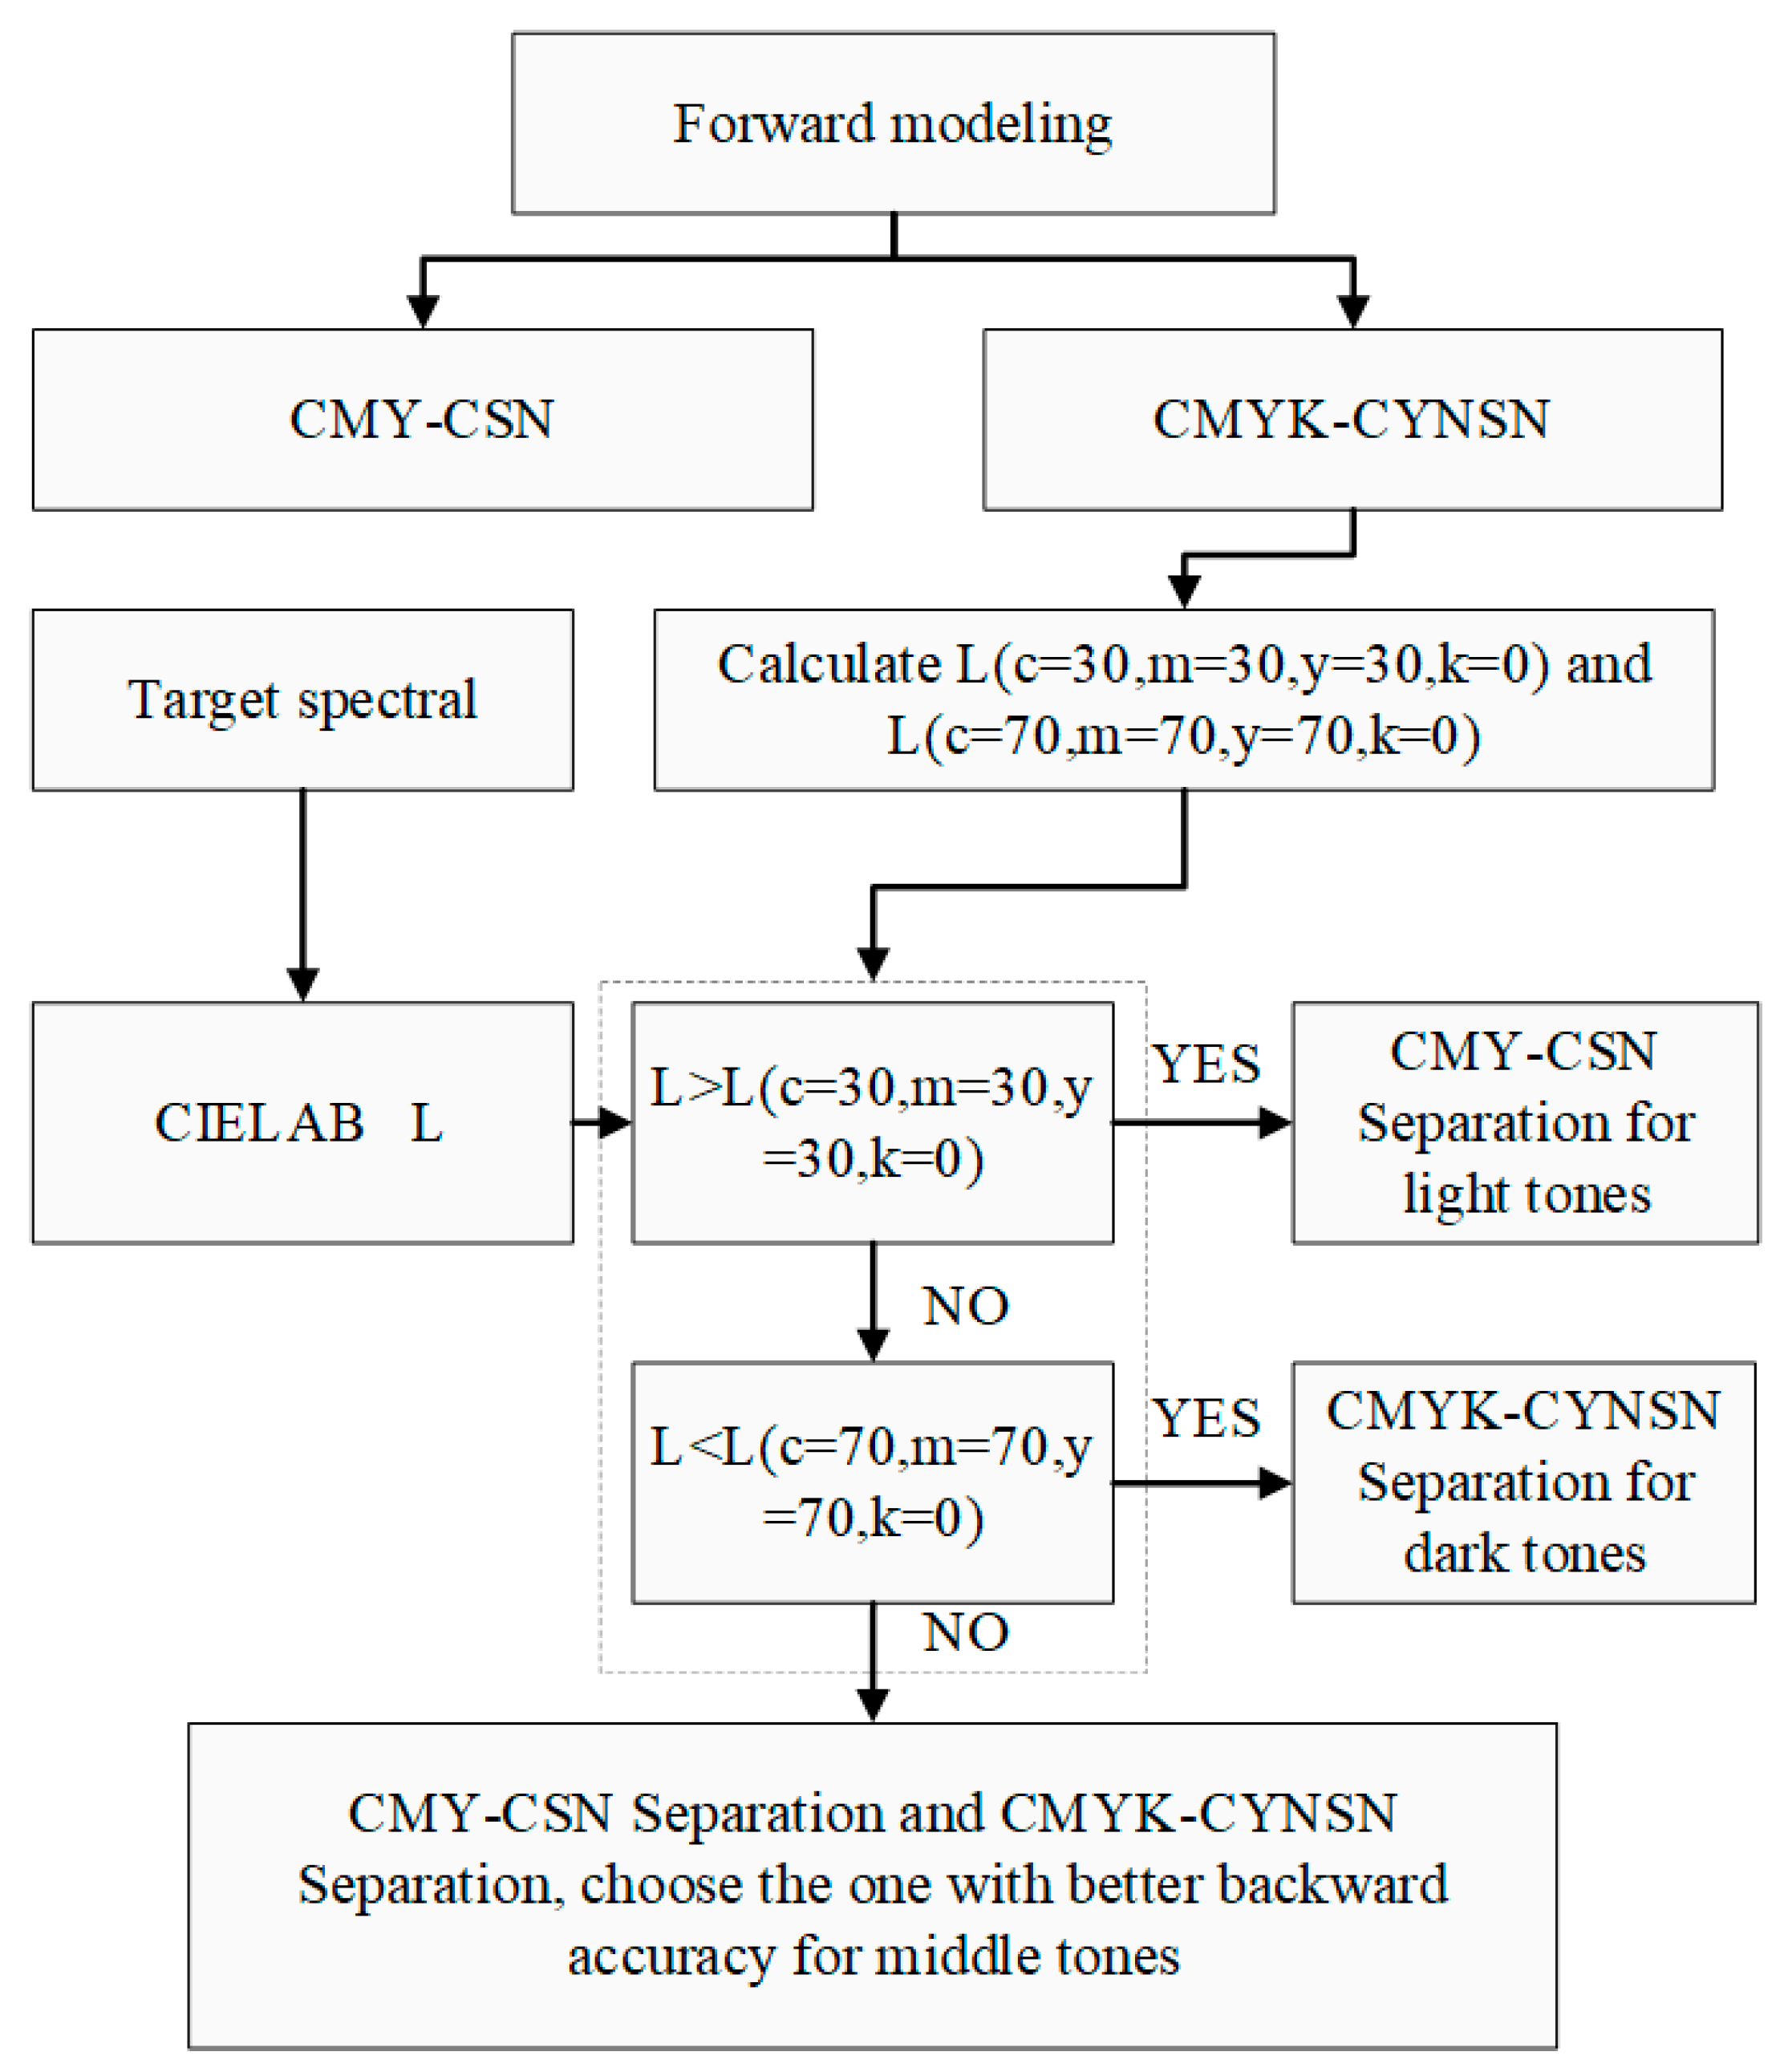
Figure 1. Flow chart of the proposed optimization approach.
Applsci 09 05308 g001
Figure 2. Spectral accuracy (a) and colorimetric accuracy (b) of different forward models for the canvas paper.
Applsci 09 05308 g002
Figure 3. Colour distribution of the training and testing samples for the canvas paper.
Applsci 09 05308 g003
Figure 4. Colour coordinates (canvas paper) of the cellular samples for CMYK and CMY models in CIELAB space. (L-a plot, D50/2).
Applsci 09 05308 g004
Figure 5. Examples of spectral colour reproduction. L denotes the lightness values in CIELAB space (D50/2), BPn represents the CMYK-BPn-CYNSN-based colour separation while CSN represents the CMY-CSN-based colour separation.
Applsci 09 05308 g005
Figure 6. The relationship between the backward accuracy and the final separation accuracy for the light tone, middle tone and dark tone for the canvas paper. The squares in dark colour represent the samples reproduced by the CMYK-BPn-CYNSN-based colour separation while the triangles in light colour represent the samples reproduced by the CMY-CSN-based colour separation. The dashed lines denote the least-squares fit for each scatter plot. The samples in the dashed ellipses represent the ones with sound backward accuracy but relative lower final accuracy, mainly for the CMYK-BPn-CYNSN-based colour separation.
Applsci 09 05308 g006
Figure 7. The ultimate spectral accuracy (a) and colorimetric accuracy (b) of BPn-CYNSN-based separation and the proposed approach.
Applsci 09 05308 g007aApplsci 09 05308 g007b
Table 1. The maximum total ink amount for the Neugebauer primary ramps.
PrimaryMaximum Total Ink Amount Φ t o t a l m a x
CanvasGlossyWater Colour
Paper(0, 0, 0, 0)(0, 0, 0, 0)(0, 0, 0, 0)
C(0.9, 0, 0, 0)(1, 0, 0, 0)(0.7, 0, 0, 0)
M(0, 0.8, 0, 0)(0, 1, 0, 0)(0, 0.65, 0, 0)
Y(0, 0, 0.9, 0)(0, 0, 1, 0)(0, 0, 0.9, 0)
K(0, 0, 0, 0.6)(0, 0, 0, 1)(0, 0, 0, 0.65)
CM(0.6, 0.6, 0, 0)(0.8, 0.8, 0, 0)(0.45, 0.45, 0, 0)
CY(0.85, 0, 0.85, 0)(0.9, 0, 0.9, 0)(0.55, 0, 0.55, 0)
CK(0.65, 0, 0, 0.65)(0.85, 0, 0, 0.85)(0.55, 0, 0, 0.55)
MY(0, 0.75, 0, 0.75)(0, 0.95, 0, 0.95)(0, 0.6, 0, 0.6)
MK(0, 0.6, 0, 0.6)(0, 0.7, 0, 0.7)(0, 0.6, 0, 0.6)
YK(0, 0, 0.7, 0.7)(0, 0, 0.85, 0.85)(0, 0, 0.75, 0.75)
CMY(0.7, 0.7, 0.7, 0)(0.8, 0.8, 0.8, 0)(0.45, 0.45, 0.45, 0)
CMK(0.55, 0.55, 0, 0.55)(0.65, 0.65, 0, 0.65)(0.45, 0.45, 0, 0.45)
CYK(0.75, 0, 0.75, 0.75)(0.75, 0, 0.75, 0.75)(0.5, 0, 0.5, 0.5)
MYK(0, 0.55, 0.55, 0.55)(0, 0.7, 0.7, 0.7)(0, 0.55, 0.55, 0.55)
CMYK(0.5, 0.5, 0.5, 0.5)(0.65, 0.65, 0.65, 0.65)(0.45, 0.45, 0.45, 0.45)
Table 2. Mean separation accuracy of CMYK-BPn-CYNSN-based backward model and CMY-CSN-based backward model.
CMYK-BPn-CYNSNCMY-CSN
RMSDE2000RMSDE2000
CanvasLight Tone0.0171.480.0090.96
Middle Tone0.0080.960.0080.83
Dark Tone0.0040.690.0284.37
GlossyLight Tone0.0191.780.0130.99
Middle Tone0.0141.390.0081.05
Dark Tone0.0041.480.0072.70
Water ColourLight Tone0.0161.260.0111.09
Middle Tone0.0090.990.0060.89
Dark Tone0.0050.920.0608.00