Simulation Model to Estimate Emotions in Collaborative Networks


Abstract
:1. Introduction
2. C-EMO Modelling Framework
- CNE (collaborative network emotion) which is the “emotion” that represents the collaborative network participants’ “feelings” and comprises the types of emotion that are “felt” by individual members and by the CN as a whole;
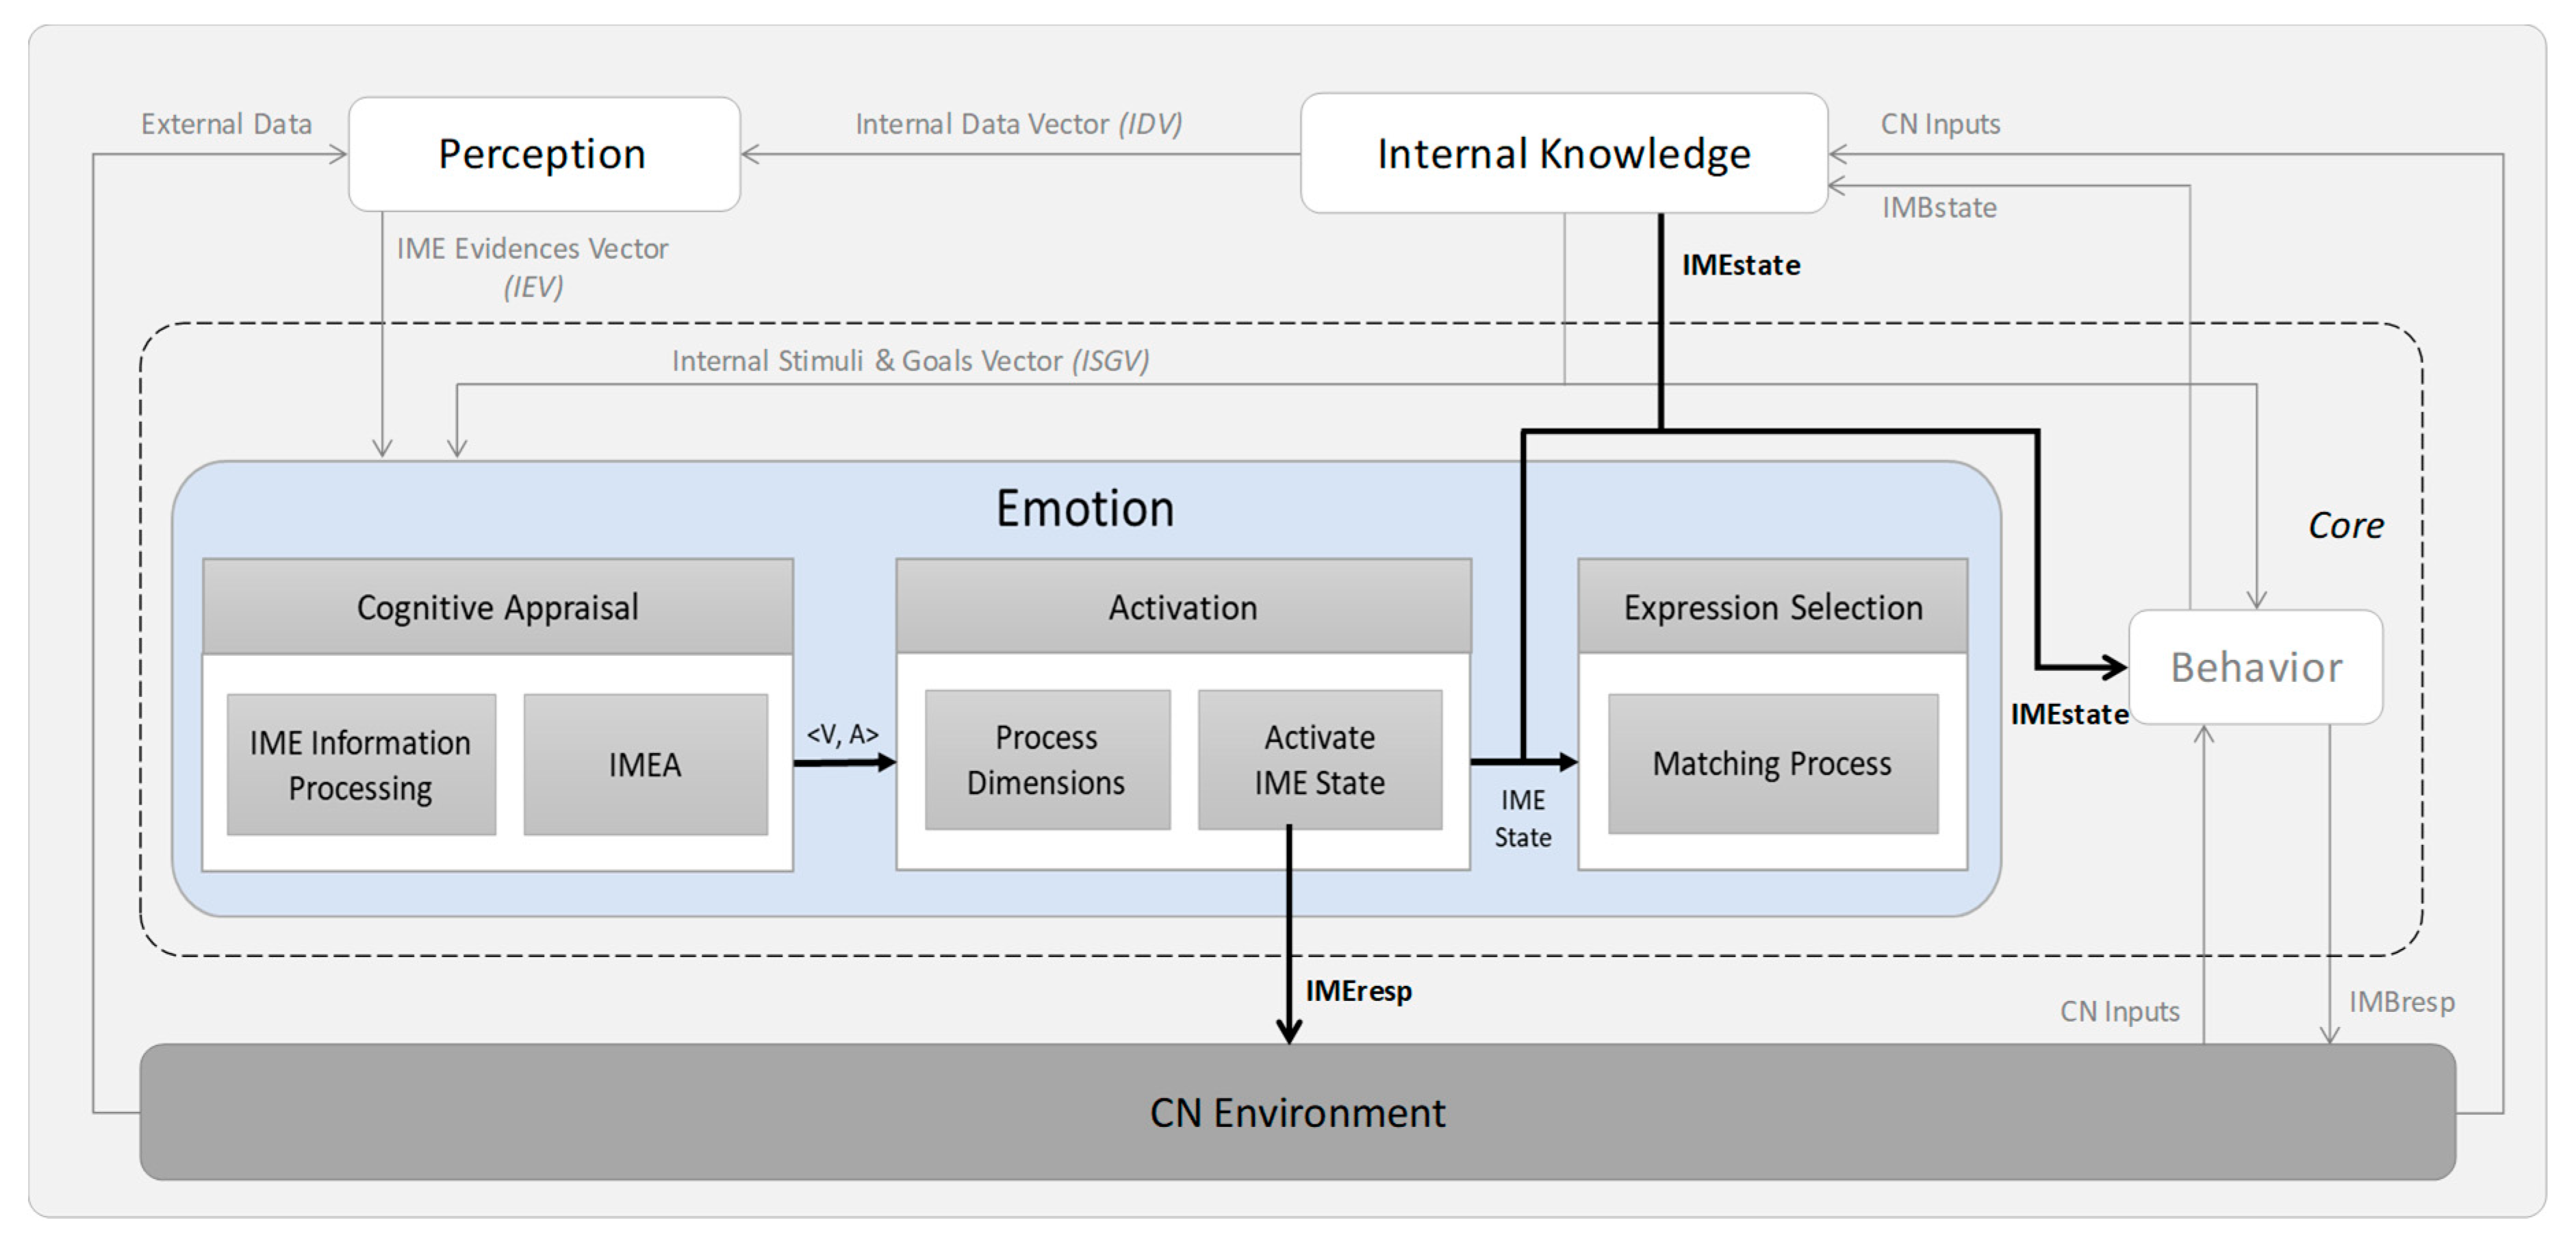
- IME (individual member emotion) which is defined as the emotion that is “felt” by each CN member as a result of its expectations of the CN, the dynamics of its interactions and collaboration, and the influence of the aggregated network emotion; and
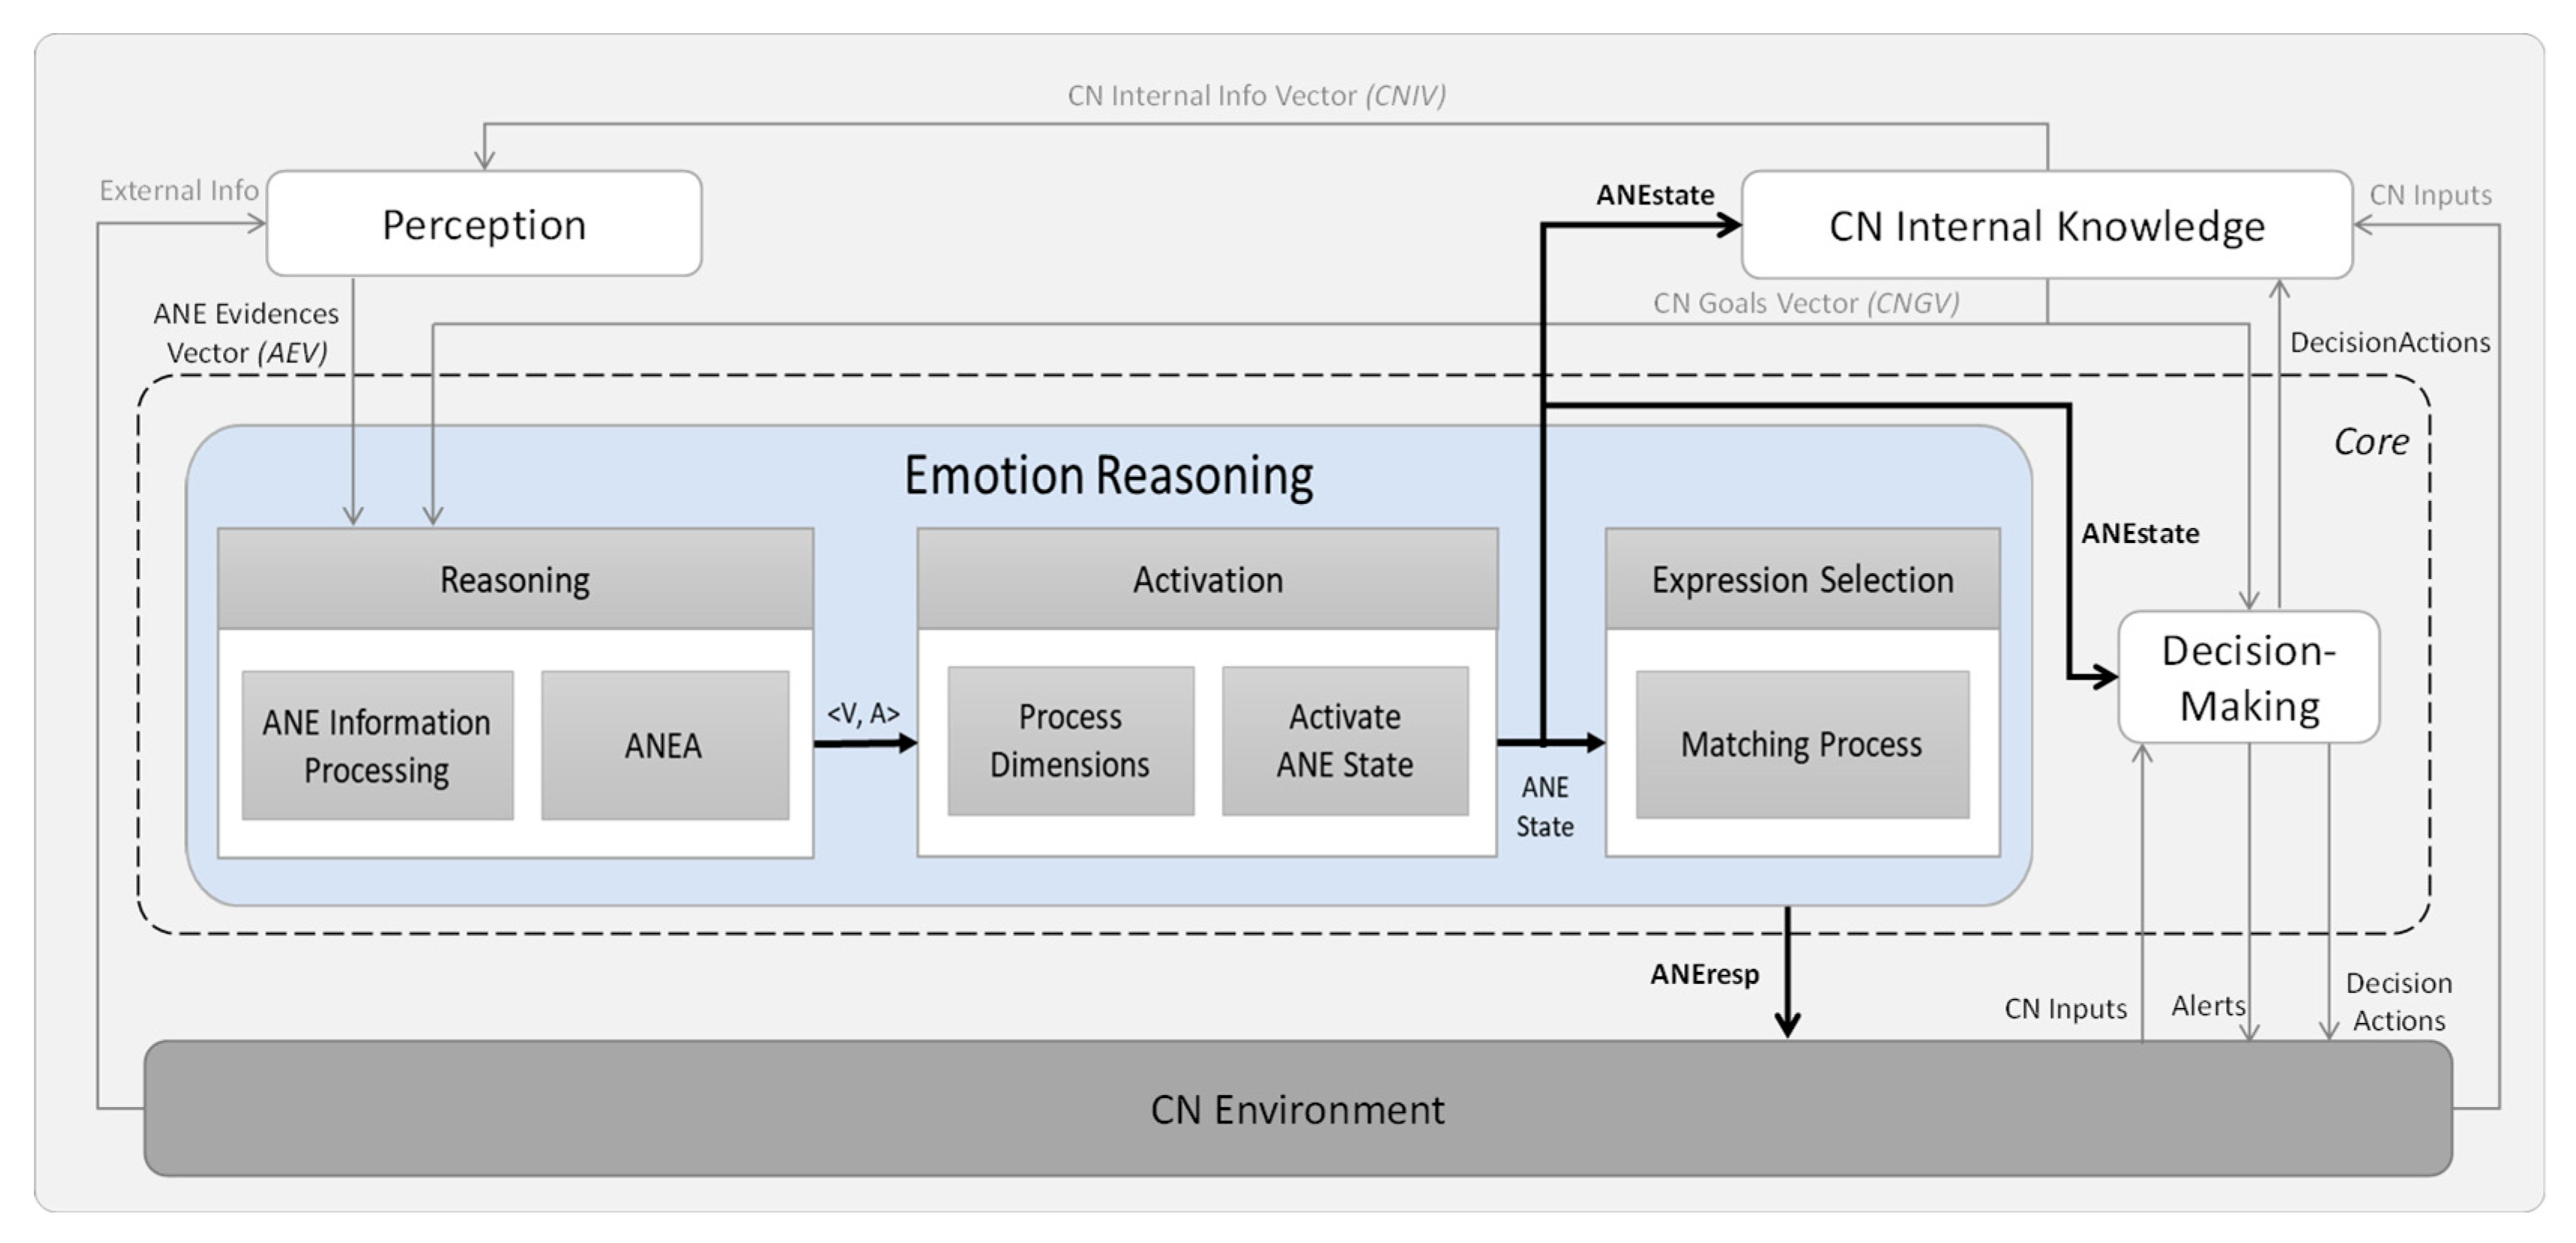
- ANE (aggregated network emotion) which is defined as the emotion that is “felt” by the collaborative network as a whole and that results from the influence of the CN member’s individual emotions and the dynamics of the network.
3. System Dynamics and Agent-Based Modeling and Simulation Techniques
3.1. System Dynamics
3.2. Agent-Based
3.3. Modeling and Simulation Tools
4. Simulation Modeling for CN Emotion Appraisal
4.1. IMEA SD Model
4.1.1. Definition of Variables
4.1.2. Causal Loop Diagram
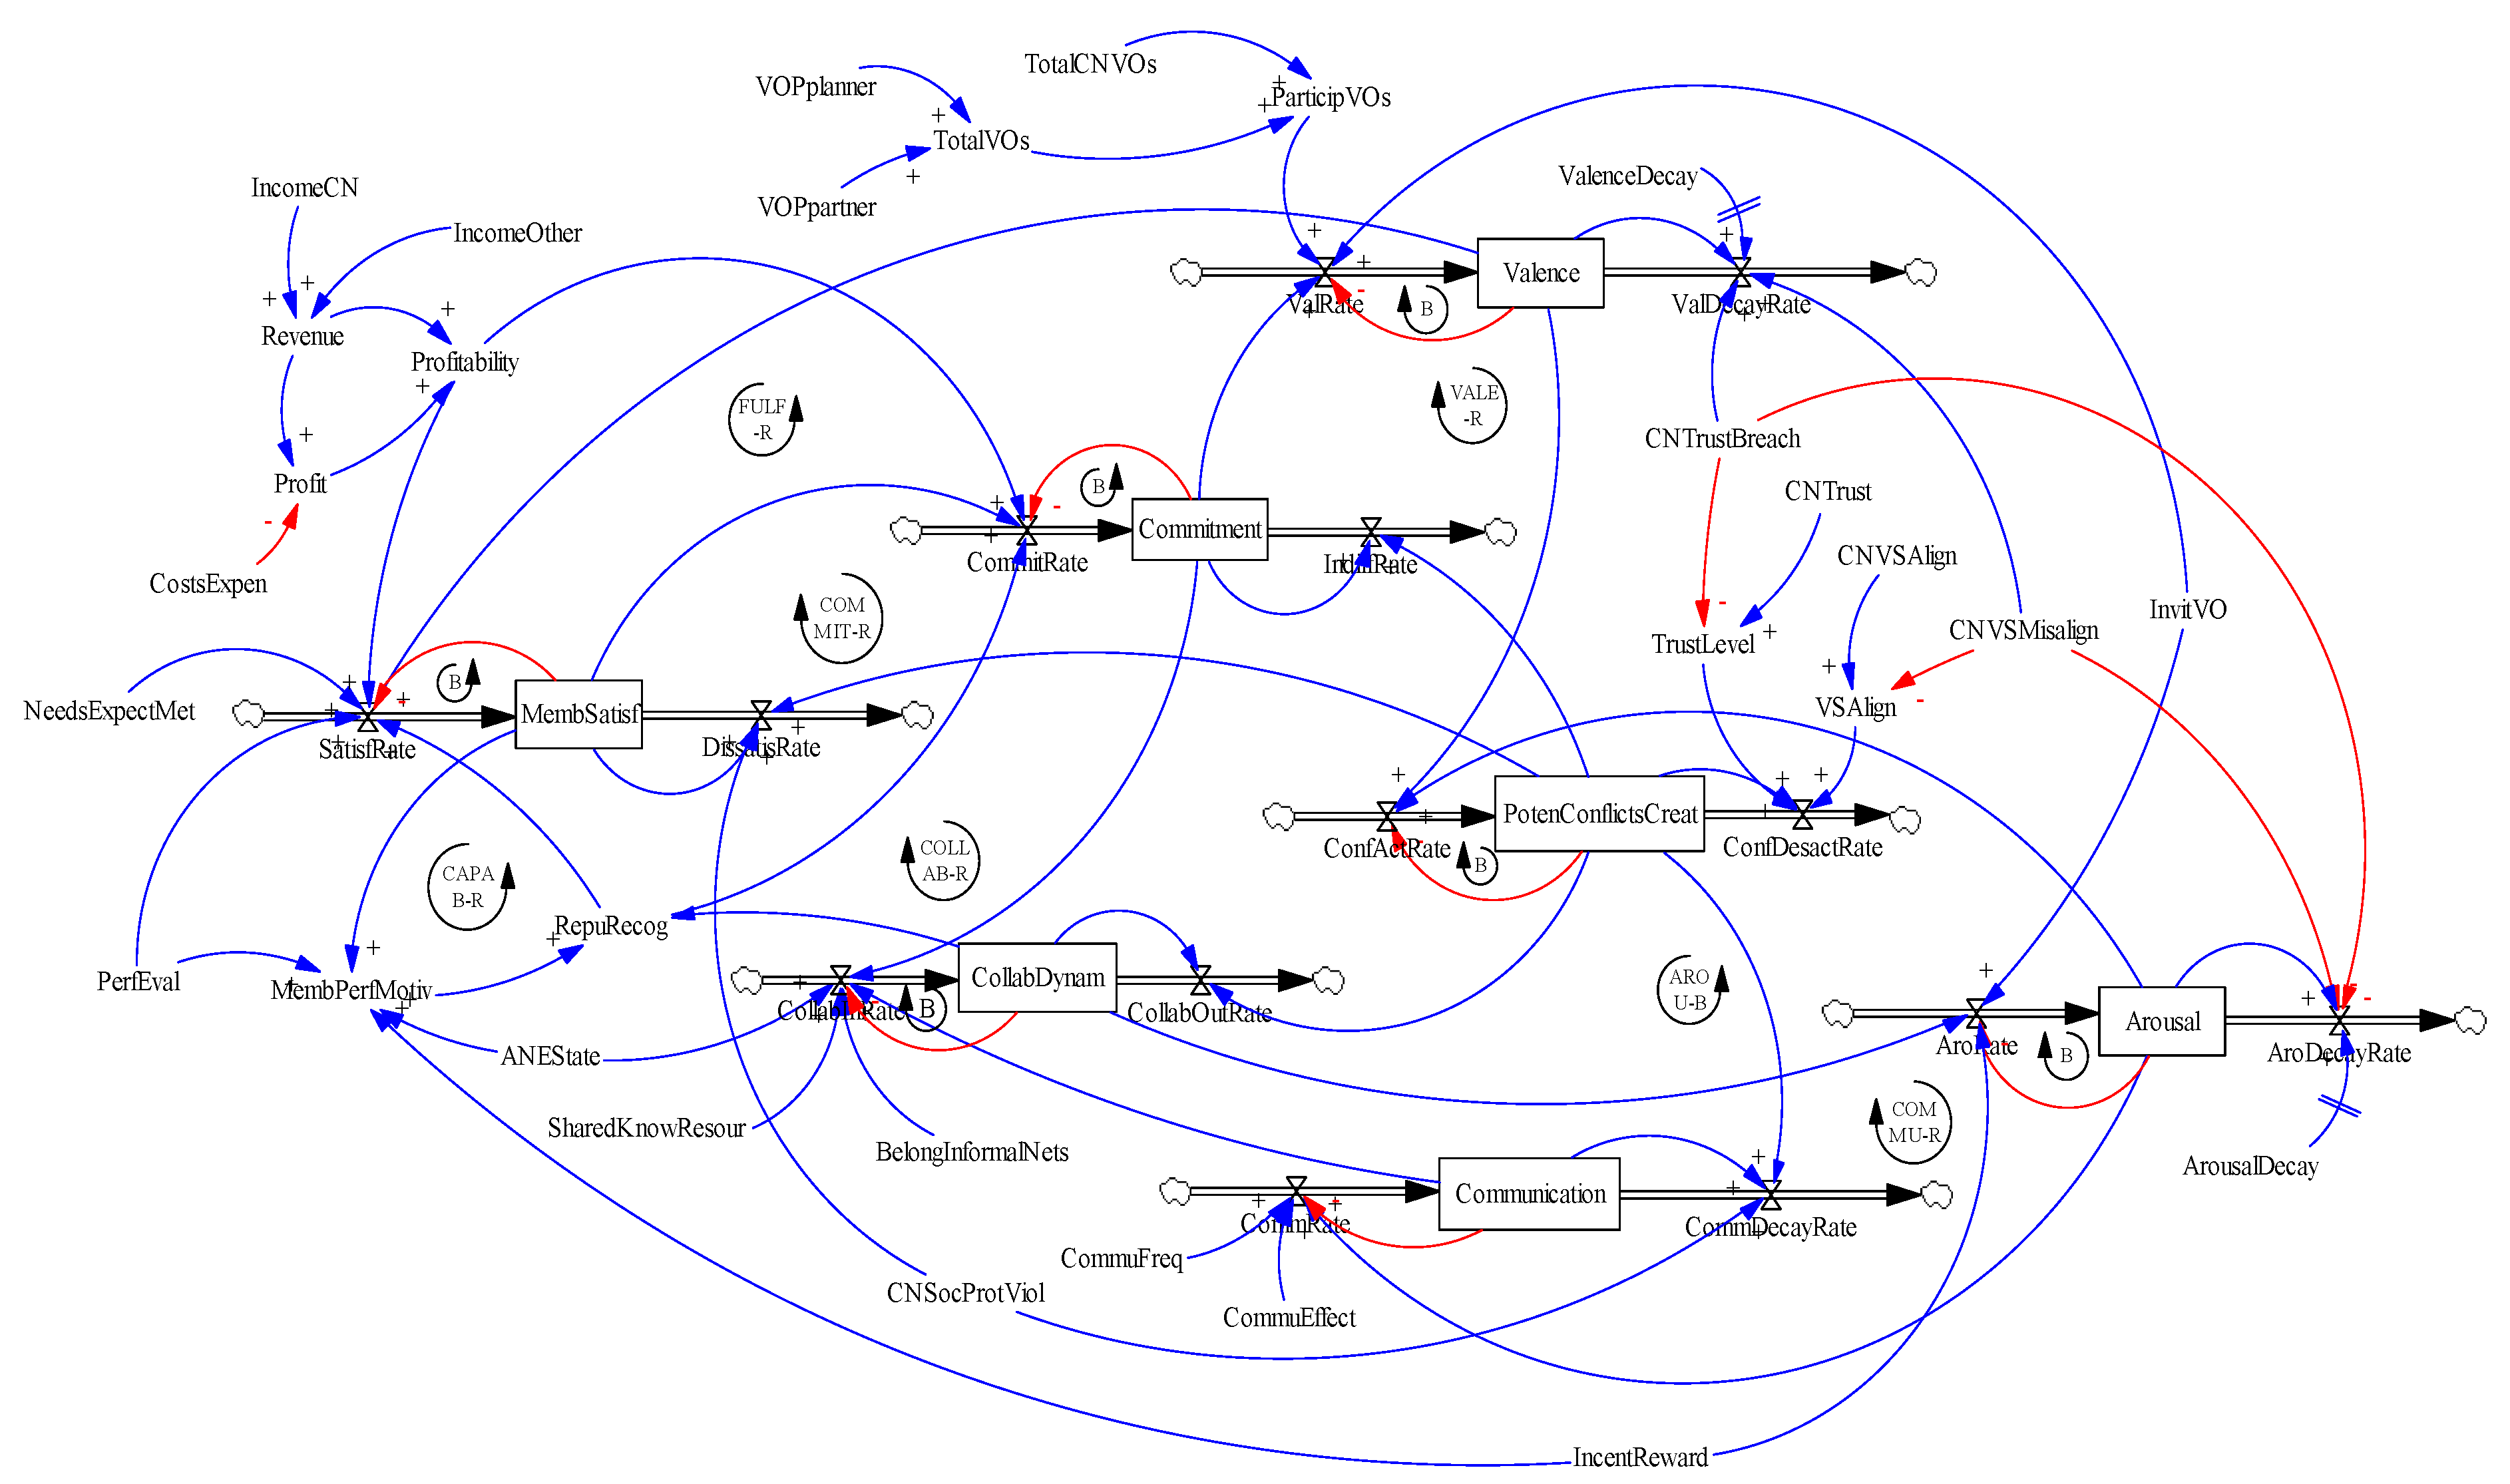
4.1.3. Stocks and Flows Diagram
Stock and Flow Structure of Member Satisfaction
4.2. ANEA SD Model
4.2.1. Definition of Variables
4.2.2. Causal Loop Diagram
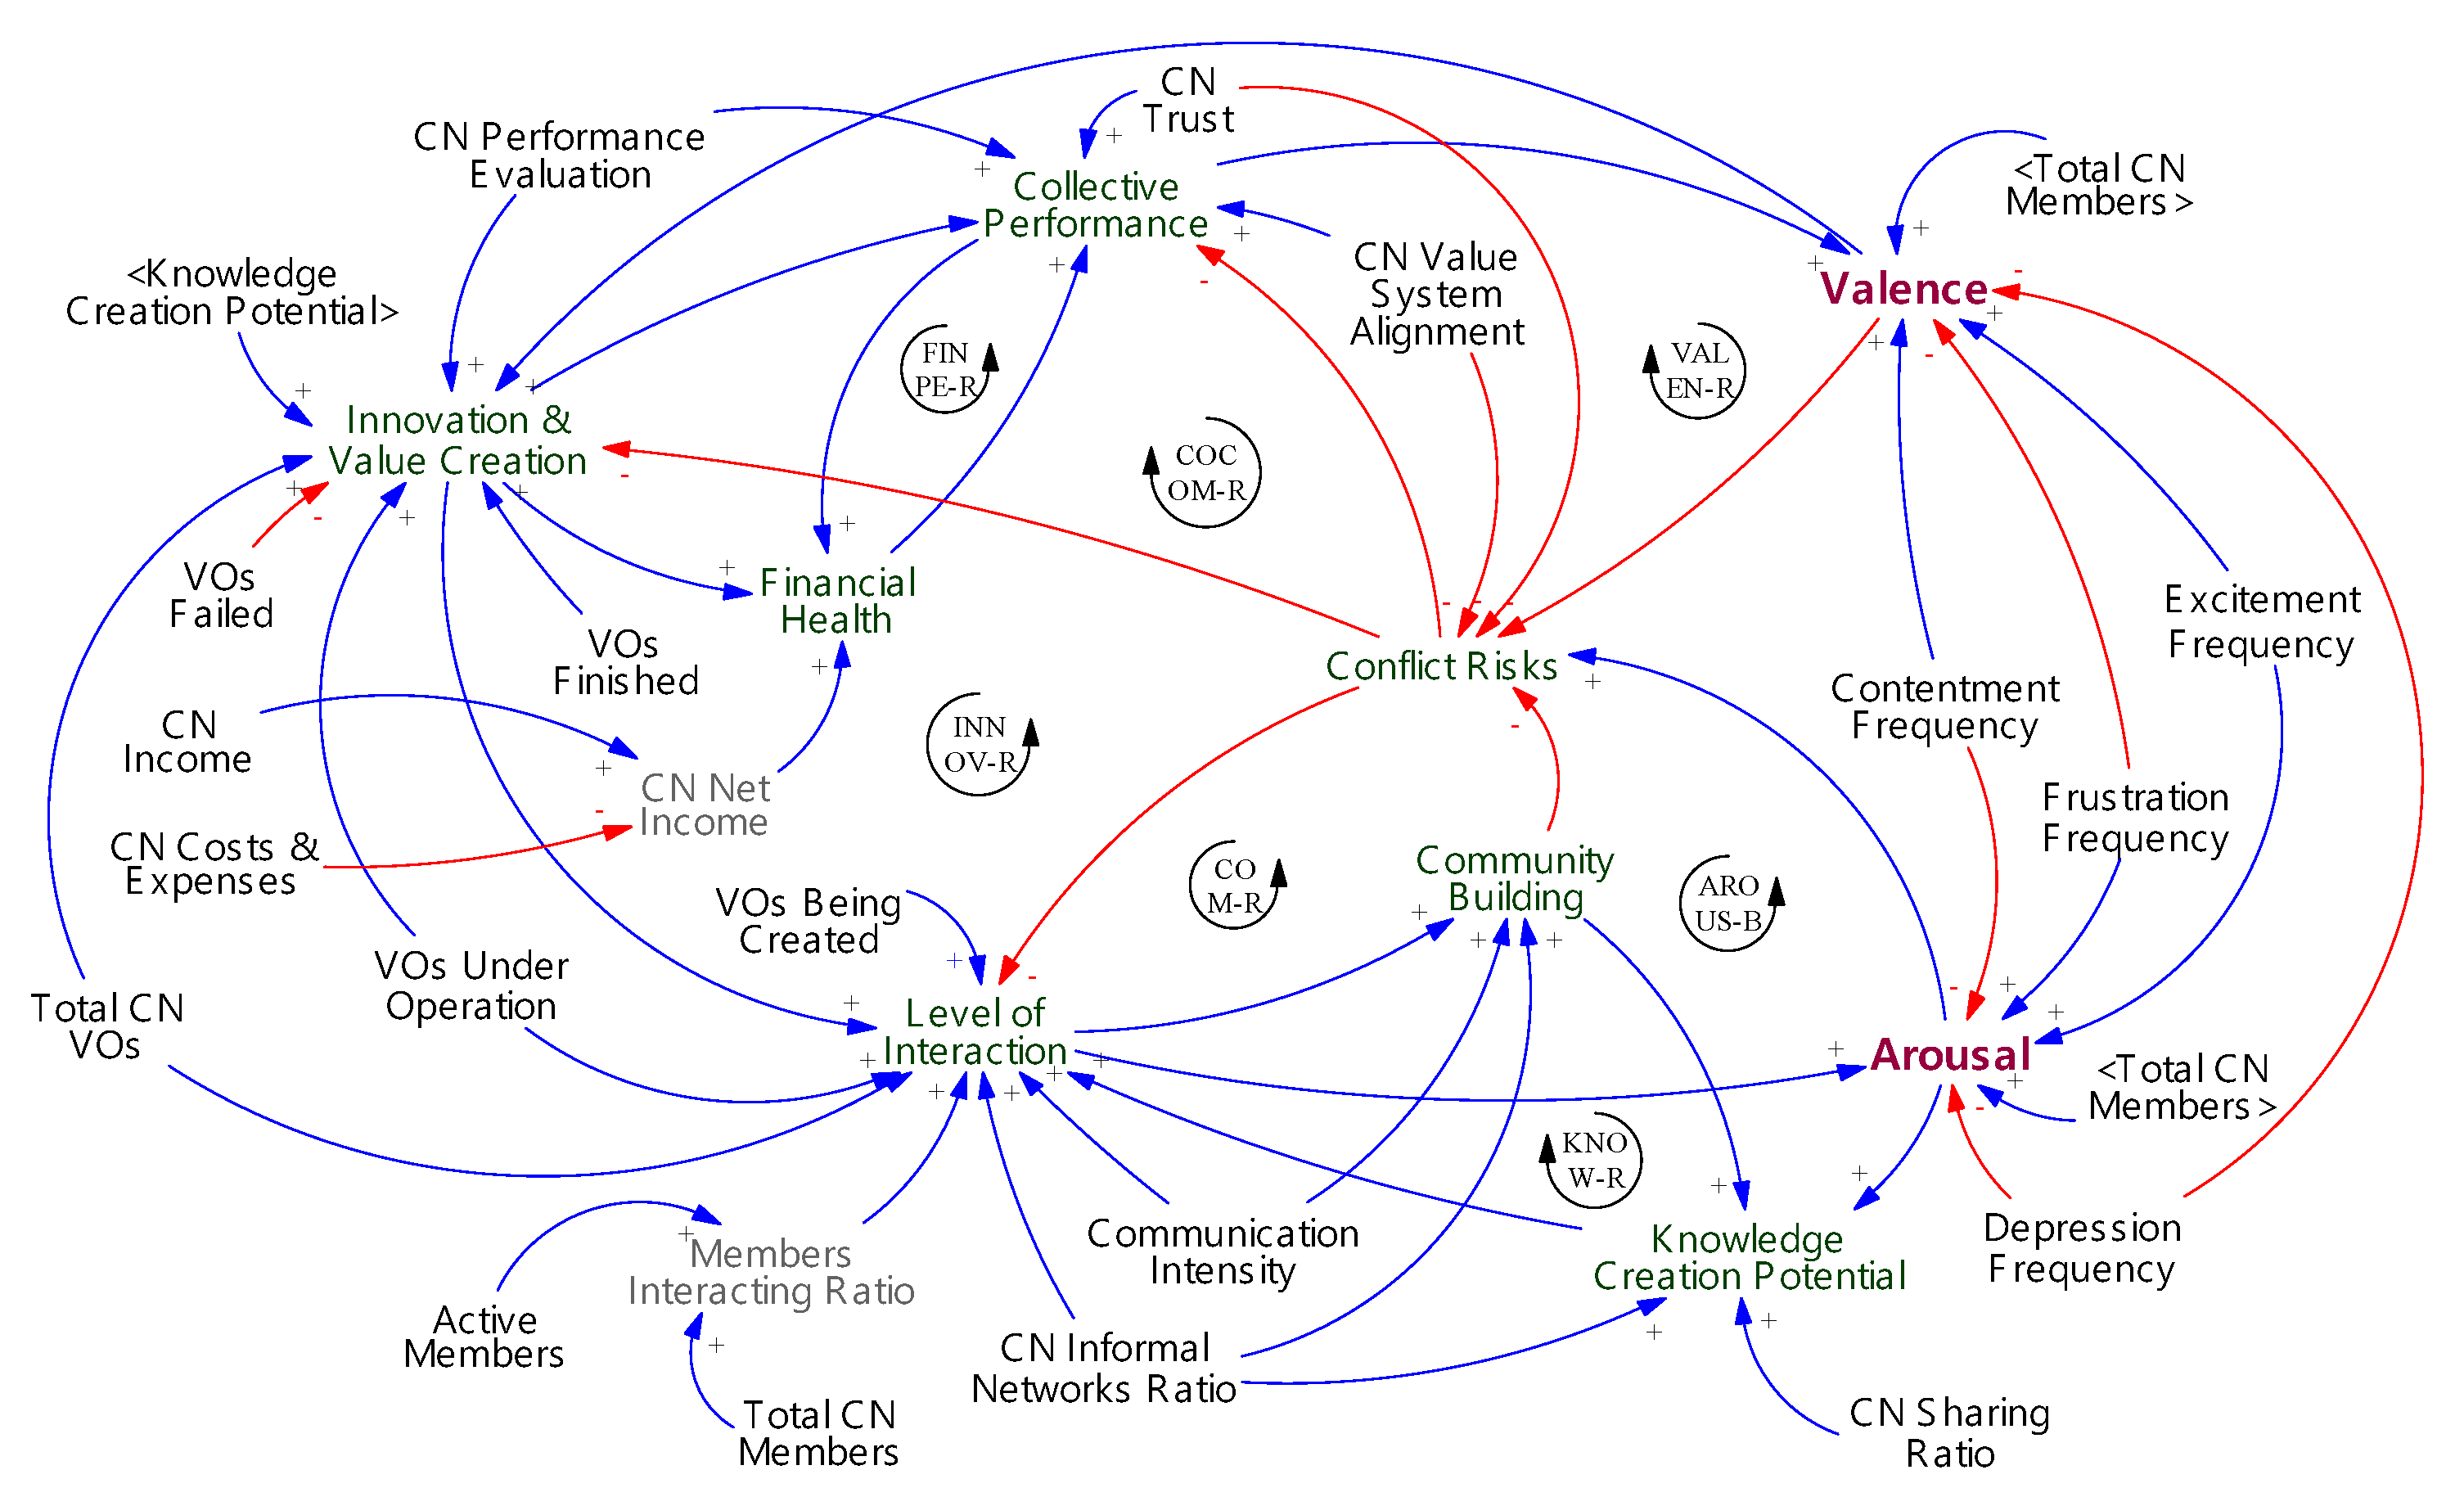
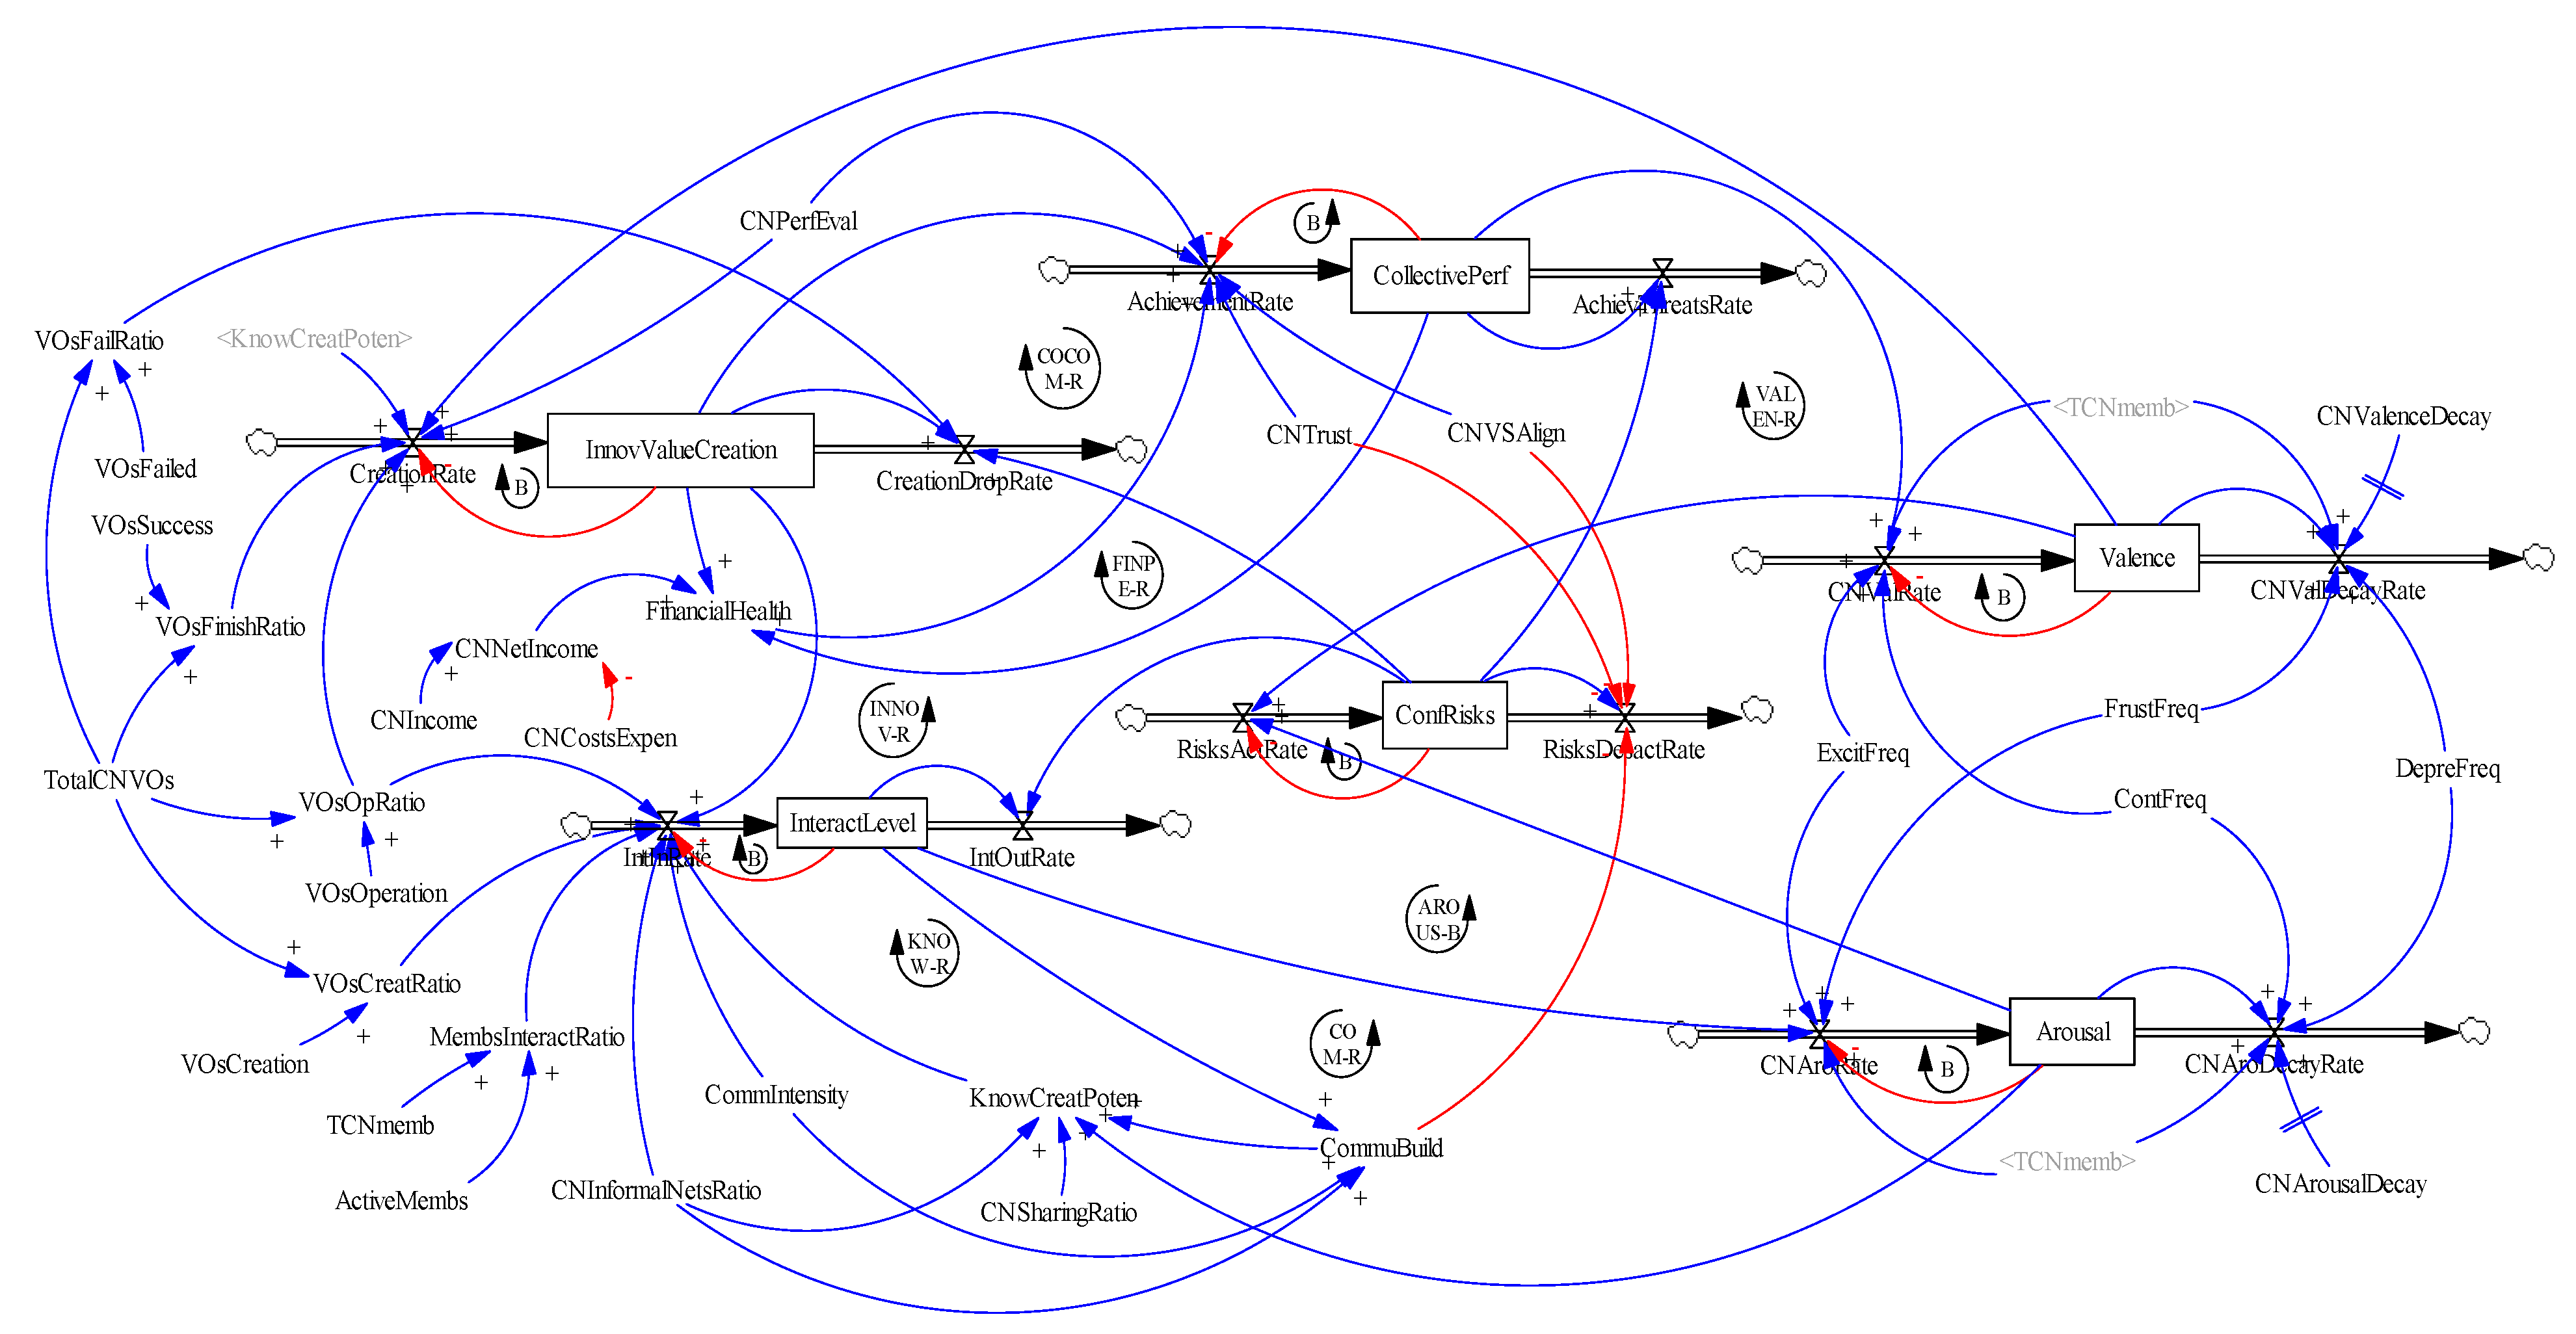
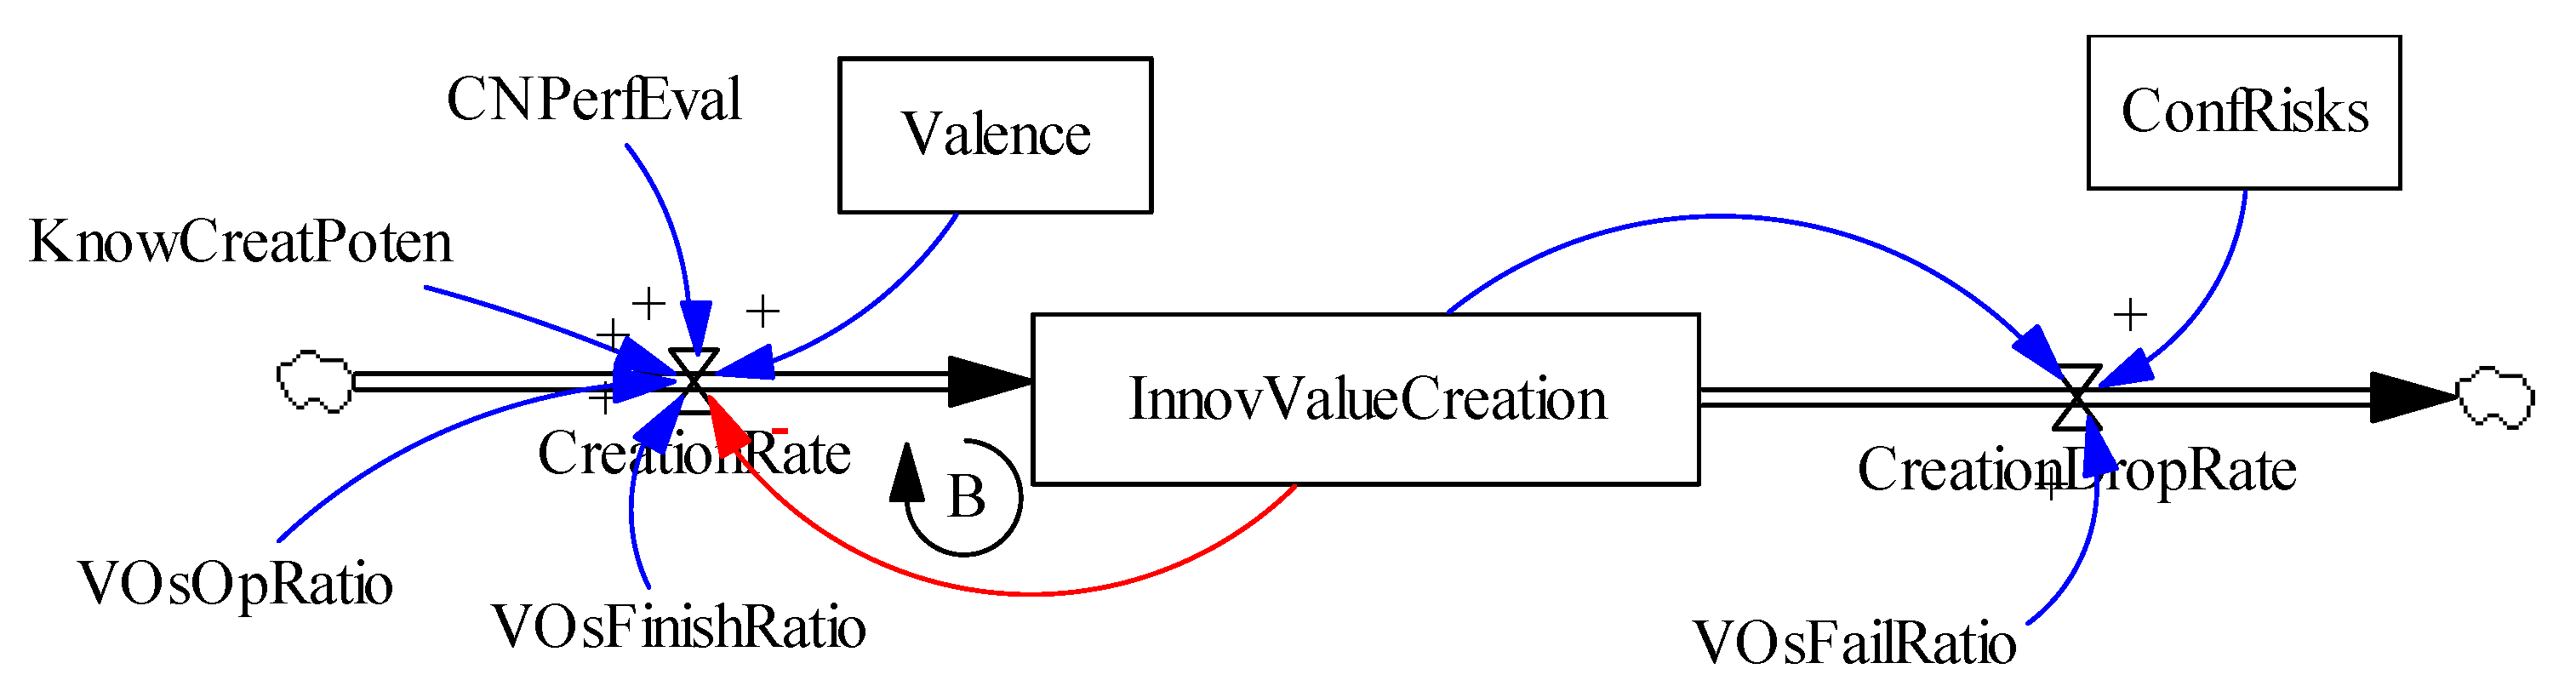
4.2.3. Stocks and Flows Diagram
Stock and Flow Structure of Innovation and Value Creation
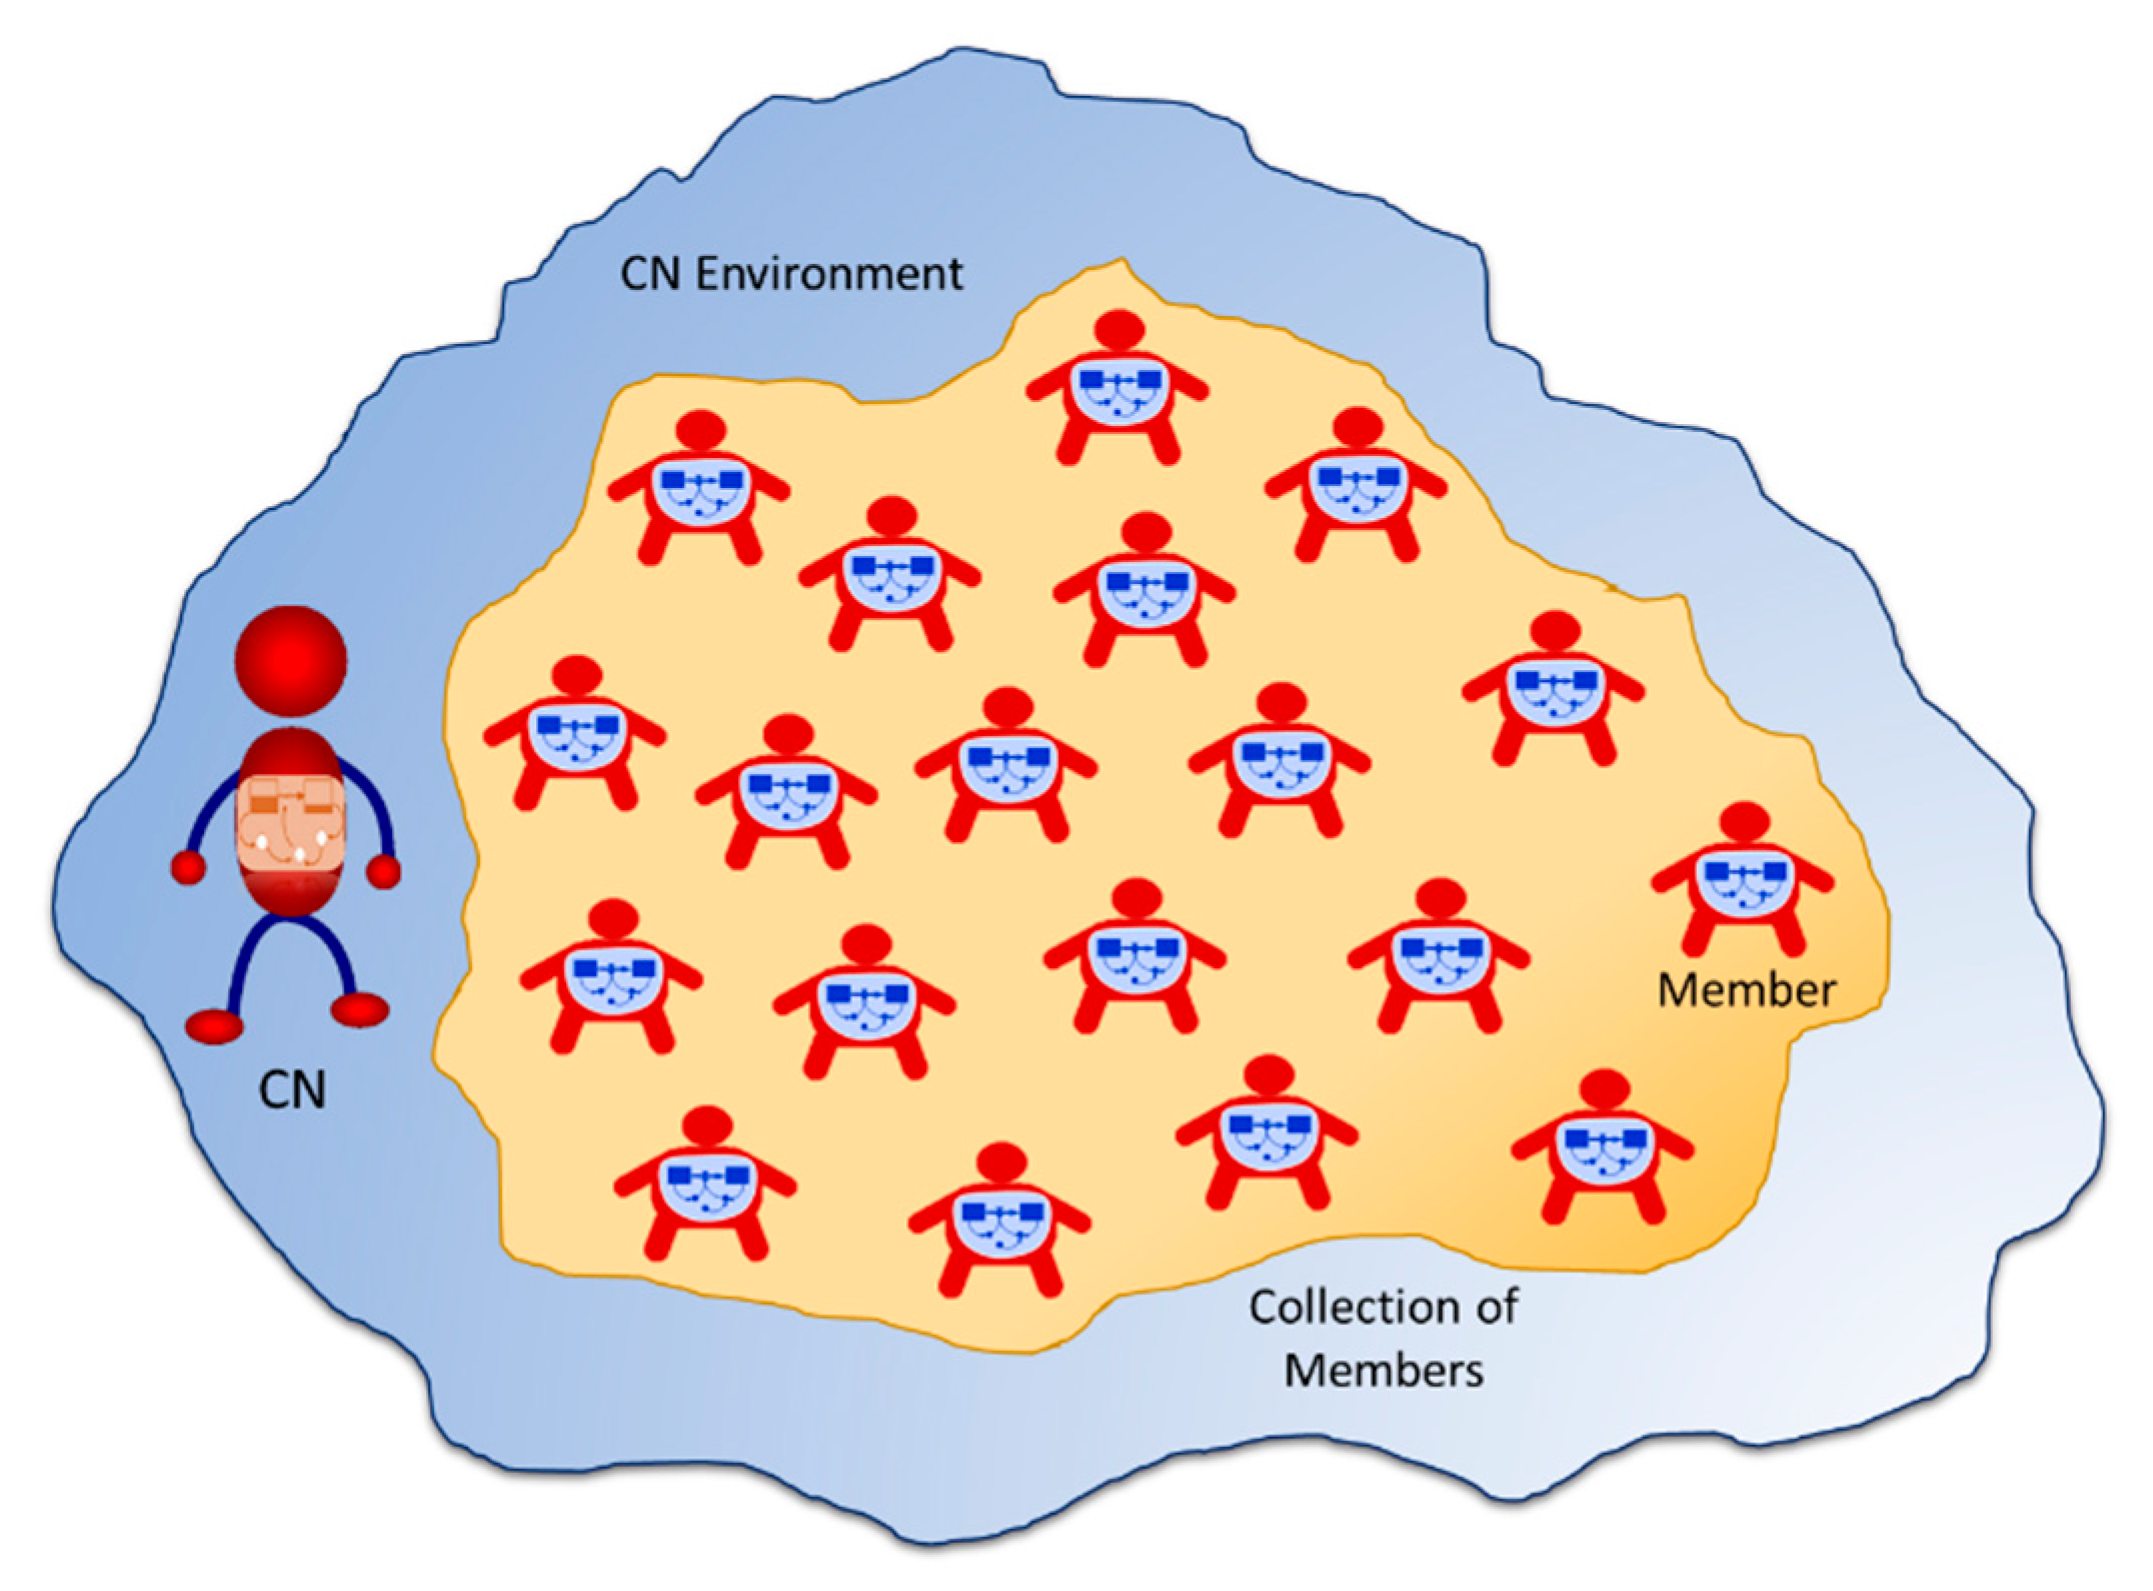
4.3. CN (Collaborative Networks) Representation with Agent-Based Modeling
- Individual modelling—each participant of the CN can be represented by an agent that has the characteristics (attributes and behaviors) needed to appraise the IME state (in the case of members) and the ANE state (in the case of the CN), the potential behavior, and the interactions with the other agents;
- Flexibility—meaning that it is possible to add or remove entities from the CN, or even change some features and characteristics of the network in order to help in simulation of a variety of scenarios;
- Data distribution—CNs are by nature distributed entities, containing distributed members with distributed data.
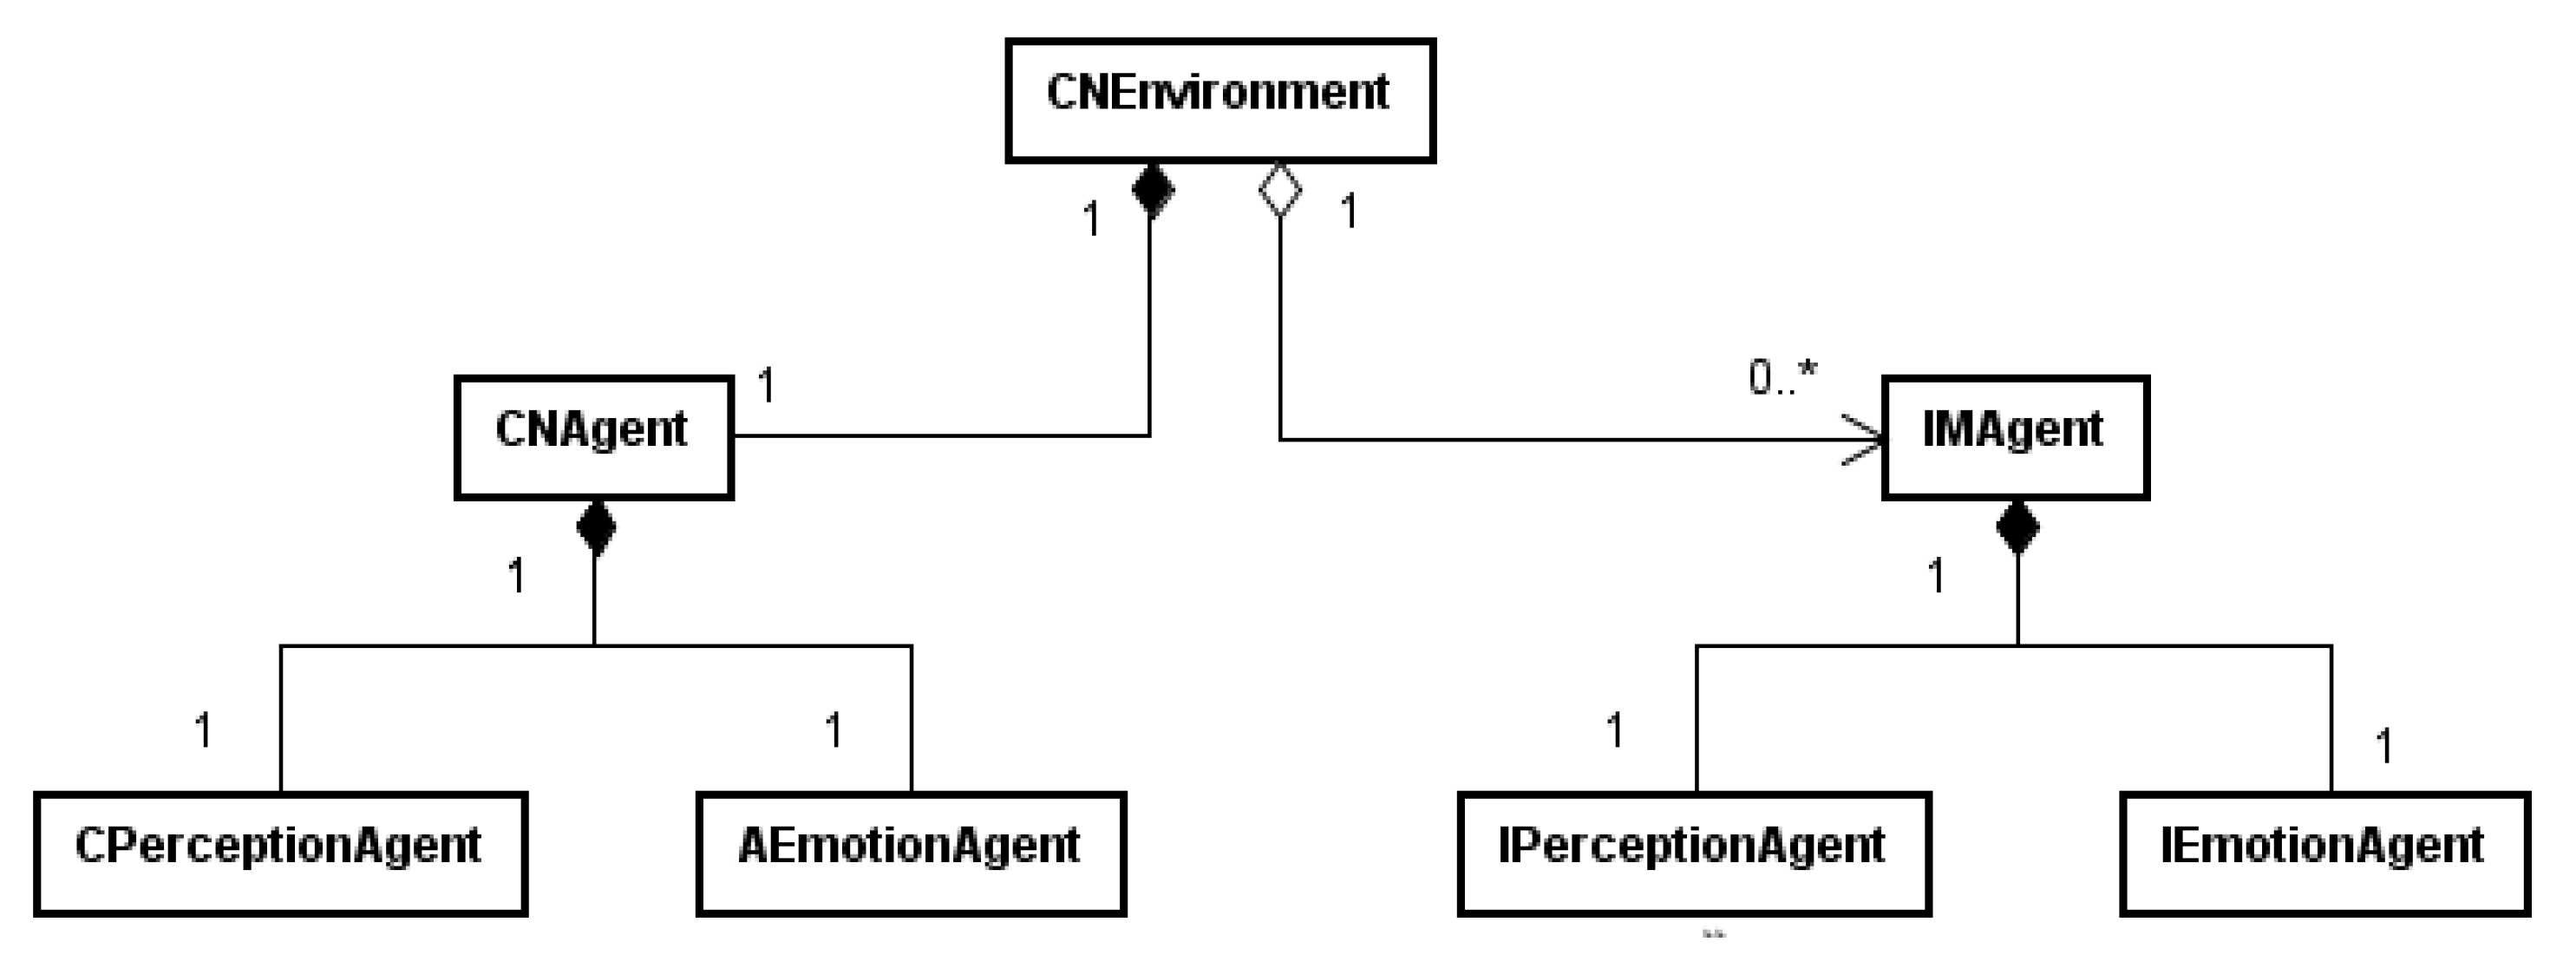
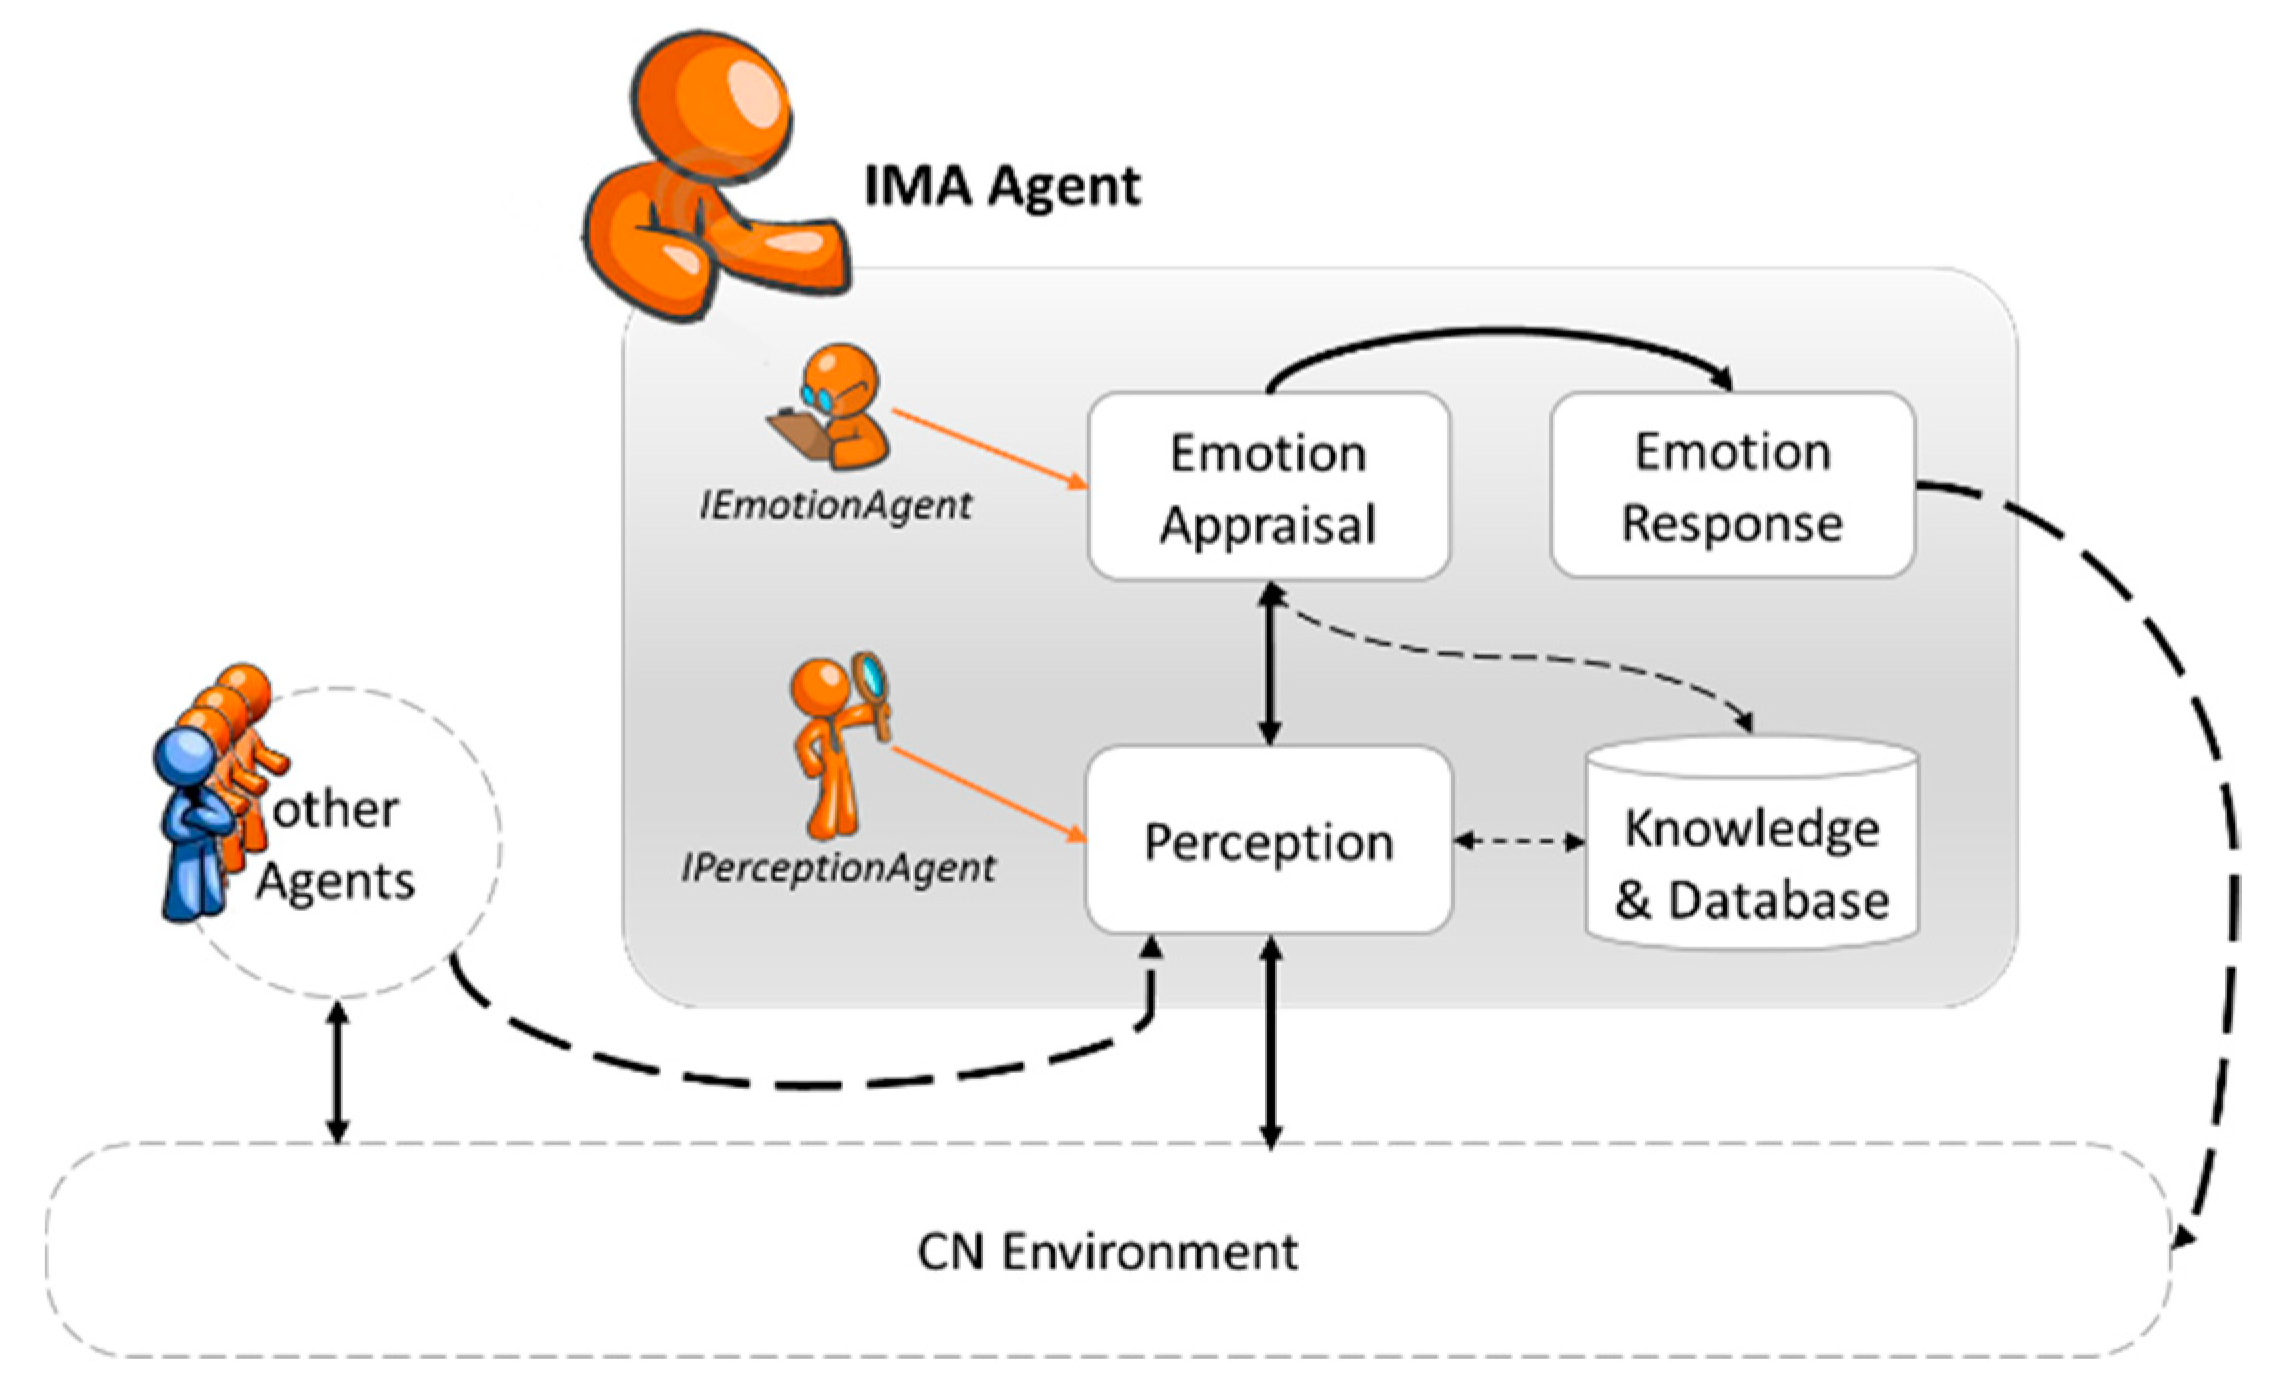
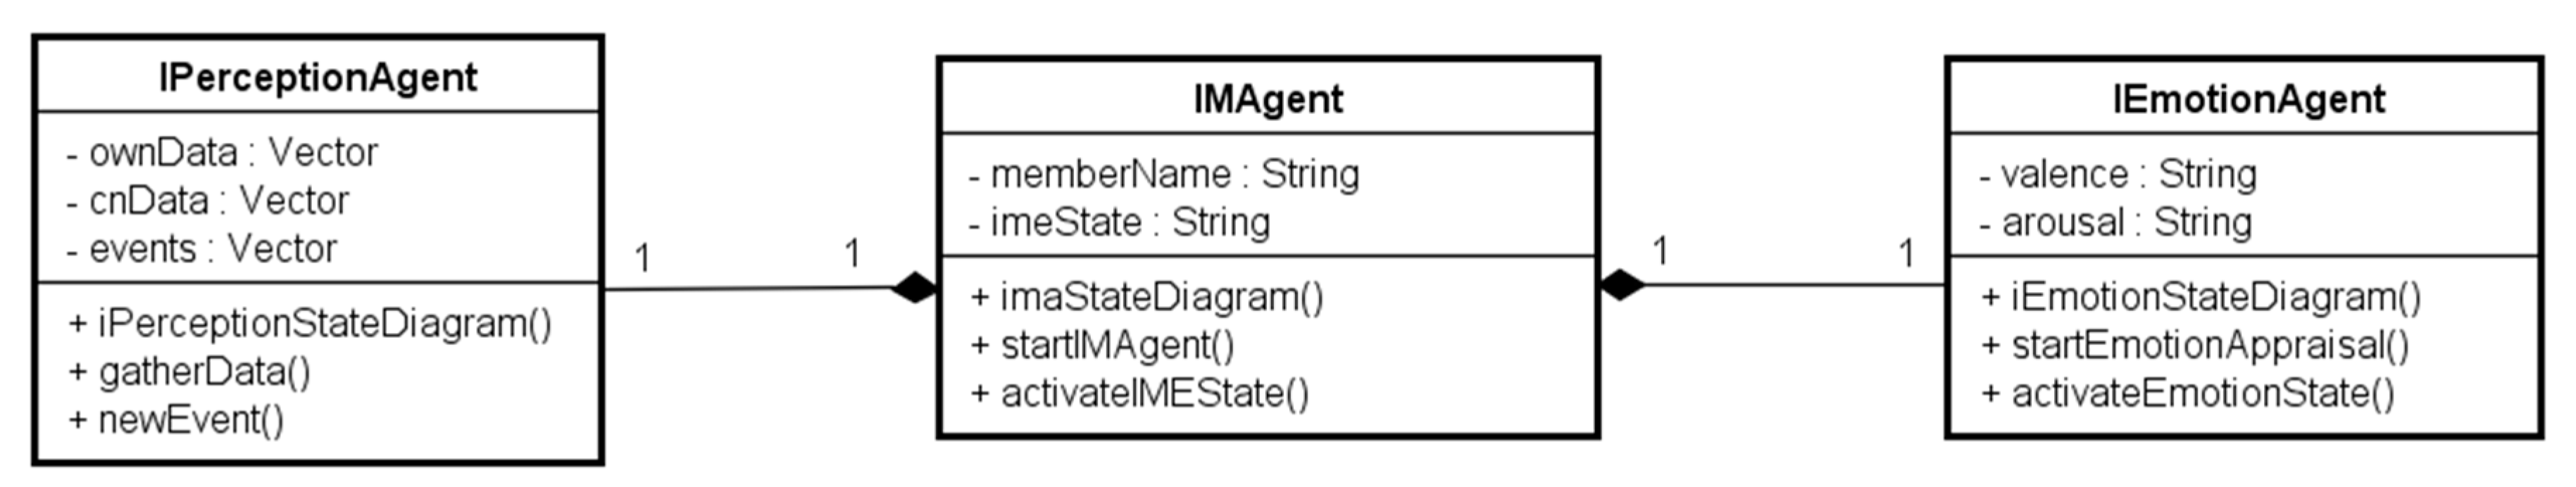
- The Individual Member Agent (IMAgent), which represents each participating individual member of the CN. This agent embeds the IME model with the IMEA SD model previously presented. It is modeled using two sub-agents: (i) IPerceptionAgent, which is the agent that is in charge of interacting with the CN environment and of collecting the data from the internal knowledge database and that creates the IME evidences vector, and (ii) IEmotionAgent, which is the agent that is responsible for the IME appraisal and where the IMEA SD model is implemented;
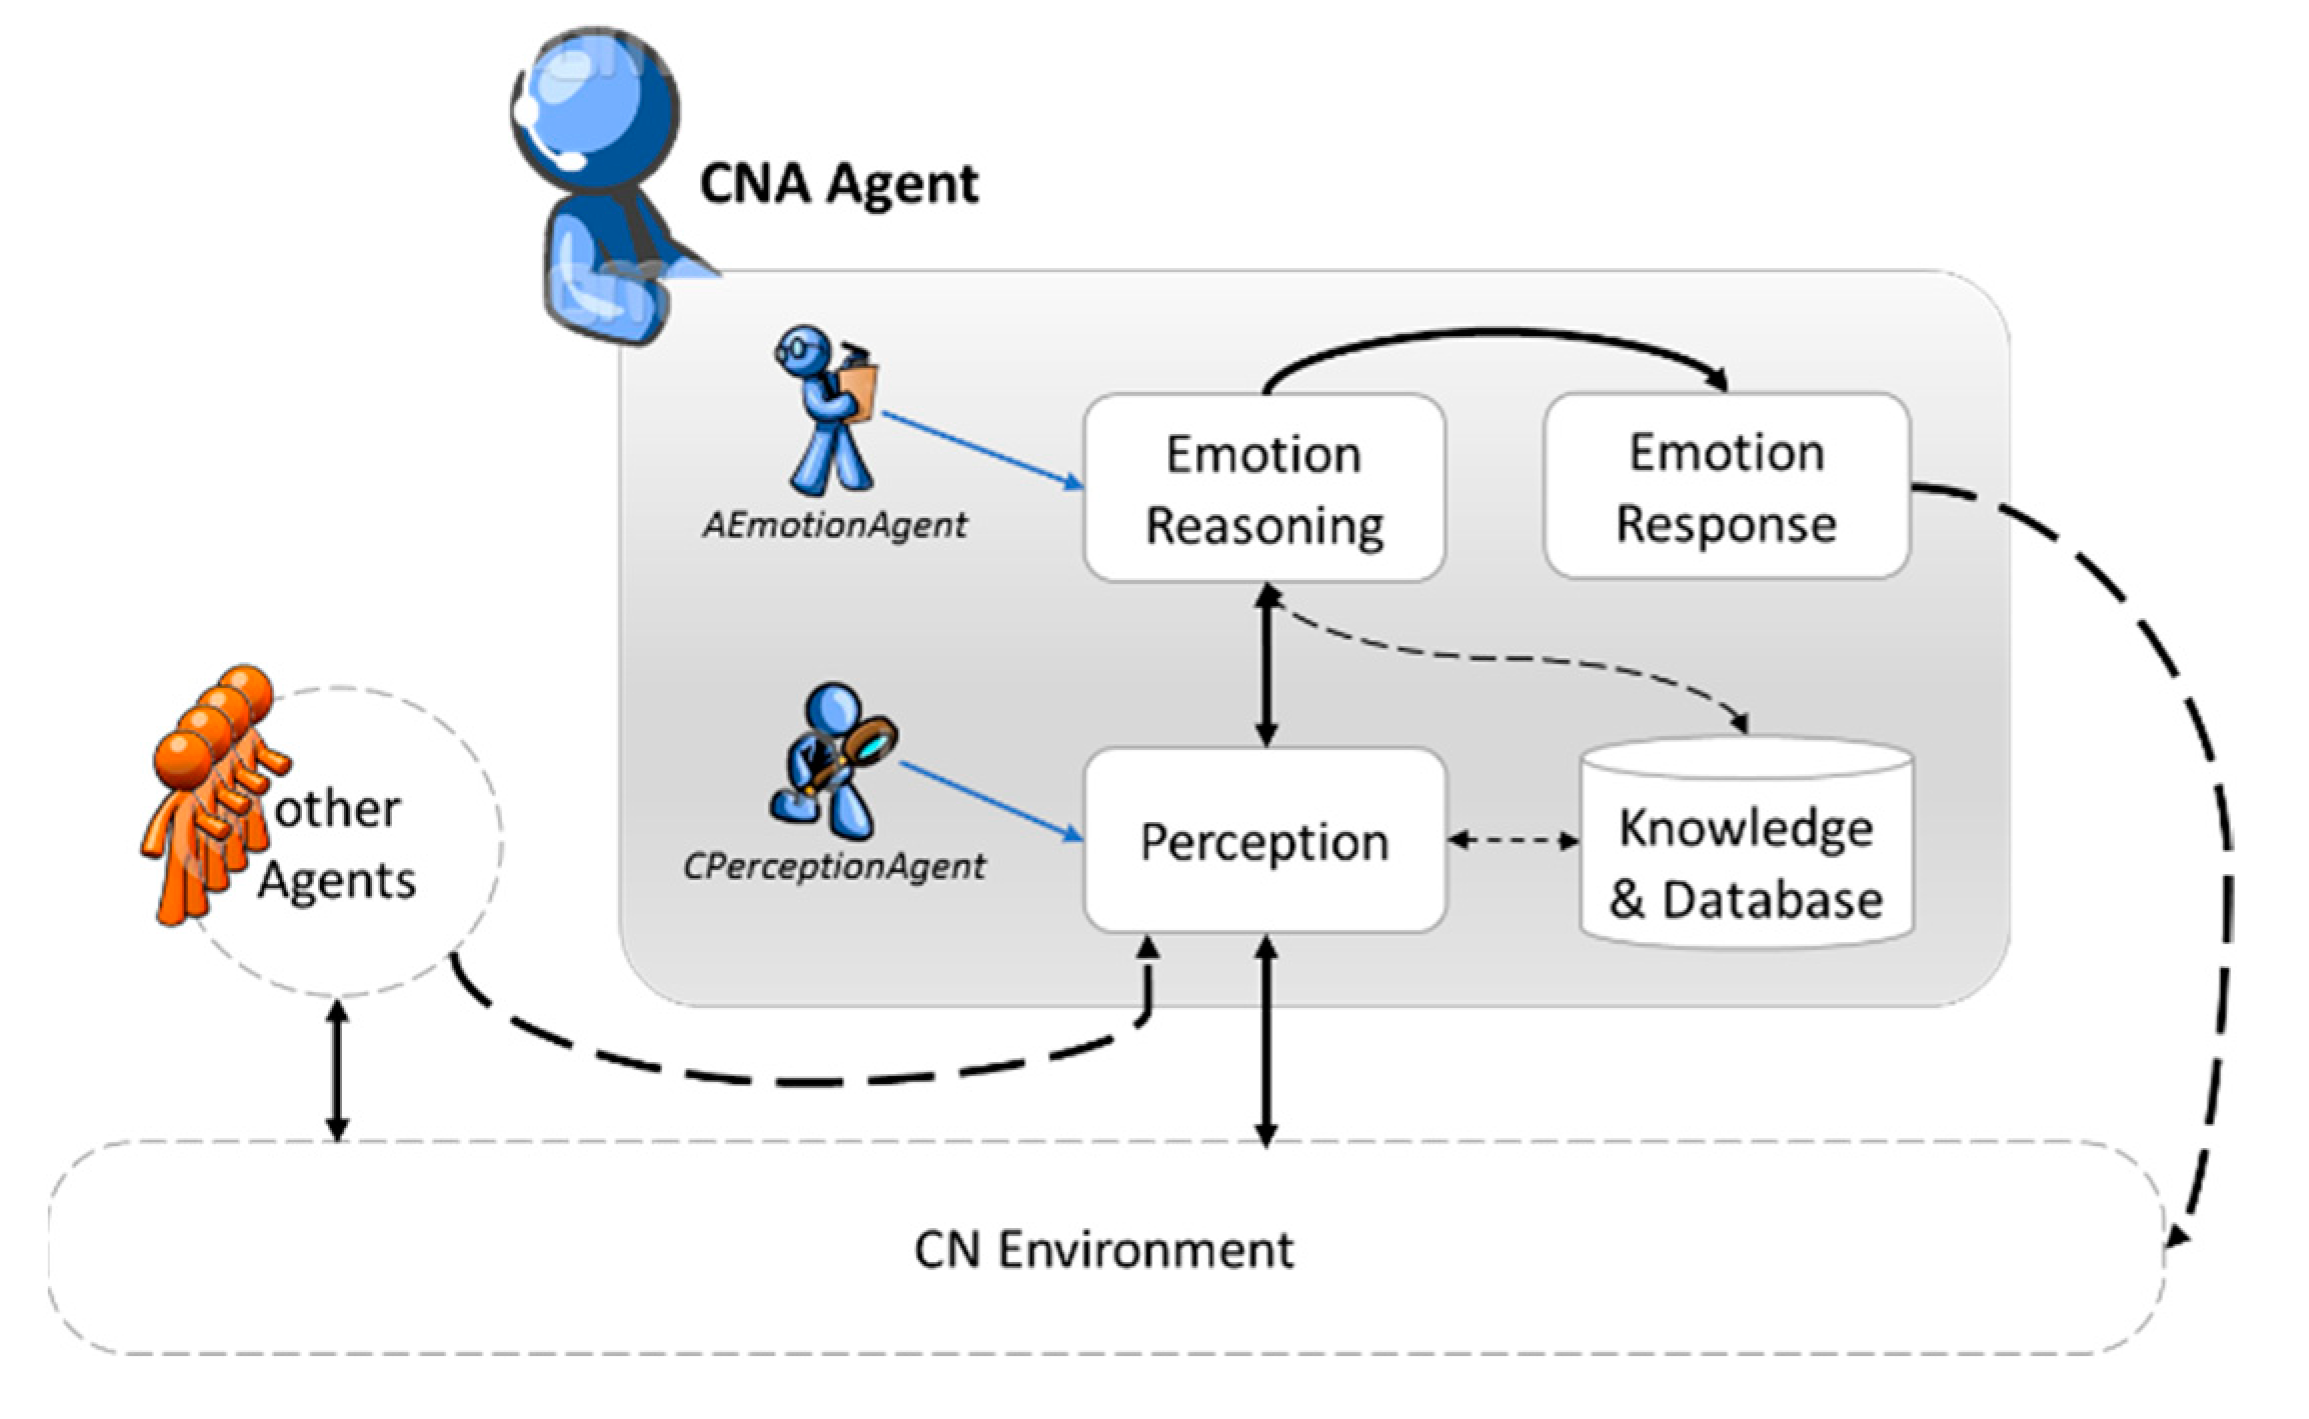
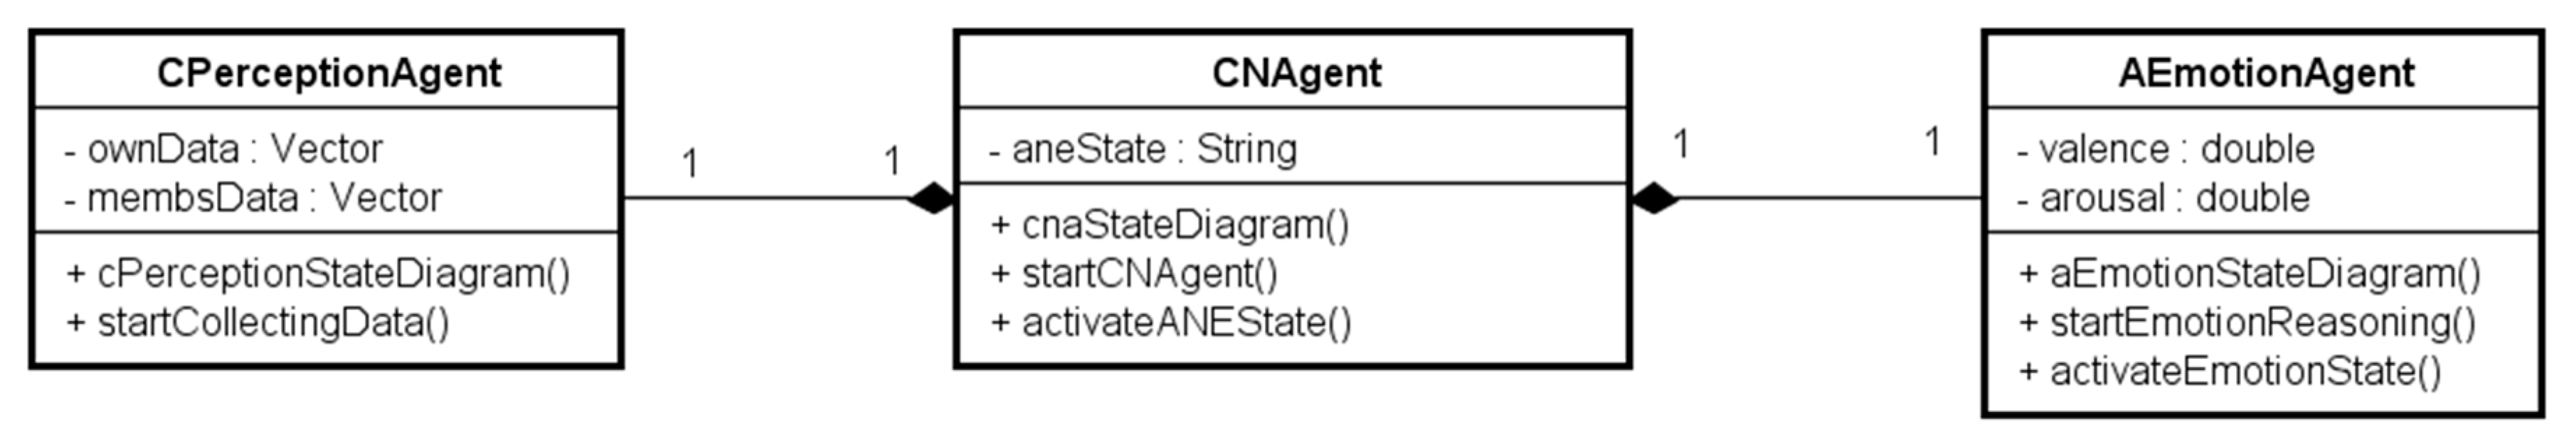
- The CN Agent (CNAgent), which represents the CN’s emotion management system. It also embeds the ANE model with the ANEA SD model presented before. It is modeled also using two sub-agents: (i) CPerceptionAgent, which is the agent that is in charge of interacting with the CN environment and of collecting the data from the internal knowledge database and that creates the ANE evidences vector, and (ii) AEmotionAgent, which is the agent responsible for the ANE estimation and where the ANEA SD model is implemented;
- The CN Environment (CNEnvironment), which represents the CN itself, the CN agent and the collection of IMA agents that belong to the CN.
4.3.1. Individual Member Agent
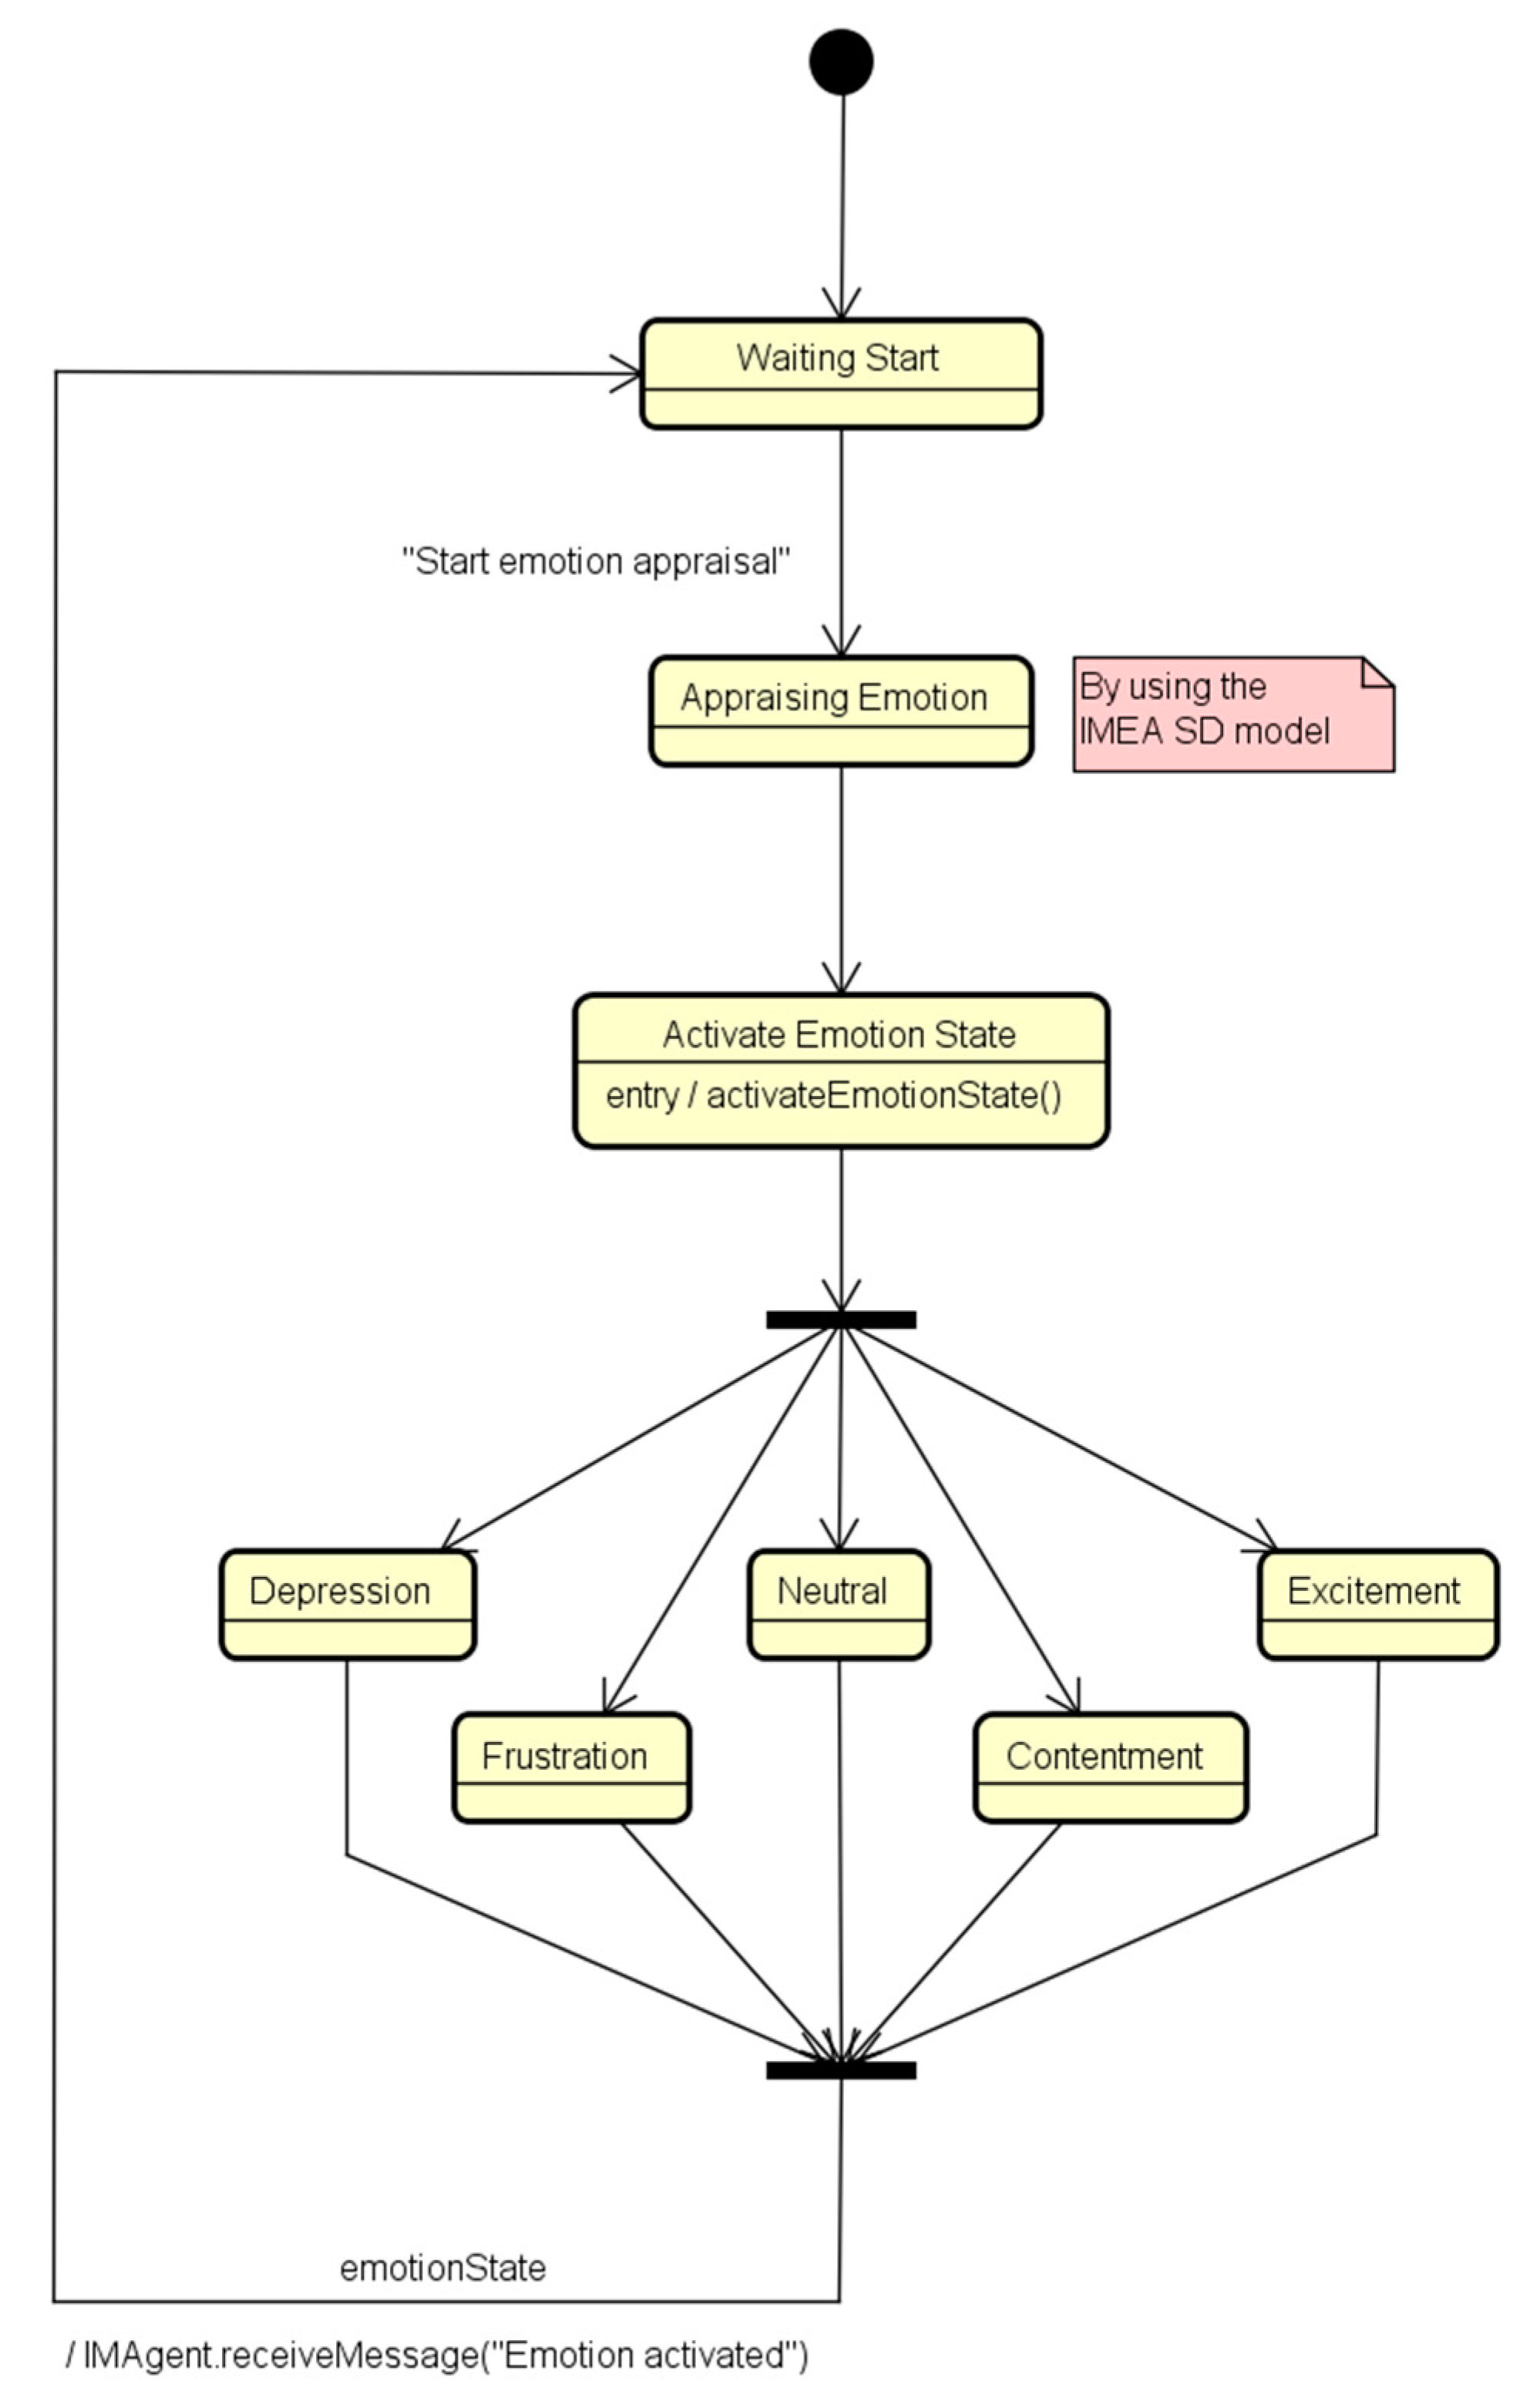
- The IEmotionAgent remains in the “waiting” state until receiving the triggering message “Start emotion appraisal”;
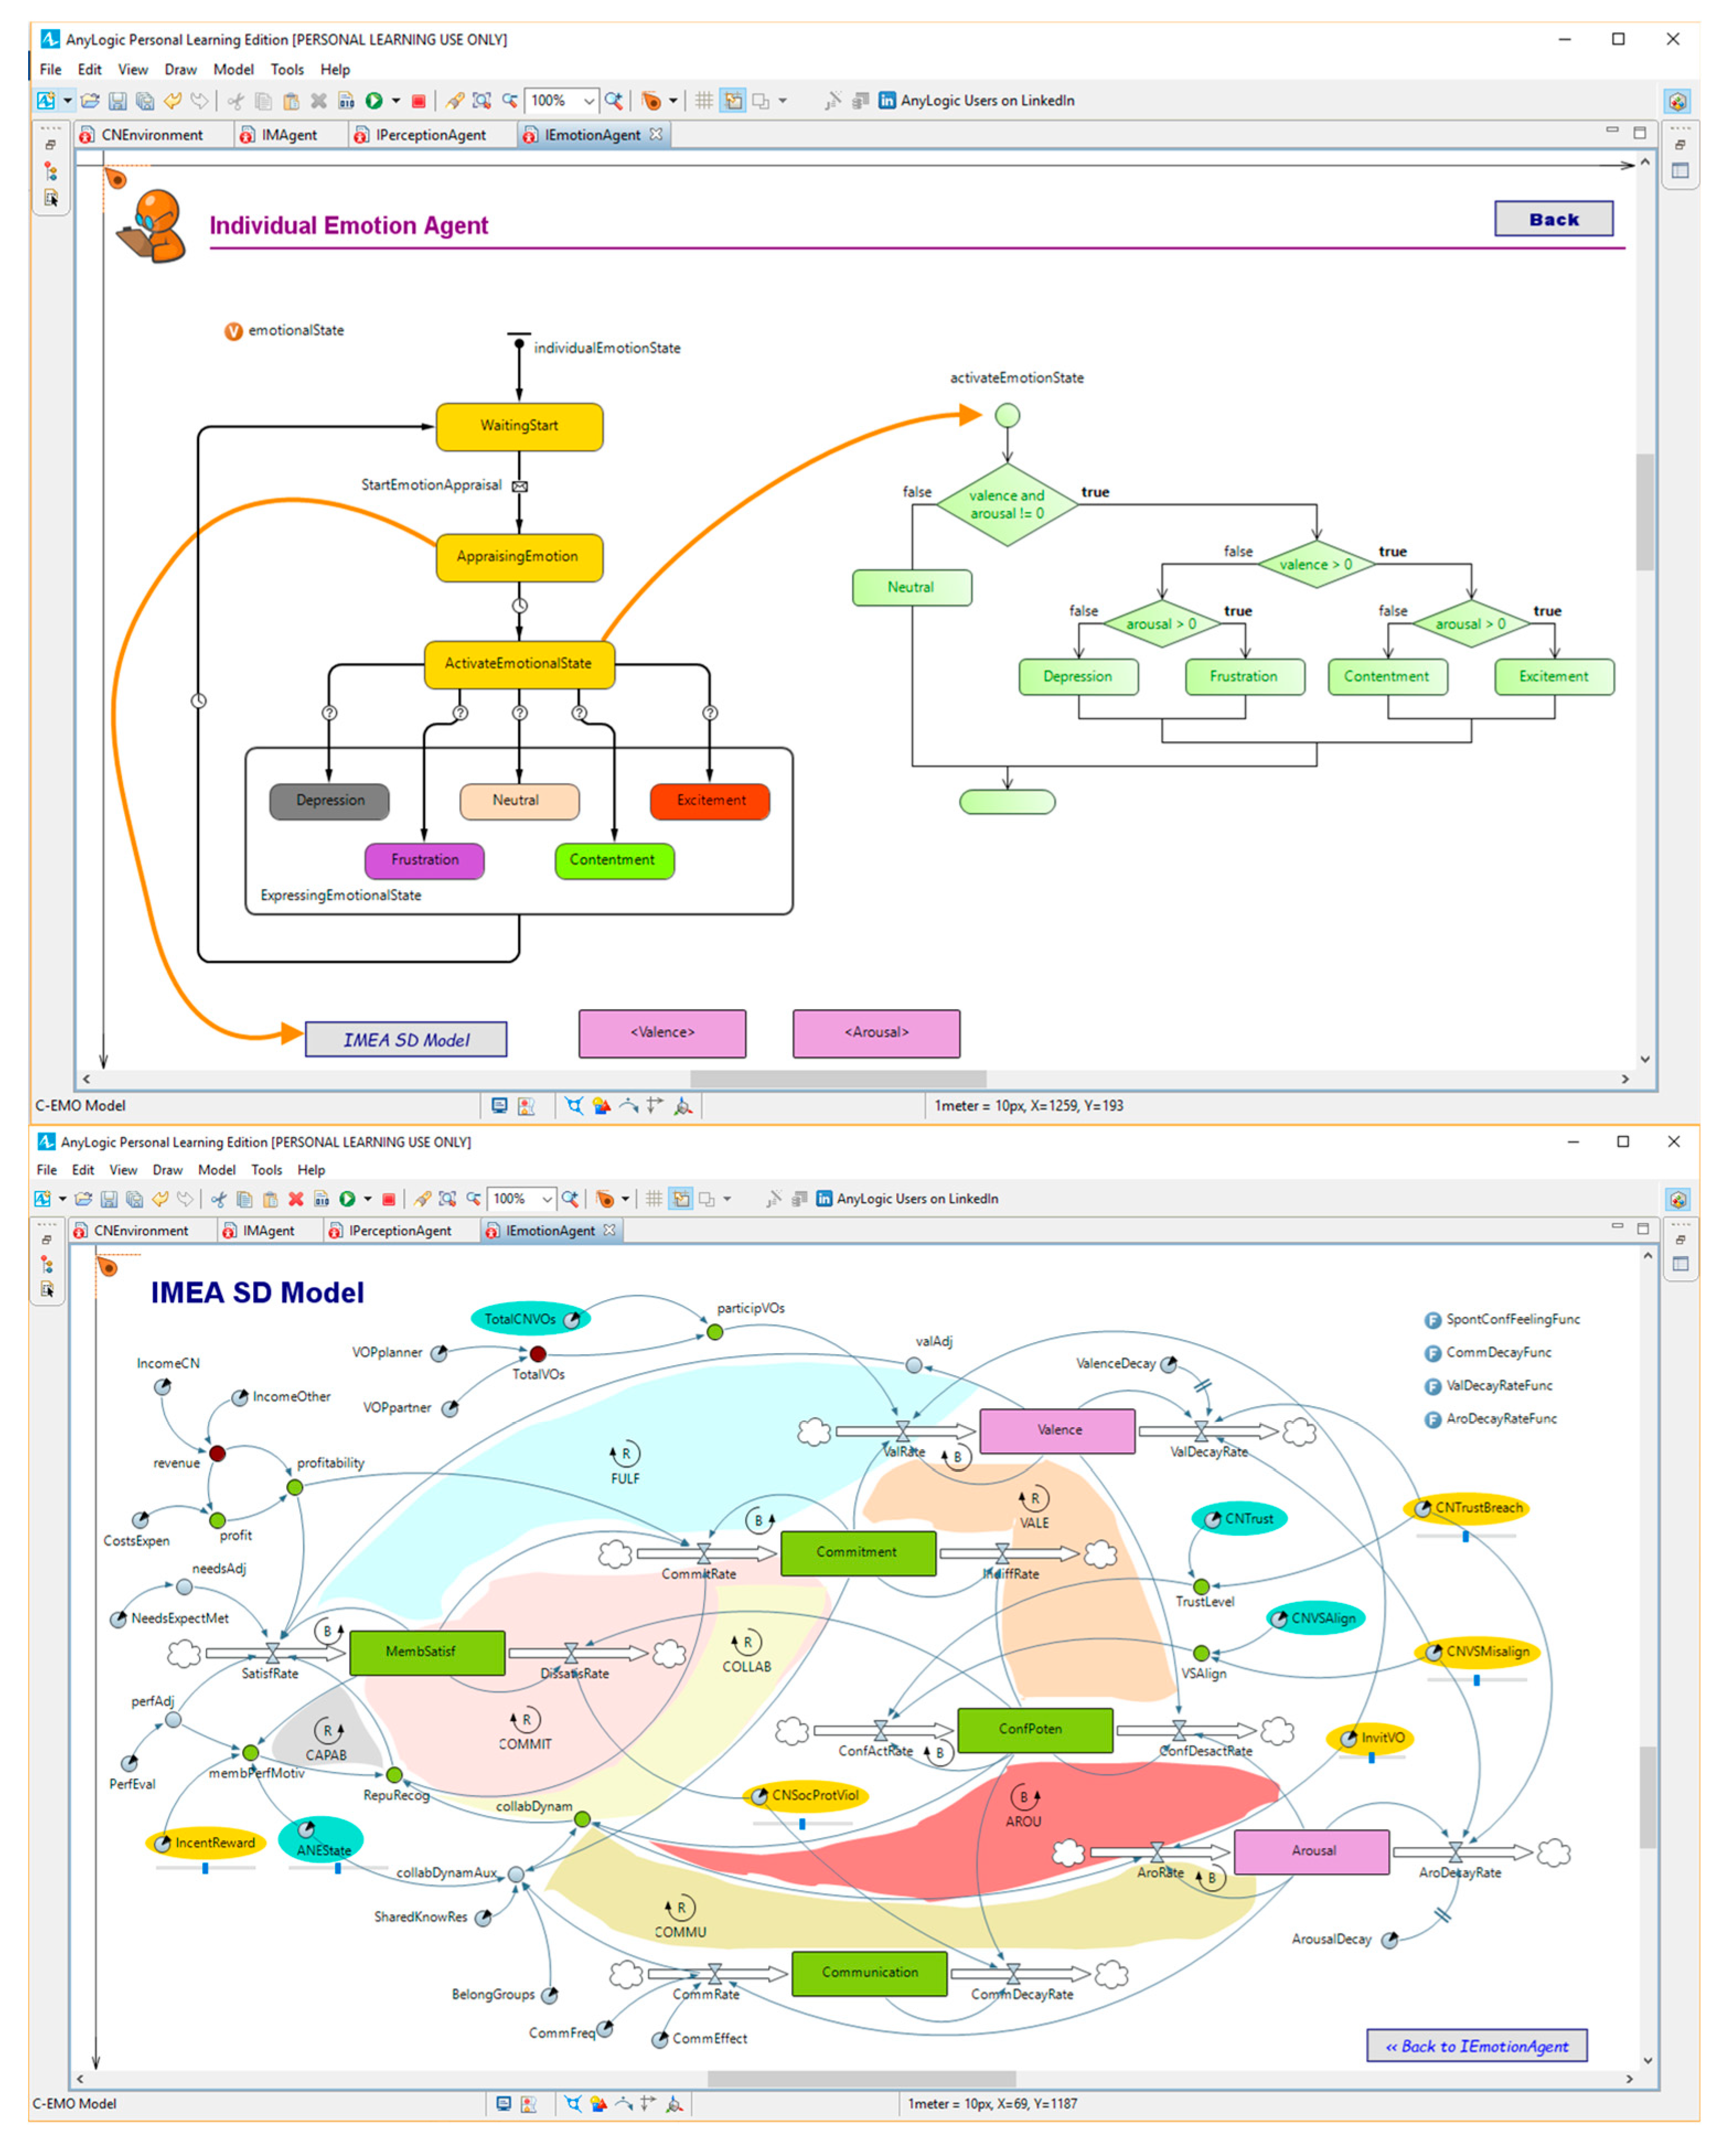
- Then, the IEmotionAgent starts the emotion appraisal by using the IMEA SD model. As described in the IMEA SD model, the resulting variables are the tuple (valence, arousal), which are updated accordingly;
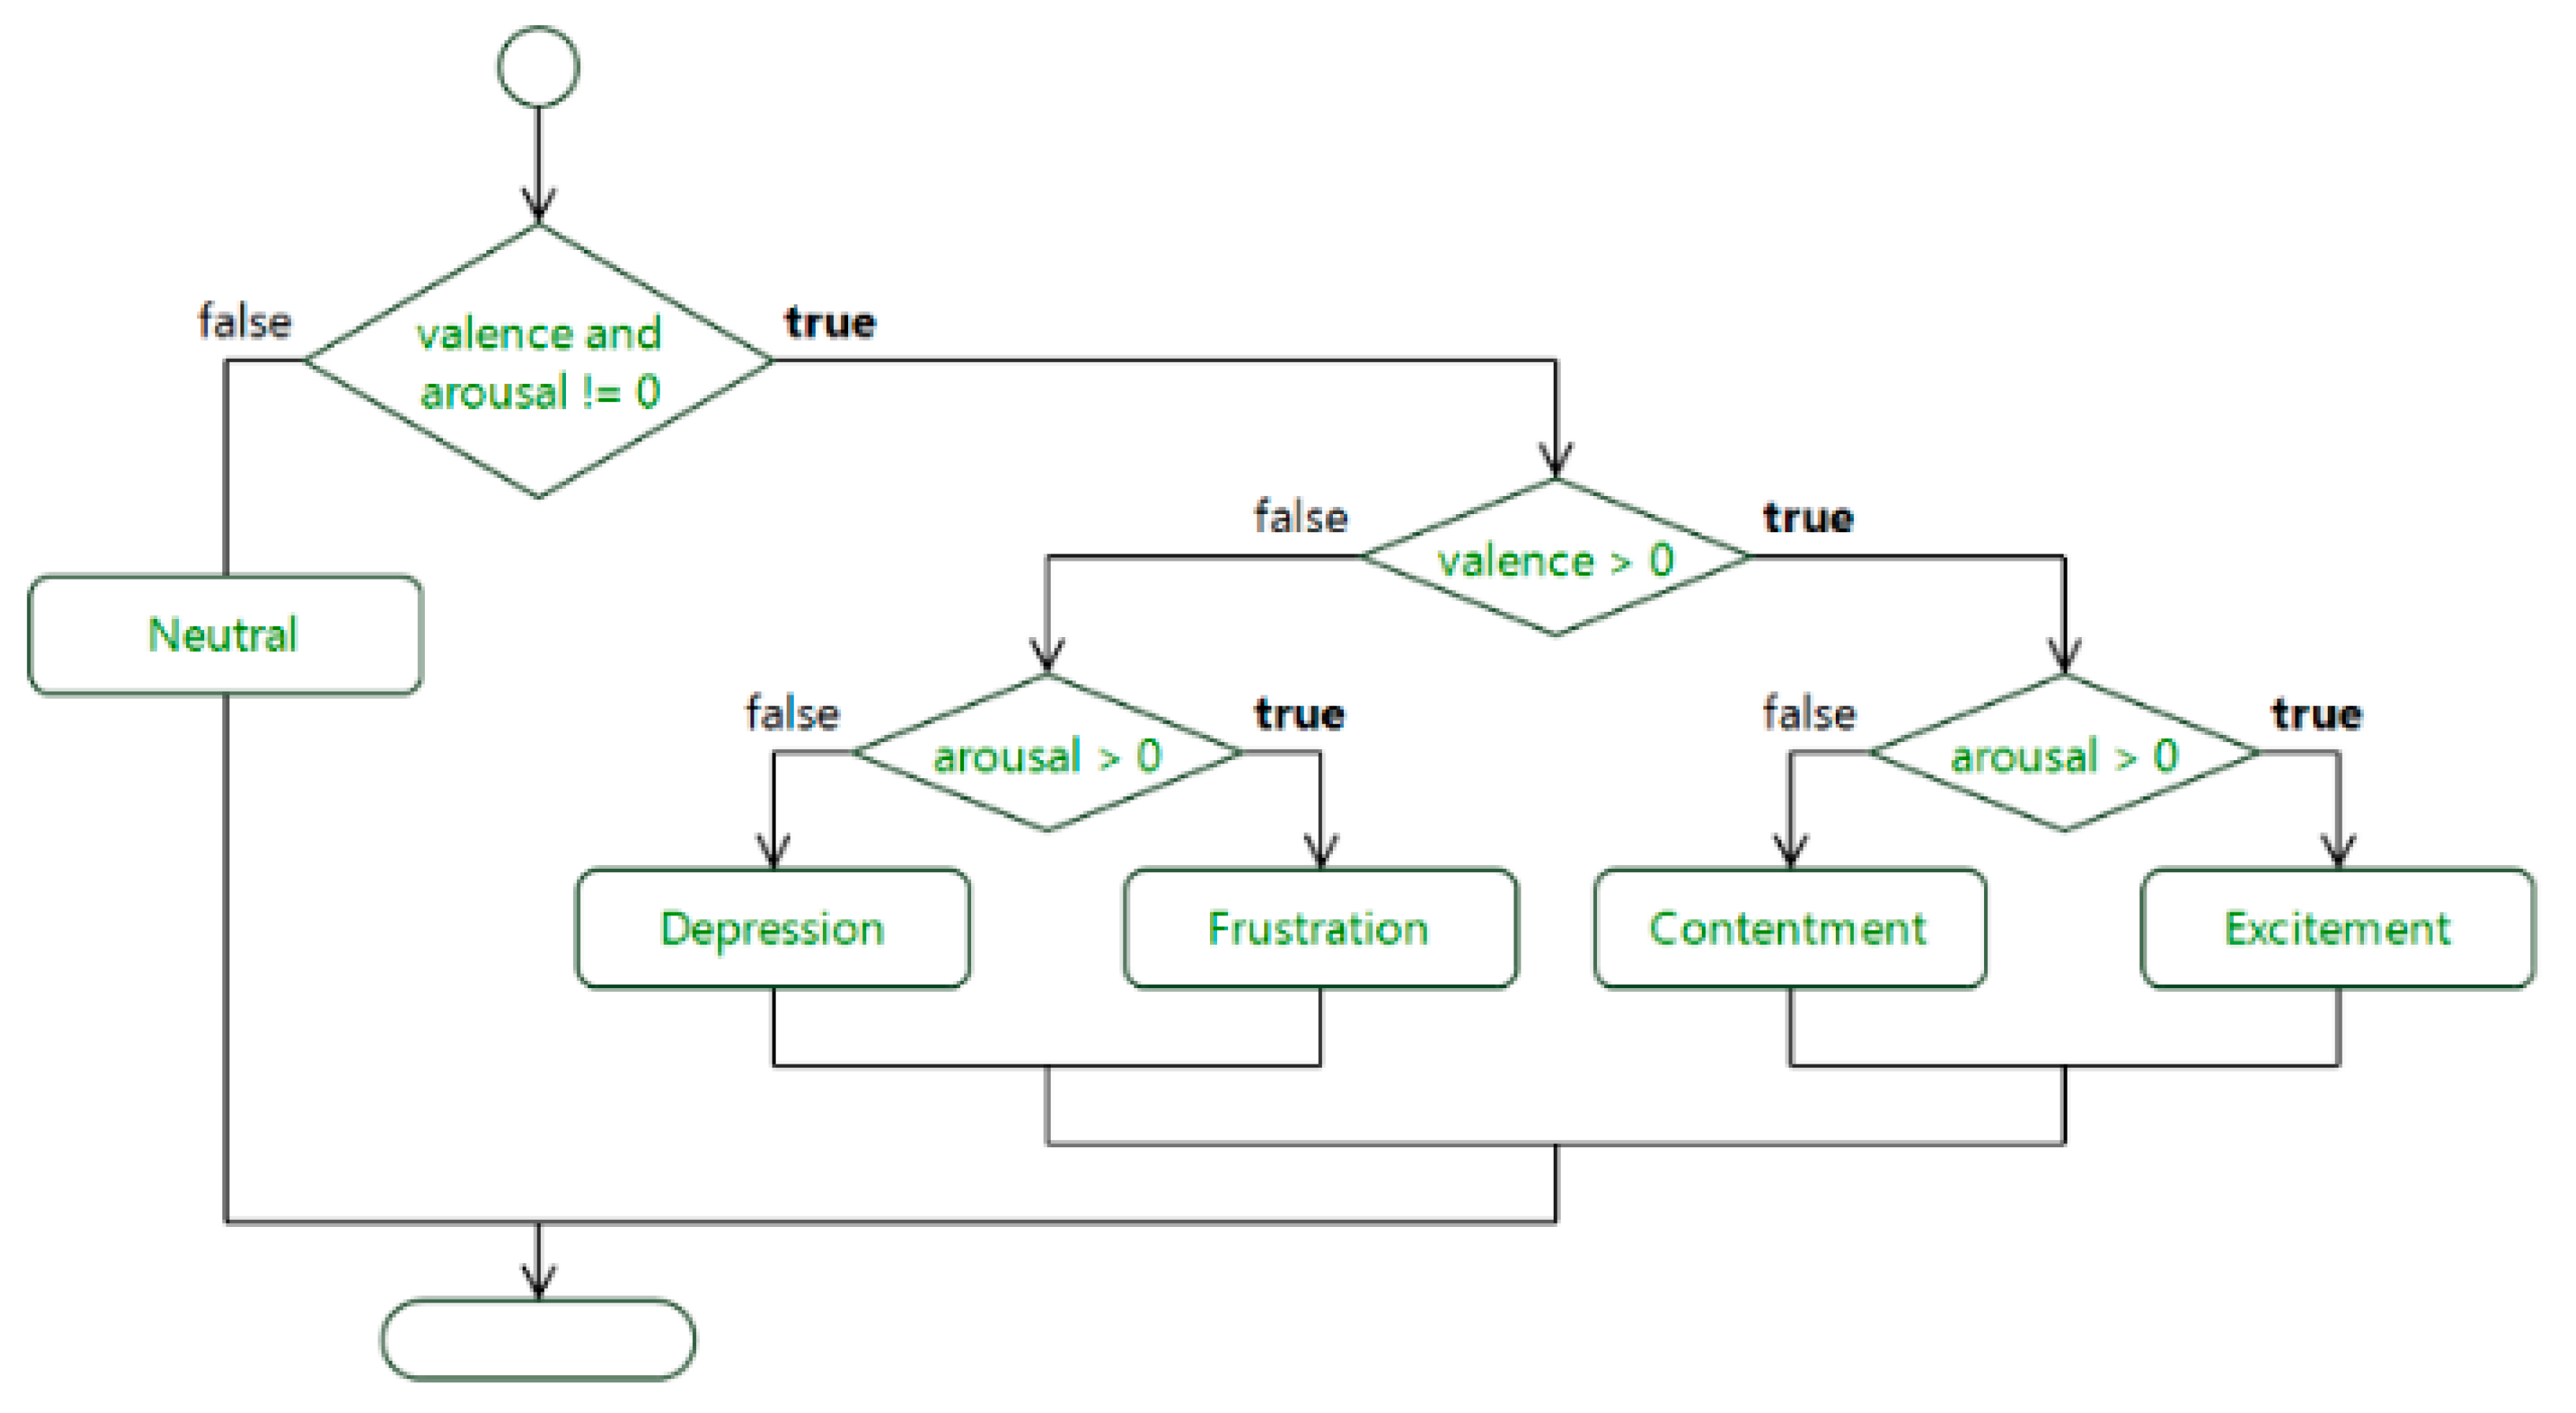
- These variables are then used in the activateEmotionState() in order to select and activate the corresponding emotion state. This is done using the action chart described in Figure 15;
- Finally, the IEmotion agent sends the message “Emotion activated” to the IMAgent, acknowledging that the current emotion has been estimated and activated and returns to the initial state.
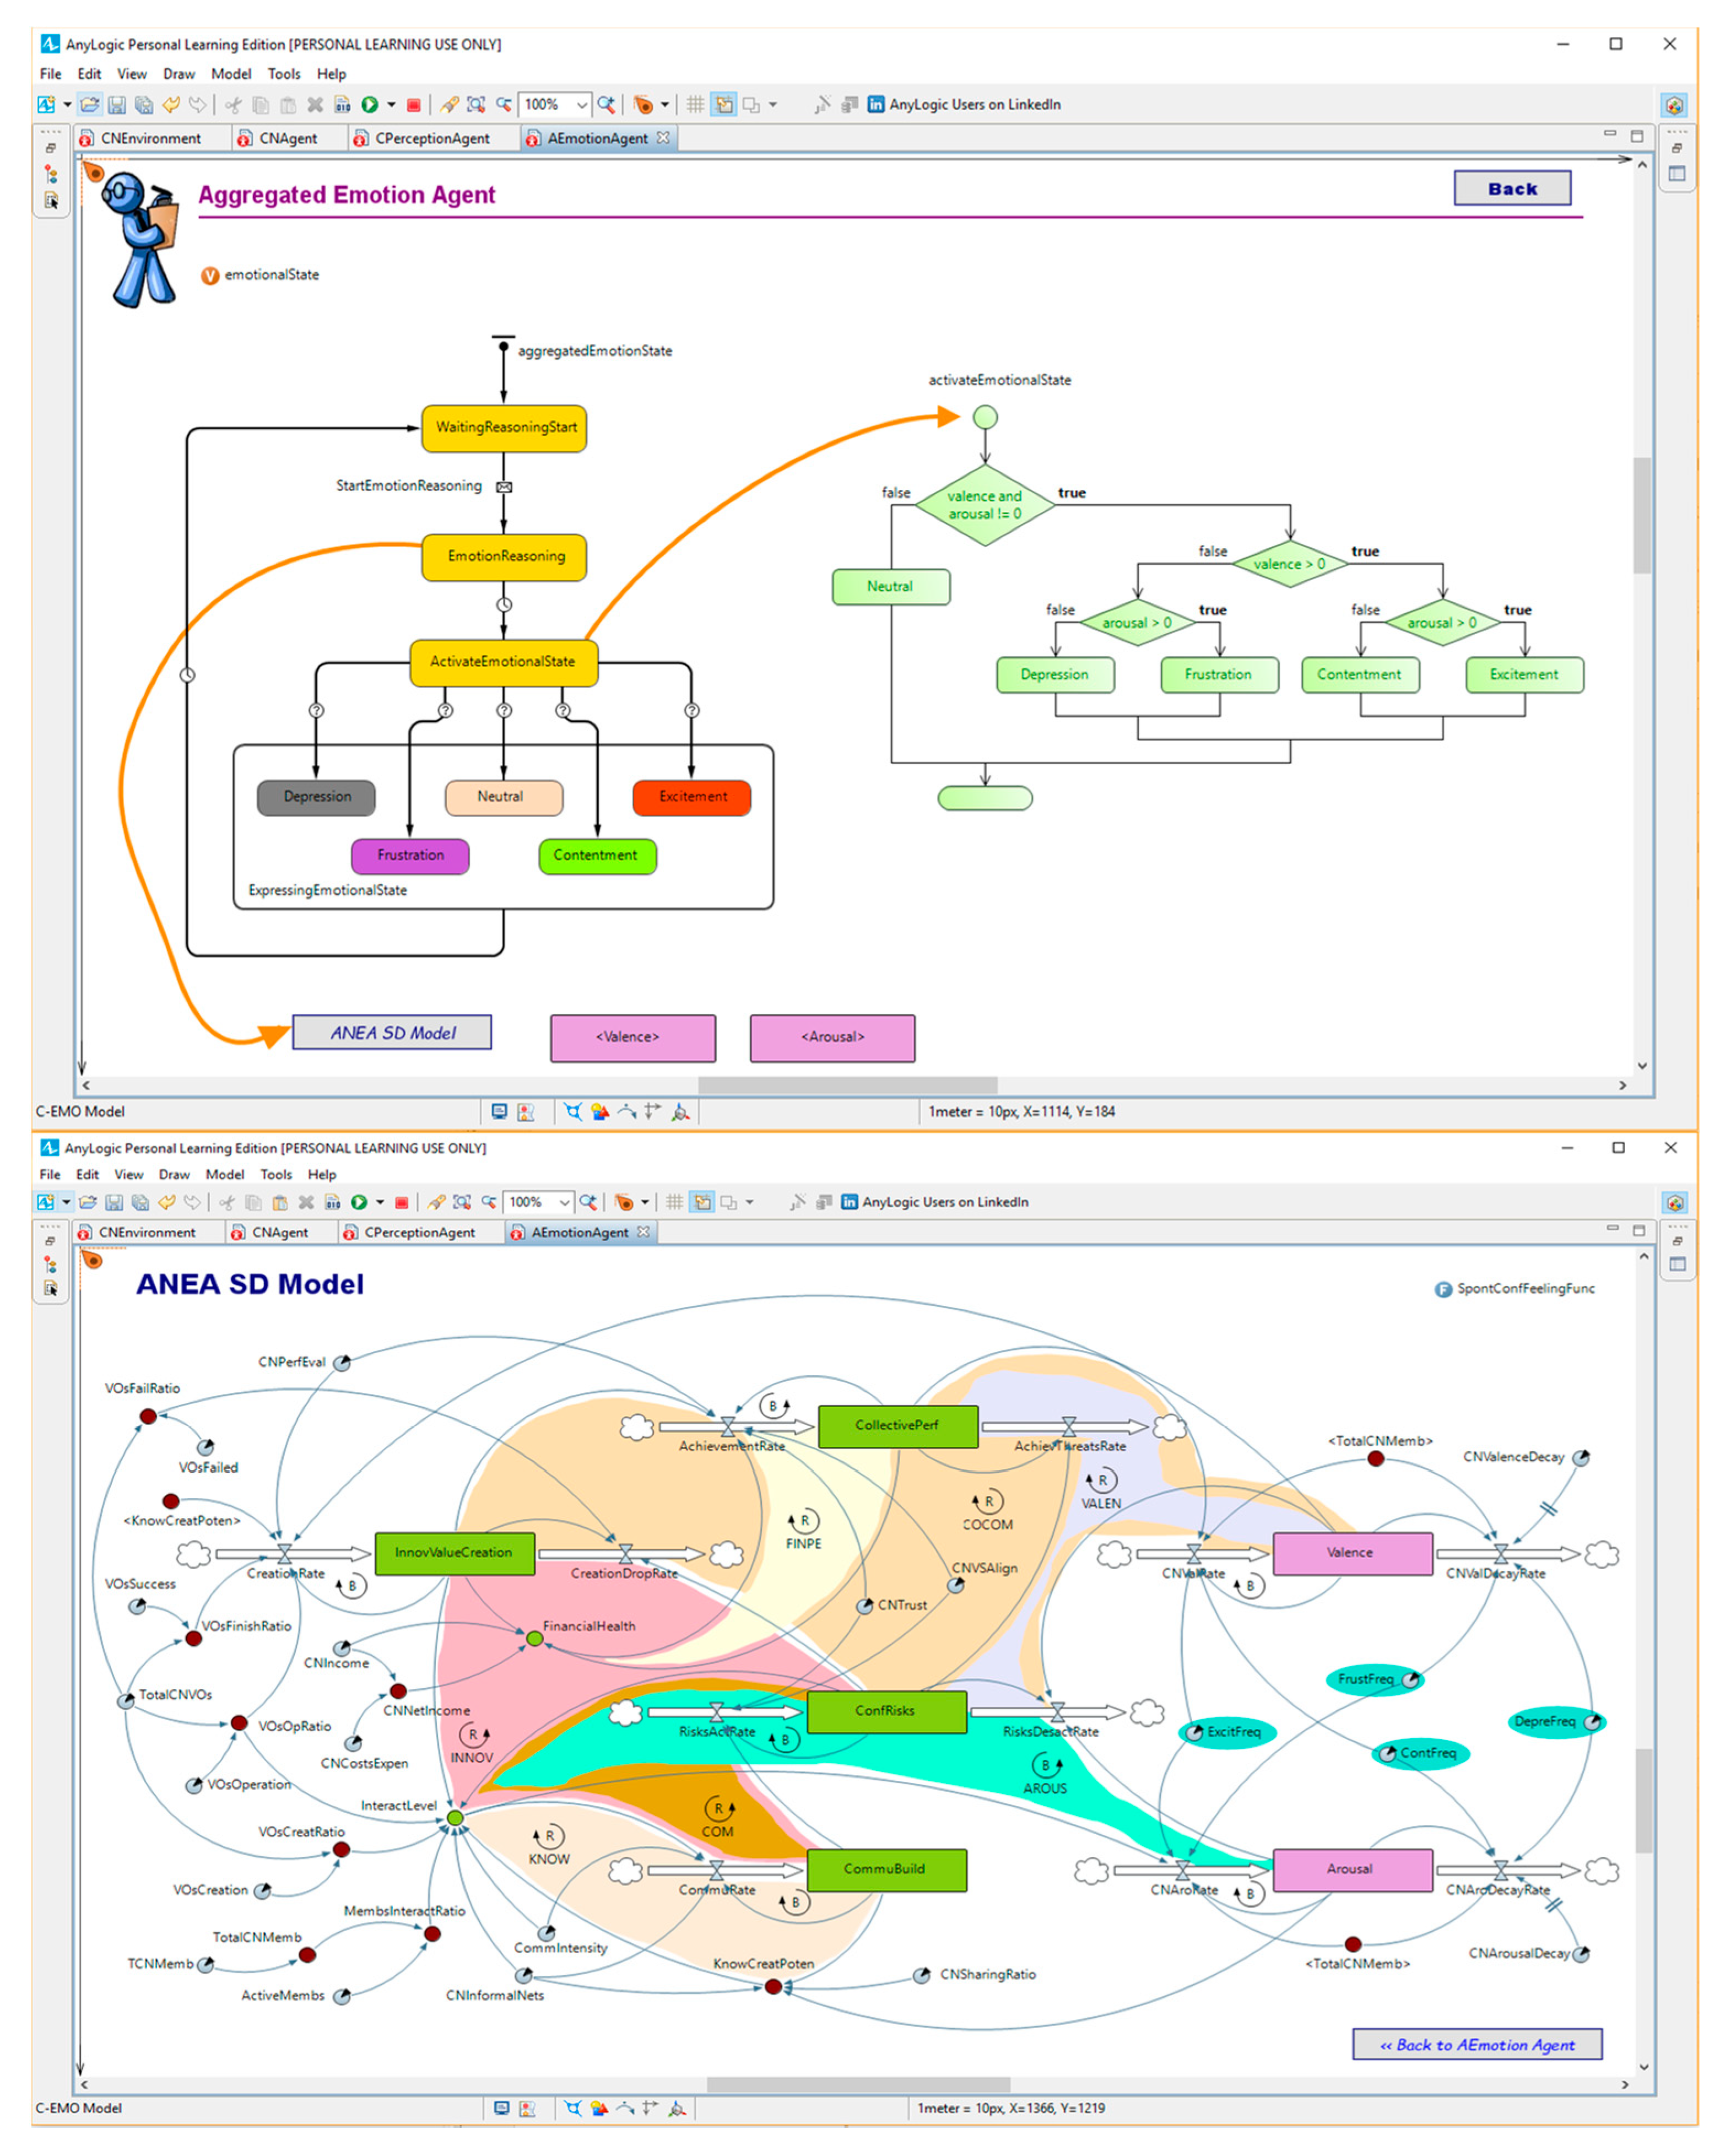
4.3.2. Collaborative Network Agent
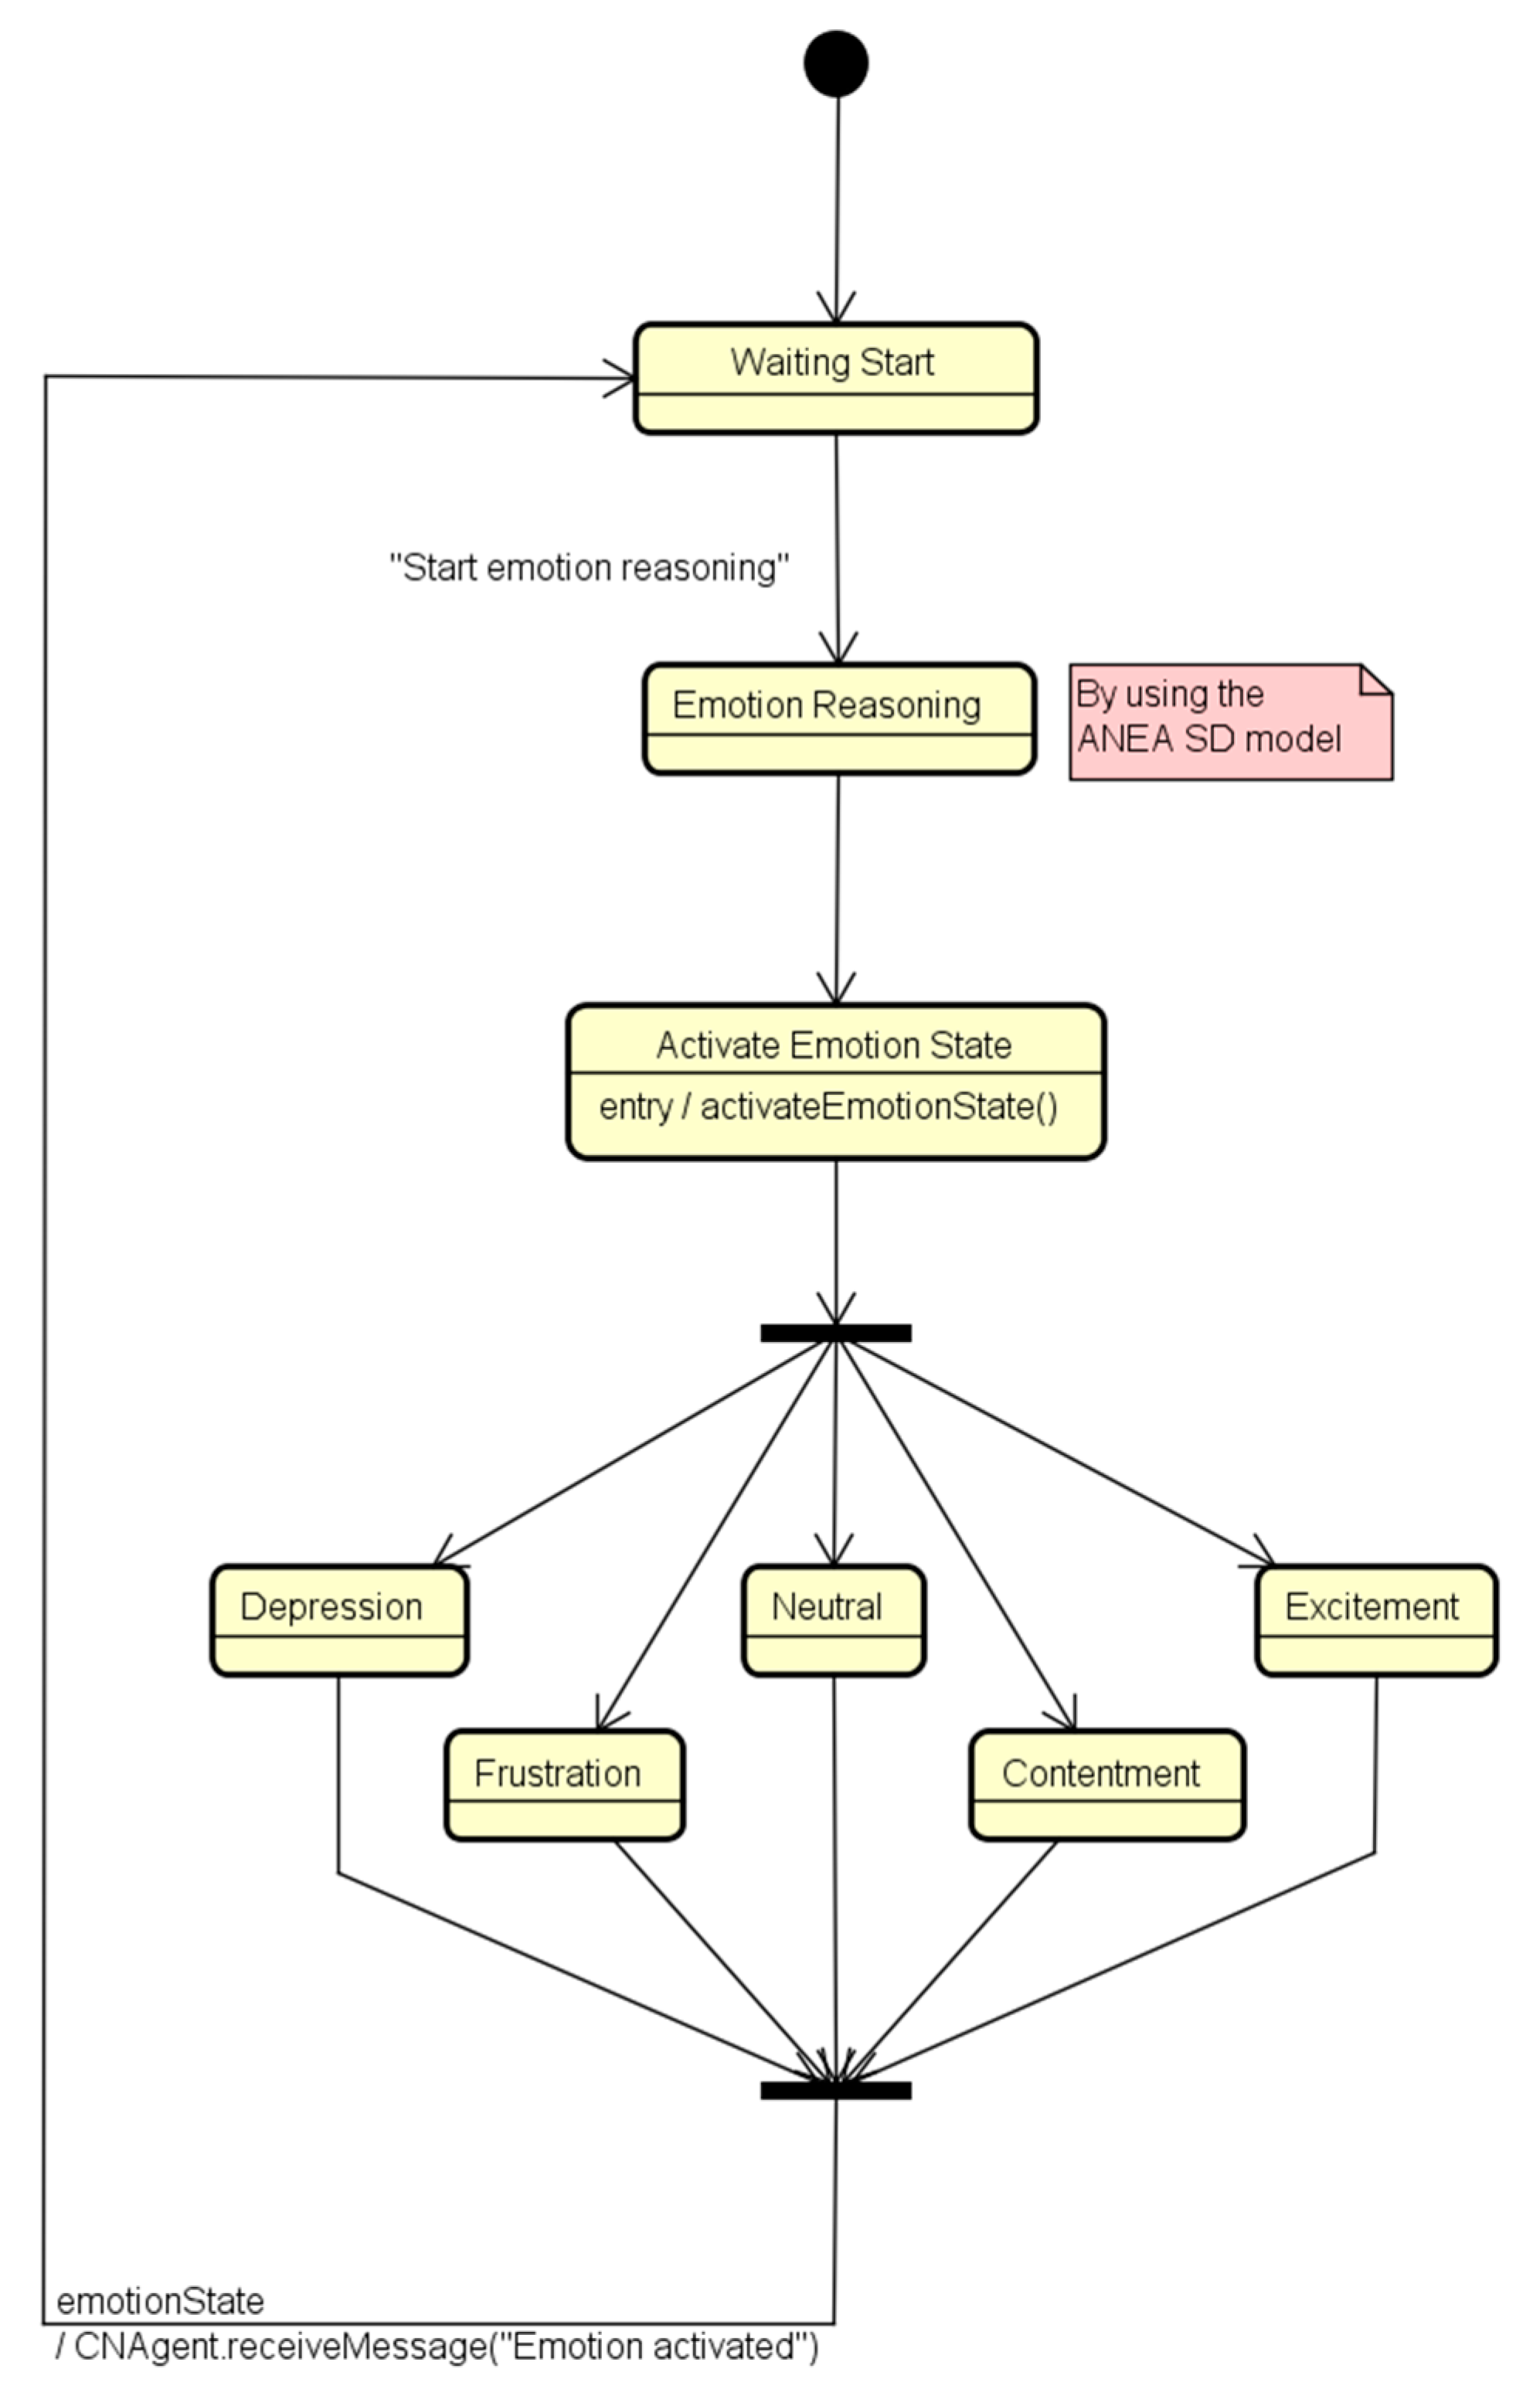
- The AEmotionAgent’s initial state is waiting for the trigger message to start;
- Then, the agent enters the emotion reasoning state and starts executing the ANEA SD model. The model result is the update of the agent’s state variables—valence and arousal;
- These variables are then used in the activateEmotionState(), which is described in Figure 15, in order to select and activate the corresponding aggregated emotion state;
- Finally, the AEmotionAgent sends the message “Emotion activated” to the CNAgent, acknowledging that the current aggregated emotion has been estimated and activated, and returns to the initial state.
5. Implementation of the Simulation Model for CN Emotion Appraisal
6. Results and Discussion
6.1. Scenario Design
6.1.1. Individual Member Experiment
6.1.2. Collaborative Network Experiment
6.2. Simulation Runs and Sensitivity Analysis
6.2.1. Individual Member Scenario Run
6.2.2. Collaborative Network Scenario Run
7. Conclusions and Future Work
Author Contributions
Funding
Conflicts of Interest
References
- Baxter, G.; Sommerville, I. Socio-technical systems: From design methods to systems engineering. Interact. Comput. 2011, 23, 4–17. [Google Scholar] [CrossRef]
- Msanjila, S.; Afsarmanesh, H. Trust Analysis and Assessment in Virtual Organizations Breeding Environments. Int. J. Prod. Res. 2008, 46, 1253–1295. [Google Scholar] [CrossRef]
- Rosas, J.; Camarinha-Matos, L.M. Assessment of the willingness to collaborate in enterprise networks. In Emerging Trends in Technological Innovation; Camarinha-Matos, L.M., Pereira, P., Ribeiro, L., Eds.; Springer: Heidelberg/Berlin, Germany, 2010; pp. 14–23. [Google Scholar]
- Macedo, P.; Camarinha-Matos, L.M. A qualitative approach to assess the alignment of Value Systems in collaborative enterprises networks. Comput. Ind. Eng. 2013, 64, 412–424. [Google Scholar] [CrossRef]
- Ferrada, F.; Camarinha-Matos, L.M. A System Dynamics and Agent-Based Approach to Model Emotions in Collaborative Networks. In Technological Innovation for Smart Systems; Camarinha-Matos, L.M., Parreira-Rocha, M., Ramezani, J., Eds.; Springer: Cham, Switzerland, 2017; pp. 29–43. [Google Scholar]
- Ferrada, F.; Camarinha-Matos, L.M. A modelling framework for collaborative network emotions. Enterp. Inf. Syst. 2019, 13, 1164–1194. [Google Scholar] [CrossRef]
- Camarinha-Matos, L.M.; Afsarmanesh, H. Collaborative Networks—Value Creation in a Knowledge Society. In Proceedings of the PROLAMAT′06, IFIP TC5, International Conference, Shanghai, China, 15–17 June 2006; pp. 26–40. [Google Scholar]
- Russell, J.A. A Circumplex Model. of Affect. J. Pers. Soc. Psychol. 1980, 39, 1161–1178. [Google Scholar] [CrossRef]
- Scherer, K.R. Emotions are emergent processes: They require a dynamic computational architecture. Philos. Trans. R. Soc. B-Biol. Sci. 2009, 364, 3459–3474. [Google Scholar] [CrossRef]
- Ferrada, F. C-EMO: A Modeling Framework for Collaborative Network Emotions; Nova University of Lisbon: Lisbon, Portugal, 2017. [Google Scholar]
- Majid, M.A. Human Behavior Modelling: An Investigation Using Traditional Discrete Event and Combined Discrete event and Agent-Based Simulation; University of Nottingham: Nottingham, UK, 2011. [Google Scholar]
- Singh, V.P. System Modelling and Simulation; New Age International Ltd.: New Delhi, India, 2009. [Google Scholar]
- Shannon, R.E. Introduction to the Art and Science of Simulation. In Proceedings of the 1998 Winter Simulation Conference, Washington, DC, USA, 13–16 December 1998; pp. 7–14. [Google Scholar]
- Balci, O. Guidelines for Successful Simulation Studies. In Proceedings of the 1990 Winter Simulation Conference, New Orleans, LA, USA, 9–12 December 1990; pp. 25–32. [Google Scholar]
- Robinson, S. Conceptual Modelling for Simulation. In Proceedings of the 2013 Winter Simulation Conference, Washington, DC, USA, 8–11 December 2013; pp. 377–388. [Google Scholar]
- Law, A.M. Simulation Modeling and Analysis, 5th ed.; McGraw-Hill Education: New York, NY, USA, 2015; p. 10121. [Google Scholar]
- Vicsek, T. Complexity: The Bigger Picture. Nature 2002, 418, 131. [Google Scholar] [CrossRef]
- Forrester, J.W. Industrial Dynamics; The M.I.T. Press: Cambridge, MA, USA, 1961. [Google Scholar]
- Sterman, J.D. System Dynamics: Systems Thinking and Modeling for a Complex World. In Working Paper 2003 01.13: ESD Internal Symposium; MIT Sloan School of Management: Cambridge, MA, USA, 2002. [Google Scholar]
- Angerhofer, B.J.; Angelides, M.C. System Dynamics Modelling in Supply Chain Management: Res. Review. In Proceedings of the 2000 Winter Simulation Conference, Orlando, FL, USA, 10–13 December 2000; pp. 342–351. [Google Scholar]
- Barton, P.; Bryan, S.; Robinson, S. Modelling in the economic evaluation of health care: Selecting the appropriate approach. J. Health Serv. Res. Policy 2004, 9, 110–118. [Google Scholar] [CrossRef]
- Wakeland, W.W.; Fusion, J.; Goldstein, B. A Tale of Two Methods—Agent-Based Simulation and System Dynamics—Applied in a Biomedical Context: Acute Inflammatory Response. In Proceedings of the 6th European Congress on Systems Science, Paris, France, 19–22 September 2005. [Google Scholar]
- Eldabi, T.; Paul, R.J.; Young, T. Simulation modelling in healthcare: Reviewing legacies and investigating futures. J. Oper. Res. Soc. 2007, 58, 262–270. [Google Scholar] [CrossRef]
- Vlachos, D.; Georgiadis, P.; Iakovou, E. A system dynamics model for dynamic capacity planning of remanufacturing in closed-loop supply chains. Comput. Oper. Res. 2007, 34, 367–394. [Google Scholar] [CrossRef]
- Wakeland, W.W.; Macovsky, L.M.; Edward, J.; Gallaher, C. Athena Aktipis A Comparison of System Dynamics and Agent-Based Simulation Applied to the Study of Cellular Receptor Dynamics. In Proceedings of the 37th Hawaii International Conference on System Sciences, Big Island, HI, USA, 5–8 January 2004. [Google Scholar]
- Brailsford, S.; Hilton, N. A Comparison of Discrete Event Simulation and System Dynamics for Modelling Healthcare Systems. In Proceedings of the ORAHS 2000, Glasgow, UK, 31 July–4 August 2000. [Google Scholar]
- Chahal, K.; Eldabi, T. System Dynamics and Discrete Event Simulation: A Meta-Comparison. In Proceedings of the 4th Simulation Workshop (SW08), Worcestershire, UK, 1–2 April 2008. [Google Scholar]
- Davidsson, P. Multi Agent Based Simulation: Beyond Social Simulation. In Multi-Agent-Based Simulation; Moss, S., Davidsson, P., Eds.; Springer: Berlin/Heidelberg, Germany, 2000; pp. 97–107. [Google Scholar]
- Macal, C.M.; North, M.J. Agent-Based Modeling and Simulation: ABMS Examples. In Proceedings of the 2008 Winter Simulation Conference, Miami, FL, USA, 7–10 December 2008; pp. 101–112. [Google Scholar]
- Siebers, P.-O.; Aickelin, U. Introduction to Multi-Agent Simulation. In Encyclopedia of Decision Making and Decision Support Technologies; Adam, F., Humphreys, P., Eds.; IGI Global: Hershey, PA, USA, 2008; pp. 554–564. [Google Scholar]
- Jennings, N.R.; Sycara, K.; Wooldridge, M. A Roadmap of Agent Res. and Development. Auton. Agents Multi-Agent Syst. 1998, 1, 7–38. [Google Scholar] [CrossRef]
- Siegfried, R. Modeling and Simulation of Complex Systems—A Framework for Efficient Agent-Based Modeling and Simulation; Wiesbaden Springer Fachmedien: Wiesbaden, Germany, 2014. [Google Scholar]
- AnyLogic. AnyLogic: Multimethod Simulation Software. Available online: http://www.anylogic.com/ (accessed on 24 January 2015).
- Borshchev, A.; Filippov, A. From System Dynamics and Discrete Event to Practical Agent Based Modeling: Reasons, Techniques, Tools. In Proceedings of the 22nd International Conference of the System Dynamics Society, Oxford, UK, 25–29 July 2004. [Google Scholar]
- Huff, K.D.; Gidden, M.J.; Carlsen, R.W.; McGarry, M.B.; Opotowsky, A.C.; Schneider, E.A.; Scopatz, A.M.; Wilson, P.P.H. Fundamental concepts in the Cyclus nuclear fuel cycle simulation framework. Adv. Eng. Softw. 2016, 94, 46–59. [Google Scholar] [CrossRef]
- Desmarchelier, B.; Fang, E.S. National Culture and Innovation diffusion. Exploratory insights from agent-based modeling. Technol. Forecast. Soc. Chang. 2016, 105, 121–128. [Google Scholar] [CrossRef]
- Li, H.; Chen, G.; Dong, Z.; Xia, D. Consensus Analysis of Multiagent Systems with Second-Order Nonlinear Dynamics and General Directed Topology: An Event-Triggered Scheme. Inf. Sci. 2016, 370–371, 598–622. [Google Scholar] [CrossRef]
- Li, Z. Numerical simulation of evacuation in a subway station. Procedia Eng. 2016, 135, 616–621. [Google Scholar] [CrossRef]
- Yatskiv (Jackiva), I. Passenger terminal safety: Simulation modelling as decision support tool. Procedia Eng. 2016, 134, 459–468. [Google Scholar] [CrossRef]
- Macal, C.M. Everything you need to know about agent-based modeling and simulation. J. Simul. 2016, 10, 144–156. [Google Scholar] [CrossRef]
- Capterra. Top Simulation Software Products. Available online: http://www.capterra.com/simulation-software/ (accessed on 1 February 2017).
- OR/MS. Simulation Software Survey. Available online: http://www.orms-today.org/surveys/Simulation/Simulation.html (accessed on 1 September 2016).
- Allan, R. Survey of Agent Based Modelling and Simulation Tools. Available online: http://www.grids.ac.uk/Complex/ABMS/ (accessed on 21 September 2016).
- Afsarmanesh, H.; Camarinha-Matos, L.M.; Ermilova, E. VBE Reference Framework. In Methods and Tools for Collaborative Networked Organizations; Camarinha-Matos, L.M., Afsarmanesh, H., Ollus, M., Eds.; Springer: Berlin/Heidelberg, Germany, 2008; pp. 35–68. [Google Scholar]
- Camarinha-Matos, L.M. Supporting product-servicing networks. In Proceedings of the IESM’13—5th International Conference on Industrial Engineering and Systems Management, Rabat, Morocco, 28–30 October 2013; pp. 1–7. [Google Scholar]
- Camarinha-Matos, L.M.; Ferrada, F.; Oliveira, A.I. Interplay of Collaborative Networks in Product Servicing. In Collaborative Systems for Reindustrialization: 14th IFIP WG 5.5 Working Conference on Virtual Enterprises, PRO-VE 2013, Dresden, Germany, 30 September–2 October 2013; Camarinha-Matos, L., Scherer, R.J., Eds.; Springer: Berlin/Heidelberg, Germany, 2013; pp. 51–60. [Google Scholar]
- Averill, J.R. Averill, J.R. A constructivist view of emotion. In Emotion: Theory, Res. and Experience; Plutchik, R., Kellerman, H., Eds.; Academic Press: New York, NY, USA, 1980; pp. 305–339. [Google Scholar]
- Camarinha-Matos, L.M.; Afsarmanesh, H.; Boucher, X. The Role of Collaborative Networks. In Sustainability, in Collaborative Networks for a Sustainable World: 11th IFIP WG 5.5 Working Conference on Virtual Enterprises, PRO-VE 2010, St. Etienne, France, 11–13 October 2010; Camarinha-Matos, L.M., Boucher, X., Afsarmanesh, H., Eds.; Springer: Berlin/Heidelberg, Germany, 2010; pp. 1–16. [Google Scholar]
- Volpentesta, A.P.; Ammirato, S. Networking agrifood SMEs and consumer groups in local agribusiness. In Pervasive Collaborative Networks; Camarinha-Matos, L.M., Picard, W., Eds.; Springer: Berlin/Heidelberg, Germany, 2008; pp. 33–40. [Google Scholar]
- Camarinha-Matos, L.M.; Afsarmanesh, H.; Ferrada, F. Collaborative Networks Approach to Active Ageing. In Proceedings of the Pervasive Health 2010—4th International ICST Conference on Pervasive Computing Technologies for Healthcare, Munich, Germany, 22–25 March 2010; AGEmap Workshop: Munich, Germany, 2010. [Google Scholar]
- del Cura, A. New Organizational Forms to Extend the Professional Active Life. In Leveraging Knowledge for Innovation in Collaborative Networks: 10th IFIP WG 5.5 Working Conference on Virtual Enterprises, PRO-VE 2009, Thessaloniki, Greece, 7–9 October 2009; Camarinha-Matos, L.M., Paraskakis, I., Afsarmanesh, H., Eds.; Springer: Berlin/Heidelberg, Germany, 2009; pp. 709–720. [Google Scholar]
- Camarinha-Matos, L.M.; Afsarmanesh, H. Roots of Collaboration: Nature-Inspired Solutions for Collaborative Networks. IEEE Access 2018, 6, 30829–30843. [Google Scholar] [CrossRef]
- Adams, W.M. The Future of Sustainability: Re-thinking Environment and Development in the Twenty-first Century. In Proceedings of the IUCN Renowned Thinkers Meeting, Gland, Switzerland, 29–31 January 2006; Available online: http://cmsdata.iucn.org/downloads/iucn_future_of_sustanability.pdf (accessed on 24 February 2017).
- Marreiros, G.; Ramos, C.; Neves, J. Dealing with Emotional Factors in Agent Based Ubiquitous Group Decision. In Proceedings of the Embedded and Ubiquitous Computing—EUC 2005 Workshops: EUC 2005 Workshops: UISW, NCUS, SecUbiq, USN, and TAUES, Nagasaki, Japan, 6–9 December 2005; Enokido, T., Yan, L., Xiao, B., Kim, D., Dai, Y., Yang, L.T., Eds.; Springer: Berlin/Heidelberg, Germany, 2005; pp. 41–50. [Google Scholar]
- Borshchev, A. The Big Book of Simulation Modeling: Multimethod Modeling with AnyLogic 6; AnyLogic North America: Chicago, IL, USA, 2013. [Google Scholar]


| CNEs | Synonyms | Dimensions |
|---|---|---|
| Excitement | Active, enthusiastic, thrilled, electrified | Valence >0; Arousal >0 |
| Contentment | Comfortable, relaxed, satisfied | Valence >0; Arousal <0 |
| Frustration | Afraid, nervous, angry, unsatisfied | Valence <0; Arousal >0 |
| Depression | Hopeless, miserable, uninterested | Valence <0; Arousal <0 |
| Tool | SD | AB | Characteristics |
|---|---|---|---|
| Vensim (www.vensim.com) | X | Free version | |
| Repast Simphony (Repast S) (https://repast.github.io/) | X | Dedicated AB prototyping environment Large-scale (scalable) agent development environment Free version | |
| NetLogo (https://ccl.northwestern.edu/netlogo/) | X | Dedicated AB prototyping environment Modified version of the Logo programming language Free | |
| Swarm (http://www.swarm.org/) | X | Large-scale (scalable) agent development environment. Java interface Free | |
| AnyLogic (www.anylogic.com) | X | X | Multi-method tool Integration and interaction of the two methods Large-scale (scalable) agent development environment Java Proprietary toolkit (free version for students) |
| Insight Maker (www.insightmaker.com) | X | X | Online software Free |
| MASON (https://cs.gmu.edu/~eclab/projects/mason/) | X | Large-scale (scalable) agent development environment Java Free | |
| Stella/iThink (https://www.iseesystems.com/store/products/ithink.aspx) | X | Multi-method tool (depending on the products) Proprietary toolkit | |
| PowerSim (www.powersim.com) | X | Build models with the System Dynamics approach Run what-if scenarios and do policy design Quickly assemble a flexible user interface Connect to MS Excel or different Databases Free | |
| NOVA (www.novamodeler.com) | X | X | Multi-method tool Java-based modeling platform Free version |
| Evidences | Definition |
|---|---|
| Valence | The latest value of valence, so it represents the initial value of valence before the new estimation. |
| Arousal | The latest value of arousal, so it represents the initial value of arousal before the new estimation. |
| Valence Decay | The value of the decay that the valence dimension of IME assumes for the CN member. |
| Arousal Decay | The value of the decay that the arousal dimension of IME assumes for the CN member. |
| Virtual Organization (VO) Participation as Planner | The number of times a CN member takes the initiative to prepare a new business to the CN. |
| VO Participation as Partner | The number of times the CN member is selected to form part of a VO. |
| Performance Evaluation | The assessment of the performance of the member, according to a set of performance indicators. |
| Needs and Expectations Met | The value regarding the level of needs and expectations that were accomplished or met in what concerns the member involvement in the CN. |
| Income from CN | The total earnings of a CN member resulting from its participation in VOs inside the CN environment. |
| Income Other | The total earnings of a CN member resulting from its participation in external activities to the CN. |
| Costs and Expenses | The amount of costs and expenses a CN member had independently of being inside the CN or outside. |
| Belonging Informal Networks | The ratio of the number of informal networks the CN member belongs to, in relation to the total active informal networks within the CN environment. |
| Shared Knowledge wnd Resources Ratio | The ratio of the total amount of knowledge and resources a CN member shared in relation to the total knowledge and resources present within the CN environment. |
| Communication Frequency | The rate at which the CN member communicates with others within the CN environment. This variable reflects a result of a social network analysis over the CN environment. |
| Communication Effectiveness | The rate of understandability of the CN environment about the messages sent by the member. Reflects a result of a social network analysis over the CN environment. |
| Total CN Members | The total number of registered members in the CN. |
| Total CN VOs | The total number of VOs operating within the CN environment. |
| ANE State | The last known value of the ANE state. |
| CN Trust | The value of the trust assessment results that is conducted to all members. |
| CN Value System Alignment | The measure of the alignment of the core value system of the CN with the core value systems of all CN members. |
| Invitation to form VOs | The occurrence of the event “invitation to form VO”. The event is triggered when the CN member receives an invitation from the VO planner to join the VO. |
| Incentive Reward | The occurrence of the event “selected to earn an incentive reward”. Event triggered when the member earns a reward after being recognized or after achieving a set of goals of the CN incentive program. |
| CN Trust Breach | The occurrence of the event “lack of trust situation”. The event is triggered whenever the CN trust level achieves the danger threshold. |
| CN Value System Misalignment | The occurrence of the event “no CN value system alignment”. The event is triggered when the result of the assessment of the alignment of the value systems of the CN and the members achieves the misalignment threshold. |
| CN Social Protocols Violation | The occurrence of the event “social protocols violated”. Event triggered when the interactions among a group of CN members become not acceptable according to the established set of social protocols. |
| Goals and Internal Stimuli | Definition |
|---|---|
| Member Satisfaction | The degree of satisfaction of the CN Member. Represents the level of approval when comparing the CN member situation with its expectations and needs. |
| Profitability | The efficiency measurement of the CN member. This differs from profit. Profit has a currency unit to measure while profitability is generally measured as a ratio of profit to revenue. |
| Profit | The financial benefit that is realized when the amount of revenue gained from the member business activity exceeds the expenses and costs needed to sustain the activity. |
| Reputation and Recognition | The potential of recognition and reputation of the CN member by the CN community, i.e., by all CN members. It combines quality of collaboration and competences recognition. |
| Participation in VOs | The level of participation in Vos, in relation to the total VOs operating in the CN environment. |
| Collaboration Dynamics | The dynamism of the CN member within the CN environment. This variable is the reflection of the interactions and communication with the other CN members, and the level of willingness to engage with the CN environment. |
| Commitment | The level of attachment, linkage and enthusiasm a member has with the CN environment. Reflects the connection, the contentment, the involvement and the effort a member puts in the CN. |
| Trust Level | The level of trust felt by the CN member for the CN environment. |
| Value System Alignment | The CN member’s level of values alignment with the CN environment. Represents the need of the member to be lined up with the organizational values/vision of the CN environment. |
| Member Motivation | The degree of motivation of the CN member. Represents the member’s goal to keep motivated. The motivation is influenced by the member’s performance evaluation, satisfaction and incentive rewards and also by the ANE state of the CN environment. |
| Potential Conflicts Creation | The level of creation of potential conflicts by the CN member. Might be activated by a lack of felt trust, by the recognition of values system incompatibility and by the emotional state of the CN member. Avoidance of conflicts is one of the member’s expectations. |
| Communication | The level of communication a CN member has within the CN environment. Represents the relationship between the communication effectiveness, the communication frequency and the level of arousal of the member. |
| Commitment Reinforcing Loop (COMMIT-R) | This reinforcing loop models the dynamics of commitment, collaboration dynamics, reputation and member satisfaction. As collaboration dynamics increase (decrease), the potential for reputation and recognition of the member increases (decreases). This in turn results in the increase (decrease) of members’ satisfaction. The increase (decrease) of members’ satisfaction positively (negatively) influences the level of commitment of the CN member. This results in an increase (decrease) in motivation to collaborate within the CN environment. |
| Collaboration Reinforcing Loop (COLLAB-R) | This reinforcing loop models the dynamics of collaboration, reputation and recognition, and commitment. As the potential to be recognized increases (decreases), the member feels more (less) committed to the CN environment. This in turn results in a strengthening (weakening) in motivation to collaborate within the CN environment. When member collaboration increases (decreases), the potential to be recognized and gain reputation also increases (decreases). |
| Capability Reinforcing Loop (CAPAB-R) | This reinforcing loop models the dynamics of reputation and recognition, member satisfaction, and member performance motivation. When the potential of a good reputation and recognition by the CN peers increases (decreases), it contributes to the growth (decay) of the member’s satisfaction (in terms of self-esteem). As soon as the member’s satisfaction increases (decreases), the motivation to achieve high levels of performance is incremented (decremented). A high (low) level of performance motivation concedes an increase (decrease) in the potential to be recognized and earn a reputation. |
| Communication Reinforcing Loop (COMMU-R) | This reinforcing loop models the dynamics of the collaboration dynamics the arousal, and communication. As the collaboration dynamics increase (decreases) arousal is positively (negatively) influenced. As the arousal represents the activation level of the CN member, when it increases (decreases), communication also tends to increase (decrease), because the member has energy to socialize. The effect of this increment (decrement) in communication implies an increase (decrease) in the collaboration forms to put the communication in practice. |
| Fulfilment Reinforcing Loop (FULF-R) | This reinforcing loop models the dynamics among the member’s satisfaction, commitment, and valence. When the member’s satisfaction grows (decays), it positively (negatively) influences the level of commitment of the member. In other words, the more (less) satisfied the member, the more (less) committed the member is to its relationship with the CN environment. With the augmentation (diminishing) of commitment, the member increases (decreases) its valence. As valence represents the member’s pleasantness–unpleasantness mood, when it increases (decreases), level of satisfaction also increases (decreases) in proportion. |
| Valence Reinforcement Loop (VALE-R) | This reinforcement loop models the dynamics of the member commitment, the valence, and the potential to create conflicts. As the level of commitment of the CN member fortifies (weakens), valence is positively (negatively) influenced. As valence reveals whether the member is pleased or not, when it increases (decreases) the probability of the member initiating a conflict situation decreases (increases) in the same direction. As the potential to create conflict situations increases (decreases), the level of commitment of the member decreases (increases) accordingly. |
| Arousal Balancing Loop (AROU-B) | This balancing loop models the dynamics of the potential to create conflicts, the collaboration dynamics, and the arousal. As the potential to initiate a conflict situation increases (decreases), the collaboration dynamics are negatively (positively) affected. A decrease (increase) in the effort to maintain a healthy dynamism in collaboration leads to a drop (rise) in the arousal level. When the level of arousal decreases (increases), it might influence the creation of a conflict situation, depending on the value of valence. In other words, as arousal represents the CN member’s level of activity and excitement, when matched with valence it might provoke the creation of a conflict. For instance, if the arousal is negative and the valence is negative, the IME is depression. Depression is associated with inactiveness, which might leave the member quiet, without any energy. Consequently, the probability for creating conflicts is reduced. |
| Evidences Variables | Definition |
|---|---|
| Valence | The latest value of the estimated valence, so it represents the initial value of valence before the new estimation. |
| Arousal | The latest value of the estimated arousal, so it represents the initial value of arousal before the new estimation. |
| Valence Decay | The value of the decay that the valence dimension of ANE assumes for the CN environment. |
| Arousal Decay | The value of the decay that the arousal dimension of ANE assumes for the CN environment. |
| Total CN Members | The total number of registered members in the CN. |
| Active Members | The number of the active members within the CN. |
| Total CN VOs | Total number of VOs of the CN environment. Includes the VOs that successfully finished, the VOs that are under operation, the VOs that are in the formation phase and the ones that failed. |
| VOs Successfully Finished | Total number of VOs that have successfully finished within the CN environment. |
| VOs Under Operation | Total number of VOs that are in the phase of operation within the CN environment. |
| VOs Failed | Total number of VOs that have failed either in the creation or the operation phase within the CN environment. |
| VOs Being Created | Total number of VOs that are in the phase of creation within the CN environment. |
| CN Performance Evaluation | The performance evaluation value of the CN. Represents the assessment of the performance of the CN according to a set of performance indicators. |
| CN Trust | The level of trust that is established among the members involved in the CN environment according to a pre-defined set of trust criteria. Represents the value of the trust assessment of all CN members. |
| CN Value System Alignment | The measure of the alignment of the value system of the CN with the value systems of all CN members. |
| CN Sharing Ratio | The ratio of knowledge and resources sharing within the CN. Results from the (sum of shares per CN members divided by the total CN shares) divided by (the total CN members). |
| CN Informal Networks Ratio | The ratio of informal networks within the CN per CN member. Results from (the sum of informal networks that a member belongs to divided by the total amount of informal networks) divided by the (total CN members). |
| Communication Intensity | The measure of the overall frequency of interactions amongst members of the CN. Represents the dynamics of communication within the CN. |
| CN Income | The total earnings of the CN resulting, for instance, both from the members’ fees and the pre-established percentage of the VOs’ overheads. |
| CN Costs and Expenses | The total costs and expenses of the CN. Costs and expenses represent the amount that must be paid in order to get something, such as specific software or the expenses of insurance and taxes. |
| Excitement Frequency | The total amount of excitement present amongst the CN members. It is the total number of members that forms the excitement IME state within the universe of the CN. |
| Contentment Frequency | The total amount of contentment present amongst the CN members. It is the total number of members that forms the contentment IME state within the universe of the CN. |
| Frustration Frequency | The total amount of frustration present amongst the CN members. It is the total number of members that forms the frustration IME state within the universe of the CN. |
| Depression Frequency | The total amount of depression present amongst the CN members. It is the total number of members that forms the depression IME state within the universe of the CN. |
| Neutral Frequency | The total amount of neutral IME present amongst the CN members. It is the total number of members that forms the neutral IME state within the universe of the CN. |
| CN Goals | Definition | Sust. Pillars |
|---|---|---|
| Collective Performance | The collective contribution to the performance of the CN. Reflects the dynamics of the organizational, business and social practices, relating the results of the CN to the intended goals and objectives. | Economic Social |
| Financial Health | The financial health or monetary situation of the CN. It measures the overall financial aspects of the CN that include the amount of net income and a prediction of the short-term expenses. | Economic |
| Innovation and Value Creation | The measure of the successful innovation and value creation actions within the CN. It represents the degree of new concepts, services or products and knowledge development that deliver value to the CN as a whole. | Economic |
| Conflict Risks | The level of risk of conflict situations within the CN environment. Avoidance or low-level risk of conflicts is one of the CN goals for sustainability. Might be activated whenever the other CN goals are put in jeopardy, like, for instance, in case of a low level of trustworthiness or problems in community building. The consequence is then reflected in the CN performance and value creation. | Economic Social |
| Level of Interactions | The level of connections and relations among CN members. Reflects the communication exchanges and collaboration dynamics across the CN. | Social |
| Community Building | The level of community availability (or sense of community, or constructed linkages) within the CN environment. It also reflects the extent to which CN members can work together effectively by means of creating communities around a specific purpose. | Social |
| Knowledge Creation Potential | The potential level for generating new knowledge. Represents the degree of information, knowledge and resources made available for the CN either by CN members individually or by informal networks created within the CN acting as communities or groups of interest. The availability of resources and the exchange of knowledge/information contributes indirectly to the social cohesion and ecological sustainability. The potential of knowledge creation influences the economic pillar. | Economic Social Environmental |
| Collective Commitment Reinforcing Loop (COCOM -R) | This reinforcement loop models the dynamics between collective performance, valence, conflict risks, and innovation and value creation, reflecting the notion of collective commitment. As innovation and value creation increase (decrease), a boost (blow) in collective performance potentially happens within the CN. With the improvement (worsening) of the collective performance, the valence dimension of the ANE tends to augment (diminish), due to being directly connected with the level of collective pleasantness. With a good (bad) valence, the risks of conflict situations within the CN environment diminish (augment). As the risks of conflict conditions decrease (increase), the CN environment gets healthier (sicker), leveraging (not leveraging) innovation and value creation. |
| Financial Performance Reinforcing Loop (FINPE -R) | This loop reinforces the dynamics between financial health and collective performance. Taking into account that financial health is a major objective of the CN that is being modeled, the better (worse) it is, the better (worse) the mechanisms for motivation and control of collective performance are. The higher (lower) the collective performance is, the healthier (sicker) the financial situation. |
| Innovation Reinforcing Loop (INNOV-R) | This reinforcing loop models the dynamics of the interaction level within the CN, community building, conflict risks, and innovation and values creation, reflecting the notion that without a healthier atmosphere among CN members, innovation and value creation suffer some consequences. As the level of interactions inside the CN increases (decreases), the potential for community building also increases (decreases), due to the strengthening (weakening) of bonds among members. Whenever the level of community building is high (low), the potential of conflict within the CN diminishes (augments). As the risk of a conflict situation decreases (increases), the atmosphere for innovation and value creation within the CN increases (decreases). With an increase (decrease) in innovation and value creation, there is the necessity for more (less) interaction among members, in order to pursuit the innovation requirements. |
| Community Reinforcing Loop (COM-R) | This reinforcement loop models the dynamics of community building, conflict risks, and level of interaction, reflecting the conditions that are important for community strengthening within the CN environment. Thus, as the level of interactions among CN members increases (decreases), the potential for the community to gain stronger ties also increases (decreases). As the community gets stronger (weaker), the risk of conflict diminishes (augments). As the conflictual risks decrease (increase), the interactions and relationships among members are strengthened (weakened) accordingly. |
| Knowledge Generation Reinforcing Loop (KNOW-R) | This reinforcement loop models the dynamics of the level of interactions, community building and knowledge creation potential, reflecting the conditions to reinforce the generation of knowledge. In this way, as the quality and intensity of interactions increases (decreases) the potential for strengthening (weakening) community ties increases (decreases). With the increase (decrease) of the sense of community and its ties, the likelihood of generating knowledge also increases (decreases). The augmentation (diminishing) of knowledge creation leads to more (less) interactions among members. |
| Valence Reinforcement Loop (VALEN-R) | This reinforcement loop models the dynamics of collective performance, valence, and risk of conflict situations, reflecting the conditions that influence (positively or negatively) the valence dimension, i.e., the pleased–unpleased level of the aggregated networked emotion. In this sense, as the collective performance gets higher (lower) the CN valence augments (diminishes). By lowering (raising) the risks of conflict, the collective performance actions tend to increase (decrease) accordingly. |
| Arousal Balancing Loop (AROUS-B) | This balancing loop models the dynamics among the interaction level, arousal and conflict risks, reflecting the tendency of the dynamic dimension of the aggregated network emotion. As the potential for conflict increases (decreases), the level of interaction among members is negatively (positively) affected. With the diminishing (increasing) interaction level, the arousal is influenced negatively (positively). When the level of arousal decreases (increases), it might influence the risks of conflicts either positively or negatively depending on the value of the valence. In other words, as arousal represents the aggregated level of excitement or enthusiasm of the CN, when matched with the valence it might leverage the risk of conflict. For instance, if the arousal is positive but valence is negative, the ANE of the collaborative environment is frustration, meaning that the probability of conflict is high. |
| Type | Name | Initial Condition | |
|---|---|---|---|
| Input | Agent Initial State | 1 IMAgent is instantiated and, consequently, the two sub-agents iPerceptionAgent and iEmotionAgent. The initial IMEState is Neutral and the memberName is Company A. | |
| Output | IME State | The activated emotion that is delivered from the iEmotionAgent sub-agent, corresponding to the values of the tuple <Valence, Arousal>. | |
| Parameters | Own Data | ValenceDecay | 0.2 |
| ArousalDecay | 0.2 | ||
| VOPplanner | 1 (VO under creation that is being planned by this company) | ||
| VOPpartner | 3 (Partner of VOs that have successfully finished) | ||
| PerfEval | 0.8 | ||
| NeedsExpectMet | 0.8 | ||
| Profitability | 0.8 | ||
| BelongInformalNets | 0.75 (Belongs to three informal nets out of a total of four) | ||
| SharedKnowResour | 0.16 (Shared one resources and knowledge out of a total of six) | ||
| CommFreq | 0.8 (is being extremely participative and active) | ||
| CommEffect | 0.2 | ||
| CN Data | TCNMemb | 5 | |
| TotalCNVOs | 6 | ||
| ANEState | Neutral | ||
| CNTrust | 0.8 | ||
| CNVSAlign | 0.8 | ||
| Events | InvitVO | 0 (event not active) | |
| IncentReward | 0 (event not active) | ||
| CNSocProtViol | 0 (event not active) | ||
| CNTrustBreach | 0 (event not active) | ||
| CNVSMisalign | 0 (event not active) | ||
| Scenario | Description | Sensitivity Analysis | Expected Outcomes |
|---|---|---|---|
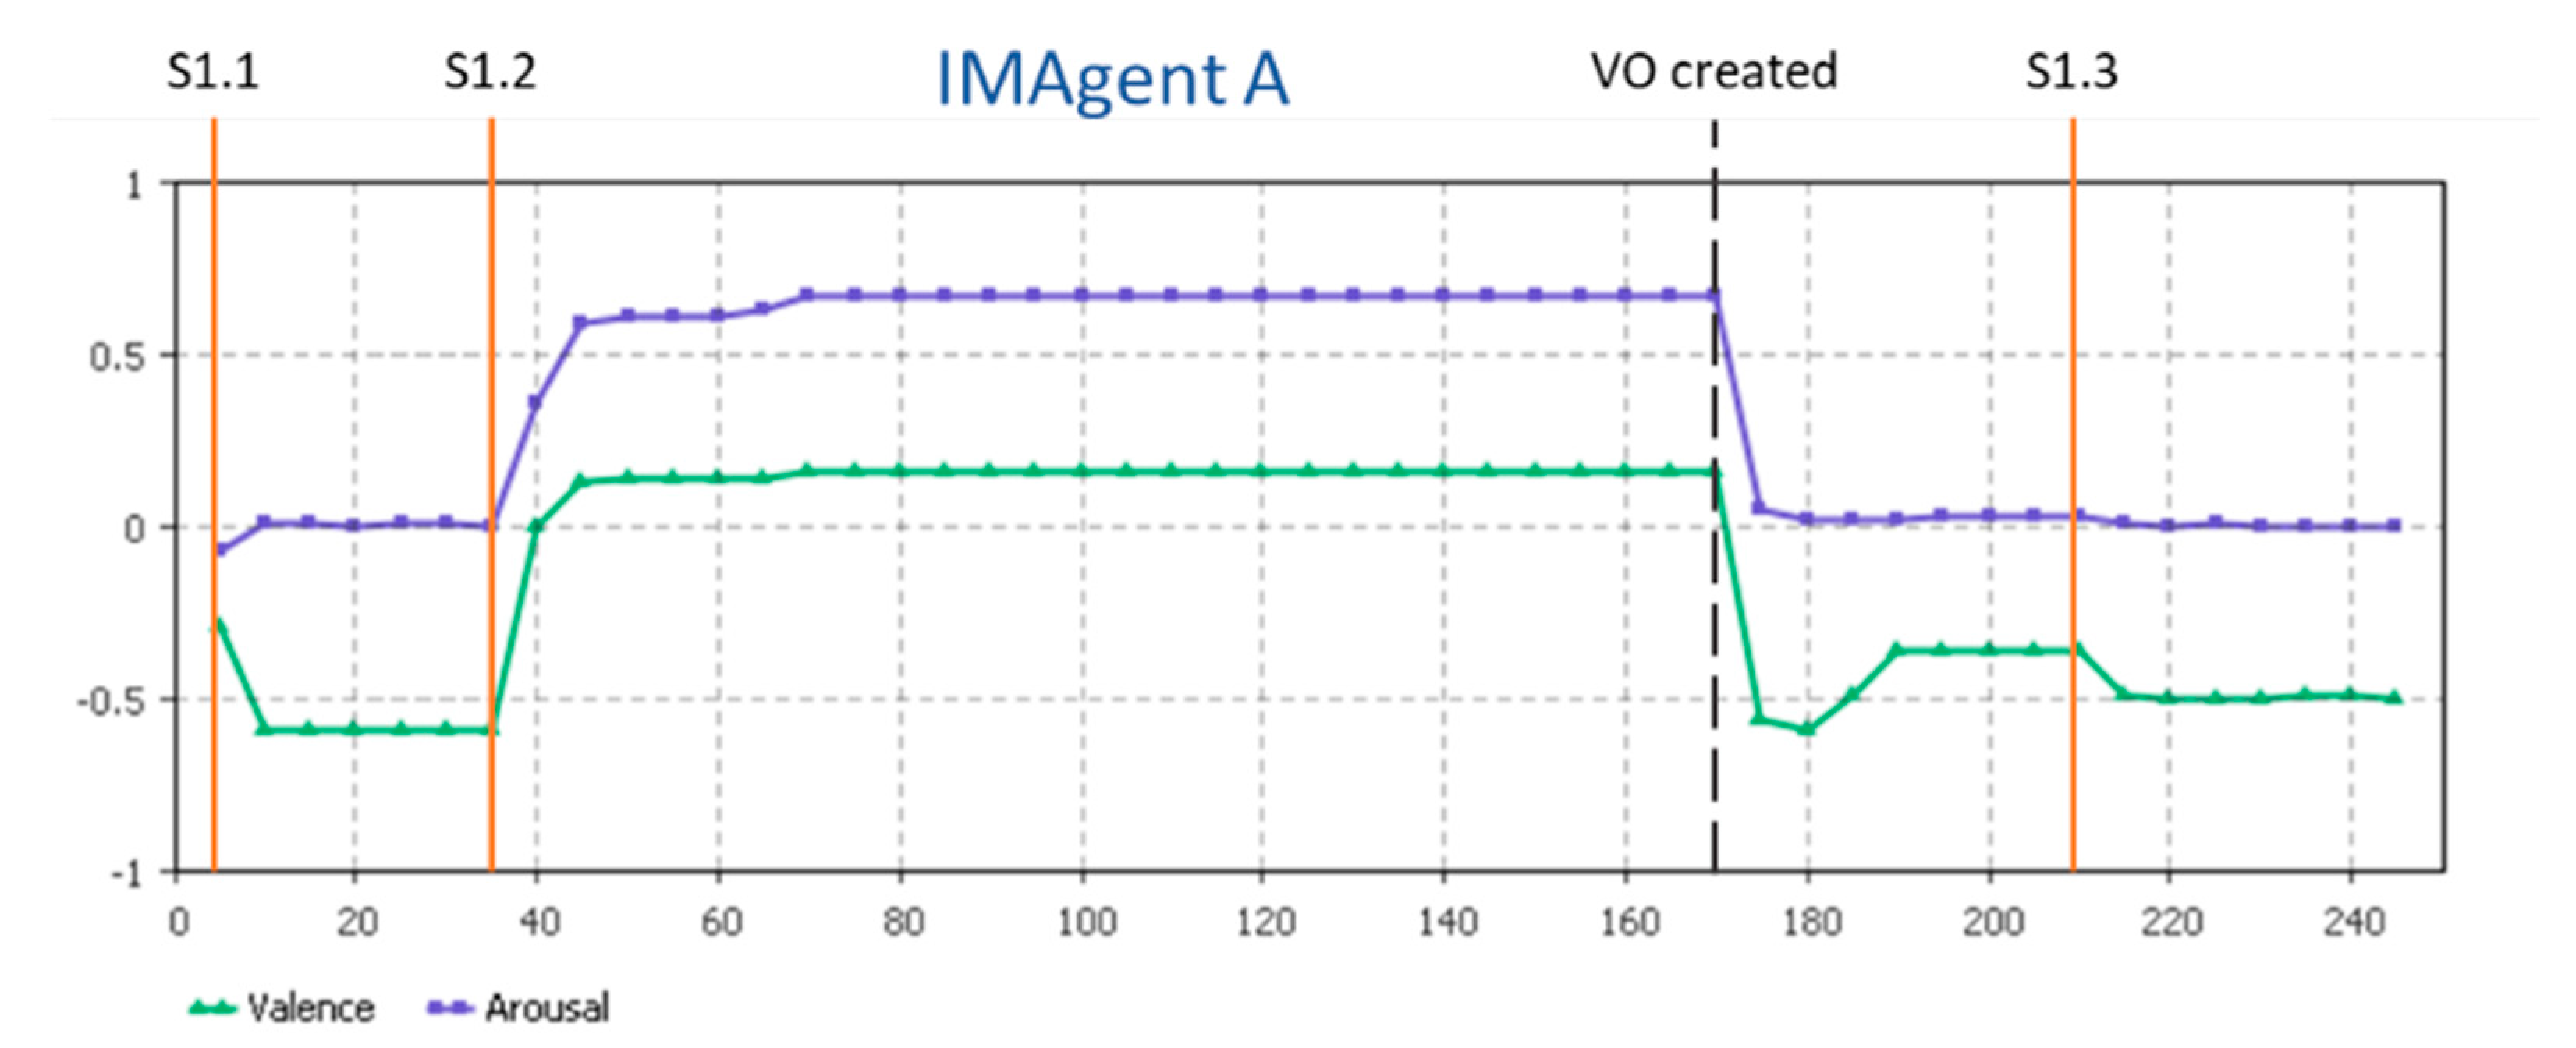
| S.1.1 | This scenario runs the initial condition of the involved agent | Initial conditions from the involved agent | Frustration |
| S.1.2 | During the runtime the involved agent receives an invitation to participate in a VO | InvitVO varies from 0 to 1 (deactivated to activated) | Excitement |
| S.1.3 | Serious conflicts occurred between partners of a VO and the CN due to lack of transparency in some royalty issues… This activated a trust breach in the CN environment. | CNTrustBreach varies from 0 to 1 (deactivated to activated) | Depression |
| Type | Name | Initial Condition | |
|---|---|---|---|
| Input | Agent Initial State | 1 CNAgent is instantiated and, consequently, the two sub-agents cPerceptionAgent and aEmotionAgent. The initial ANEState is neutral. | |
| Output | ANE State | The activated aggregated emotion that is delivered from the aEmotionAgent sub-agent, corresponding to the values of the tuple <Valence, Arousal>. | |
| Parameters | Own Data | ValenceDecay | 0.2 |
| ArousalDecay | 0.2 | ||
| TCNmemb | 5 (The total number of members) | ||
| ActiveMembs | 4 (The IMAgent A, IMAgent B and other two) | ||
| TotalCNVOs | 6 | ||
| VOsSuccess | 5 | ||
| VOsOperation | 0 | ||
| VOsFailed | 0 | ||
| VOsCreation | 1 | ||
| CNPerfEval | 0.6 | ||
| CNTrust | 0.8 | ||
| CNVSAlign | 0.8 | ||
| CNSharingRatio | 0.2 (The total of shared assets is six) | ||
| CNInformnalNets | 0.7 (The total of Informal nets is four) | ||
| CommIntensity | 0.5 (Overall communication) | ||
| CNProfitability | 0.6 | ||
| Member | ExcitFreq | 0 | |
| ContFreq | 3 | ||
| NeutralFreq | 0 | ||
| FrustFreq | 1 | ||
| DepreFreq | 1 | ||
| Scenario | Description | Sensitivity Analysis | Expected Outcomes |
|---|---|---|---|
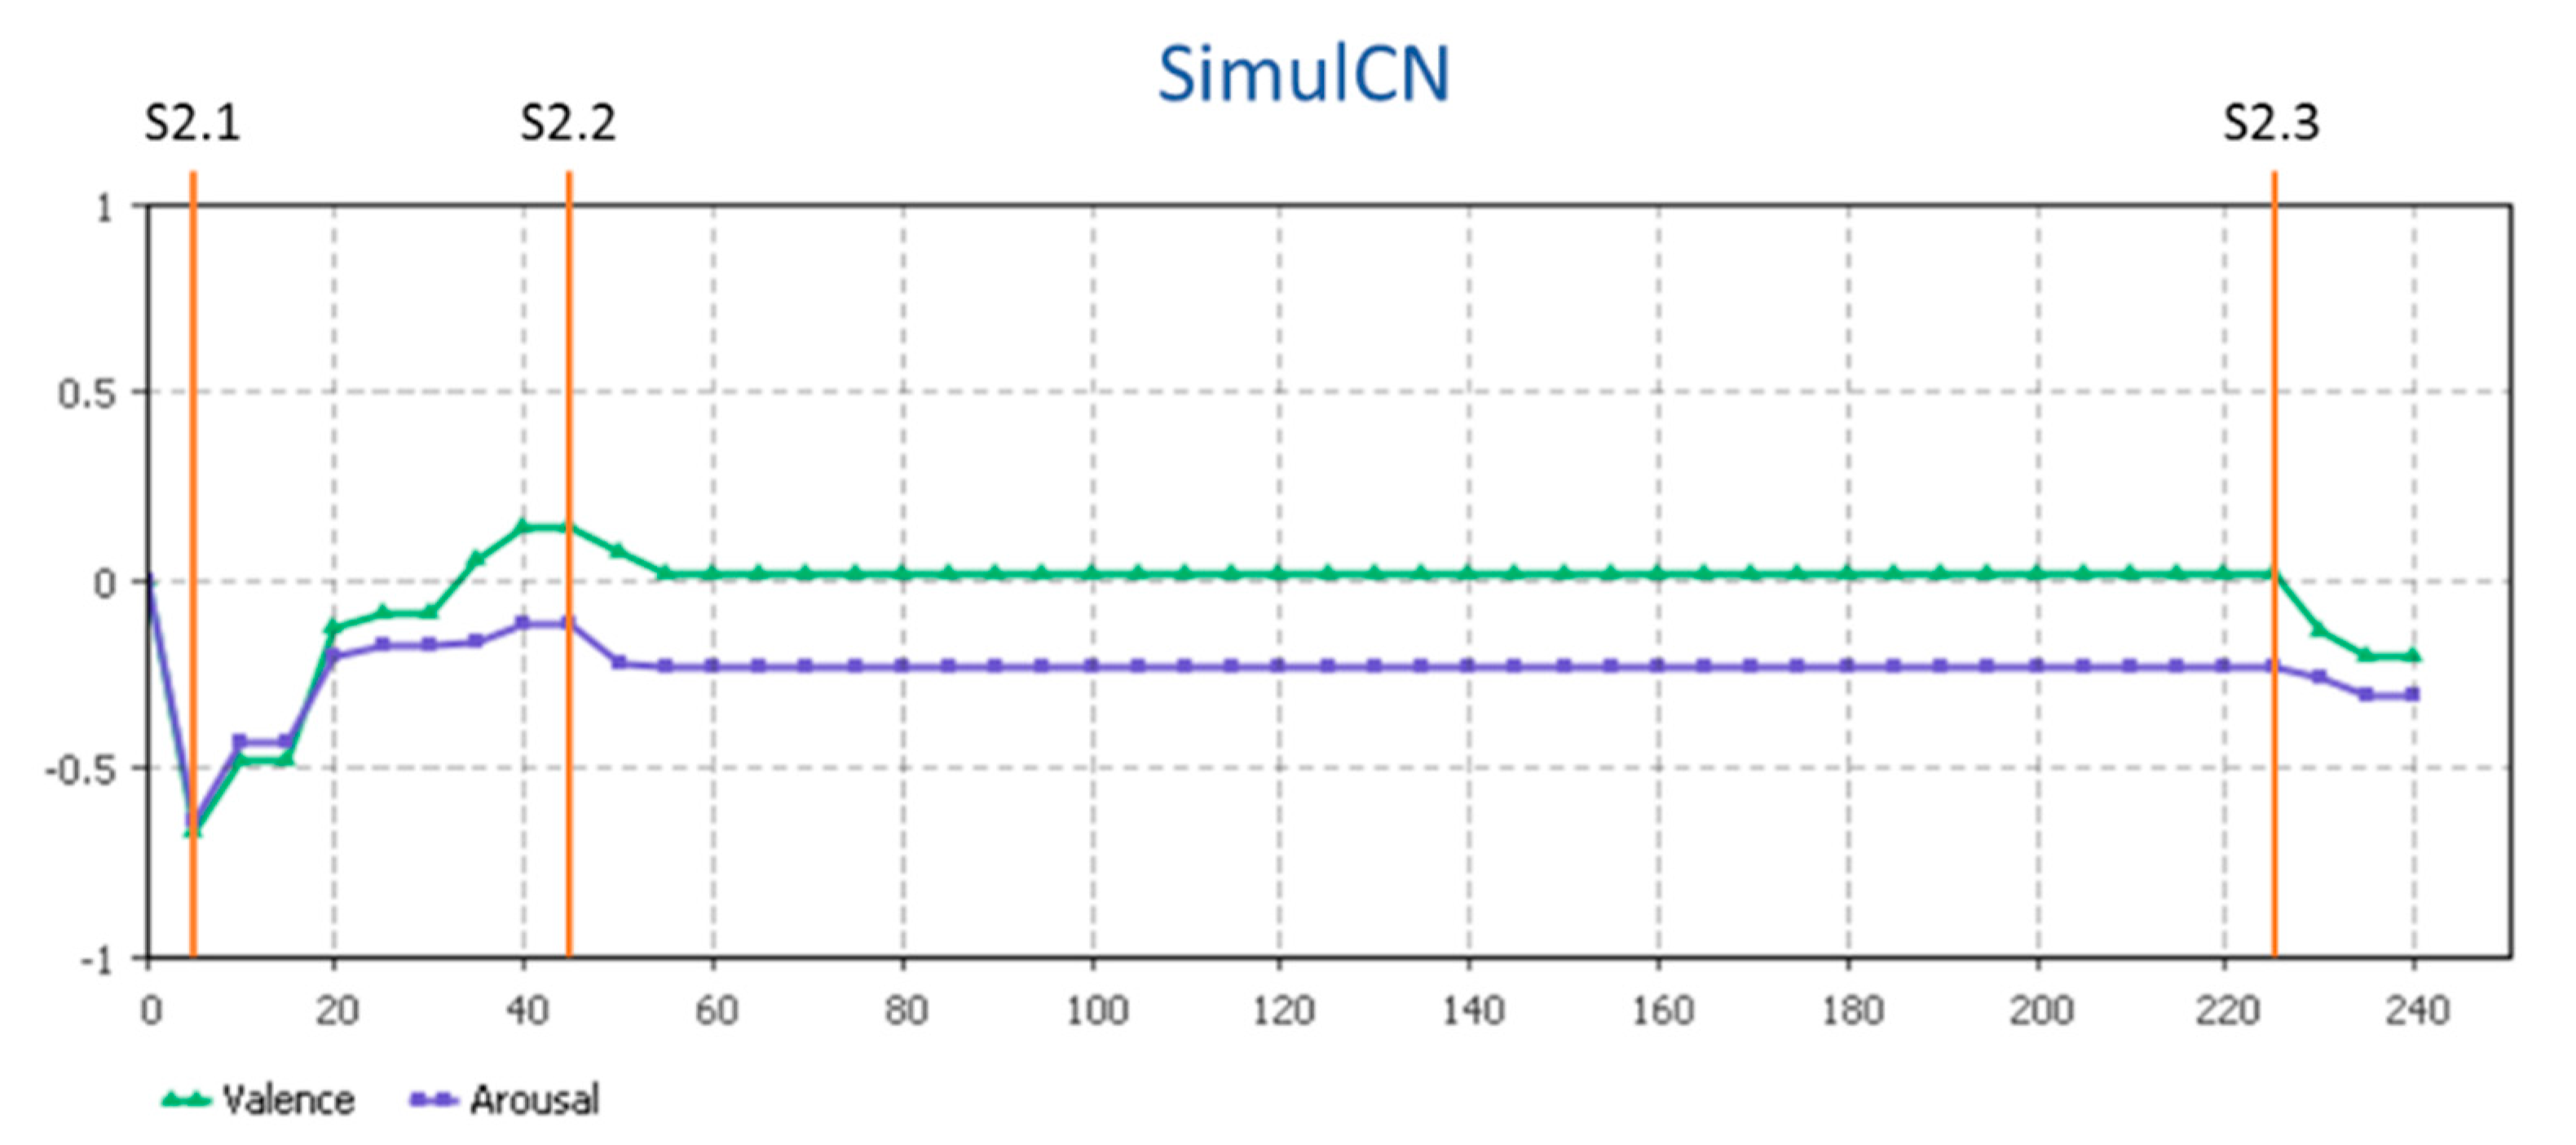
| S.2.1 | This scenario runs the initial condition of the involved agent. | Initial conditions from the involved agent. | Contentment |
| S.2.2 | During the runtime the VO under creation failed, thus the level of values alignment and trust decreases substantially. | CNTrust, CNVSAlign decreases a portion of its current value. VOsCreation diminishes 1 and VOsFailed augments 1. | Depression/Contentment? |
| S.2.3 | During the runtime there is a shift in members’ IME states from contentment to depressed. | ContFreq decreases in the same value that the DepreFreq increases. | Depression |
© 2019 by the authors. Licensee MDPI, Basel, Switzerland. This article is an open access article distributed under the terms and conditions of the Creative Commons Attribution (CC BY) license (http://creativecommons.org/licenses/by/4.0/).
Share and Cite
Ferrada, F.; Camarinha-Matos, L.M. Simulation Model to Estimate Emotions in Collaborative Networks. Appl. Sci. 2019, 9, 5202. https://doi.org/10.3390/app9235202
Ferrada F, Camarinha-Matos LM. Simulation Model to Estimate Emotions in Collaborative Networks. Applied Sciences. 2019; 9(23):5202. https://doi.org/10.3390/app9235202
Chicago/Turabian StyleFerrada, Filipa, and Luis M. Camarinha-Matos. 2019. "Simulation Model to Estimate Emotions in Collaborative Networks" Applied Sciences 9, no. 23: 5202. https://doi.org/10.3390/app9235202
APA StyleFerrada, F., & Camarinha-Matos, L. M. (2019). Simulation Model to Estimate Emotions in Collaborative Networks. Applied Sciences, 9(23), 5202. https://doi.org/10.3390/app9235202