Review

On the Fault Detection and Diagnosis of Railway Switch and Crossing Systems: An Overview

School of Engineering, Birmingham Centre for Railway Research and Education (BCRRE), University of Birmingham, Edgbaston, Birmingham B15 2TT, UK
*
Author to whom correspondence should be addressed.
Appl. Sci. 2019, 9(23), 5129; https://doi.org/10.3390/app9235129
Submission received: 24 October 2019 / Revised: 20 November 2019 / Accepted: 22 November 2019 / Published: 27 November 2019
(This article belongs to the Special Issue Machine Fault Diagnostics and Prognostics)

Abstract

:
Railway switch and crossing (S&C) systems have a very complex structure that requires not only a large number of components (such as rails, check rails, switches, crossings, turnout bearers, slide chair, etc.) but also different types of components and technologies (mechanical devices to operate switches, electrical and/or electronic devices for control, etc.). This complexity of railway S&C systems makes them vulnerable to failures and malfunctions that can ultimately cause delays and even fatal accidents. Thus, it is crucial to develop suitable condition monitoring techniques to deal with fault detection and diagnosis (FDD) in railway S&C systems. The main contribution of this paper is to present a comprehensive review of the existing FDD techniques for railway S&C systems. The aim is to overview the state of the art in rail S&C and in doing so to provide a platform for researchers, railway operators, and experts to research, develop and adopt the best methods for their applications; thereby helping ensure the rapid evolution of monitoring and fault detection in the railway industry at a time of the increased interest in condition based maintenance and the use of high-speed trains on the rail network.

1. Introduction

The railway market is growing stronger worldwide. The 2018 Worldwide Market for Railway Industry study, published by SCI Verkehr [1], reported an increase in annual growth rate from 1.3% (2016) to 2.4% (2018), and growth is predicted to continue as shown in Figure 1.
Particularly good prospects are expected from this growth; however, high performance of rail-based transport systems should be guaranteed since a number of uncertainties could greatly challenge this fast development, especially with the introduction of long-term strategy objectives such as a step change in behavior and organization in railways to benefit from e-mobility and electrification [2]. Therefore, important technical trends should be considered including technologies for alternative traction systems to reduce emissions, digitalization and automation of rail transport to achieve the long-term objective of autonomous mainline trains [3], and condition monitoring (CM) techniques to ensure the safe and reliable running of trains, especially with the increased use of high-speed ones on rail networks. Nowadays, fixed intervals (i.e., periodic maintenance) are considered for maintenance, where maintenance experts use their own experience and insight to detect any abnormalities by using their eyes, ears, and/or noses. These fixed intervals are different in length depending on the level and type of use of the machine and also on company policy, e.g., 2 weeks in the Central Japan Railway Company and 6 weeks in the London Underground railway [4]. One of the key infrastructure components in railways is the switch and crossing (S&C) system (also known as a turnout and/or railway point) that allows trains to switch between two tracks. S&C systems have a density of one every 1 km in most railway networks, which means over 300,000 units within the rail networks of the EU27 countries alone [5].
A railway S&C system is a safety-critical asset that is always required to be highly reliable since its failure or downtime can cause system delay or even fatal accidents, such as the Potters Bar accident in 2002 (seven deaths and 76 injuries) [6]. Maintaining and/or renewing the tens of thousands of S&C systems across the rail network is an expensive business, costing hundreds of millions of dollars every year. In 2009/10, the United Kingdom (UK) rail infrastructure manager, Network Rail, spent £32 million on recovering from failures within S&C [7]. The total cost for only 27 pieces of railroad switches within a 30-year evaluation period reached €6 million in the town of Ceska Lipa (northern region of the Czech Republic) [8]. In Switzerland, more than a billion Swiss Francs, approximately 25% of the budget for maintenance and renewal of railway tracks, was used for S&C systems [9]. Just 5.5% of S&C track of the total track length of the Swedish railway network was found to cost more than 13% of the total maintenance cost [10] and its failures caused 14% of all train delays [11]. Statistics from the railway from Zhuzhou to Hengyang in China showed that more than 40% of the total failures were related to S&C equipment failure [12]. In addition, in a cost-consolidation exercise within the INNOTRACK project in 2010 [13], it was found that S&C system maintenance and inspection accounted for around 19% of the total maintenance costs in the UK, and in the financial year 2011/2012, S&C cost the rail infrastructure owner 24% of the total track maintenance budget and 23% of renewal budgets, whilst accounting for only 5% of network mileage [14].
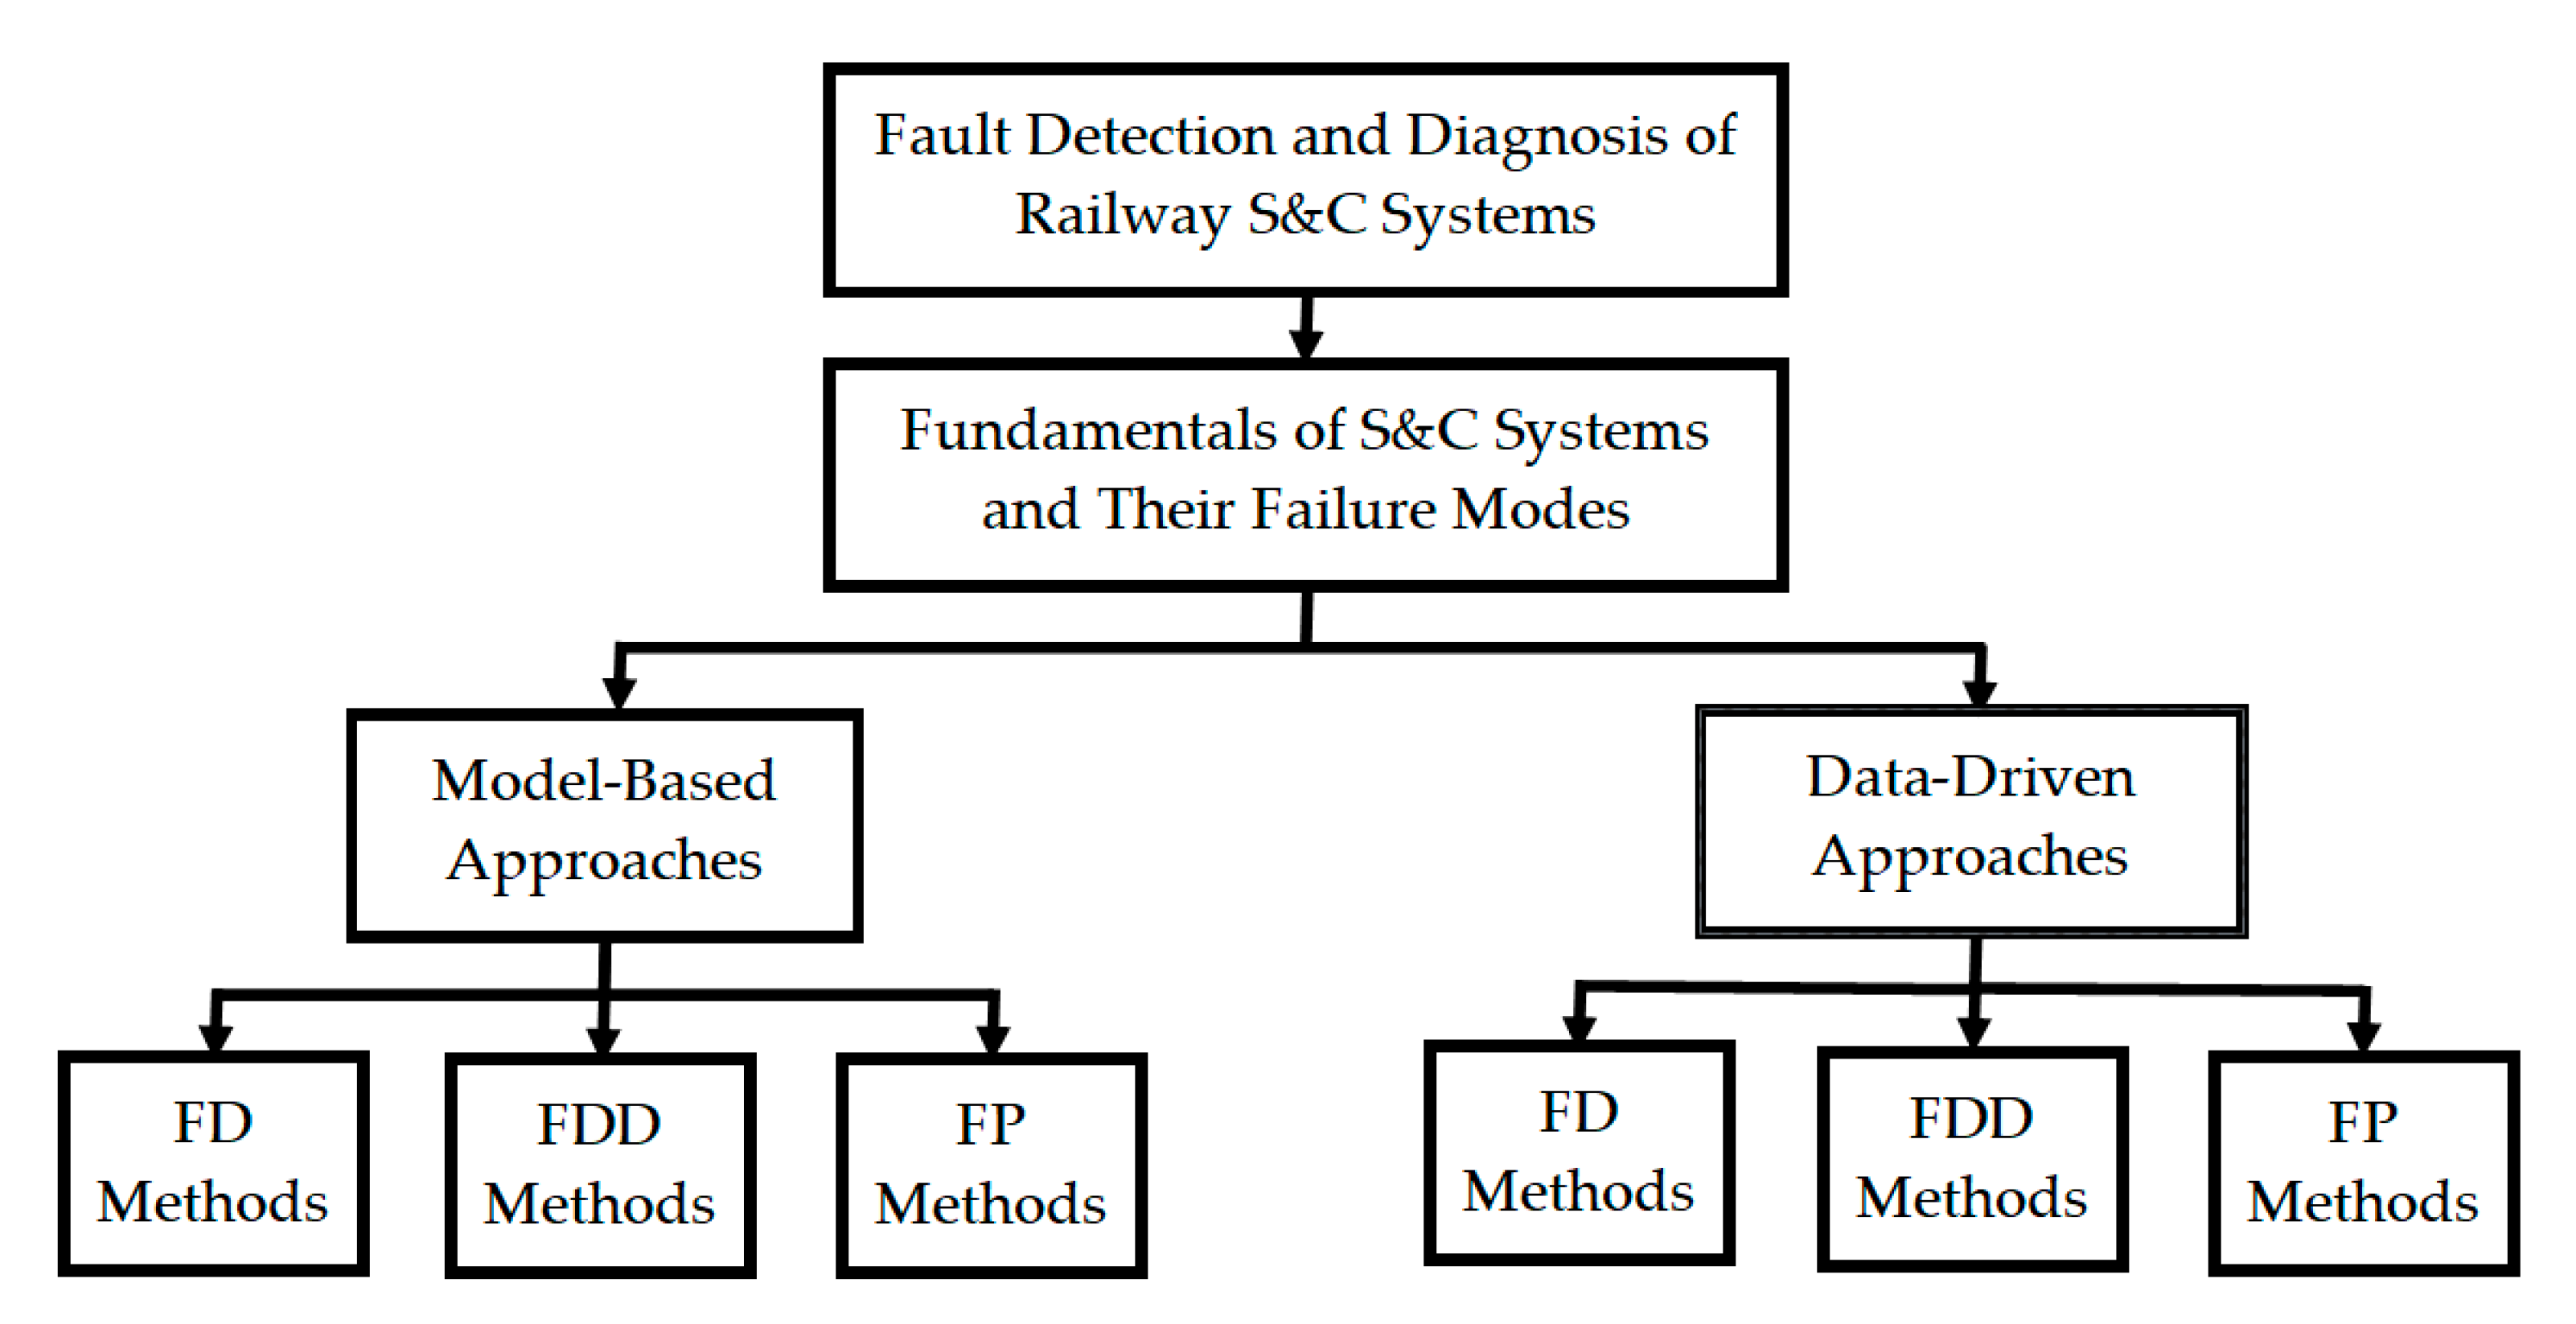
Therefore, recently, both railway infrastructure managers and researchers have started focusing on developing reliable CM techniques for S&C systems [15]. This paper thus first provides the fundamentals of S&C systems by focusing on their mechanisms, the sensors and controllers installed, the actuators used, and their locking systems. Then, the different failure modes of railway S&C systems are briefly discussed. Finally, this paper provides a comprehensive overview of the existing CM techniques for dealing with the fault detection and diagnosis (FDD) and fault prognosis (sometimes) of railway S&C systems. In an attempt to better review the existing FDD methods for S&C systems, first these methods are classified into two groups, model-based approaches and data-driven approaches, and then three categories are considered for each group: (1) fault detection (FD) methods, which deal only with detecting the fault; (2) FDD methods that detect the presence or not of the fault and then diagnose its location and roots; and finally (3), fault prognosis (FP) methods in which remaining useful life (RUL) prediction is performed. The approaches described in this paper are structured as shown in Figure 2.
This paper is organized as follows: Section 2 introduces the fundamentals (mechanisms, sensors and controllers, actuators, and locking systems) of S&C systems, followed by a brief description of the different S&C failure modes and their causes. The different existing FDD algorithms applied to S&C systems are detailed in Section 3. Finally, a conclusion is given in Section 4.
To the authors’ knowledge, there is no review paper that focuses on reviewing the existing FDD techniques for the CM of railway S&C systems except the one published by Márquez et al. [16] a decade ago. To avoid any duplication, this paper will not review the papers already considered in the aforementioned review paper. It will just focus on giving an overview of the recent published papers related to the CM of railway S&C systems. In addition, the FDD methods applied for S&C systems were classified into non-dynamic and dynamic algorithms in the previous review paper, whereas in this paper, the FDD methods developed/applied to railway S&C systems are classified into model-based and data-driven methods. Another difference of this review paper is that it considers all research papers (that deal with detection and diagnosis (and sometimes prognosis) of different S&C system faults) from all around the world, and is not only narrowed to those within UK territory, contrary to the review paper of Márquez et al. [16].

2. Fundamentals of S&C Systems: Actuation Mechanisms, Sensors and Controllers, Locking Systems, and Their Failure Modes

A traditional railway S&C system consists of several individual elements such as the switch layout, actuation mechanism, sensor and control system, and detection and locking mechanism. In the following sections, these elements of a conventional switch system are described and new advances in each element are discussed in brief.
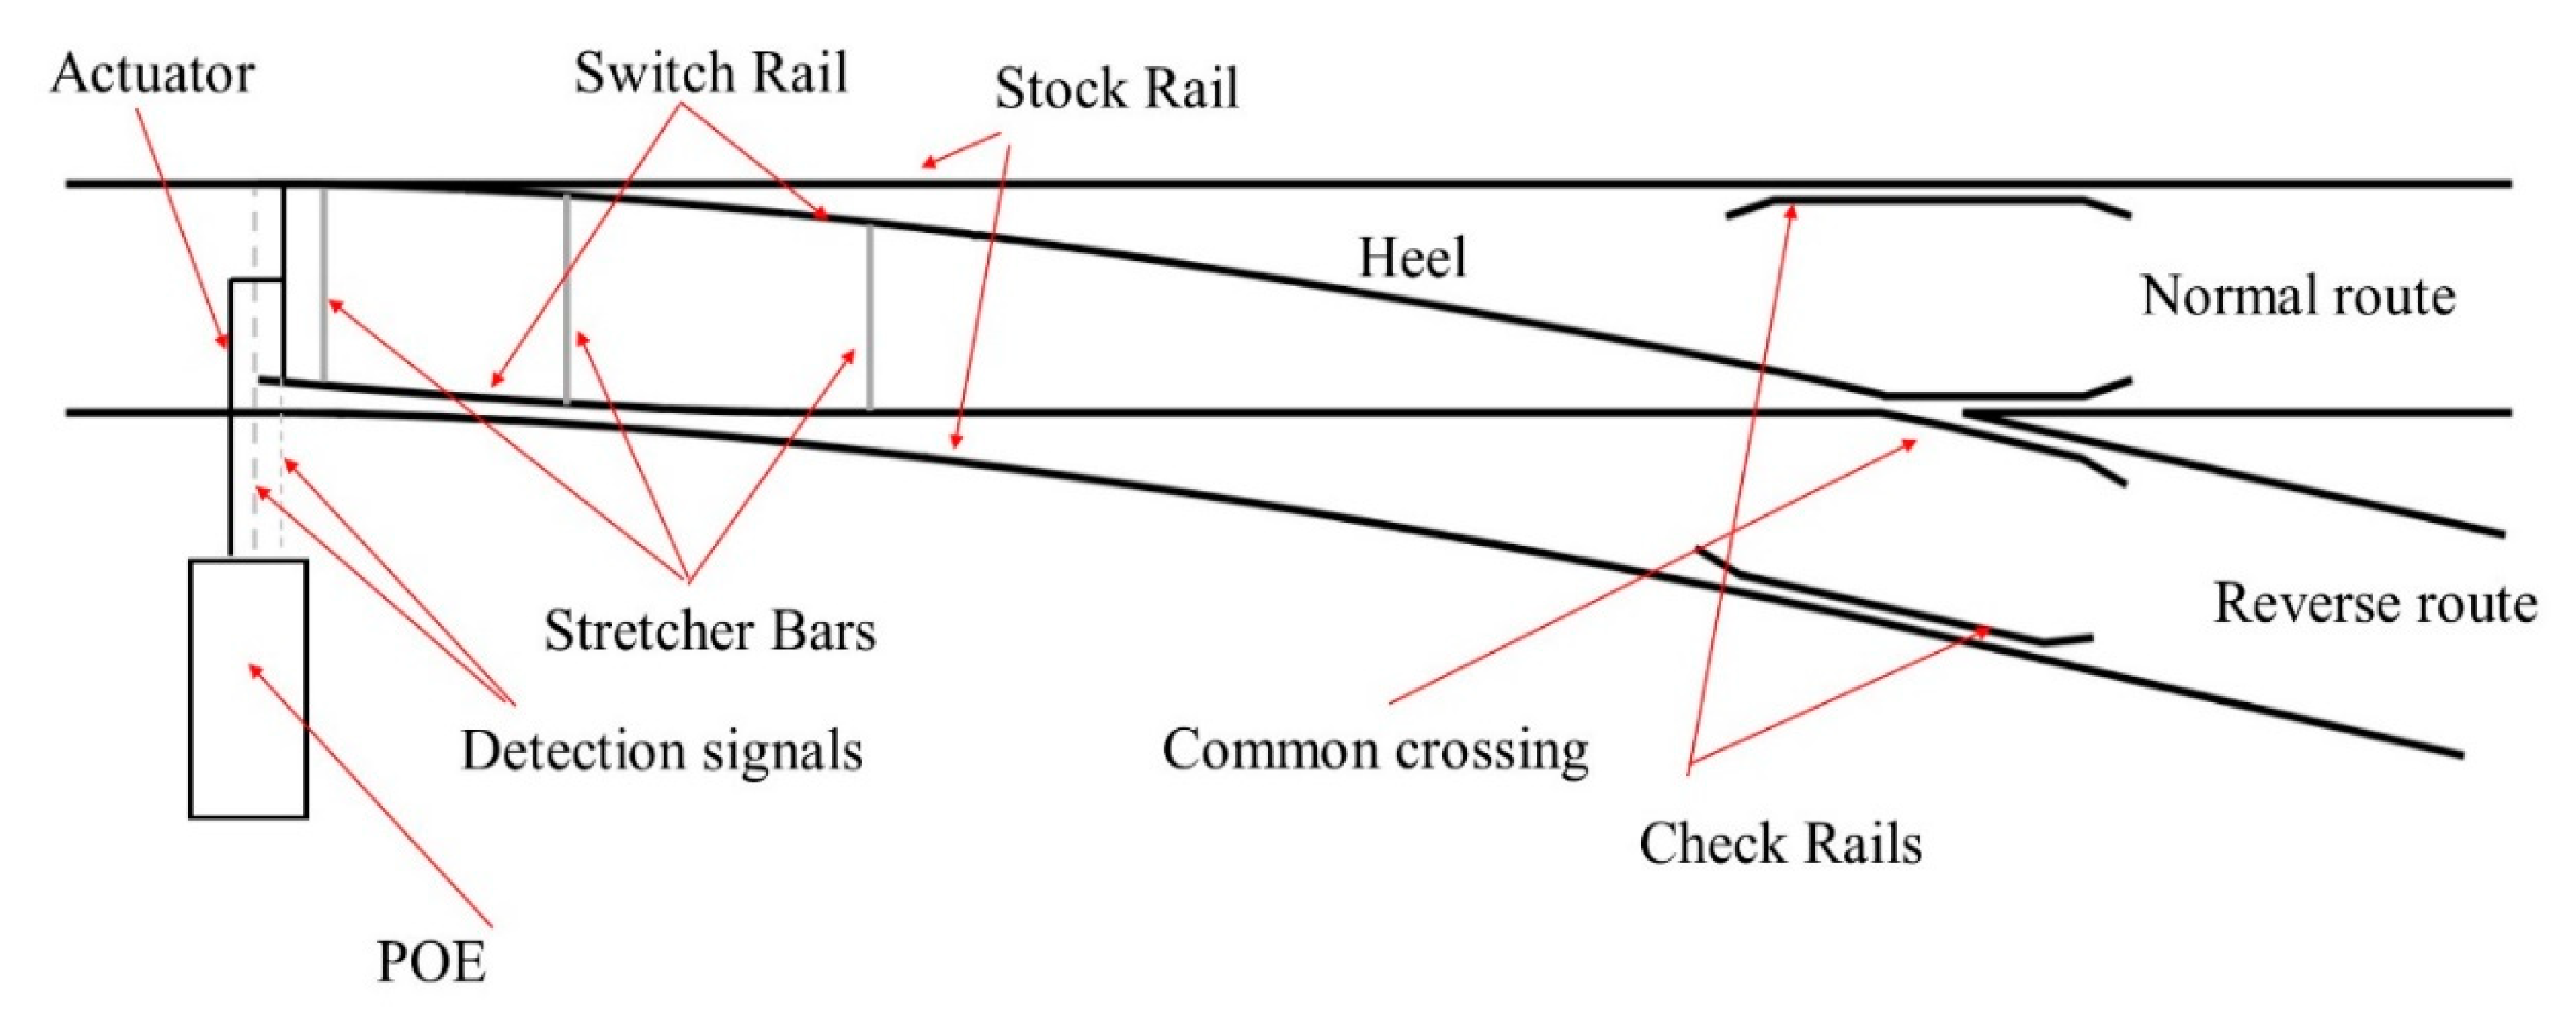
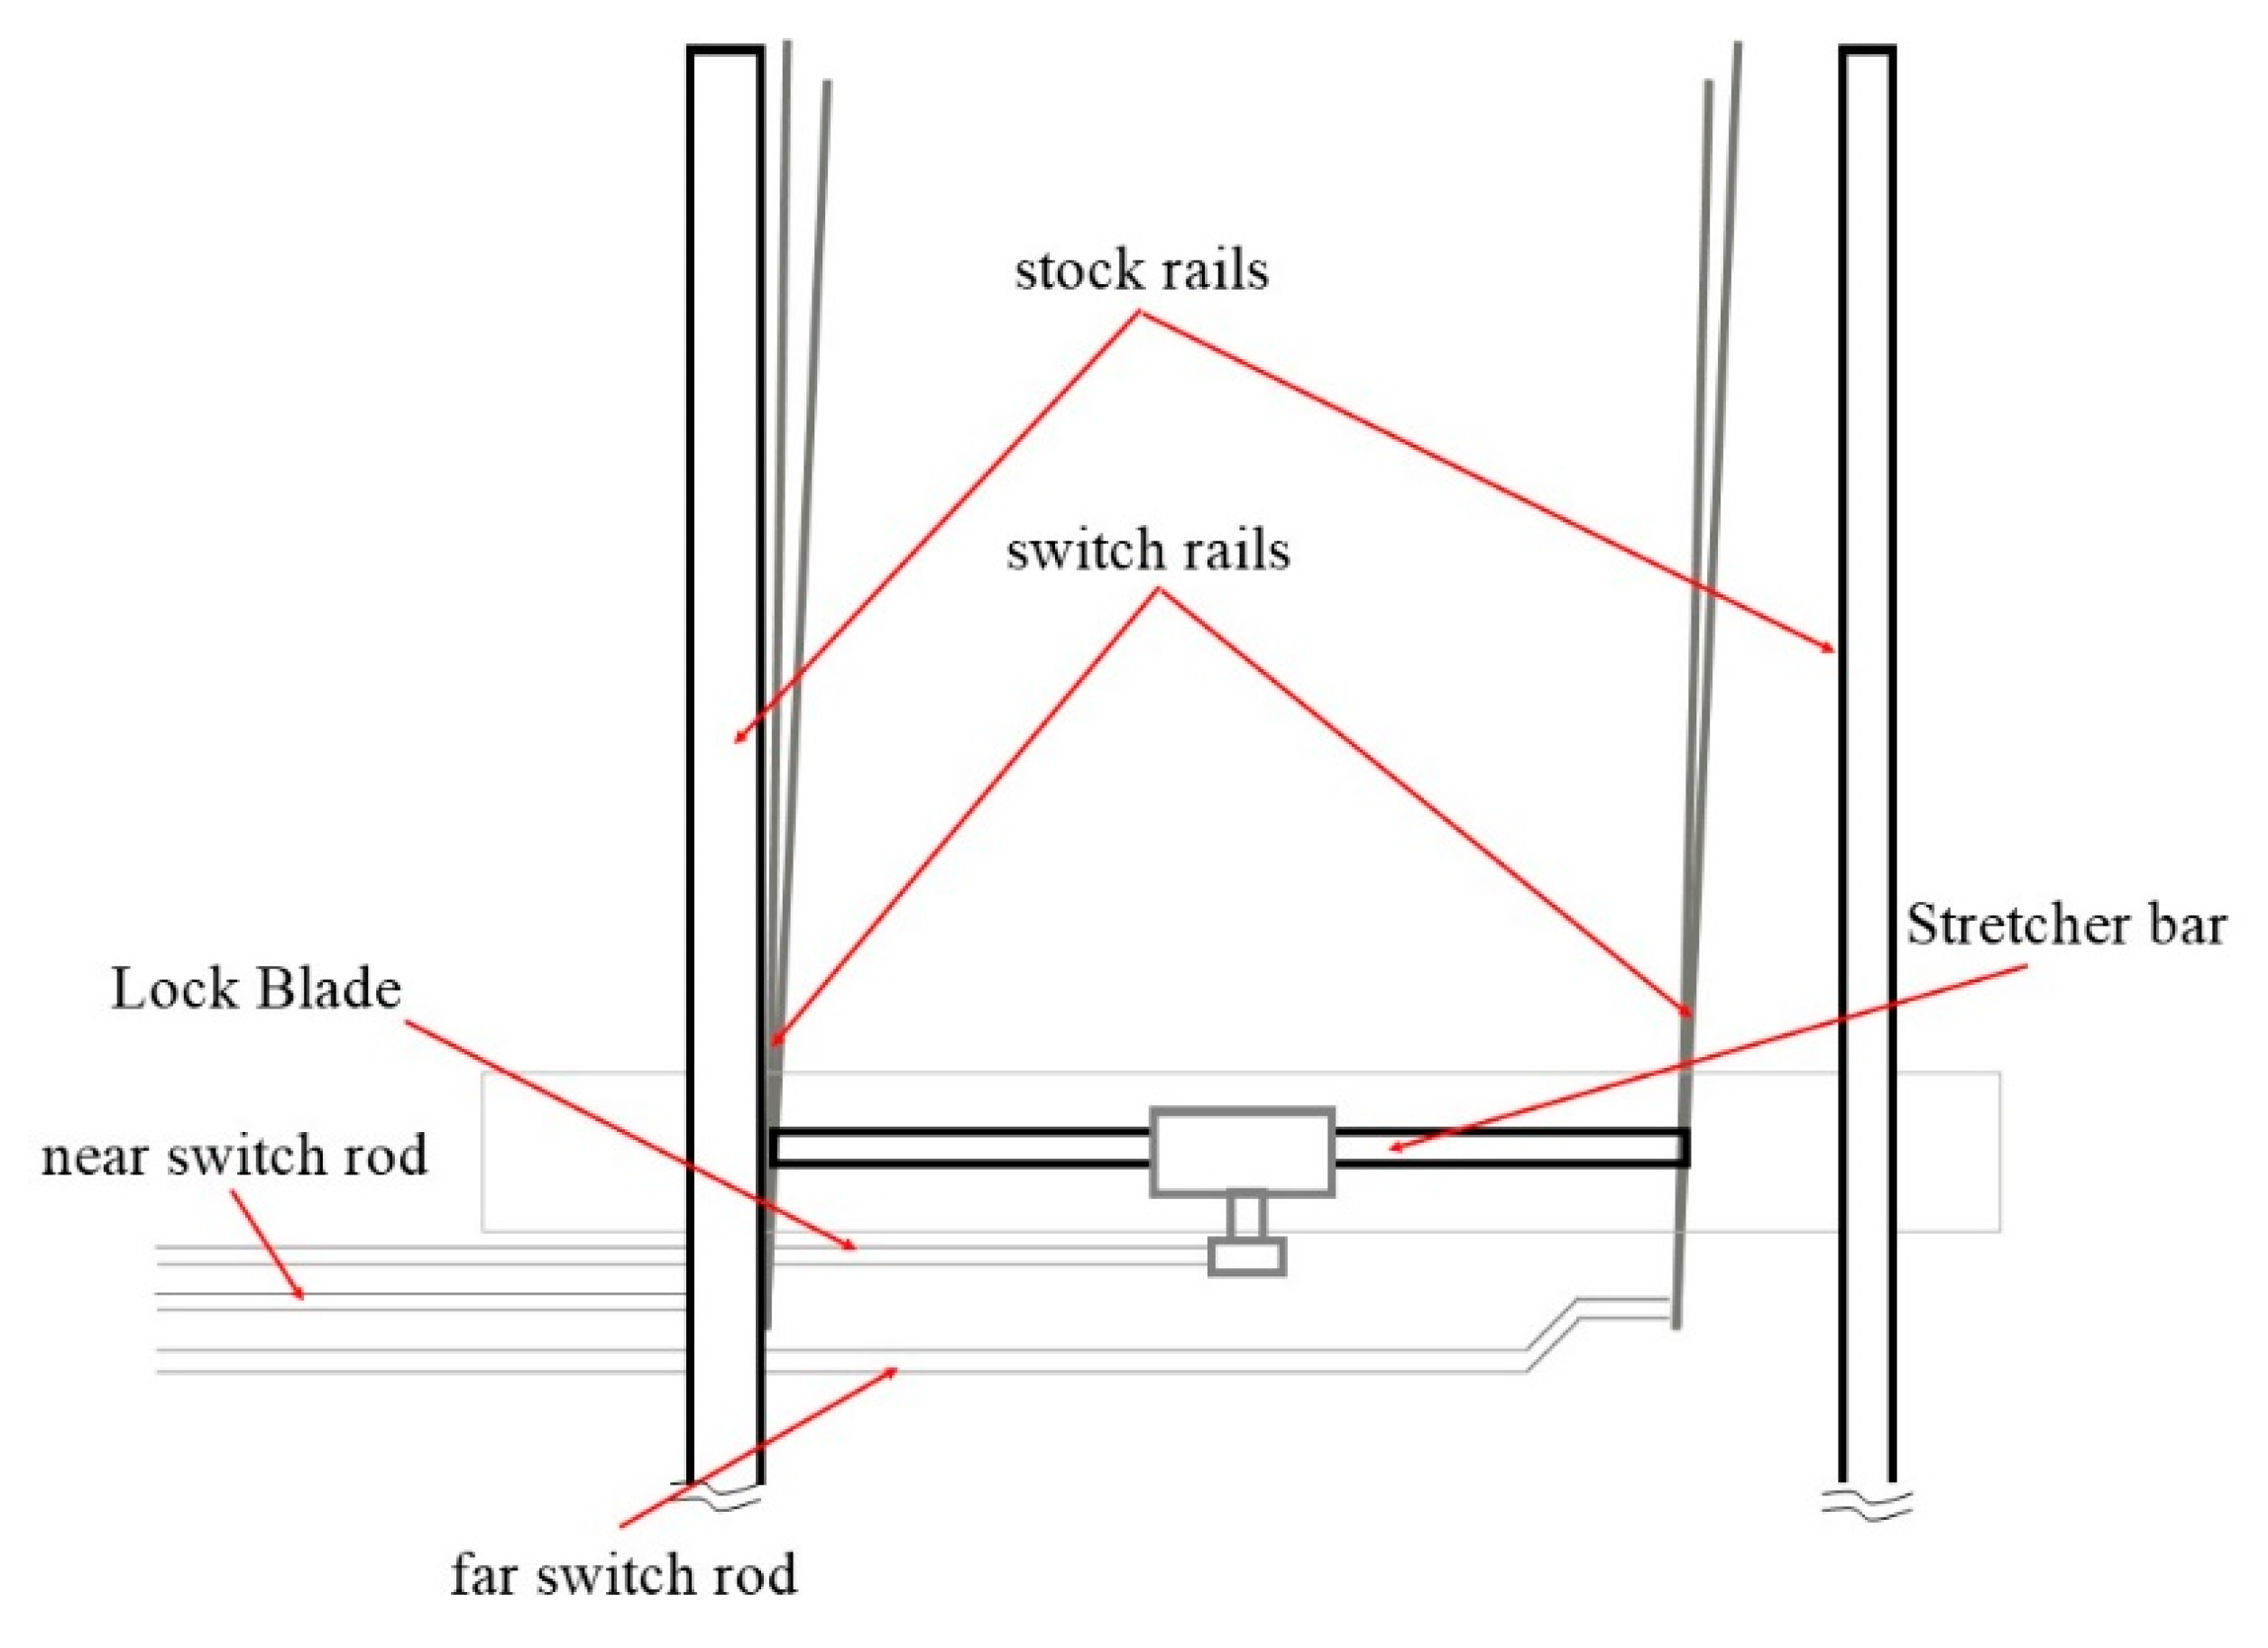
Most conventional railway S&C systems use a switch layout which consists of two switch rails and two stock rails [17]. Figure 3 shows a conventional switch layout used in a railway network, which can direct the rail vehicle to two different routes, normal and reverse. The switch rail in its closed position is locked adjacent to its stock rail, and the other switch rail is locked in the open position to allow the wheel to pass over the rail on the open side. The stretcher bars are connected between two switch rails to maintain free wheel passage. Point operating equipment (POE) is the actuator that moves the railway switch and ensures that the closed switch rail is always placed, locked, and detected relative to its associated stock rail [18]. The conventional switch layout (shown in Figure 3) is for the C-switch in the UK rail network, for which the design speed is 25 mph (40.248 km/h) according to NR60 design of Network Rail [19].
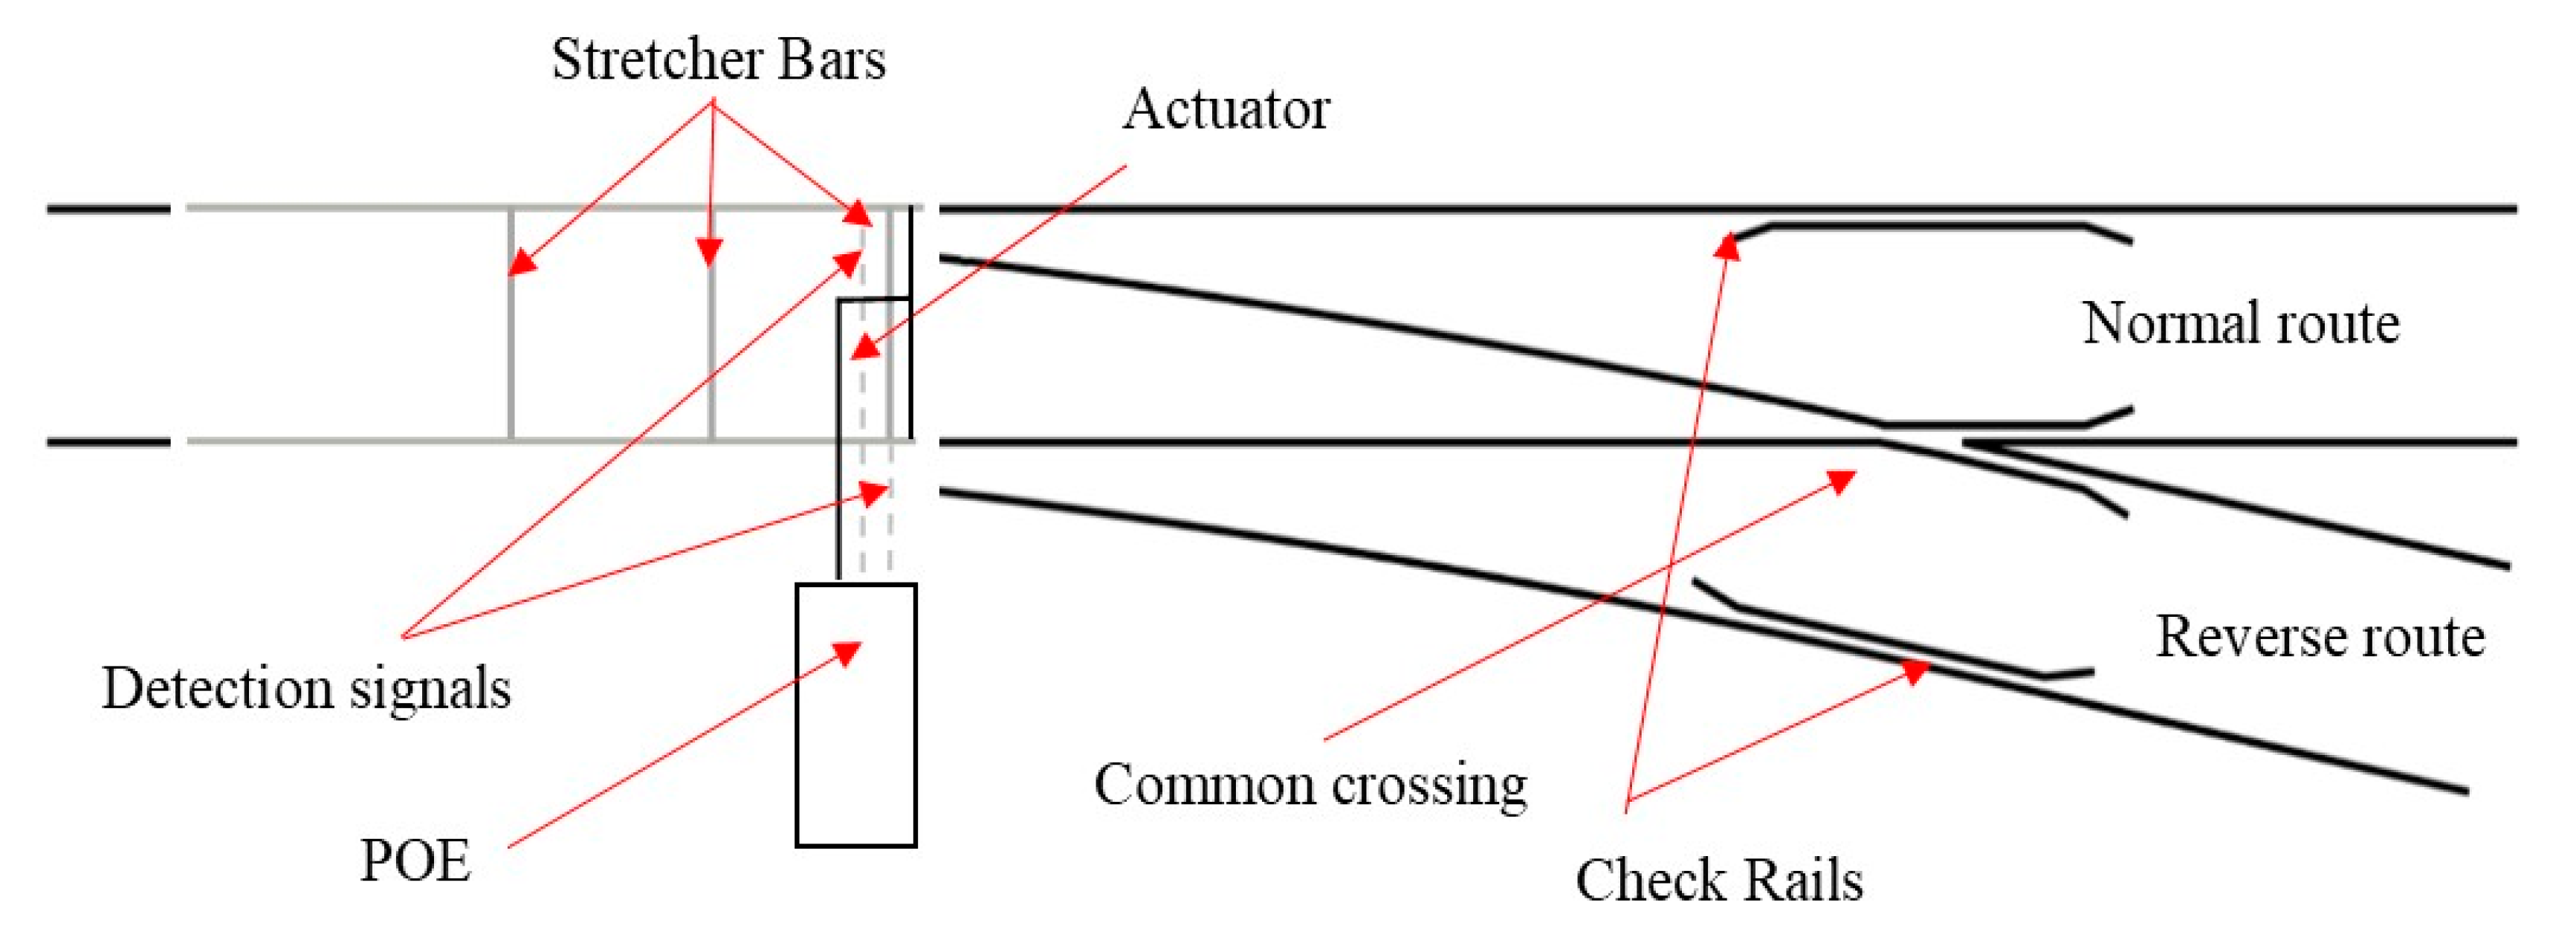
Other railway S&C layouts, such as a stub switch layout, are also used in the rail network [20,21]. In the stub switch configuration (shown in Figure 4), the switch toe and heel positions are swapped. One of the advantages of a stub switch is that it reduces the number of rails and a single switch can be used for more than two routes. But in stub switch arrangements it is difficult to control track alignments because of the discontinuity. Also, this type of system needs more flexible rails and is thus not used in main lines.
The different switch systems are listed in Table 1 along with their actuation mechanism and type, including mechanical, electromechanical, hydraulic, and electrohydraulic.

2.1. Actuation Mechanism

Upon receiving the command from the signaling block, the switch rails are actuated by the actuator mechanism which varies depending on the switch system used. The most commonly used switch systems are linear actuators which consist of mechanical linkages, whereas new actuation mechanisms are now developed which actuate the switch in the vertical plane.
The length of an S&C system varies depending on its type, and bending of the switch rails is important to satisfy the requirements of the system and security of the passing vehicle. For example, the minimum flange-way clearance is 56 mm for a vertical shallow C-switch (CVS [19]). To ensure this minimum clearance at the back of the switch, and to ensure the required bending of the switch rails, an additional drive, known as the backdrive, is often used. Some switch systems also use supplementary drives at the rear end to ensure clearance. The fastest switch used by Network Rail in the UK is installed with a clamplock actuator and Hy-Drive hydraulic supplementary drives [19]. In traditional switches, mechanical linkages are often connected between the front and rear stretcher bars to transfer the actuation force [15]. In high-performance switch systems (HPSS), this traditional backdrive is replaced by a torque tube called a Powerlink backdrive system, which is a torsional tube connected to the front and rear stretcher bar [34].

2.1.1. Linear Actuation

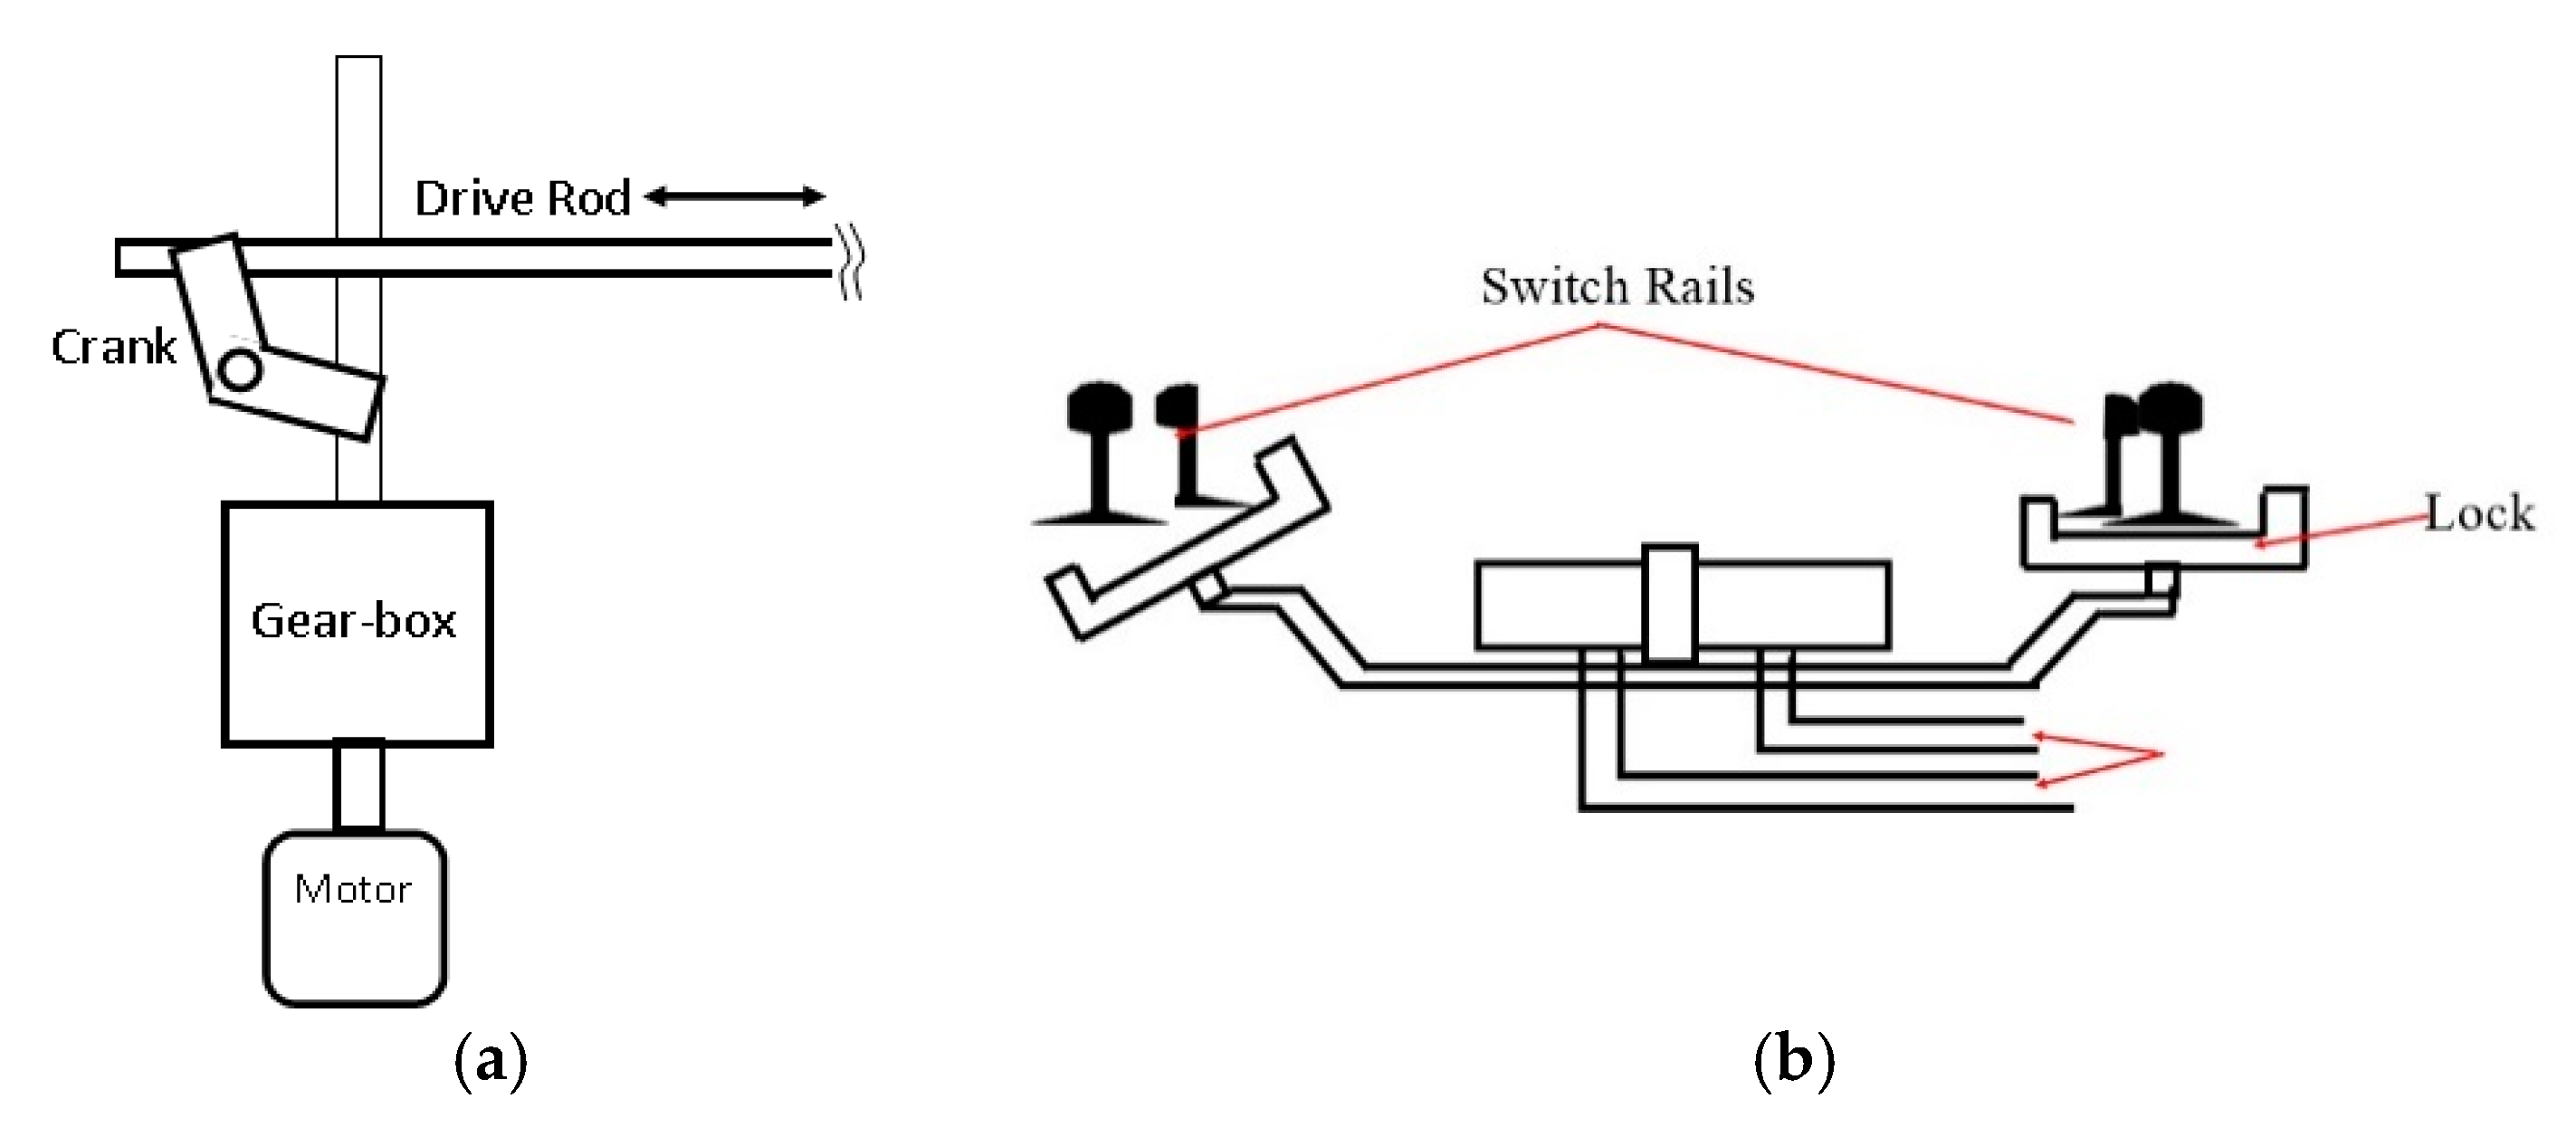
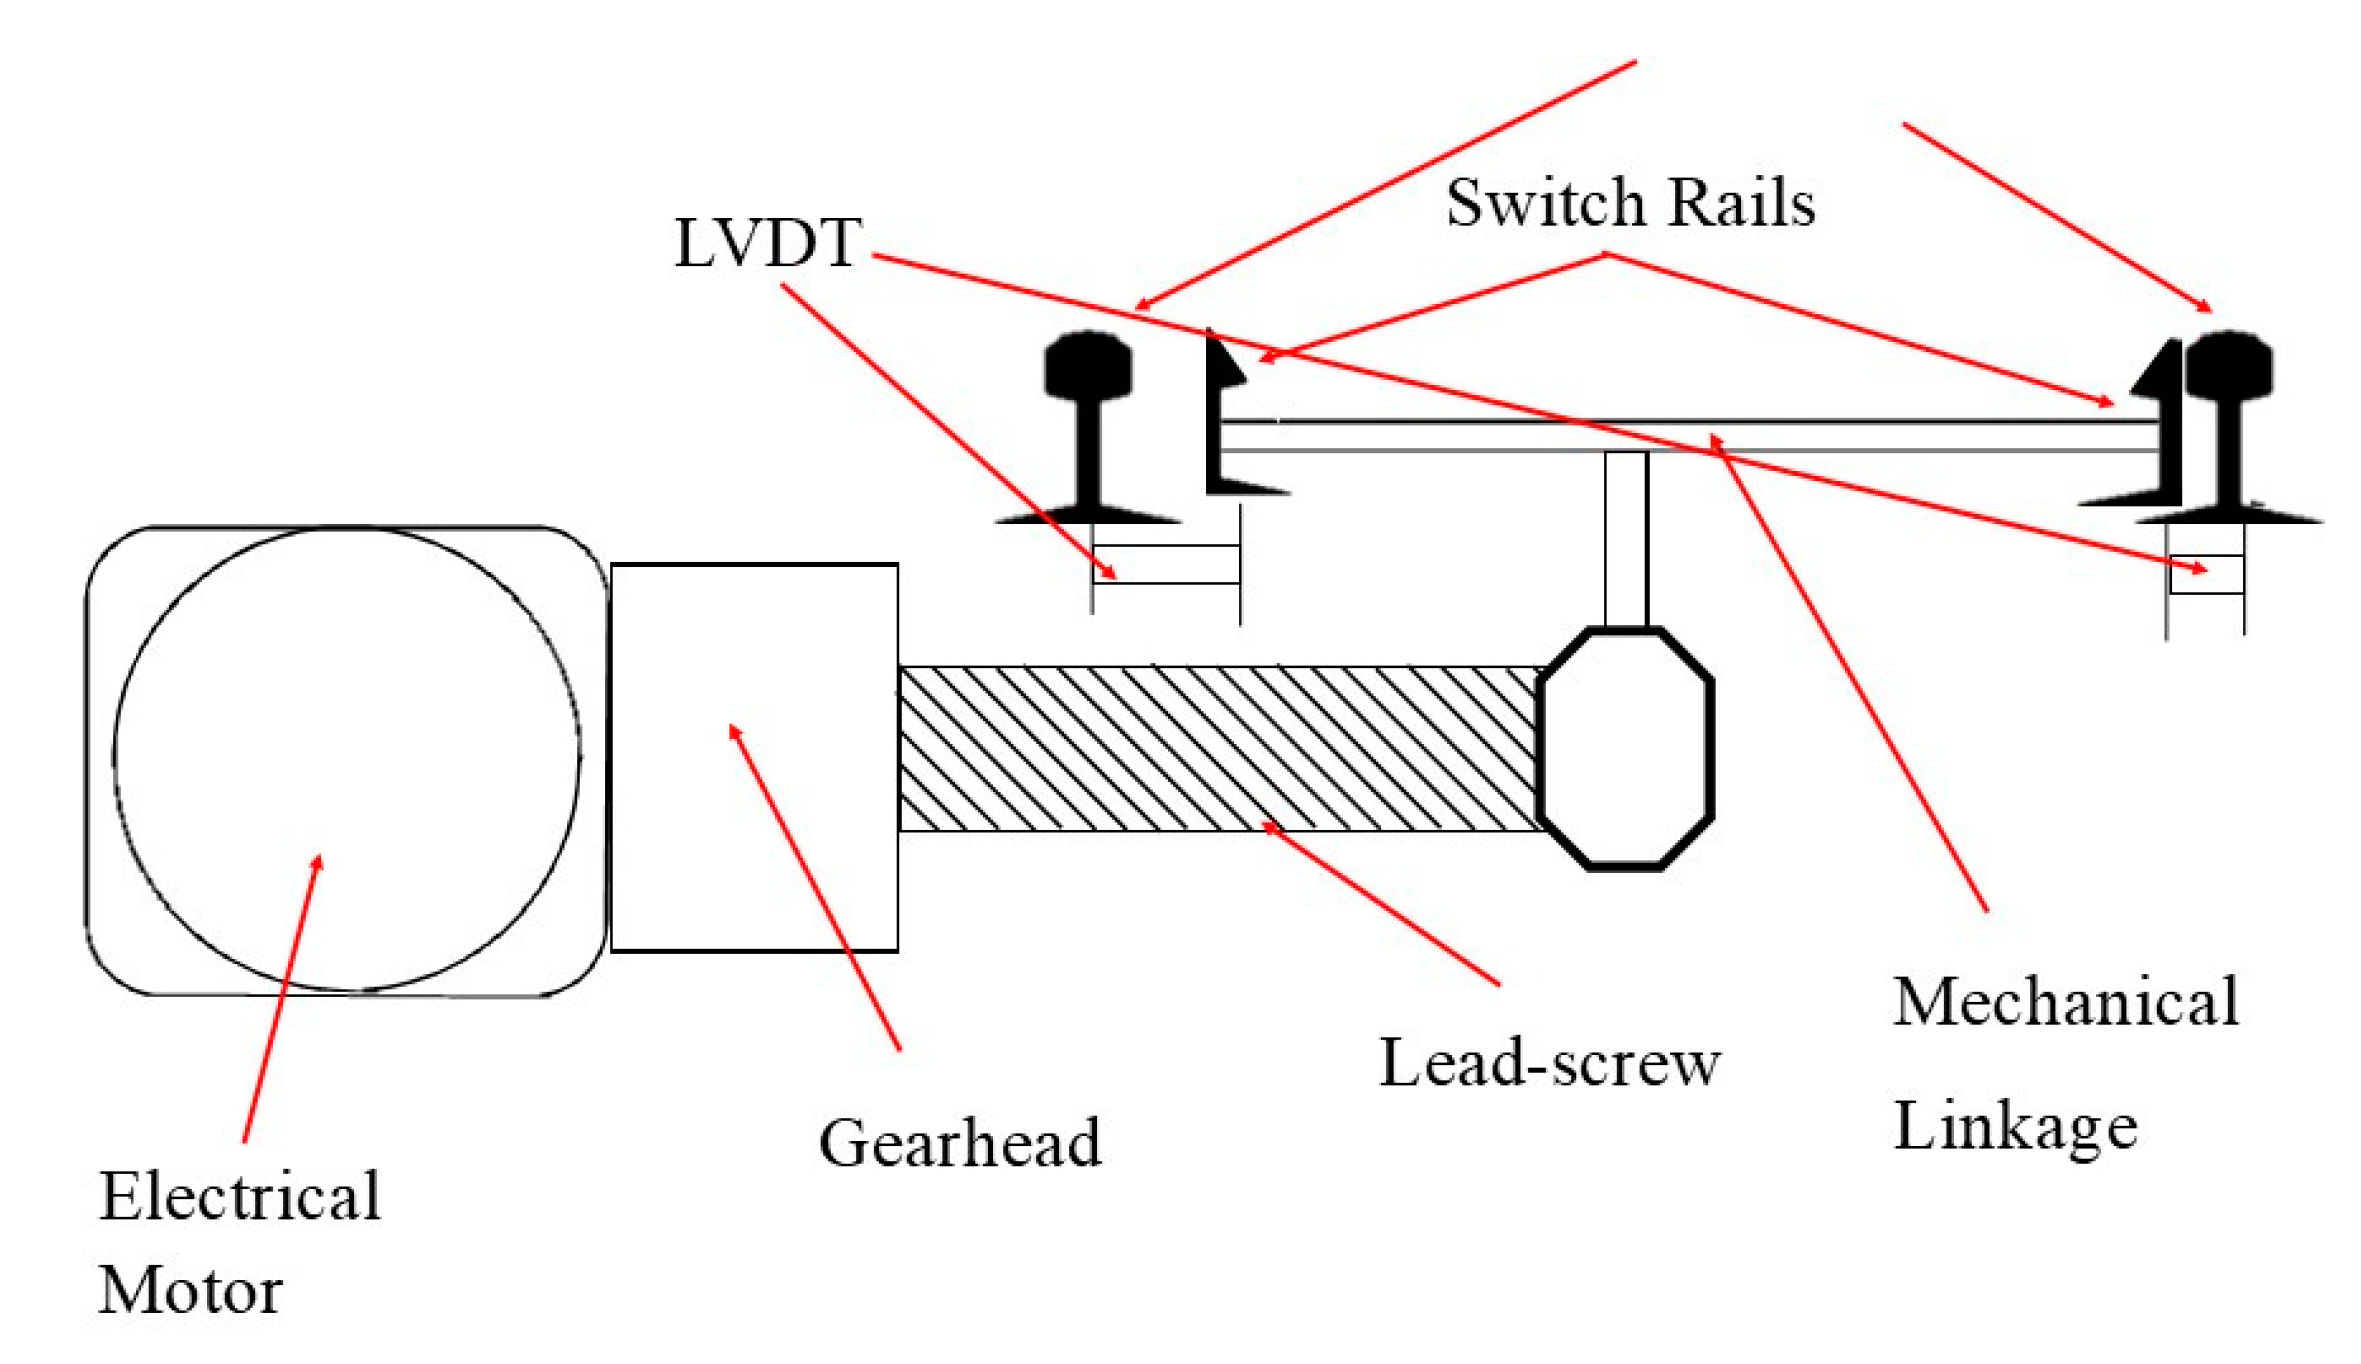
In railway S&C systems comprising linear actuators, such as electromechanical, electropneumatic, and electrohydraulic actuators, the switch rails slide from one side to the other depending on the command. A traditionally used linear electromechanical switch actuation system, as mentioned in [16,38], is shown in Figure 5a. The motor shaft is connected to a belt drive, which runs the crank through a gearbox. The crank drives the drive or actuator rod, which is connected to the switch rails. The drive rod actuates the switch rails at the toe position to slide from one position to another. A different configuration is seen in an HPSS system: the motor gearbox unit is connected directly to a lead screw, which is connected to the mechanical linkages at the toe through a nut [40]. The rotation of the motor causes linear movement of the nut, which drives the switch rails.
Figure 5b represents a hydraulic switch actuation system called a clamplock, which consists of two actuating rods between two switch rails that are pushed against adjacent stock rails. The hydraulic pump pushes the actuating rods by providing the force.

2.1.2. Lift-Hop-Drop Actuation

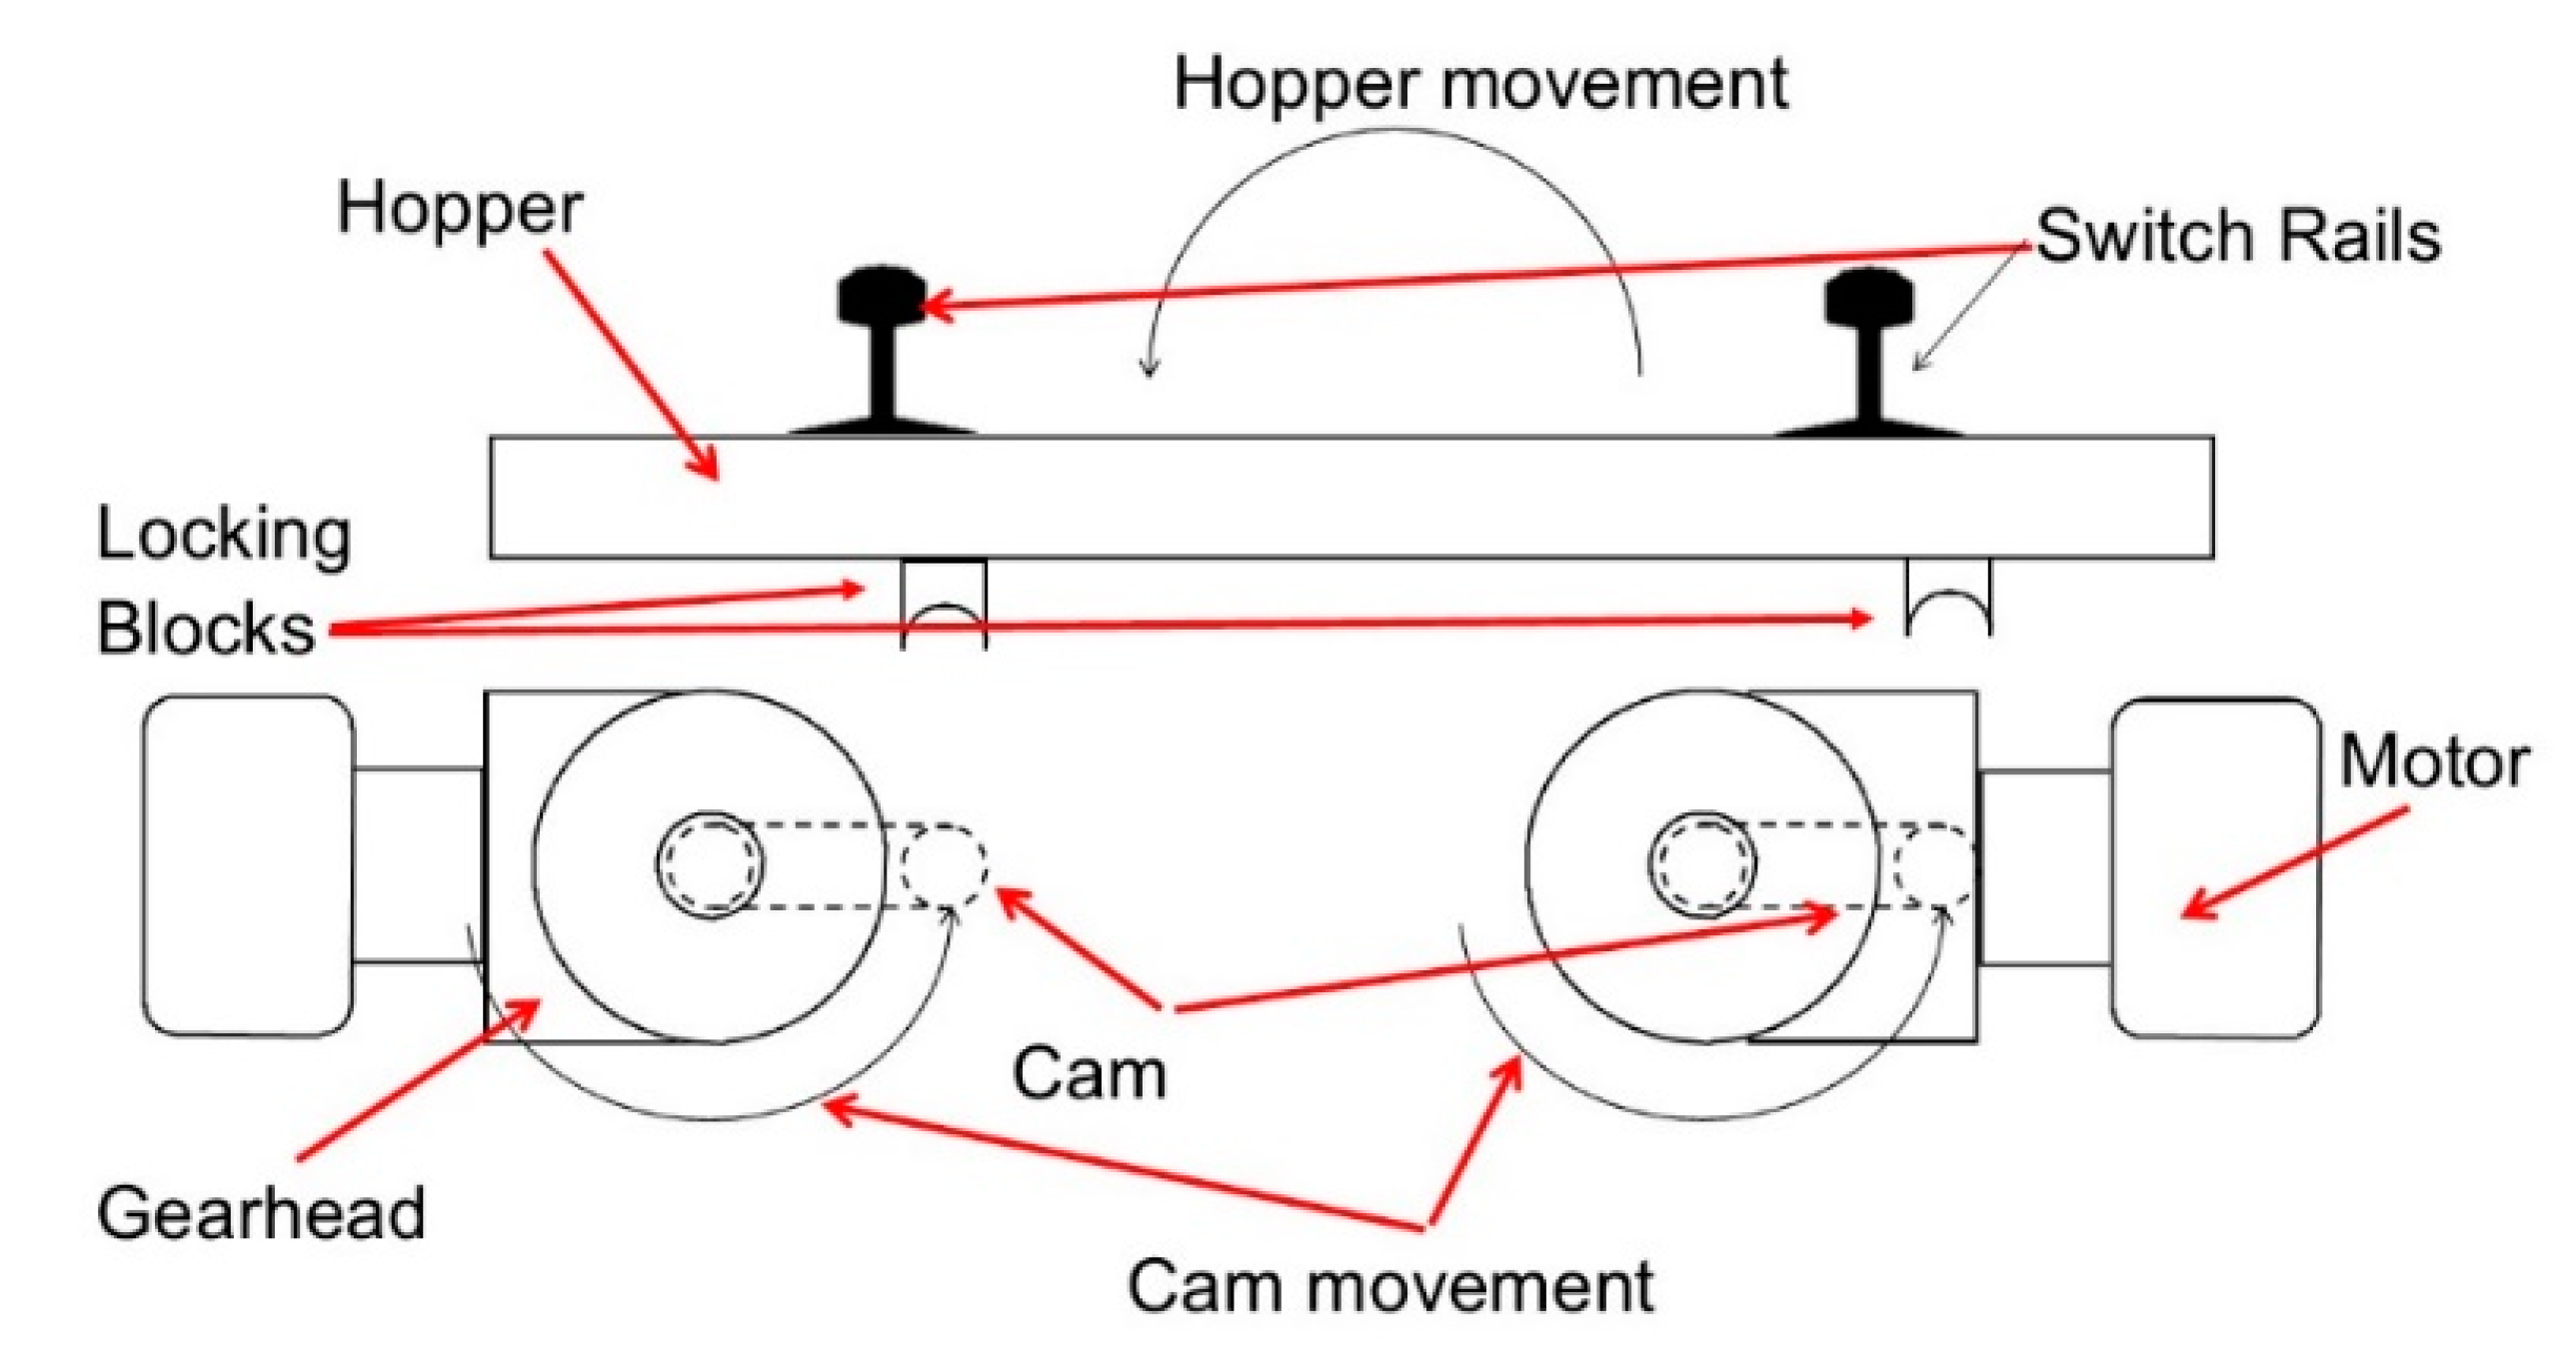
A novel actuation mechanism, where the switch rails are actuated following lift-hop-drop movement, has recently been developed such as in the REPOINT light switch shown in Figure 6 [21,41]. The switch rails are actuated in a semicircular path to allow redundant actuation. A recent simulation study by Dutta et al. [40] proposed the use of a closed-loop controller to improve the performance of HPSS to secure movement of the switch rails and to include self-adjusting capability. As can be seen in Figure 6, two electrical motors are connected to two individual gearboxes, which act as speed-reduction units as well. The output shaft of an individual gearbox is attached to a cam-hopper assembly. The switch rails are attached to the hopper, which moves in a semicircular way with the rotation of the electrical motor. This lift-hop-drop actuation technique has been followed in another innovative track switch research project [42].

2.2. Sensors and Controllers

Different kinds of sensors are used in railway S&C systems depending on the type of actuation and on the locking mechanism. The sensors are mostly used for controlling the movement of the switch or running the motors and detecting the position of the switch rails. HW machines, which use voltage and current sensors, are widely used in the UK rail network [24,43]. Zhou et al. [44] studied the failure analysis and CM of Style 63 (i.e., M63) point machines, which were in operation in the UK. The current and force sensor data from Style 63 machines were used in this study. The force was measured and the variation of the force profile during the actuation was analyzed to detect any possible faults present in the system. But, in all these traditional point machines, the sensor data are not used for closed-loop control of the switch actuation. The sensor data are used either to detect the position or for future fault diagnosis or CM application.
HPSS switch systems—shown in Figure 7—measure the linear position of switch rails at the toe position and also record the current data from the electrical motors. These sensor signals are fed back to the controller, which is designed as a cascaded controller, for controlled motion of the switch rails.

2.3. Detection and Locking

When the switch rails complete their movement, the rails are locked by the locking mechanism and then detected by the arrangements. The switching operation is considered to be completed when the switch rails are detected in their place. Thus, these two systems are of high importance in a full railway S&C system. But, because of the high number of parts involved in locking and detection systems, these systems reduce system reliability and increase the maintenance cost. The different lock and detection systems used in various systems include mechanical linkages, sensors, electrical clutch, etc.
The rail clamp point lock (RCPL), which is widely used in the UK, has two plunger-type limit switches and a mechanical locking arm. At the end of switch travel by the hydraulic actuator (for clamplock points), the mechanical lock engages with the associated locking piece and a positive lock is achieved as shown in Figure 5b [38]. The commonly used conventional mechanical lock is shown in Figure 8, where two metallic rods are connected to two switch rails [45,46]. When these two rods are locked in their position after the switch movement, the lock blade engages with a lock dog through an interlocking notch. The stretcher bar connected to the lock blade is then locked in its position, which prevents any movement of the switch rails when the power is off.
A different approach for detection and locking is used in HPSS, where the switch rail position is measured using a linear variable differential transformer (LVDT) [47]. The LVDT monitors the movement of the switch rails, and when the switch rails are within the allowable range, the clutch in the electrical motor is engaged and the power to the motor is removed. Locking in an HPSS is achieved in two ways: through the electrical brake and by using a non-backdrivable lead screw (as shown in Figure 7.
The different detection and locking mechanisms explained so far are for linear actuators. Lift-hop-drop actuation mechanisms use passive locking to allow vertical movement of the switch rails. The hopper, as shown in Figure 6, engages with the locking block that prevents any horizontal movement of the switch rails in that position. The locking in the vertical direction is achieved by the weight of the switch rails and the hoppers [36].

2.4. Failure Modes of Railway S&C Systems

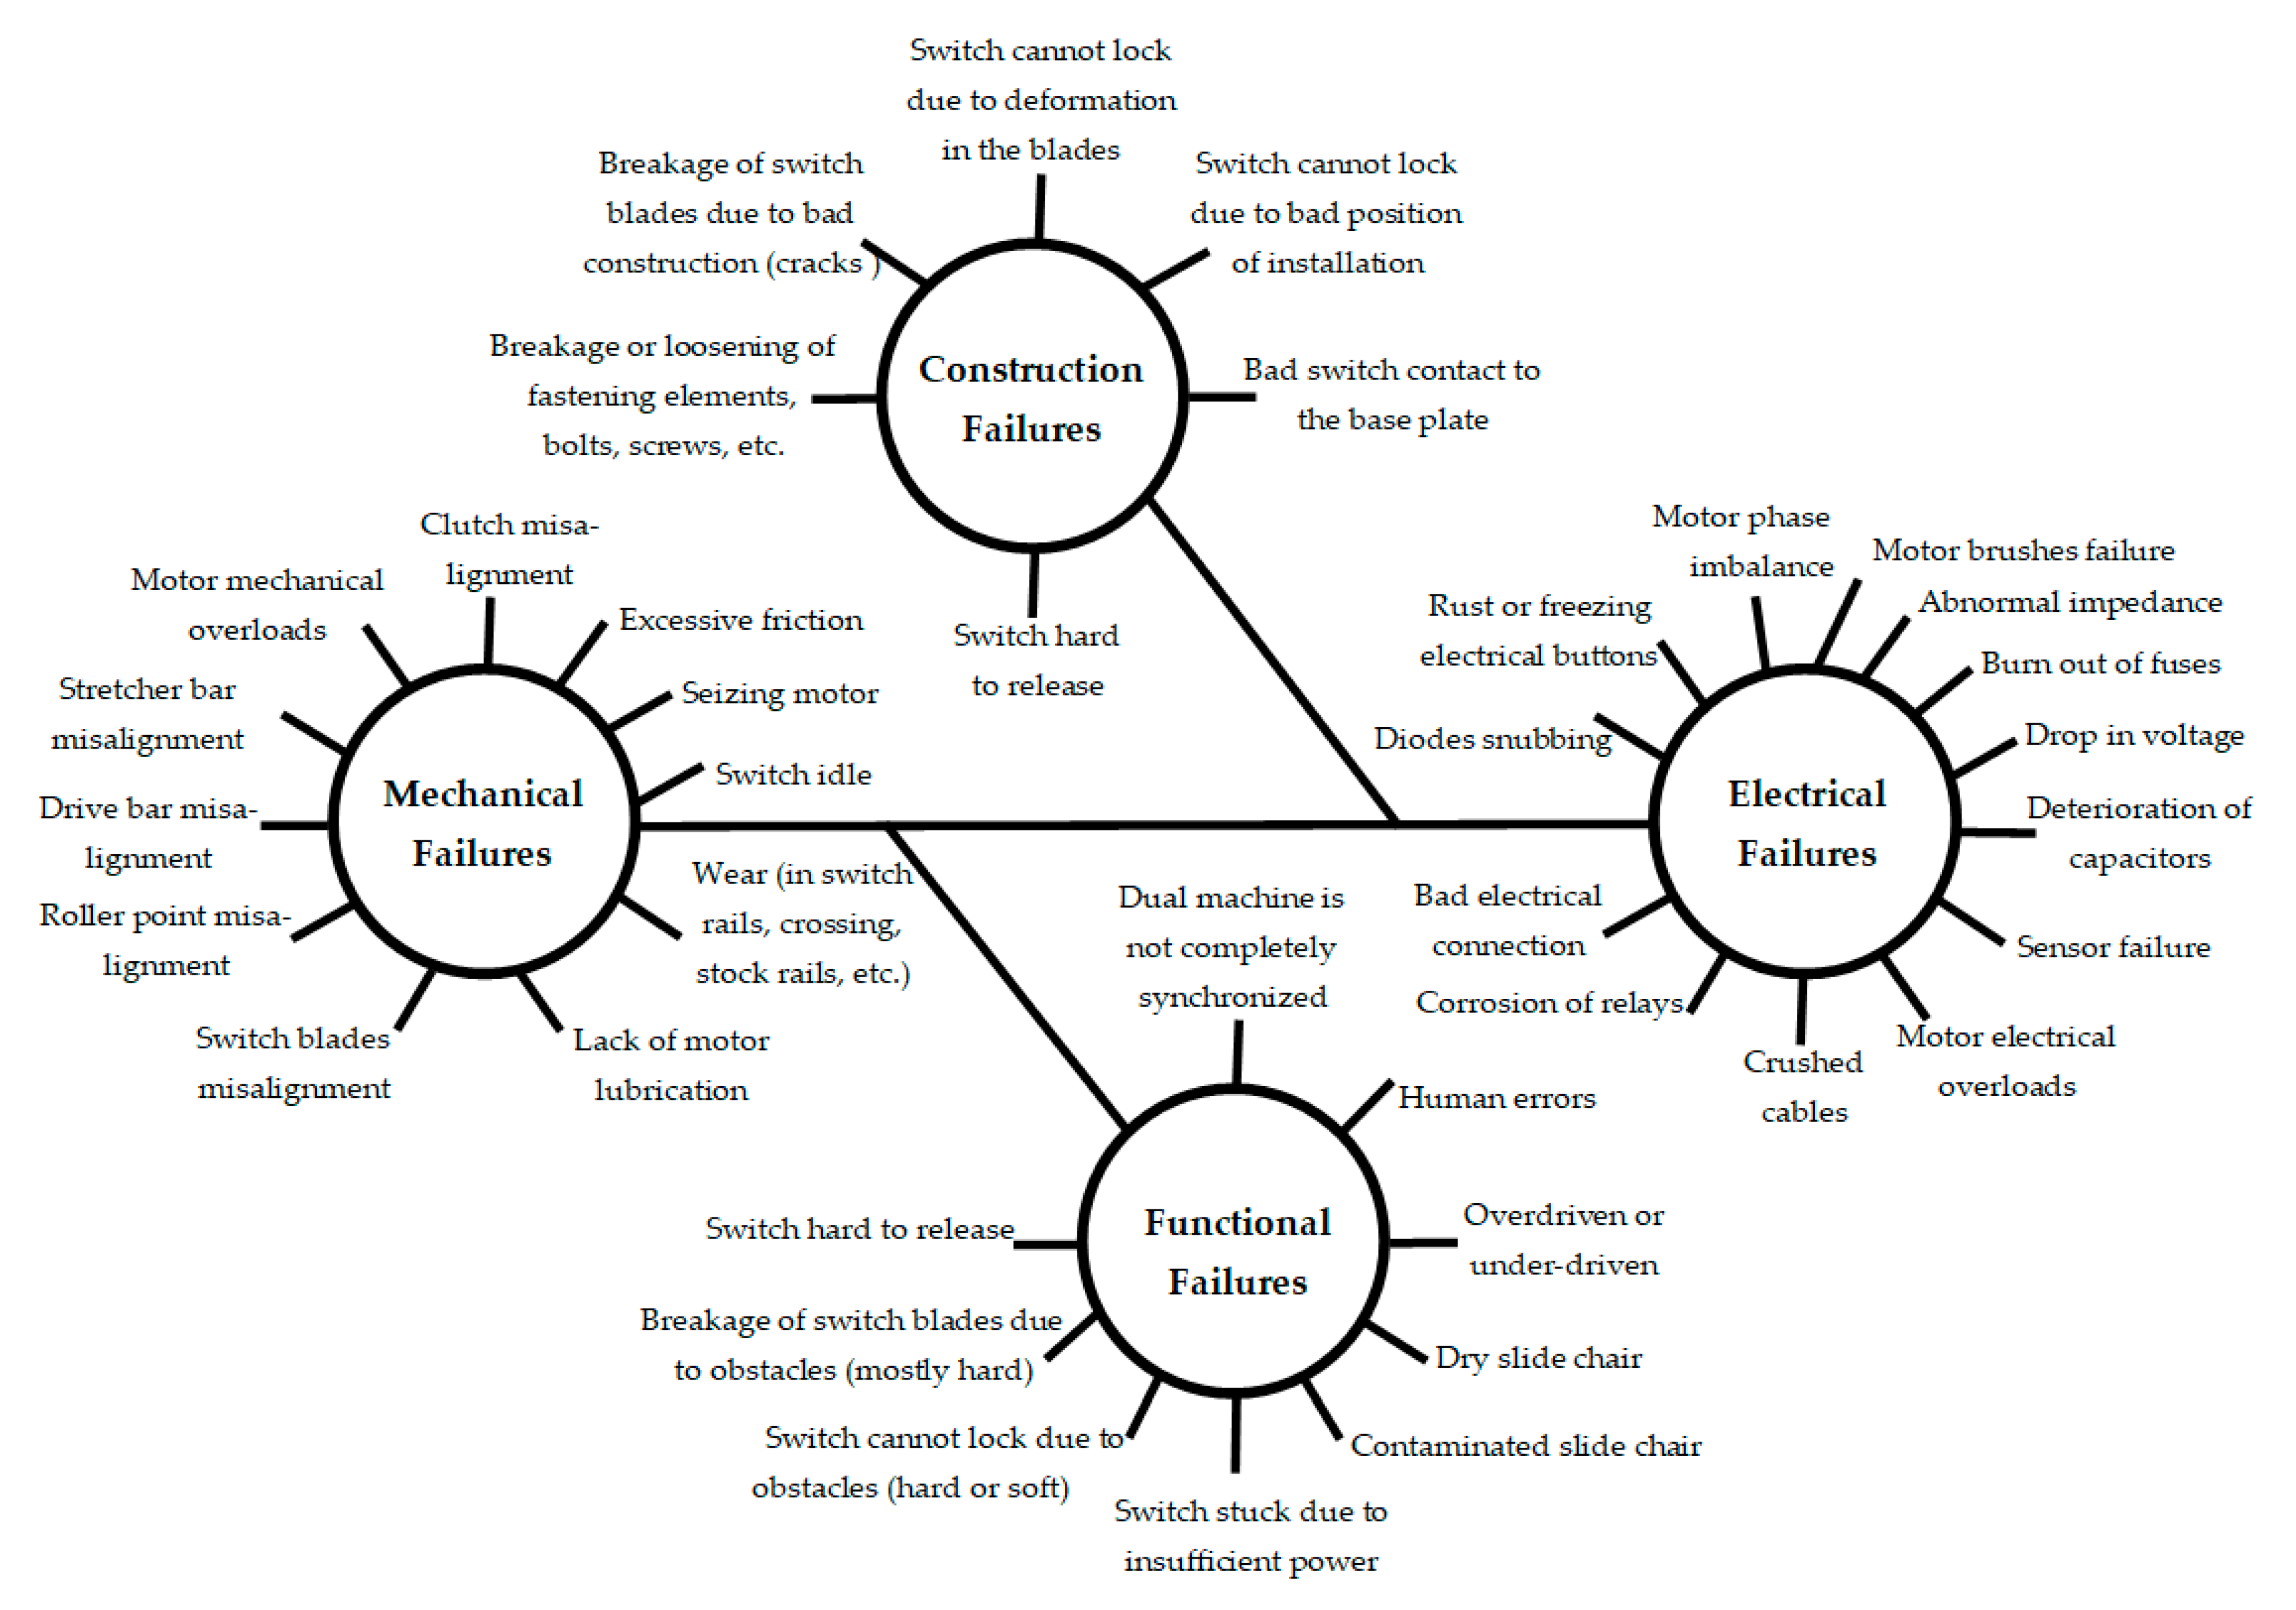
The failure modes of railway S&C systems may arise from many sources. In an attempt to organize and classify these diverse failures, this paper proposes to classify them according to their source and nature into mechanical failures, electrical failures, construction failures, and functional failures, as shown in Figure 9. Each of these failure types can be found in one or more different S&C subsystems, i.e., in the actuators, sensors and controllers, detection and locking parts, and/or in the permanent way (the rails and other elements which support the vehicle). In addition, these S&C system failures can be caused by a change of the environmental conditions and/or human error. Any fault during the maintenance process such as a lack of lubrication, improper tampering, or loose fasteners can lead to failure of the S&C system [48,49]. The environmental conditions, such as snow, rain, or obstruction on the track, have an important role in the failure of some components of S&C systems.
In the following sections, a brief description of some of these S&C system failures is presented according to their location in the different aforementioned S&C subsystems. It should be noted that the two major subsystems of an S&C system are the permanent way and the point machine. In the present paper, major emphasis has been given to point machine failures when reviewing the existing FDD methods for railway S&C systems. However, a brief description of possible permanent way failures is presented.

2.4.1. Permanent Way

These elements, which consist of sleepers, stretcher bars, rails, and ballast to name a few, of a railway S&C system are exposed to the environment and guide the rail vehicles over it. Failures in these elements can be considered in two categories: the rails and the elements attached to them.
In linearly actuating switches, the switch rails slide over the sleepers (or on the slide chairs). These rail components can experience a considerable amount of wear due to friction during the switching movement, interaction with the wheels, or environmental conditions [26]. Wear of the switch rails due to friction is reduced by using roller baseplates, which reduce the friction between the rails and the baseplates [50]. Wear of the rail elements is also expected to be reduced in case of lift-hop-drop actuation [51]. Failure of the slide chairs due to friction is one of the causes of full S&C system failure [52], and these faults can be reduced by the new plate designs. Due to inappropriate actuation and repeated operation, the switch rails may bend or buckle from their original profile. This can lead to misalignment of the switch system or complete failure of the railway S&C system. Misalignment of the layout within an allowable range can be rectified using a closed-loop self-adjusting controller [40].
The different elements attached to the rail components such as the sleeper, ballast, stretcher bars, etc., also contribute to a large number of failures. Regular maintenance is needed for ballast tamping [9,52] to allow secure movement of vehicles over the switches. Railway run-throughs often damage the permanent way severely and can lead to derailment of the vehicle over it [20]. Failures may occur if the stretcher bars, which are responsible for holding the switch rails together, fail. Accidents such as Potters Bar and Grayrigg were caused by failure of a permanent way. Failures in the stretcher bars, and an improper inspection and maintenance process led to failure of the systems [48,53].

2.4.2. Actuation Subsystem

The different elements responsible for failure of the actuation subsystem can be broadly grouped into electrical and mechanical components. The different electrical components such as electrical motors, signaling logics, and relays often fail. Transformer failures within the POE, or any power source failure, also result in an actuation system fault. Some of these faults are also interdependent; for example, any damage to the connectors or relays can result in failure of the power source or a voltage drop to the actuator for electromechanical actuators. Bemment et al. [51] showed that for HW or clamplock switch systems, failure in actuation is the major source of system failure.
Mechanical components of the actuation system often fail due to wear as these are exposed to the railway environment. In traditional machines, drive rods fail for various reasons like wear of the connecting elements, and loose fasteners after the maintenance process. The backdrives for longer switches are another source of faults seen in track switches. In recent research and developments in switch actuators, consideration has been given to reducing the number of mechanical elements to reduce failures in the actuation process [34].

2.4.3. Sensor and Control Subsystem

The different railway S&C systems consist of various sensors and controllers as explained in Section 2.2. The failure of any current or voltage sensor attached to the actuation elements in turn results in failure of the actuator for various point machines such as P80, M63, HW 2000, etc. [26,44]. For HPSS, it is seen that faults in the LVDT signal and the subsequent control command attached to it cause a considerable amount of failures [51]. In the case of clamplock and HW switches, the mechanical linkages experience wear during operation. Also, any misalignment during the maintenance process leads to failure of the railway S&C system.

2.4.4. Detection and Locking Subsystem

The detection and locking subsystem is a major source of failure in railway S&C systems. Bemment et al. [51] showed that failures due to detection and locking accounted for 47.32% and 28.51% of total switch failure incidents for clamplock and HW switches, respectively, in the UK network during the study period of August 2008 to September 2011. The sources of failure are wear of the mechanical locks and detection bars, split pins, misalignment of the mechanical assembly, etc. HPSS locking is achieved by the electrical brake and non-backdrivable lead screw. Thus, any failure in the power source can result in failure of the electrical brake, and the locking then depends on the lead screw only, which makes HPSS prone to failure due to detection and locking failure (47.99% [51]).

3. FDD of Railway S&C Systems

In this section, an overview of the existing FDD algorithms for railway S&C systems is presented. Condition monitoring systems (CMSs) are applied to enhance system performance, to ensure safety and reliability, and to reduce downtime and replacement costs [54,55]. There are two well-known approaches to fulfilling CMS tasks: model-based and data-driven. Thus, in this review paper, the different existing FDD algorithms for railway S&C systems are classified into two groups: model-based methods and data-driven methods. While the first uses both input and output signals to build its mathematical model (reference model) to be used for generating the residuals for detecting and then diagnosing the different faults, the other uses only system output signals (historical data) to detect and diagnose possible faults and is increasing in popularity due to machine learning and big data approaches in the CMS field.

3.1. Model-Based FDD Methods for Railway S&C Systems

A state-of-the-art review of the existing model-based FDD algorithms for railway S&C systems is presented in this subsection. Model-based FDD methods are based on constructing a mathematical model of the system—a reference model—that will be used for generating residuals   r ( k ) , as can be seen in Figure 10. These residuals are the difference between the real system measurements y ( k ) and the reference model output (the estimated measurements)   y ^ ( k ) , which represents the healthy state of the system itself. A deviation in the residuals is used to detect and diagnose different faults. Model-based FDD methods require both the real system input signal u ( k ) and the real system output signal y ( k ) .
As can be seen in Figure 10, faults can be in the S&C system actuators, sensors, or in the process itself, which represents the movable/non-movable components in the S&C system other than the actuators and sensors. By definition, a fault is an unpermitted deviation of at least one characteristic property of the system from the acceptable, usual, standard condition [56]. Literature reviews of the most common FDD techniques [57,58,59] indicate that if the dynamics of the system can be mathematically represented—with acceptable accuracy—model-based FDD methods can provide accurate and timely diagnostic information.
Therefore, modeling the whole railway S&C system or part of it is the first step to achieving an accurate model-based FDD method that can monitor railway S&C system health conditions. A large number of published papers and research works report modeling of the S&C system as a whole [14,60,61,62,63,64], or of only a part (subsystem) of it [7,65,66,67], in addition to the several research works done related to S&C fault degradation modeling [9,68,69,70,71,72,73], which shows good prospects for researchers in this field to develop and apply a model-based FDD technique for railway S&C systems. Thus, several, if not a dozen, papers that apply a model-based FDD method to railway S&C systems should have been published. However, only a few papers (they can actually be counted on both hands) can be found from the last decade; these applied a model-based FDD method to only detect (i.e., FD methods), to detect and diagnose (i.e., FDD methods), and/or to prognose (i.e., FP methods) a few possible fault scenarios of S&C systems to maintain their functionality, safety, and reliability.

3.1.1. FD Methods

Márquez et al. [74] proposed an unobserved components class of model that was set up in a state space framework to deal with monitoring (detection) of the main wear-related failures of S&C mechanisms. A Kalman filter (KF) with fixed interval smoothing (FIS) algorithms was used for state estimation, and the maximum likelihood (ML) approach was used to estimate the unknown parameters of the system. For FD, they simply considered the absolute values of the difference between the current and reference data. The authors considered different wear-induced faults, including dry slide chairs, lubricated slide chair, and backdrive overdriving at the heel on normal and reverse sides with dry and lubricated slide chairs. The model-based FD method developed was tested in off-line mode with data collected from laboratory tests. Both force signal and DC motor current signal were collected as the output signals, whereas the supply voltage was considered for the input signal (it was considered constant). Their results showed that their model-based FD method is able to detect the main wear-related faults in both operating directions of the S&C system considered. The authors did not consider fault diagnosis in this work.
A modified Bayesian network model combined with Monte Carlo simulations for the prediction of weather-related failures in railway S&C systems was developed by Wang et al. [75]. The framework of their S&C failure prediction method is shown in Figure 11. In this study, the authors directly considered S&C system failure instead of faults because their exact causal relationship has not been yet established in the literature [10]. Date, minimum and maximum temperature, atmospheric pressure, weather phenomena (including rain, showery rain, snow, sleet, thunderstorm, etc.), and wind speed and its direction were considered as the input data. Some predicted failure outputs considered were: the switch slide chair lacking oil because of a rainstorm; the switch being stuck by snow; switch rail turnout stretching because of temperature change; and the switch rail having a bad contact to the base plate in the normal position.
The authors, Hamadache et al. [76], recently proposed a model-based FD method that considered a modified way of computing the residuals between the real system output(s) and the reference model output(s) with an application to an electromechanical switch system. The simulation model (reference model) was developed in Matlab/Simulink, where the input was the power supply voltage and the outputs were the motor speed [rad/s], the motor stator current [A], the force [N], and the linear position of the switch rails (i.e., the switch toe position) [m]. The modified accumulative residual based FD method performance and effectiveness were demonstrated using a set of different fault levels for the excessive friction or resistance fault in the electro-mechanical switch system. Their results showed that the considered fault was able to be detected using motor speed signal, motor stator current signal, force signal, and/or linear position of the switch rails with tendency to be implemented in the real rail network.

3.1.2. FDD Methods

A model-based FDD algorithm was applied to S&C system fault diagnosis by Cheng and Zhao [12]. In this work, the model-based FDD method developed was applied to an S&C system with a speed of up to 160 km/h. The FDD method introduced was based on a fuzzy neural network algorithm to build a reference model of a railway S&C system. Different main faults of S&C systems, which account for more than 90% of total failures under high-speed conditions [77,78,79], were considered, including: switch machine idle, switch operation has resistance, switch moving parts lacking oil, switch hard to release, and switch cannot lock, acquiring only the current signal. They achieved good detection and diagnosis results: accuracy of 96.7% with a 3.3% false alarm rate, and a 0% missing alarm rate.
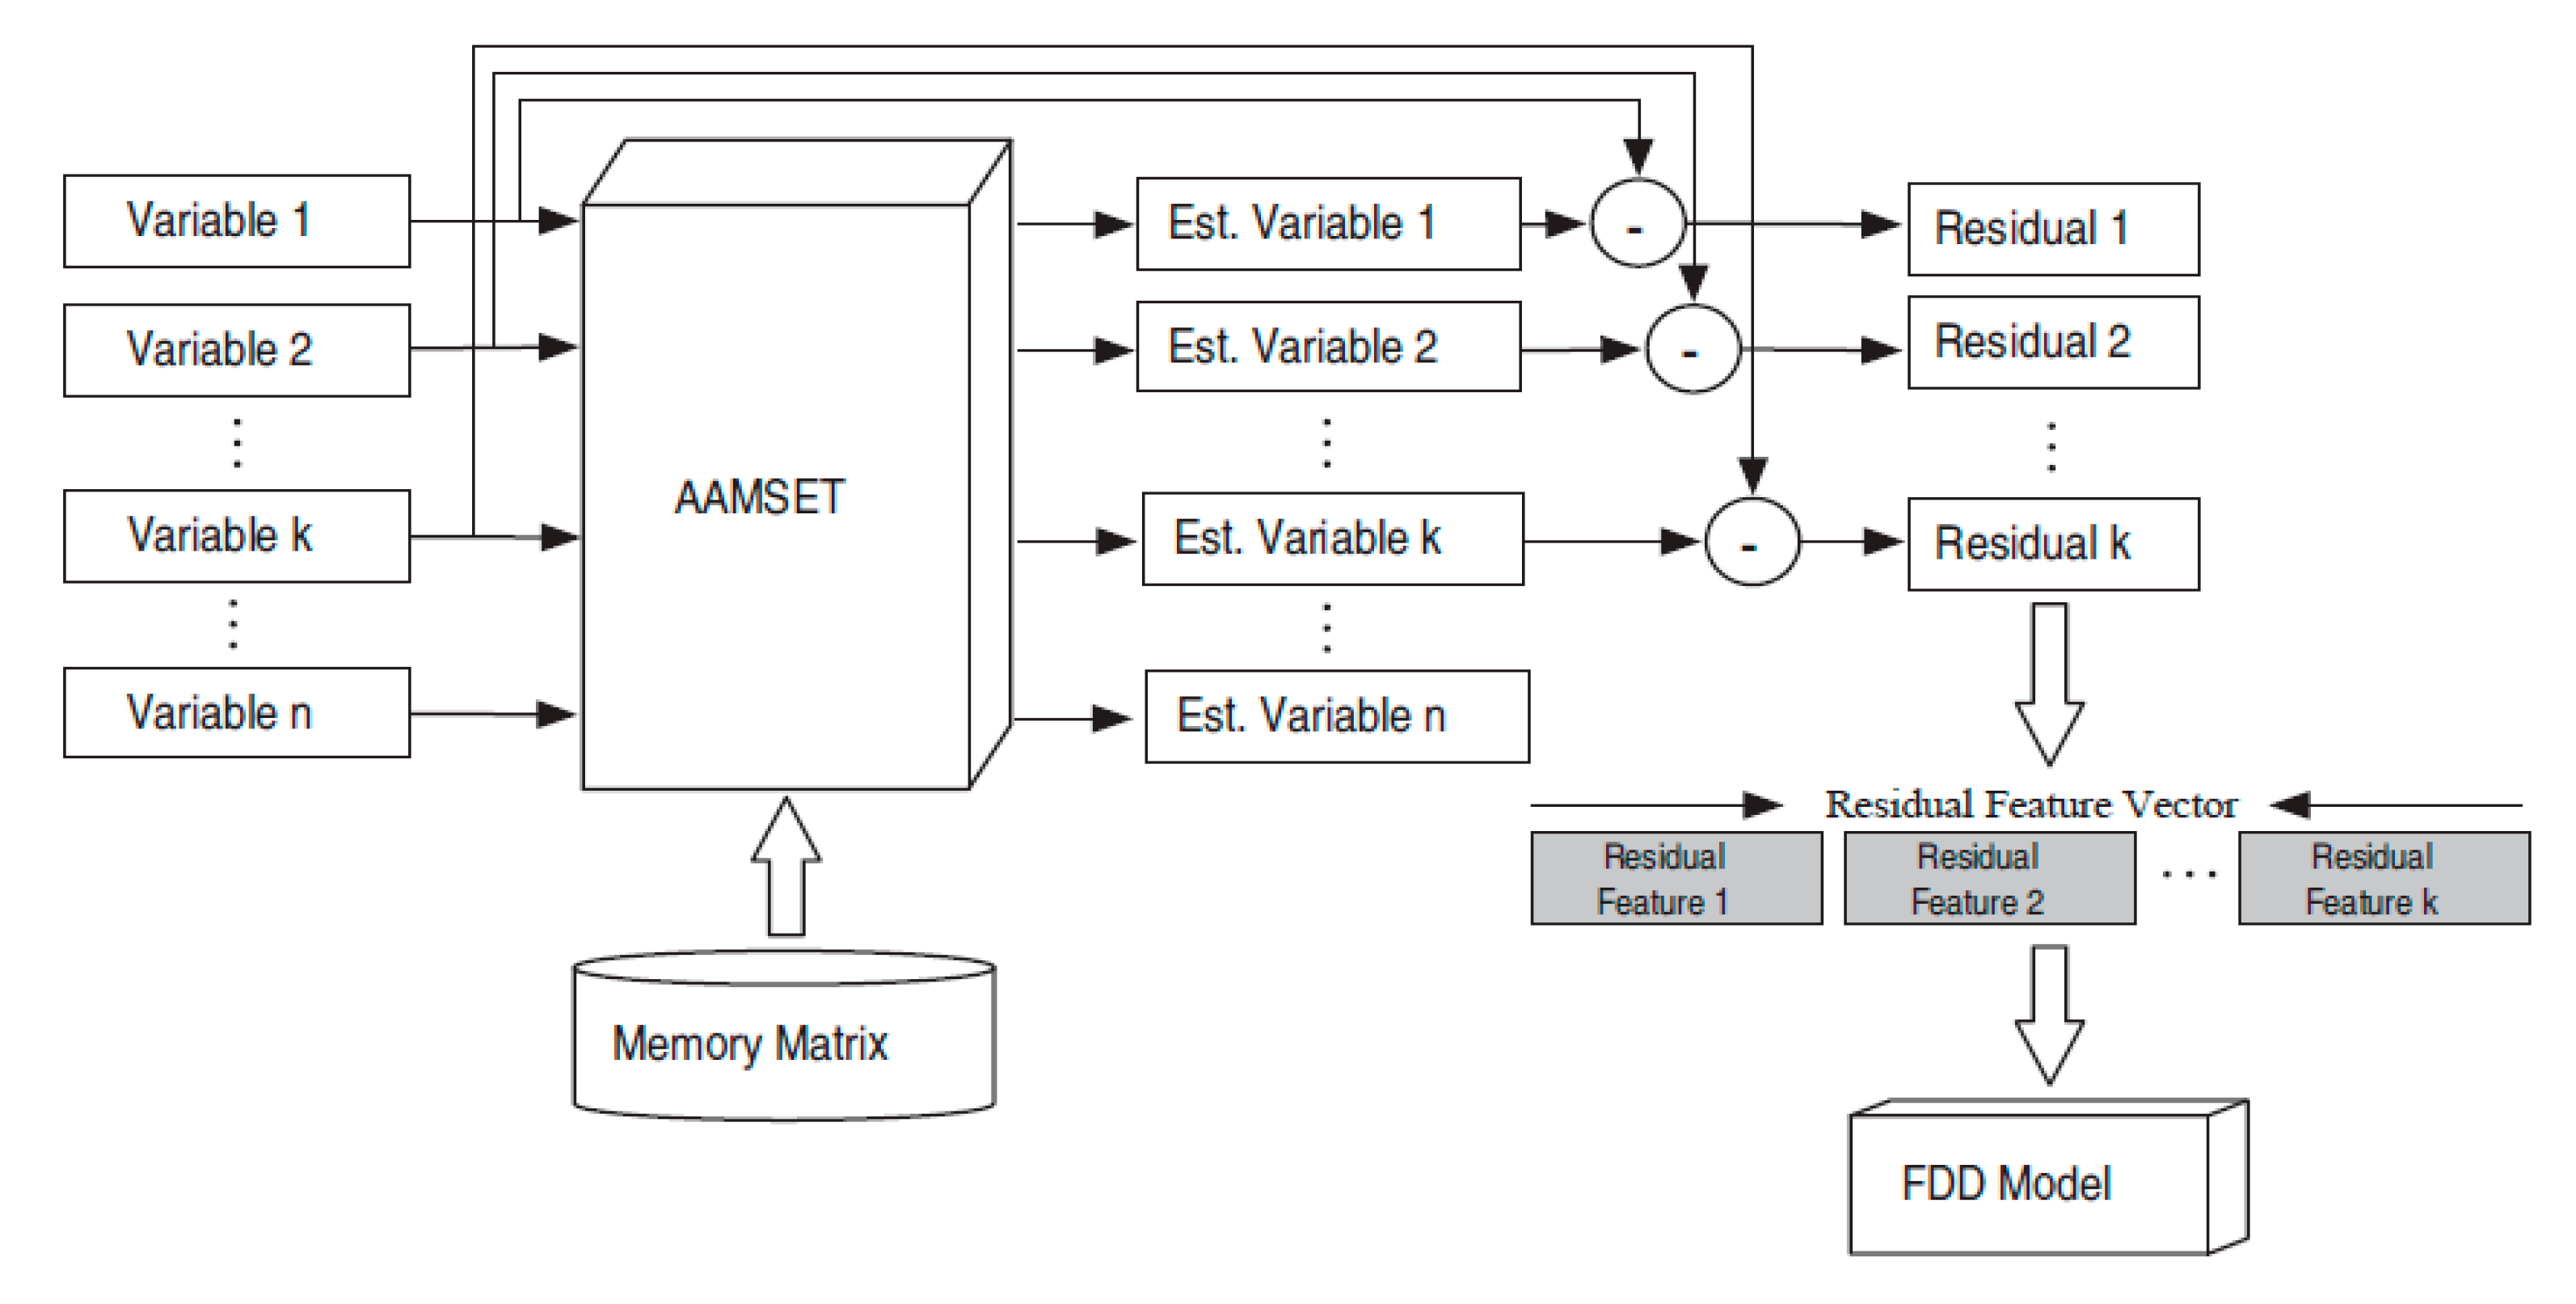
A more recent work, published in 2018, used a model-based FDD method based on an auto-associative residual (AAR) approach for railway S&C system FDD [80]. Auto-associative multivariate state estimation (AAMSET) was chosen to build the AA models as it has a high reconstruction accuracy and robustness [81] with the Euclidean norm. The AA model used raw input/output data for training and testing. The AAMSET-based FDD scheme developed can be seen in Figure 12. A data set collected from an in-lab test bench with induced faults—within a climatic chamber with controlled temperature and humidity—was considered to validate the proposed approach. Three faults were induced: misalignment, obstacle, and excessive friction. Considering different scenarios for each fault, 17 health condition modes were tested (e.g., different size of the obstacle considered: 1, 2, 3, and 4 mm) including the normal case. The signals acquired for analysis were the speed and torque signals. Even though the results showed good accuracy of the proposed AAR model-based FDD method, some limitations are still to be dealt with, including defining the level of correlation among the input variables and determining the optimal number (or subset) of input variables, especially when the number of variables is large.

3.1.3. FP Methods

With promising results for RUL prediction of 10 real S&C systems, Güçlü et al. [82] proposed a model-based prognostic technique based on an autoregressive moving-average (ARMA) model. Tension, compression forces, DC current, voltage in electric circuits, distance between the stock rail and switch rail of railway turnout systems, and the linear position of the switch rails were measured for both normal to reverse and reverse to normal movements of S&C systems. The authors considered only prediction of the contaminated slide chair failure mode. They artificially induced the fault by drying the three farmost slide chairs (initial failure state), and the healthy (fault-free) state was when all 12 traverses were oily.
From the above reviewed literature, the lack of papers applying a model-based FDD method for S&C systems is obvious. Further, very few among these published papers [12,74,82] actually applied and used the residuals principle for detecting and then diagnosing S&C system faults. Thus, there is an opportunity for researchers to consider applying model-based methods to deal with FD, FDD, and/or FP of the different possible fault modes (previously shown in Figure 9) in railway S&C systems.
Perhaps the major difficulties that researchers can face when applying a model-based FDD technique for S&C systems can explain the lack of research work in this field contrary to expectation. These difficulties can arise from the amount of potential failure modes and their predictability in railway S&C systems (as previously reviewed in Section 2.4), or from the different drawbacks of model-based techniques. These include the fact that the accuracy of the developed model directly affects FDD process performance, and that the construction of high-fidelity mathematical models from physical principles of such a complex system (i.e., a railway S&C system) can become very complicated, time-consuming, and even sometimes unfeasible [83], in addition to the need for much prior knowledge about real systems before model development. Compared with model-based FDD techniques, data-driven FDD methods are generally more practical, in that there is no need to build a reference model (i.e., less prior knowledge required, no need for model accuracy validation to be applied for real-world applications, etc.), such that more research works have been based on data-driven FDD techniques for detecting and diagnosing (and sometimes predicting) the possible faults in S&C systems; more details are provided in the following subsection.

3.2. Data-Driven FDD Methods for Railway S&C Systems

A detailed review of the existing data-driven FDD methods for railway S&C systems is presented in this subsection. Data-driven approaches need only output signals (historical data) to detect and diagnose (and/or prognose) possible faults in an S&C system as can be seen in Figure 13.
Data-driven techniques are gaining in popularity since they are – as can be seen in Figure 13—model-free methods. Several features (indices, criteria) are generated in the time, frequency, time–frequency domain, and/or envelope spectrum features, which can usually be physically interpreted, or statistical features, which cannot be physically interpreted [84]. Different techniques from different disciplines are commonly used for data-driven FDD, including techniques from (digital) signal processing, cluster analysis, data mining, statistical pattern recognition, modern artificial intelligence (i.e., machine learning and deep learning), and image processing [84,85]. These techniques can be used separately or in combination (e.g., hybrid techniques). They aim to synthesize the information available from the raw data (output signal) gathered, to better represent the system’s health condition [84].
Contrary to the lack of published papers using a model-based FDD method for railway S&C systems, as mentioned in the previous subsection, dozens of research works have dealt with the detection, diagnosis, and (sometimes) prognosis of the different possible faults in S&C systems. In an attempt to better review the existing data-driven FDD methods for S&C systems, three categories are considered: (1) FD methods, which deal only with detecting the fault; (2) FDD methods that detect the presence or not of the fault and diagnose its location and roots; and finally (3) FP (prognostics and health management (PHM)) methods in which RUL prediction is performed.

3.2.1. FD Methods

Adachi et al. [86] applied three data-mining techniques (i.e., hypothesis testing, discriminant analysis, and interval estimation) to detect faults in an electric S&C machine. Both voltage and current signals were acquired for analysis. Their results showed that the first technique was able to detect the fault considered without fixing a pre-defined threshold. However, the hypothesis testing method results were not readable for maintenance technicians in the field; further, its performance decreased in the case of multiple faults. In addition, the authors found that the discriminant analysis technique was not capable of diagnosing faults in the electrical S&C system. However, they concluded that the third method (i.e., interval estimation) was more effective in terms of easier visible recognition and in terms of FD.
Recording solely force against time, a statistical method using three criteria—irregularities in the signal shape, deviation of the maximum value position, and signature symmetry with respect to the maximum value position—was used for FD with application to S&C systems [87]. A United States patent was granted to Zoll et al. [88] who proposed a CM technique that detects and monitors the health condition of junctions, crossings, crossroads, or rail joints by means of a rail vehicle. The rail vehicle swing acceleration vibration, speed, and travel direction and position were collected to achieve the desired outcomes (i.e., S&C system CM). Atamuradov et al. [89] used an expert system for S&C system FD. Three health conditions were simulated to evaluate the performance of the proposed method: the analyzed signals were first preprocessed, using a moving-average smoothing algorithm, then a dynamic time warping (DTW) algorithm was used to find the optimal match for FDD of the considered fault modes in the S&C system. A method was developed for specific application in the detection of drive-rod out-of-adjustment failure mode in S&C systems, which was manually obtained [90]. It used support vector machines (SVM) with a Gaussian kernel for FD after feature selection and reduction with principal component analysis (PCA) [90]. The authors applied their CM method to an electromechanical S&C system with two drive rods. In addition, they acquired the linear position of the switch rails, the force signal, and the motor current signal. In this paper, only FD was considered. Several other published papers dealing only with FD for S&C systems were found [91,92,93,94,95,96,97].
In the work published by Márquez et al. [93], three electromechanical M63 (638, 642A, and 642B) and four electrohydraulic (639, 640, 641A, and 641B) S&C systems were monitored. FD was achieved using a harmonic regression algorithm combined with a vector autoregressive moving-average (VARMA) model to forecast the acquired signal (i.e., the current signal). Another work analyzed statistical—crest factor, impulse factor, kurtosis, max, mean, min, shape factor, and standard deviation—and energy—obtained from the energy of the signal in different segments—features extracted from the current signal for FD [94]. The analysis showed that the energy-based feature had more consistent trends than the others, thus they were used along with a PCA algorithm—based on the Hotelling T2 coefficient—for detecting S&C system health conditions. An FD method for an electric switch machine for a railway S&C system was developed in [95]. The authors analyzed Kolmogorov–Smirnov (K-S) test results to detect three simulated switch machine faults: (1) slide chair friction, (2) a hard stone in the gap between the stock rail and switch blades, and (3) a soft stone in the gap between stock rail and switch blades. They extracted different time-domain stator current signatures in healthy and faulty cases to be analyzed by K-S test. These study results showed that the proposed K-S test method was not capable of classifying the three fault cases considered, which means that it is not sufficient for fault diagnosis purposes.
Four papers used a shallow learning algorithm as an FD algorithm with application in railway S&C systems. The first one [96] was based on a one-class SVM (OCSVM) algorithm, the second paper [97] exploited a self-organizing map (SOM) technique, the third one [98] applied two machine learning classifiers, a Gaussian Naïve Bayes (GNB) classifier and a neural network classifier (multilayer perceptron), and the fourth one [99] explored two recent machine/deep learning frameworks for classifying various switch degradation indicators including the featureless recurrent neural network called a Long Short-Term Memory (LSTM) architecture and the Deep Wavelet Scattering Transform (DWST). In the first paper, the OCSVM algorithm used a similarity measure of ‘edit distance with real penalties’ to classify the S&C health conditions as healthy or faulty. The current signal trends—collected from a real railway S&C system (i.e., infield data) instead of in-lab data (i.e., commonly researched laboratory-based data)—were considered as the analyzed features for the proposed FD method, and three obstructions faults, one contamination fault, and a crushed cable fault were investigated. The proposed OCSVM-based FD algorithm for railway S&C systems showed promising results compared with the commonly used threshold-based technique. However, it is limited in that it requires expert knowledge (which is very difficult and expensive to get) to label the data. In the second work, 16 features were extracted to be the inputs for the SOM technique. Mean value, root mean square value, standard deviation, slope, maximum value, and minimum value were extracted from the current and voltage signals that were coupled with information for maneuvering the railway S&C system as a whole (e.g., duration of the maneuver, area under the current curve, total power consumed, etc.) [97]. The authors in this research work considered two approaches: (1) a fleet-based approach based on the assumption that if several S&C systems are from the same manufacturer, are of similar age, and are installed in the same station, they can be assumed to belong to a uniform fleet and thus only one SOM (standardized) algorithm can be applied to the whole fleet equally; (2) an asset-based approach that, contrary to the former, assumes that the environment, field layout, and positioning influence the behavior of each S&C system, thus a dedicated SOM algorithm for each asset (i.e., S&C system) should be specifically trained and tested for this specific asset in a specific direction. Comparing both approaches in a 6-month case study on 20 point systems in a field setting, the results showed that the asset-based approach had more FD accuracy, but it was computationally more expensive and required a greater memory for storage. However, the results also showed that the fleet-based approach had fewer false alarms than the asset-based approach. The third paper [98], the applied two machine learning classifiers (the GNB classifier and the multilayer perceptron) were verified and tested in three different point machines, an electromechanical HW1000 in Belfast, an electromechanical Siemens 84M in Sydney, and a Hydraulic Mk3 Clamplock machine in London. They only measured the pressure (for the Clamplock) or current for the two others, where two fault modes were considered in this study, switch hard to release fault mode and fails to make detection, i.e., sensor fault mode. Finally, two recent machine/deep learning frameworks, the LSTM architecture and the DWST, were explored and they were evaluated for their feasibility on a dataset captured under the service conditions by the Alstom Corporation [99].

3.2.2. FDD Methods

As reviewed in the above subsection, several research works have been carried out in the area of FD technique development for railway S&C systems, in which the railway S&C systems’ health conditions were monitored and categorized as healthy or faulty. However, only revealing if the system is healthy or faulty is not enough to achieve the development of an efficient CMS, even if it is an essential step. An FD technique only recognizes that a problem has occurred in the system, but it does not identify the root causes nor isolate the location of different faults (i.e., there is no isolation step). Thus, many researchers have developed different FDD techniques to deal with railway S&C system CM, and many papers can be found [11,13,15,28,34,100,101,102,103,104,105,106,107,108,109,110,111,112,113,114,115,116,117]; only selected papers are discussed in the following. It should be clearly noted that the only criteria applied for this selection were that only the most recent published papers were chosen (from 2017 onwards). The selected papers are just examples, and the selection does not indicate a preference or endorsement by the authors. However, a summary of all FDD methods for railway S&C systems and a list of all reviewed CM papers applied to S&C systems, with their application, method(s) used, signal(s) acquired, and the fault type(s) considered, is presented in Table 2.
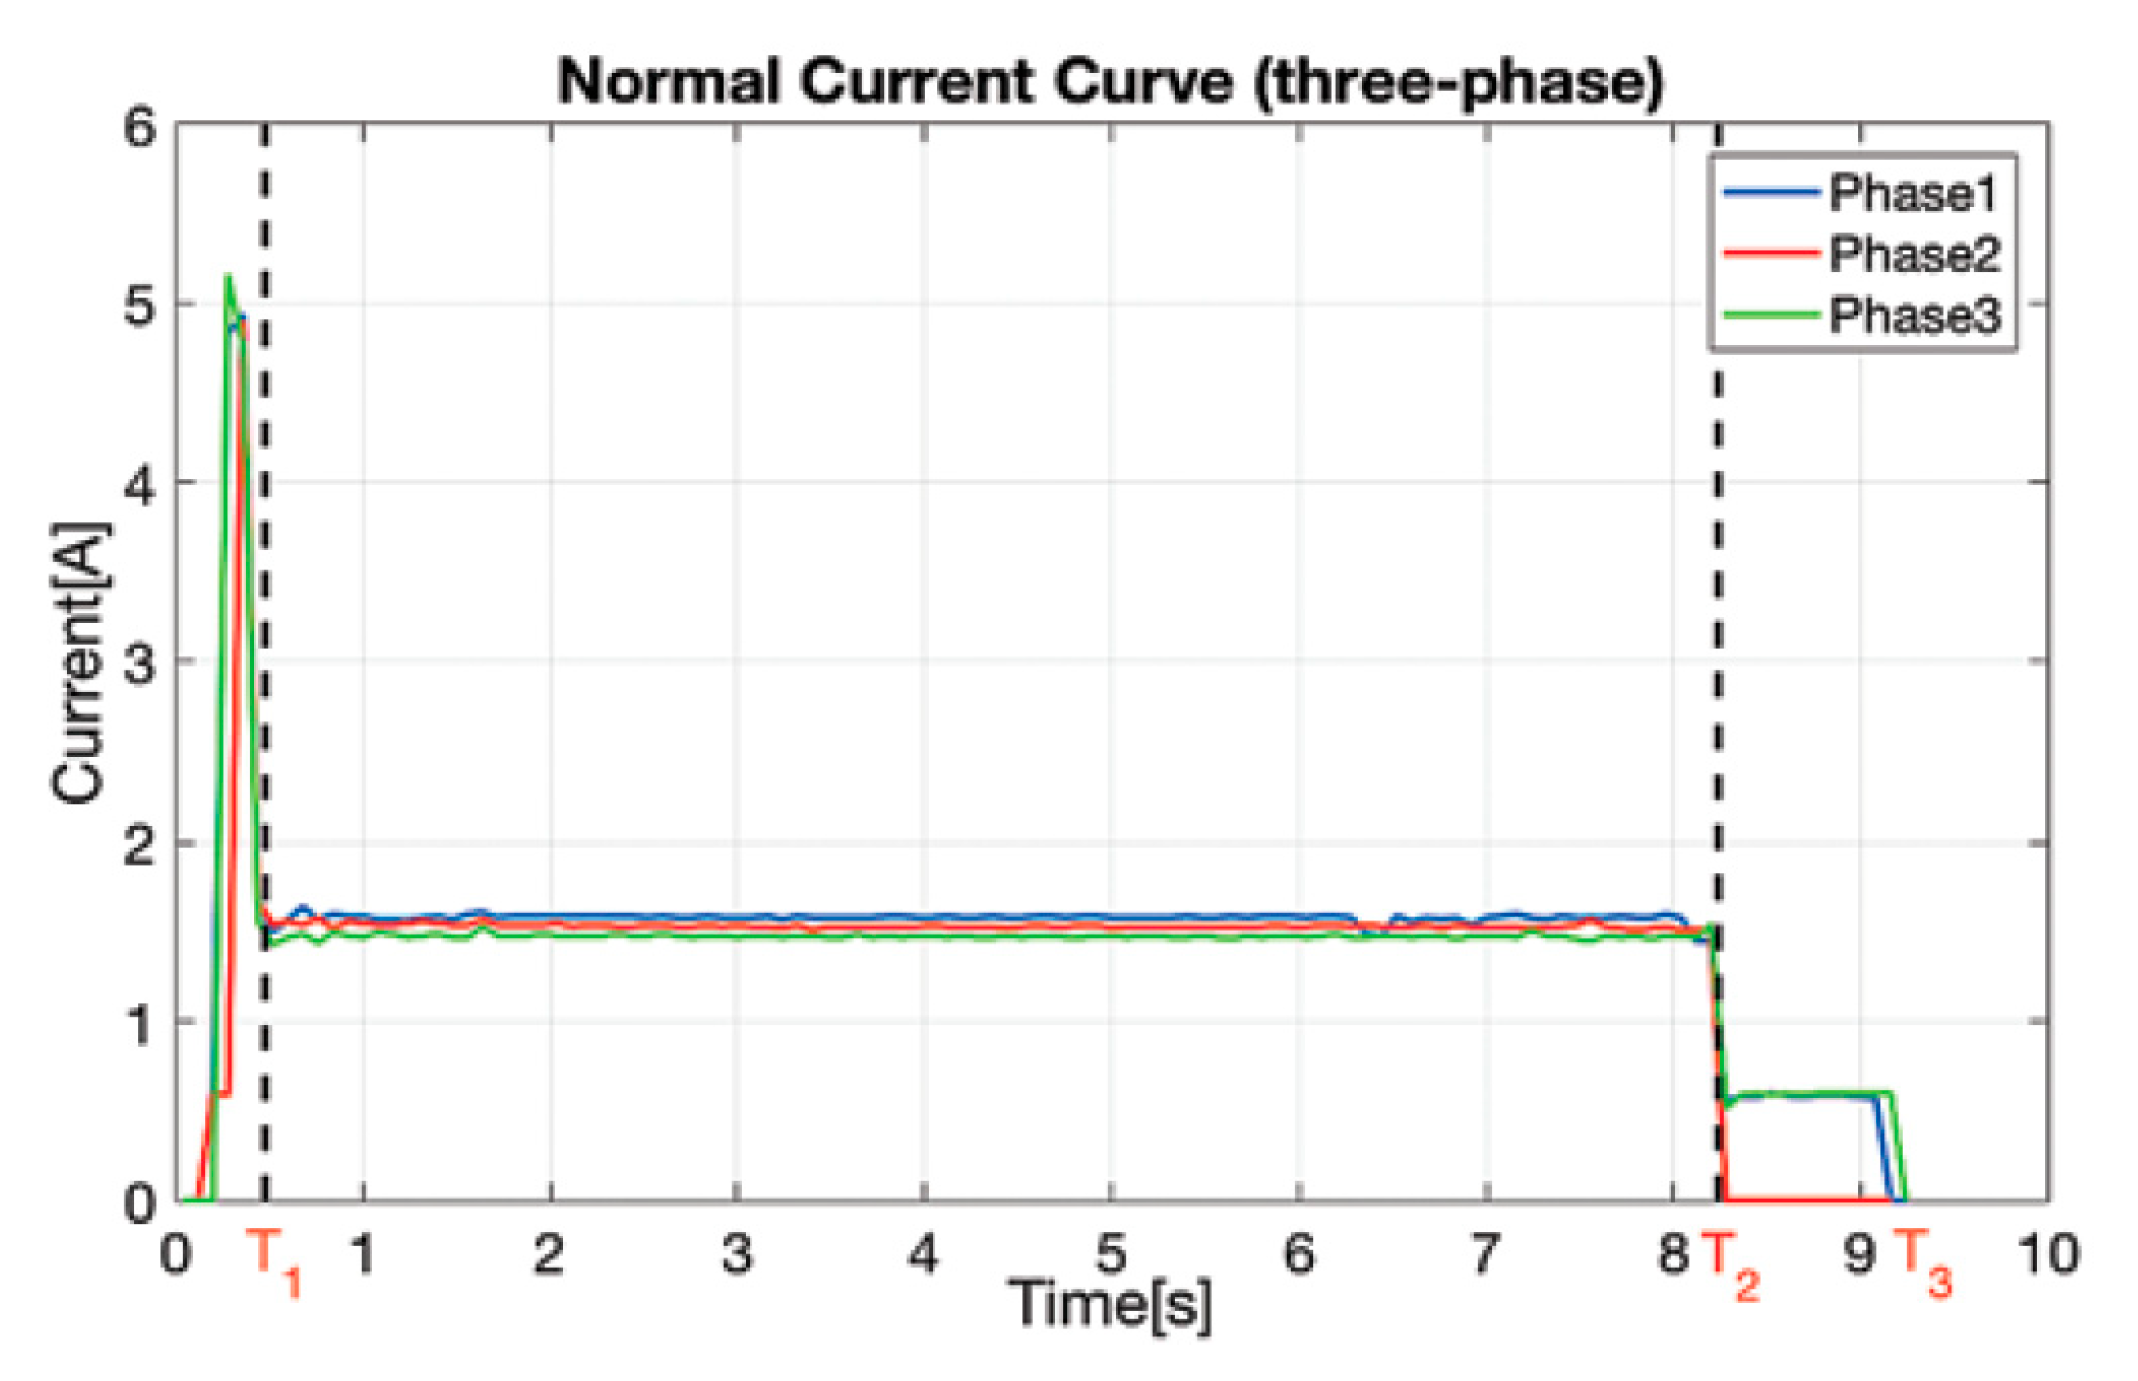
As an FDD method for railway S&C systems, Oßberger et al. [113] proposed a signal-based CM technique that uses strain gauge signals to detect and diagnose changes in the combined system of the crossing nose geometry/wear state and the state of the underlying bedding in a railway S&C system. Those changes were due to wear and plastic deformation in service. In addition, a setup of laser-based non-contact 2D measurement of the crossing geometry has been considered to quantify the geometry change of the new crossing nose. With the aim of developing an intelligent FDD algorithm for railway S&C systems, a DTW method was proposed in [114]. Performance of the proposed data-driven FDD method was determined by analyzing the turnout current curves in healthy and five faulty cases: turnout suddenly stops running after starting, turnout jams, startup circuit disconnection, locking current exceeded, and automatic actuator is not flexible. Their results showed that the S&C system health conditions considered were automatically detected and then diagnosed with 100% accuracy. The authors achieved this high accuracy despite the sensitivity of DTW to the presence of noise and its level because they performed a curve normalization procedure (i.e., a preprocessing procedure) to eliminate the impact of noise. Further, the authors concluded that their proposed DTW-based FDD method for S&C systems could perform well even if the values of the current curve fluctuate and even if the operating time is different. In addition, they mentioned that their method will be suited to real-time CM since it does not need feature selection, historical data, or prior knowledge. Ou et al. [115] proposed a hybrid FDD method for dealing with the CM of a railway S&C system. The hybrid FDD method was based on derivative DTW and a quartile scheme. Again, the hybrid FDD method analyzed the current curves collected by microcomputer monitoring systems; the switch operation current curves were divided into three phases, as can be seen in Figure 14. Several faults (e.g., abnormal fluctuation, start failure, open startup circuit, electric relay switch failure, etc.) were considered, and 20 features were used:
  • Phase 1 (start stage, T1): time span, maximum value, mean current value, median current value.
  • Phase 2 (action stage, T2): time span, maximum current value, minimum current value, mean, median, standard deviation, peak factor, fluctuation factor.
  • Phase 3 (slow release stage, T3): time span, max current value, minimum current value, mean, median, standard deviation, peak factor, fluctuation factor.
Detection and diagnosis accuracy of 99.43% and 98.67%, respectively, was achieved, better than for SVM and DTW methods. Further, their results showed that the proposed hybrid FDD method for railway S&C systems was more robust since its false alarm rate and missing alarm rate were both low.
Another FDD method that analyzed current curves for an S&C system was developed in [116]. It was based on a similarity function (i.e., Fréchet distance) and a fuzzy c-means clustering method. The former was used for FD and the latter was used for fault diagnosis after using a k-means algorithm for curve selection. The developed two-stage (hybrid) FDD method was applied to a ZD6 turnout located in Jinan Railway Station in China. The data analyzed were collected from 12 December 2017 to 10 January 2018, with a total of 817 curves for four turnouts (70% was used for training and the remaining 30% kept for validation). The authors concluded that their hybrid FDD method is suitable for real-time application since it is independent of human experience and can perform well, even under the influence of changing the location, weather, and working hours, especially since the FD accuracy is double-checked in the second stage.
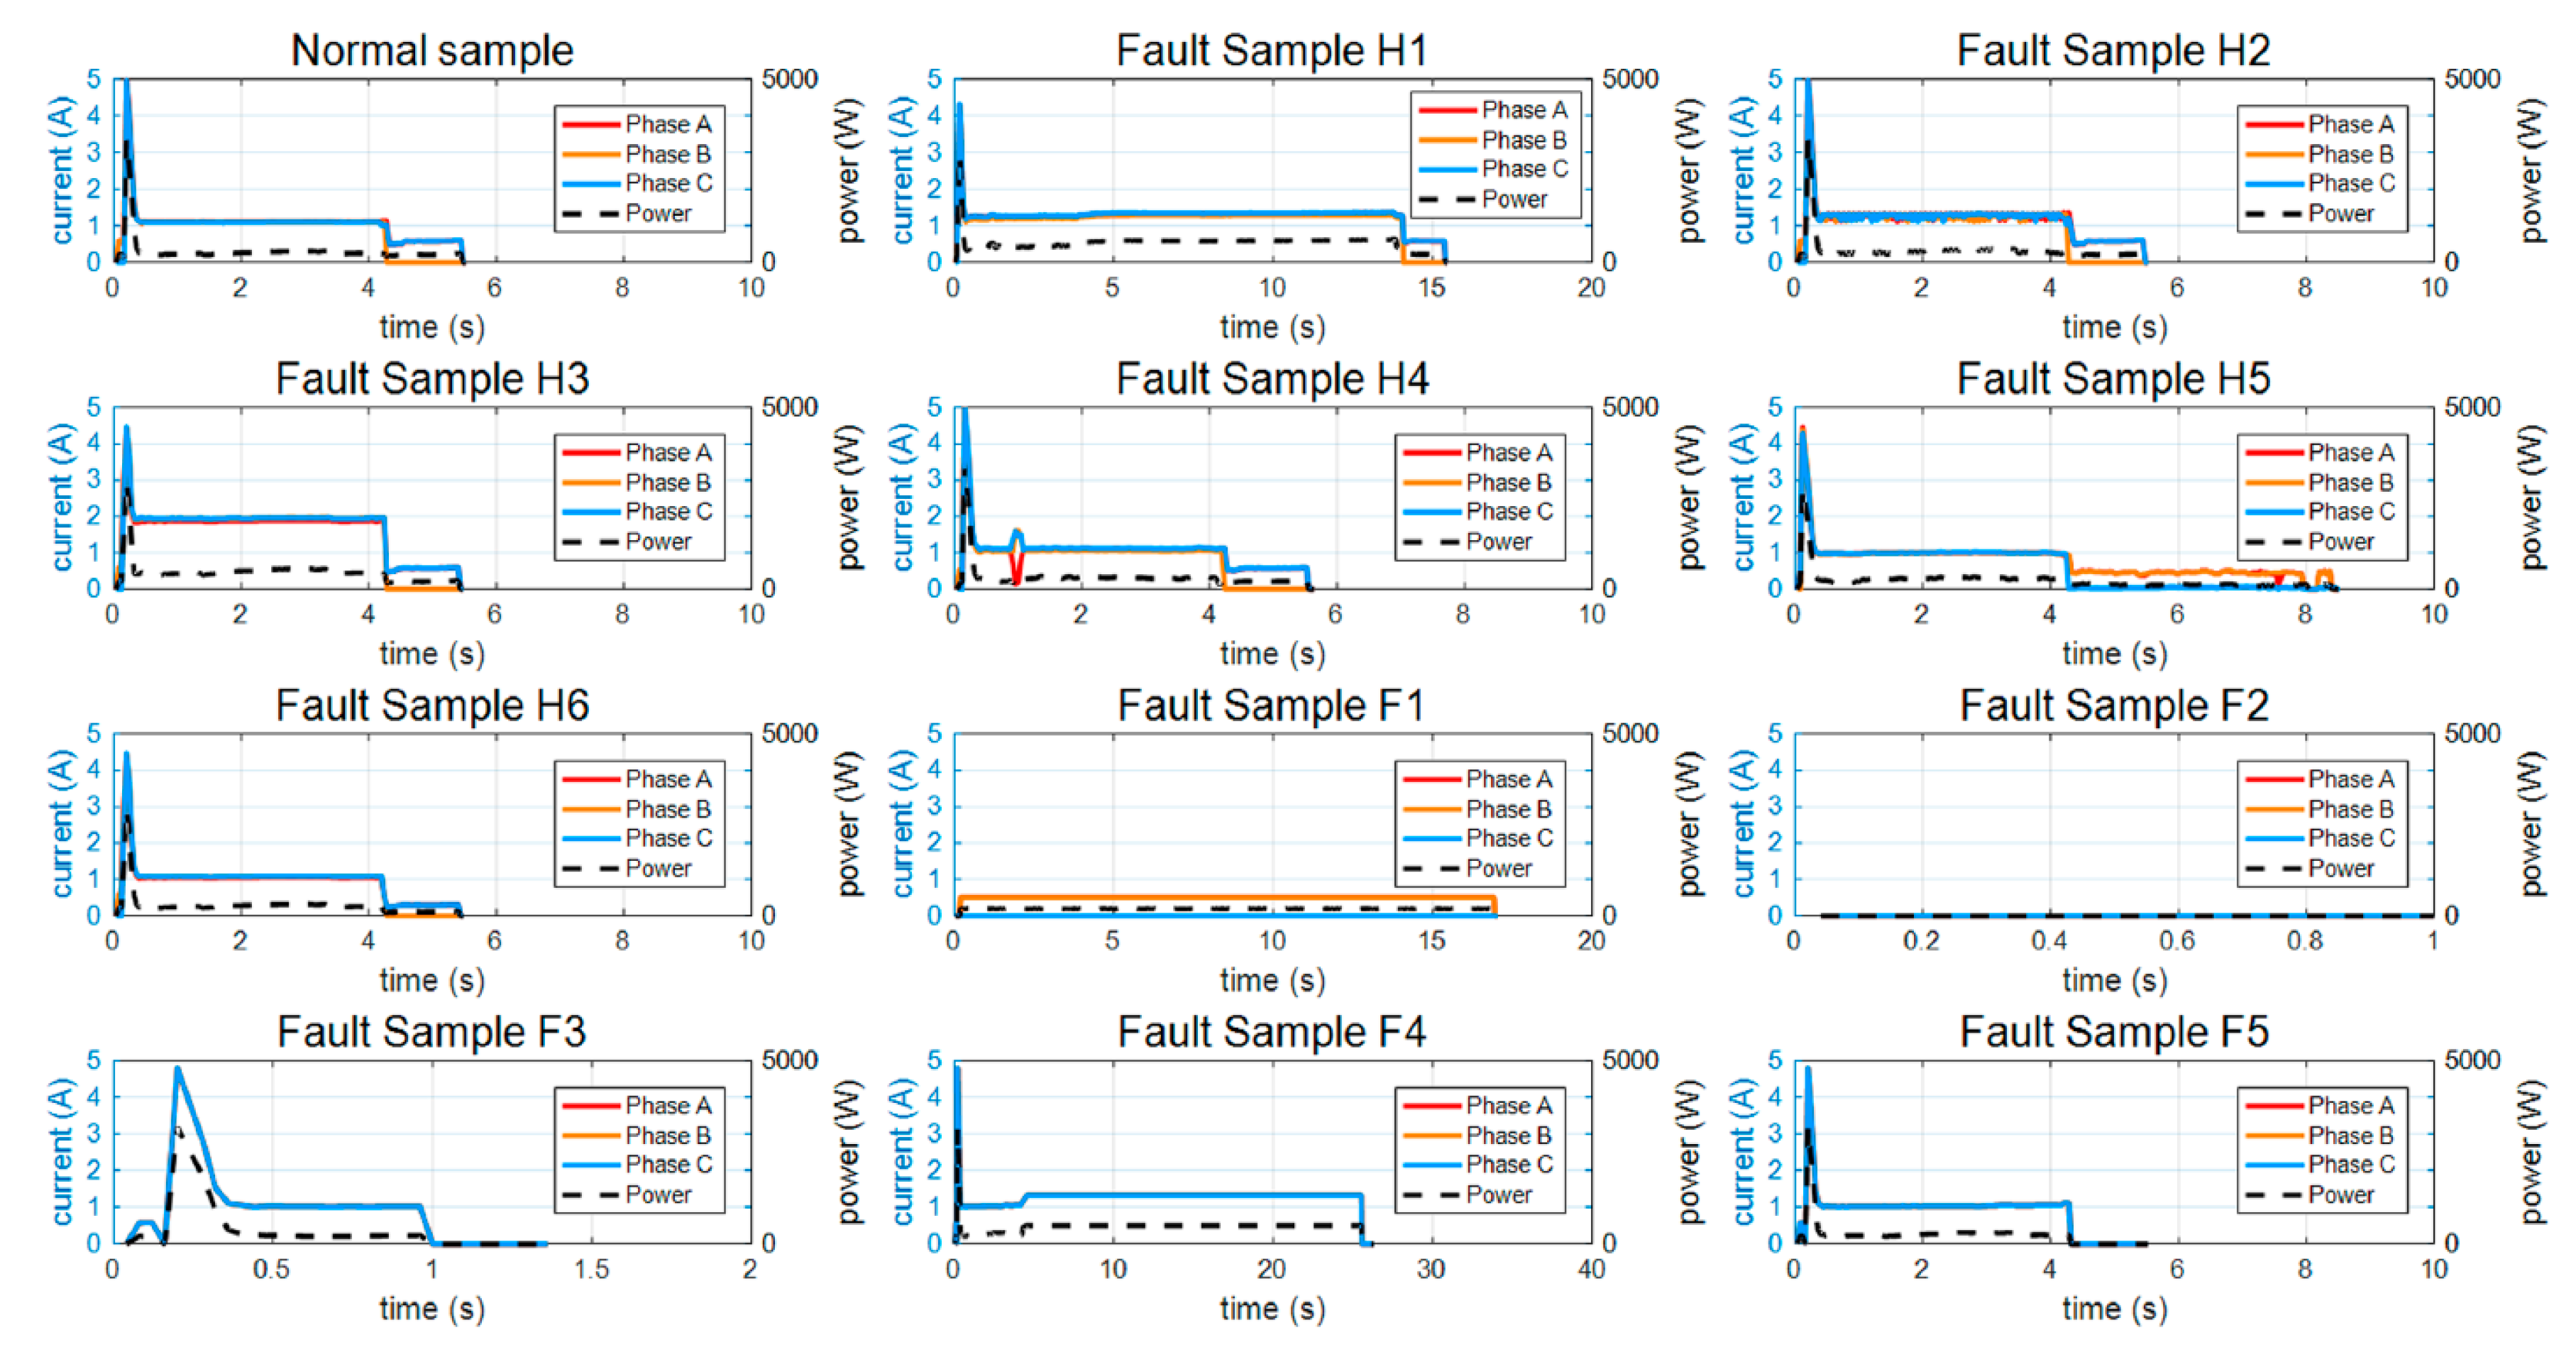
More recently, this year, Ou et al. [117] applied a data-driven FDD method for railway S&C systems. First, they extracted the features—from the current and power signals—using a derivative method that segments the original sample. After that, they reduced the extracted features space using PCA and linear discriminant analysis (LDA) algorithms since they are the best statistical methods for space reduction [118,119]. Finally, a modified SVM (i.e., balanced SVM) algorithm was used for fault classification and compared to the classical SVM for an imbalanced sample set. The results showed that the LDA + balanced SVM gave the highest detection and diagnosis accuracy, up to 99%. It is worth noting that the data-driven FDD method developed in this work was checked for several fault cases, including: “mechanical jam” fault (H1), “improper position of the slide chair” fault (H2), “abnormal impedance in the switch circuit” fault (H3), “bad contact in the switch circuit” fault (H4), “abnormal open-phase protection device in the indicating circuit” fault (H5), “abnormal impedance in the indicating circuit” fault (H6), “the electric relay in the start circuit fails to switch” fault (F1), “supply interruption” fault (F2), “open-phase protection device” fault (F3), “fail to lock” fault (F4), and “indicating rod block in the gap” fault (F5). The authors defined the labels as Hi (H1–H6) for hidden danger faults and as Fj (F1–F5) for major faults. In addition, they gave a common current curve for each fault type as can be seen in Figure 15.
Further, this year, Matei et al. [120] also applied a data-driven FDD method for railway S&C systems. A hybrid classifier that uses the partial system knowledge (partially known behavior) and a NN-based classifier, for comparison purposes, were considered with a set of faults in a rail switch system. The authors acquired force, speed, and power signals. They used the block-lower-triangular (BLT) form to determine the input and the output of the NN, where a deep learning framework was used to formulate the system dynamics. The authors considered four fault operating modes: left and right misaligned adjuster bolts, obstacle and missing bearings for validation. This method was designed to integrate the partial known physical information in the classifier design and the authors demonstrated that the classification problems could be converted into a set of regression problems and a set of dimensionally reduced classification sub-problems.

3.2.3. FP Methods

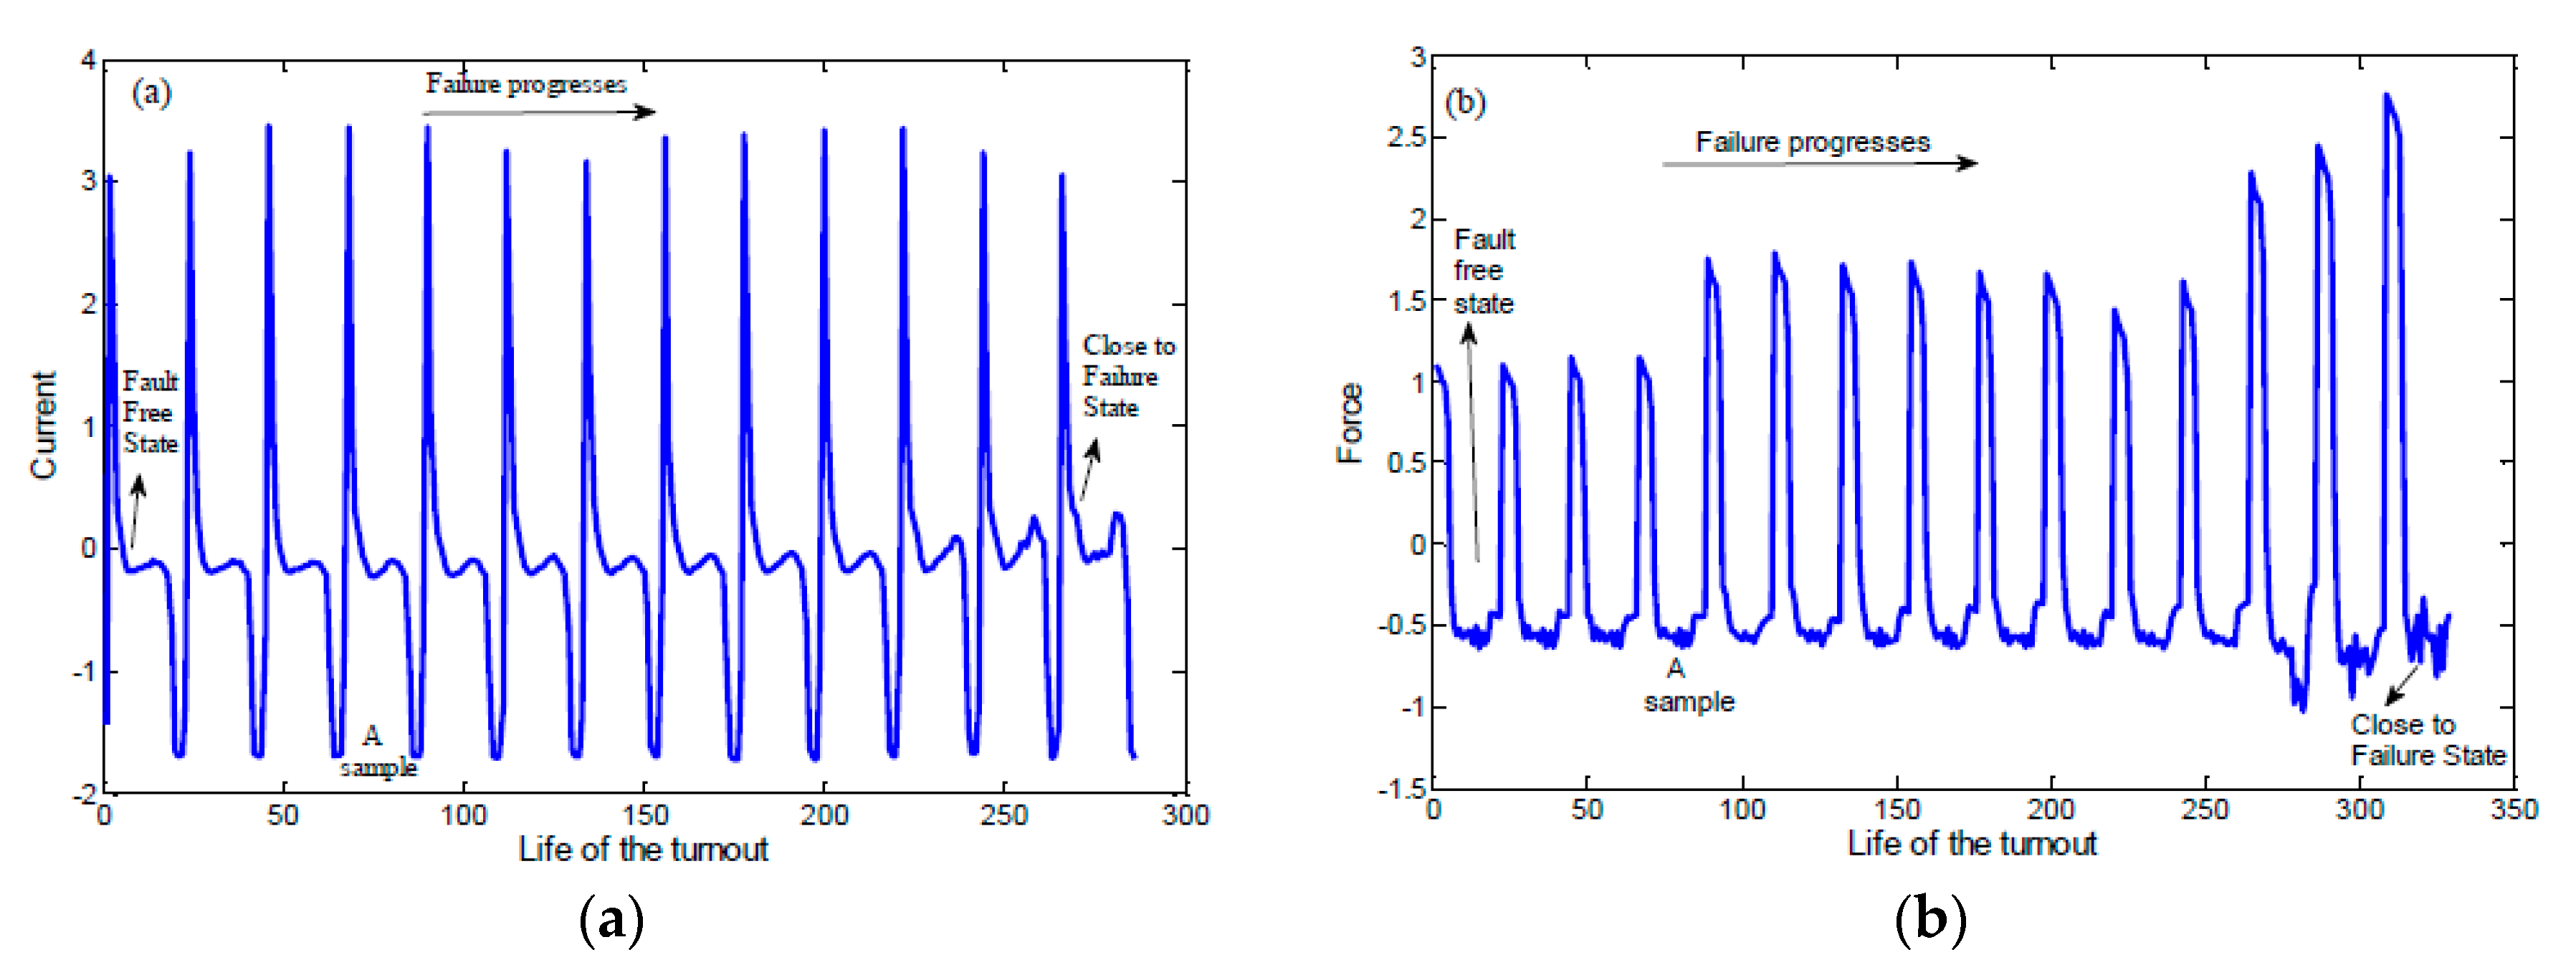
To the authors’ knowledge, prediction of the RUL of an S&C system using a data-driven method was first performed by Yilboga et al. [121]. An artificial neural network (ANN)-based technique was used as a learning algorithm. More precisely, a time-delay neural network (TDNN) method was used for estimating and predicting future values of railway S&C system parameters based on past and current information. A TDNN was chosen because its input structure incorporates time information, which makes it suitable for time-related problems such as prediction. An electromechanical railway S&C system was considered, and different sensors were installed (i.e., force sensor, linear ruler sensor, proximity sensor, and motor current sensor) and their signals analyzed. The analysis revealed that the force sensor contained the most valuable information about the health of the turnout system until failure, as can be seen in Figure 16. However, analyzing closely the results shown in Figure 16, it should be noted that the significant increase in force signal in Figure 16b appeared outside of the time window represented in Figure 16a, thus further analysis/work should be considered with consistent data and results.
Eker et al. [122] presented a simple state-based prognostic (SSBP) method for detecting and forecasting the health condition of an electromechanical S&C system. Then, it was compared to a hidden-Markov model-based method on real data collected from a railway S&C system. Basically, the proposed SSBP method had three steps: (1) clustering that was achieved based on the k-means clustering algorithm; (2) cluster evaluation in which a Calinski–Harabasz (CH) index [123] was chosen for validation (it was used to give the optimal number of clusters and health states); (3) finally, RUL prediction was achieved using the transition probabilities between health states. In this study, nine sensors were installed in the S&C system to collect the force, current, and voltage signals, in addition to two proximity sensors for each rail, and two displacement sensors for each drive rod. Eighty percent of the collected data was used to train the proposed RUL prediction algorithm (i.e., the SSBP method) and the remaining 20% was left for testing and validation. The root mean square error (RMSE) and r-square values between the real and estimated RUL were used as measures to evaluate the effectiveness of the prognostic method. Despite the proposed SSBP method’s simplicity, the results showed that it outperforms the hidden-Markov model-based prediction method. However, it had a restriction on state transitions, allowing transition of a state only to itself and a consecutive state, thus it ignored the effect of duration. Therefore, Eker et al. [124] improved their work, deploying a state-based prognostics with duration information (SBPD) algorithm to identify the health state first before calculating the RUL of the railway S&C system.
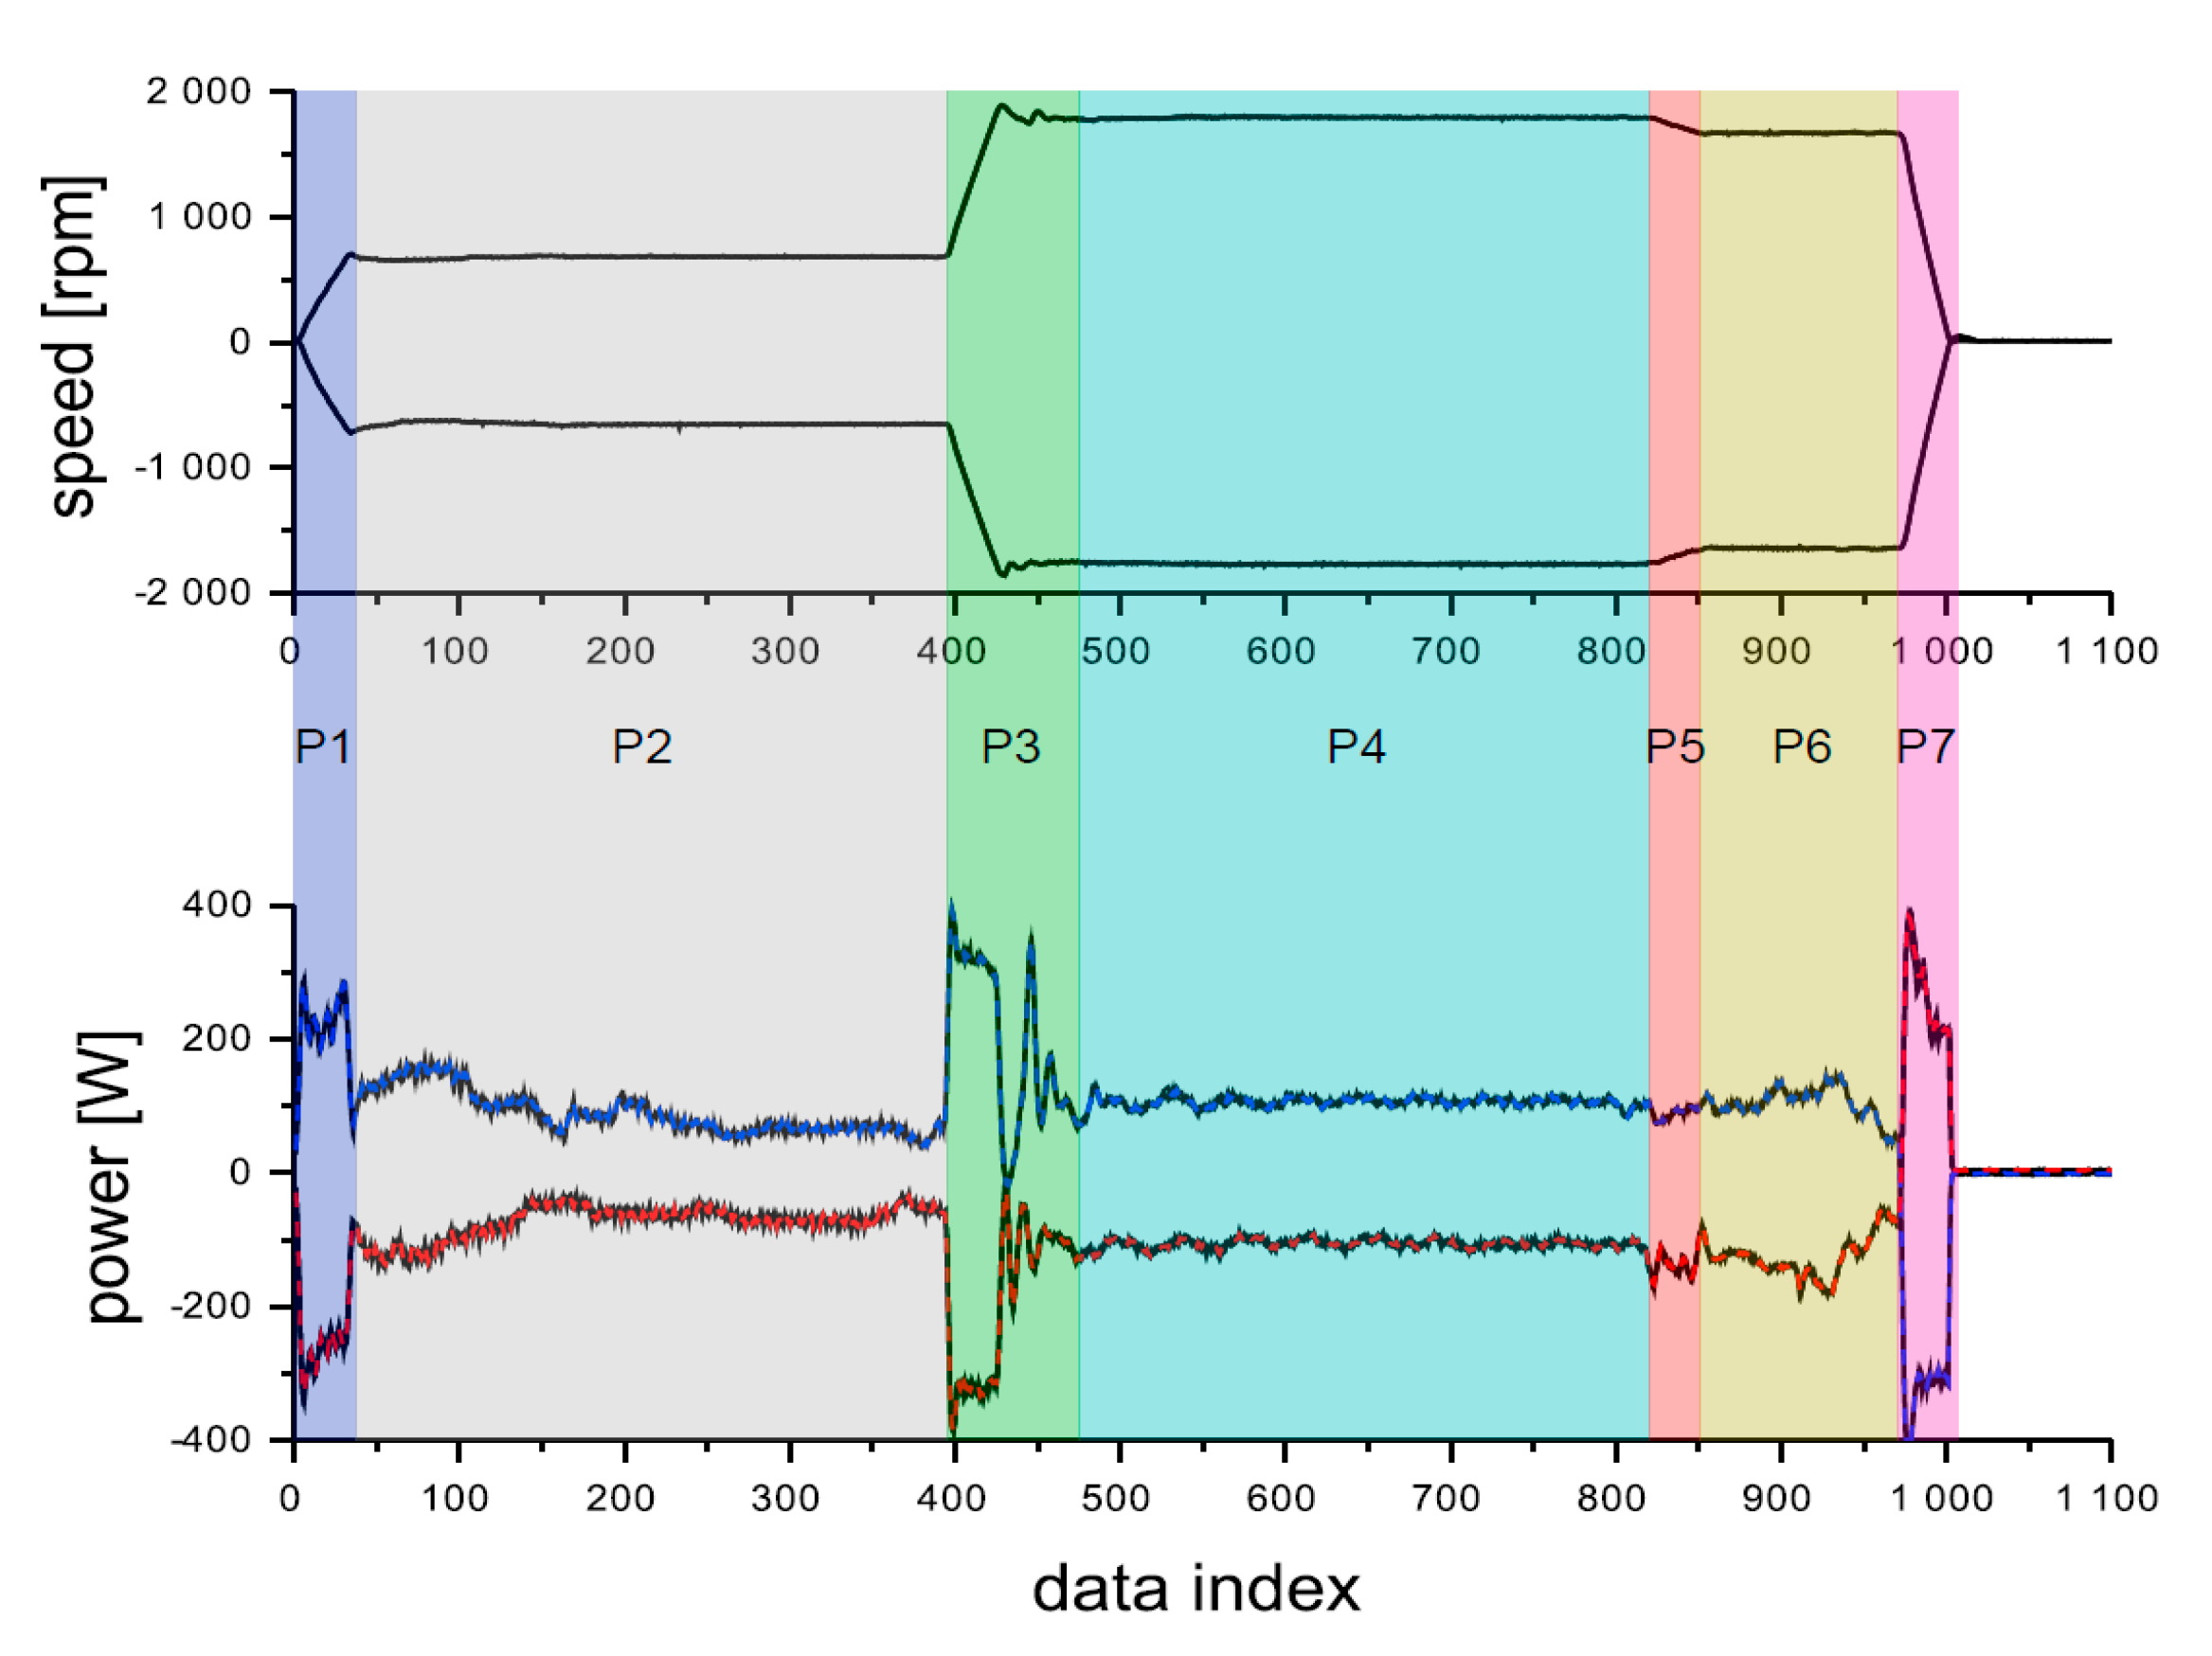
Other works dealing not only with S&C FD, but also with S&C FP are presented in [125,126,127,128]. In [125], contrary to the aforementioned papers, the acquired signals were the motor shaft speed and torque instead of the current and force signals. In addition, the complete maneuver of an electromechanical S&C system was divided into seven phases, as can be seen in Figure 17, instead of three phases when using current curves, as shown in Figure 14. Each phase was defined as follows: P1 is starting of the point machine motor, P2 is movement of the internal components to unlock the locking system, P3 is unblocking of the locking system, P4 is rail movement, P5 is blocking of the locking system, P6 is locking of the locking system, and P7 is the end phase. For FP, the authors used the mean active power index that presented the movement of the blades—as it was found that was the phase most sensitive to several causes of degradation (mainly resistive forces)—and then a Monte Carlo simulation with a state representation method was performed to observe the degradation path and then estimate and predict the RUL of the railway S&C system.
In 2016, an FP method based on a fault tree analysis approach, i.e., a binary decision diagram (BDD) approach, was proposed and applied to an M63 point machine [126]. The BDD approach used two importance measures (IMs)—the Birnbaum IM that overstates the importance of events with a low probability of occurrence, and the Criticality IM that takes into account the occurrence probability of events—to classify the events, and the AND method [129] to rank them.
The FP method developed was used to set maintenance strategies that improve decision-making by optimizing resources. Camci et al. [127] compared three of the previous FP methods applied to railway S&C systems (i.e., the TDNN method in [121], the SSBP method in [122], and the SBPD method in [124]). In addition, they also compared various sensors—force, current, voltage, proximity, linear ruler, rotary encoder motor (speed and position), string encoder gearbox output (position and speed)—in terms of their cost, ease of installation, reliability, and sensitivity to failure. The three prognostic methods were compared for their RUL estimation accuracy (performance) using the RMSE, r-square, prognostic horizon, and α-λ accuracy metric indices. The comparison performed in this study concluded that: (i) failure degradation is better represented by force sensors (i.e., they are the best to be used as prognostic inputs), followed by linear ruler and current sensors, whereas proximity sensors are to be avoided for prognostic tasks; (ii) from a cost factor perspective, it is beneficial to use current, proximity, voltage, and speed sensors since they are cheaper, especially if, rather than being used directly, the raw data are processed and converted into force sensor values (if possible) that will make them better represent the failure degradation, which will improve the prognostic performance; (iii) among the three prognostic methods, the SBPD RUL prediction method was the most accurate, whereas the TDNN RUL prediction method was the worst since it had huge fluctuations. After that, in 2017, Böhm [128] presented an approach to predict the RUL of railway switch engine failures that based on two supervised classification techniques, ANN and SVM. Only the power consumption of the engine collected through the SIDIS W (compact) condition monitoring system from Siemens was considered, to form a two year time series of 29 switches of Deutsche Bahn (with a S700K electromechanical engine). After preliminary analysis, the author discovered that using only the power signal was not sufficient and he considered in addition, the dependency of the switch condition data from climatic conditions (temperature and humidity) and certain properties of the switch construction type. To avoid common problems with uncertainty in measurement data, the author proposed a long prediction horizon (month) of small time units (hours). In addition, he studied the high number of possible parametrizations problem when applying his develop method and how it affect the RUL prediction.
More recently, other two PHM methods for railway S&C systems were proposed in [130,131]. The proposed PHM method in [130] was focused only on predicting the RUL of the slide chair. Failure degradation of the sliding chair was simulated by accelerated aging of a real system, and field data were collected. The force sensor was considered (for resistive force measurements) and was installed on an electromechanical point machine. For the PHM algorithm, different health indicators (HIs) were extracted and selected first—for the selection procedure, two steps were considered: the first was intraclass analysis, in which all HIs with a higher monotonicity value were selected; the second was interclass analysis, where a similarity matrix was constructed from the HIs selected (in the first step) using the Euclidean distance—then a k-means clustering method was applied for FD. Finally, a degradation model for failure prognosis was built using a double exponential function. The proposed PHM method could predict the RUL with acceptable precision because k-means could only detect bigger changes in the slide chair health conditions and were less sensitive to smaller changes, which caused late RUL predictions. Sysyn et al. [131] developed a FP technique that used the maximal overlap discrete wavelet packet transform (MODWPT) and Shannon entropy (SE) to extract the spectral features. Then, the Lasso (Least absolute shrinkage and selection operator) regularization was used for selection. The extracted and selected features were fused with some system time domain information to predict the lifetime of crossing, where the RUL was prognosed by a linear degradation stochastic model with recursive Bayesian update to optimize the scheduled inspections for the common crossings. The authors concluded that their method has shown good quality of prognosis results, but need a high number of measurements.
A summary of all reviewed FDD methods for railway S&C systems and a list of all reviewed CM papers, with their application, method(s) used, signal(s) acquired, and fault type(s) considered, is presented in Table 2.
From the summary of all reviewed papers in the field of FDD methods for railway S&C systems shown in Table 2, the shortage of research works applying model-based approaches compared to data-driven approaches for railway S&C system health conditions is clear.
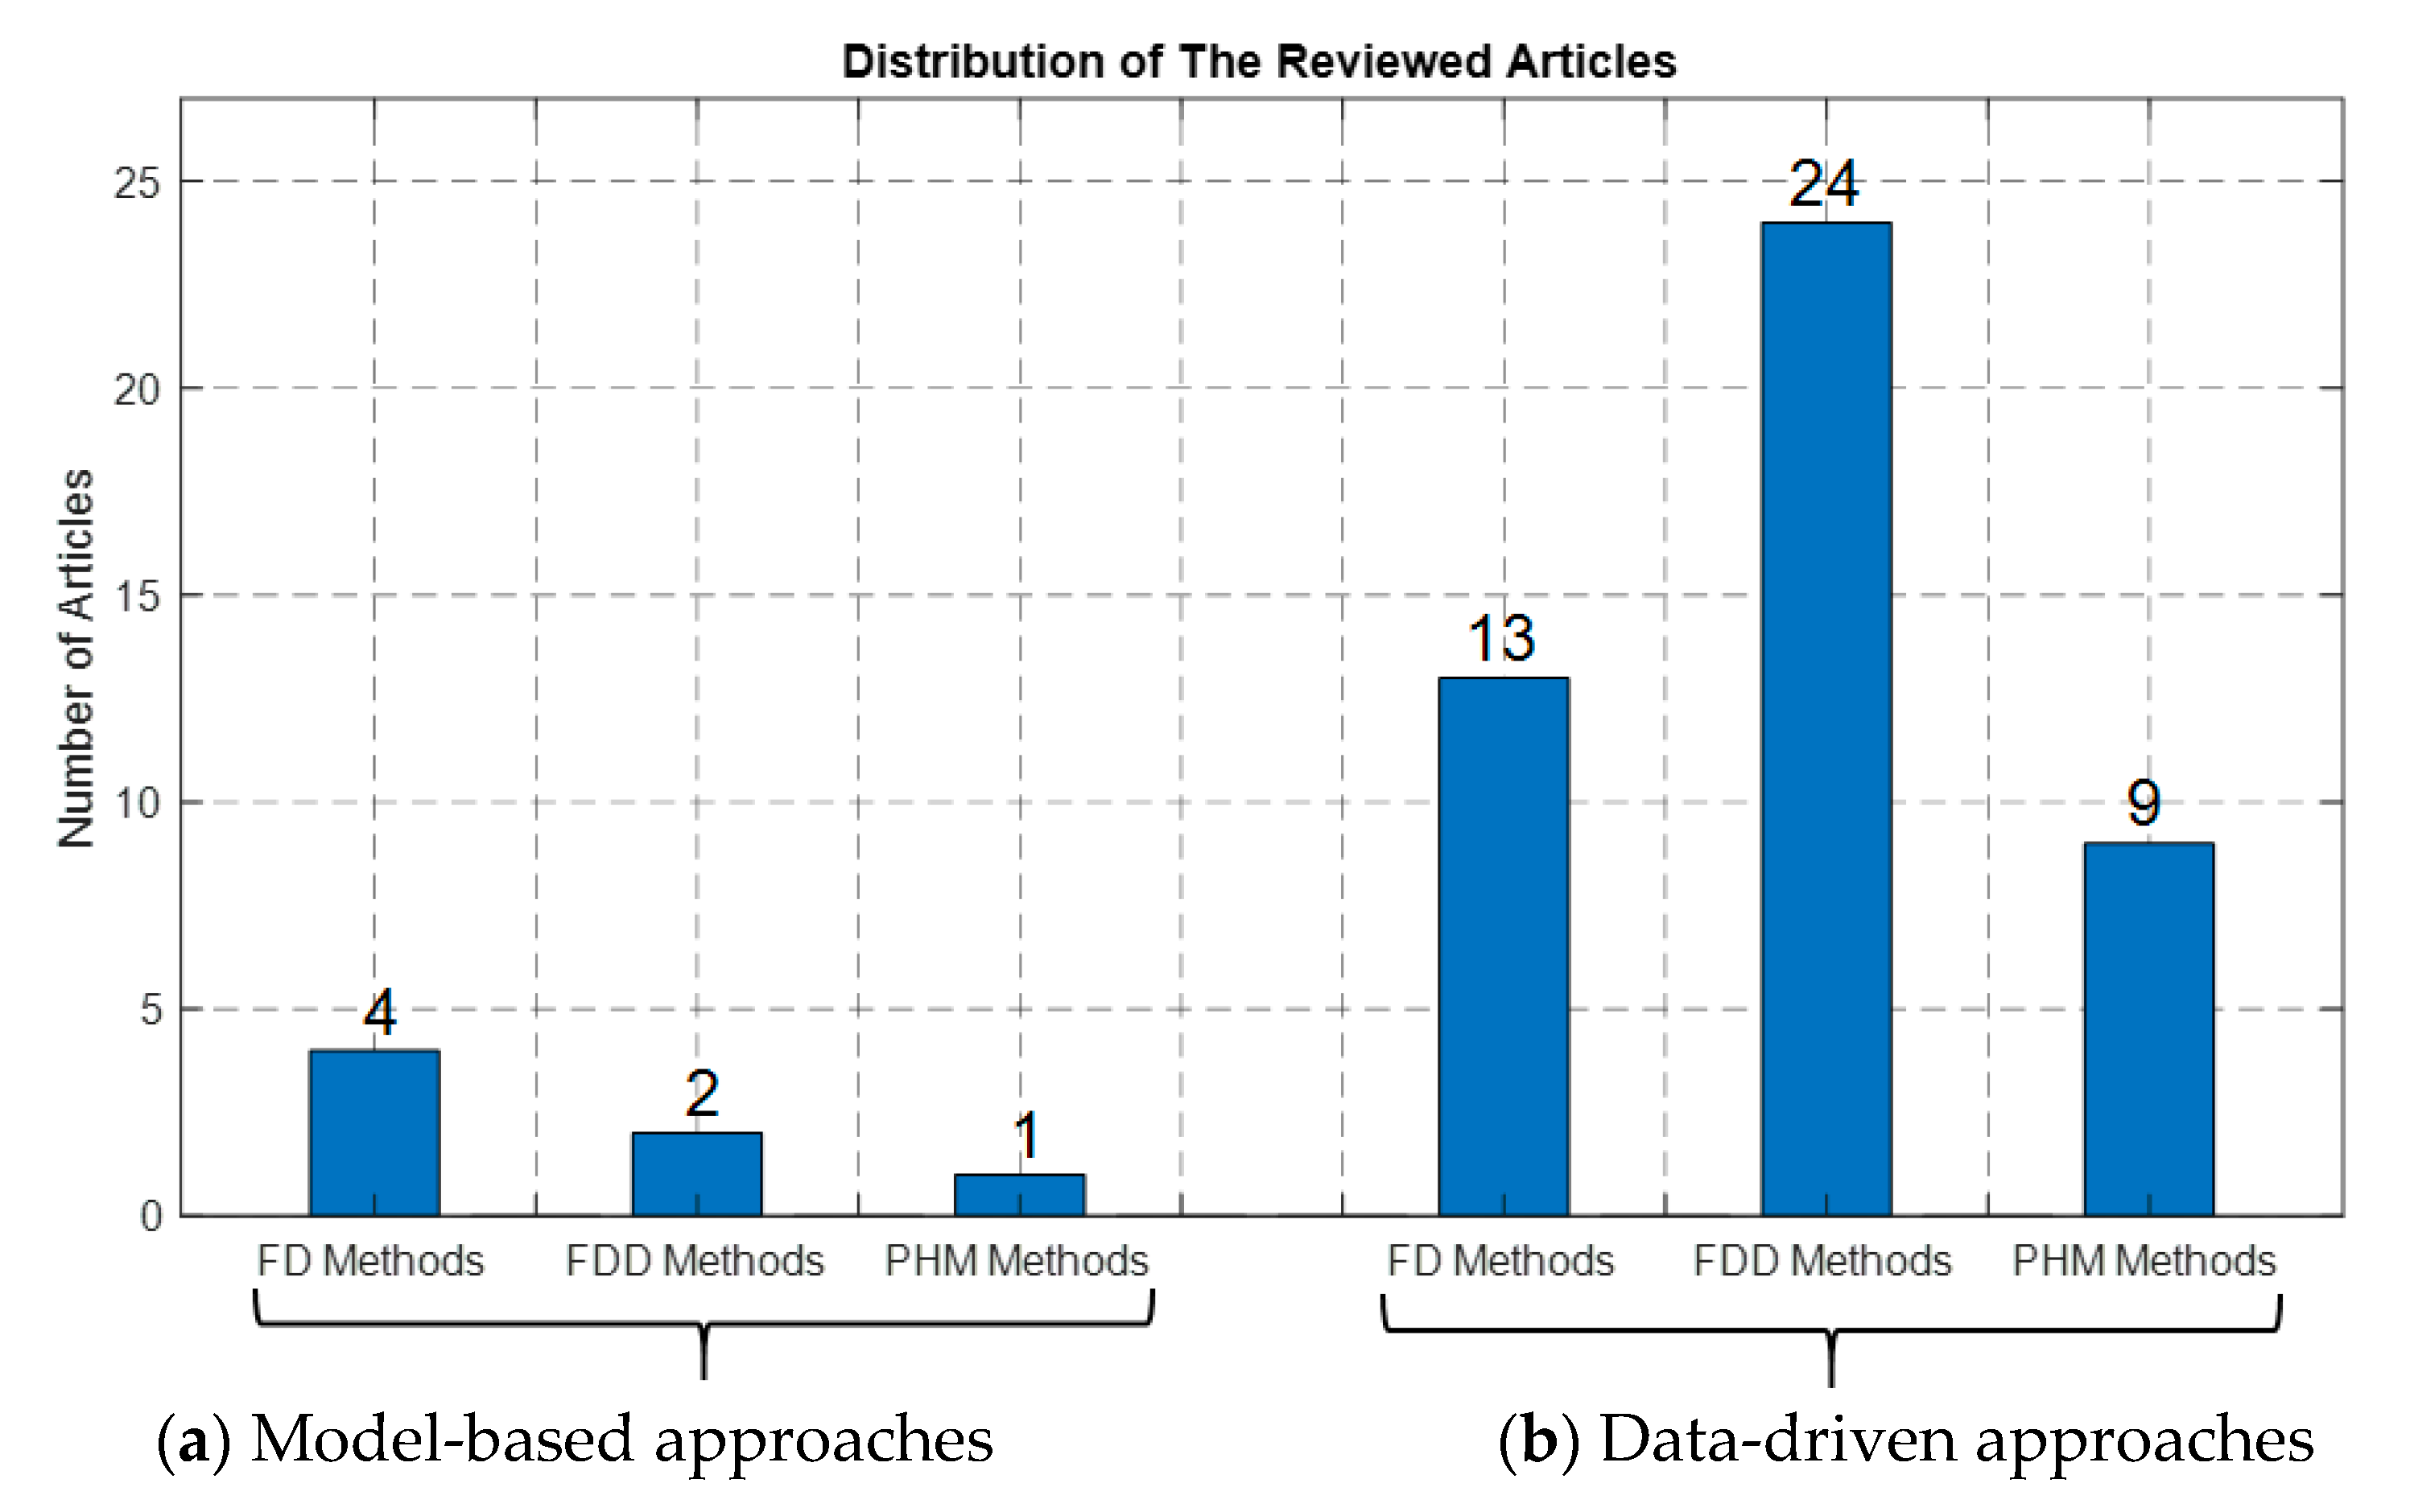
A quantitative summary of these reviewed articles in the field of FDD for railway S&C systems is shown in Figure 18. It shows an opportunity for researchers in this field to perform more research works in future that apply model-based techniques to deal with FD, FDD, and/or FP of the different possible fault modes in railway S&C systems.
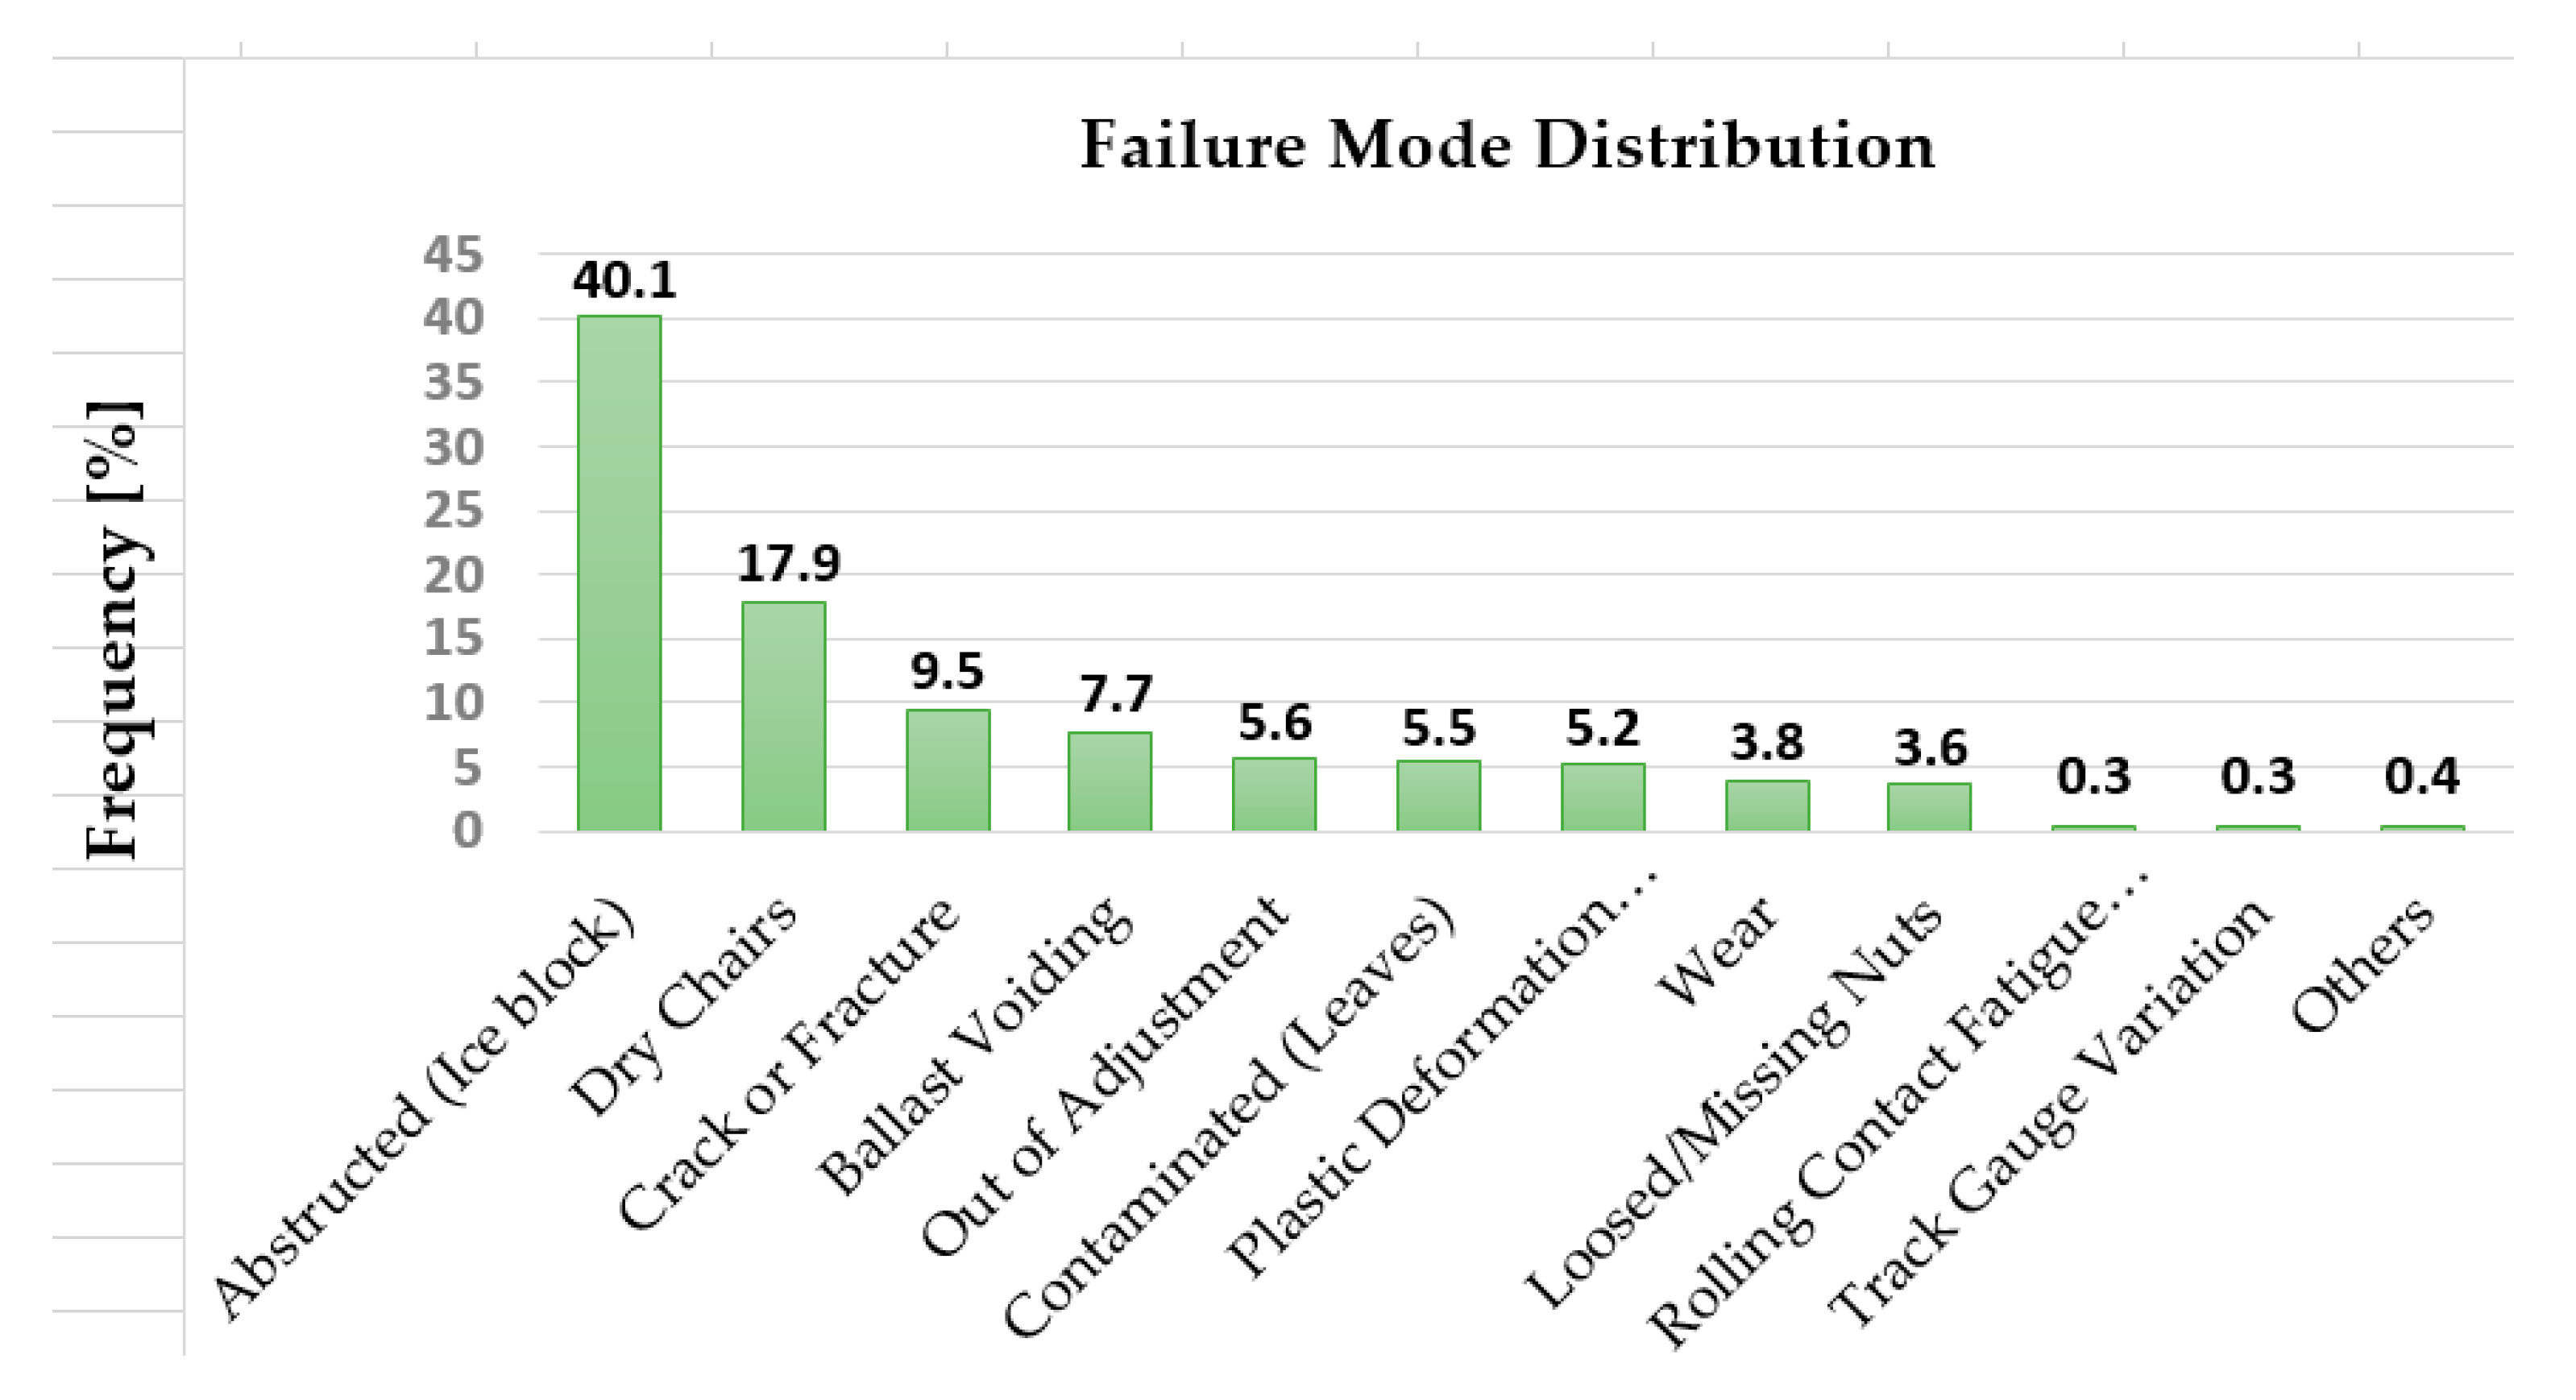
Although several fault scenarios have been considered, almost all are related to wear-induced faults (i.e., slide chair-related faults and/or switch-related faults). Different possible faults could be also taken into consideration, especially those related to ‘obstructed’ failures, as they have a 40.1% of occurrence compared to only 17.9% for ‘dry chairs’ and 40.9% for all remaining failure types, as can be seen in Figure 19. It should be noted that it is hard to diagnose these ‘obstructed’ failures and it is almost impossible to predict their life time since they are an abrupt failure type; however, they can be detected to improve railway S&C system operating performance.
Further, from this review of the existing FDD methods (both model-based and data-driven techniques) applied to railway S&C systems, it is observed that electrical fault modes (as shown in Figure 9) have not been considered at all, except for crushed cable fault mode [95], startup circuit disconnection (bed contact) [114], and electric relay switch failure [115]. This is another opportunity for researchers to study and analyze other possible fault modes in railway S&C systems.
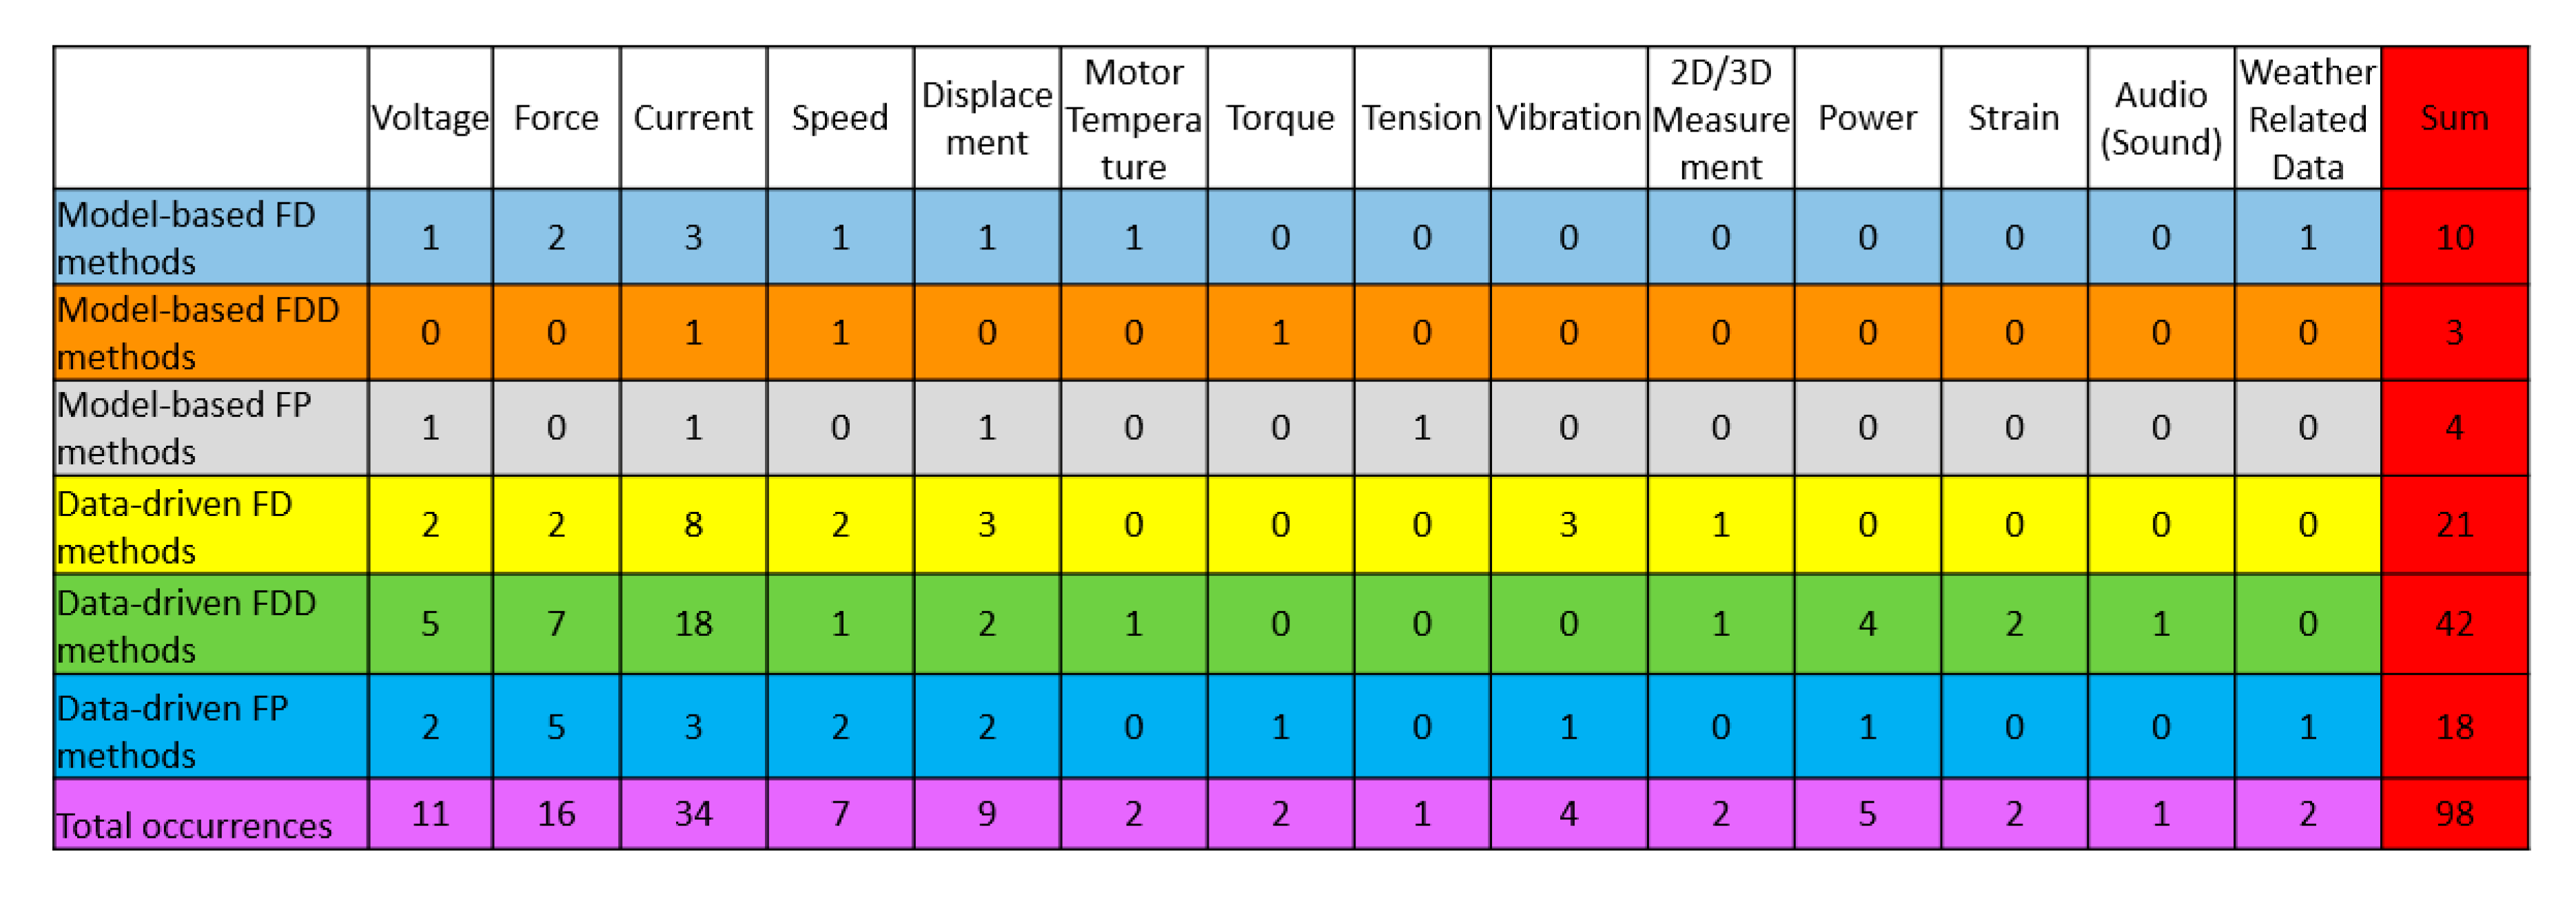
Analysis of the different signals adopted for analysis in all the reviewed articles, when applying either model-based methods or data-driven techniques, was performed and the results are shown in Figure 20.
Analyzing the results shown in Figure 20, it can be seen that several types of signal are considered, including: voltage, force, current, speed, displacement, motor temperature, torque, tension, vibration, 2D/3D measurement, power, strain, audio (sound), and weather-related data (e.g., rain, showery rain, snow, sleet, thunderstorm, etc.). The frequency of applying those signals is illustrated in Figure 21, which shows a clear tendency toward applying the first five signals: voltage, force, current, speed, and displacement; the current signal had the highest frequency.
The results shown in Figure 20 and Figure 21 further open doors for researchers to adopt the remaining signals such as vibration signals that are known to be sensitive to any fault that causes deterioration in the mechanical structure of the system, and which are used extensively in other fields such as rotating electrical machine FDD [54,84].

4. Summary and Concluding Remarks

In this paper, a comprehensive overview and summary of the existing fault detection, diagnosis, and prognosis methods and their application to railway S&C systems have been presented. Thus, this paper first introduced the fundamentals of railway S&C systems, including their mechanisms, sensors and controllers, actuators, and locking systems, in addition to attempting to organize and classify the diverse failure modes of different railway S&C systems. These diverse failures were thus classified according to their source and nature into mechanical failures, electrical failures, construction failures, and functional failures. Each of these failure types can be found in one or several subsystems of railway S&C systems, including faults in actuators, faults in sensors and controllers, faults in the detection and locking parts, and faults in the permanent way (i.e., the rails and any other elements that support the vehicle). Then, the different FD, FDD, and FP methods for railway S&C systems were classified as either model-based or data-driven.
Several key points can be concluded from this review:
  • Only six papers, as shown in Figure 18, were found that applied a model-based FDD method for railway S&C CMS, and only one paper dealt with FP using a model-based method. In addition, only a few possible fault scenarios of the S&C system were considered and tested for model-based FDD methods, mainly focusing on slide chair-related faults (i.e., dry, contaminated, excessive friction or resistance) and switch-related faults (such as stuck, bad contact with the base plate, idle, resistance, hard to release, cannot lock, or misalignments). For the PHM application in S&C systems, only a contaminated slide chair fault scenario was studied when applying a model-based method. Considering the large number of published papers and the amount of research work done in modeling a whole railway S&C system or only part (subsystem) of it, the authors anticipated finding several if not dozens of papers applying a model-based FDD method to different railway S&C systems. However, only a few papers (seven in total) were found. This is due to the several difficulties that researchers can face when trying to apply a model-based FDD method for railway S&C CMS:
    -
    the complexity of S&C systems that comes from their ramified structures makes finding an accurate enough reference model challenging.
    -
    the amount of potential failure modes and their predictability.
    -
    the different drawbacks of model-based techniques such as the fact that the accuracy of the reference model developed directly affects performance of the fault detection, diagnosis, and/or prognosis process; and that the construction of high-fidelity mathematical models from physical principles of such a complex system (i.e., railway S&C system) can become very complicated, time-consuming, and even sometimes unfeasible.
    -
    development of the model requires much prior knowledge (e.g., physical, mechanical, or electrical laws) about the real system.
  • It is well known in the CMS field that if researchers can construct an accurate enough reference model, using a model-based FDD method for fault detection, diagnosis, and/or prognosis is the best choice. Thus, building and merging dynamic models of a railway S&C system as a whole or for each of its subsystems could enhance the performance of model-based FDD methods for S&C systems. However, because of the complexity of the S&C system as a whole and the diversity of its components as well as its failures, it is recommended that researchers consider incorporating those dynamic models for each of its subsystems, one by one at first, and then integrating them into a more complete model if possible. In addition, there are many model-based techniques that researchers have not used for railway S&C CMSs, and which are well known to be good solutions, such as parameter estimation methods (e.g., least square and its variants), state estimation methods (e.g., observer-based algorithms), and parity space methods (e.g., state space-based or input–output-based techniques. The benefit of considering hybrid techniques to better detect, diagnose, and/or prognose railway S&C system health conditions should not be forgotten.
  • In contrast to the lack of model-based FDD methods applied for railway S&C systems, a dozen research papers were found and reviewed in this paper that applied a data-driven FDD method for railway S&C systems because they are known to be more practical since there is no need to build a reference model (i.e., less prior knowledge is required). But they do need a large amount of (historical) data, basically from the output signal(s) to extract different features (indices, criteria), for synthesizing the information available from the raw data to better represent railway S&C system health conditions.
  • There are a huge number of features and data-driven FDD approaches, as reviewed by Hamadache et al. [84], that researchers are encouraged to consider and investigate to extend the fault detection, diagnosis, and/or prognosis field with application to different railway S&C systems. These are not only limited to some of the data-driven FDD methods reviewed previously (in Table 2) such as the SVM algorithm and its variants, the PCA method, the WT technique and its variants, the SOM algorithm, and the DTW method. In particular, researchers could incorporate contemporary techniques—i.e., shallow learning-based PHM (SL-based PHM) and deep learning-based PHM (DL-based PHM) techniques—especially nowadays in the age of the Internet of Things (IoT) and big data [84].
  • Although several fault scenarios have been considered when applying either a model-based FDD technique or a data-driven approach, almost all are related to wear-induced faults (i.e., slide chair-related faults and/or switch-related faults). However, other possible faults (as shown in Figure 9) could be also taken into consideration, especially the electrical fault modes.
  • The authors’ analysis shows that there is a clear tendency toward applying specific signals (i.e., voltage, force, current, speed, and displacement) for FD, FDD, and FP of railway S&C system health conditions, with current signal most used for FD and FDD and force signal for FP. Analyzing these signals does indeed give good results; however, there is also an opportunity for researchers to adopt other signals such as the vibration signals that are sensitive to several faults, especially those related to any mechanical or structural deterioration of the system.
  • It is worth mentioning that it is beneficial if researchers also take into account the proposal and/or design of a complete new whole or part S&C model such as the REPOINT light track switch developed by Loughborough University, UK [132]. Innovative rail track switching technology has been developed and implemented on a test track, aiming to improve reliability and safety, reduce maintenance costs, and possibly reduce train delays in around 90% of point failures (2010–2013).

Author Contributions

Conceptualization, M.H.; Writing—Original Draft Preparation, M.H. and S.D.; Writing—Review & Editing, M.H., S.D., O.O., R.A., E.S., and R.D.; Visualization, M.H.; Supervision, E.S. and R.D.; Project Administration, E.S. and R.D.; Funding Acquisition, E.S. and R.D.

Funding

The work described has been supported by the S-CODE project. This project has received funding from the Shift2Rail Joint Undertaking under the European Union’s Horizon 2020 research and innovation programme under grant agreement No. 730849. This publication reflects only the authors’ view, and the Shift2Rail Joint Undertaking is not responsible for any use that may be made of the information it contains.

Conflicts of Interest

The authors declare no conflict of interest.

References

  1. Apking, A. 2018 Worldwide Market for Railway Industries Study: Market Volumes for OEM Business and After-Sales Service as well as Prospects for Market Developments of Infrastructure and Rolling Stock; SCI Verkehr GmbH: Köln, Germany, 2018; p. 7. [Google Scholar]
  2. Gendrot, C.; Wattignies, L.; Fletcher, S. Railway Technical Strategy Europe; International Union of Railways (UIC) Communication Department-ETF: Paris, France, 2019; p. 5. [Google Scholar]
  3. Rail Market, SCI Verkehr GmbH. Available online: https://www.railjournal.com/in_depth/sci-study-forecasts-upturn-in-global-rail-market (accessed on 12 April 2019).
  4. Asada, T. Novel Condition Monitoring Techniques Applied to Improve the Dependability of Railway Point Machines. Ph.D. Thesis, University of Birmingham, Birmingham, UK, May 2013. [Google Scholar]
  5. CAPACITY4RAIL. D13.1–Operational Failure Modes of Switches and Crossings, SCP3-GA-2013-605650; FP7 Project, Capacity for Rail (C4R); European Commision: Brussels, Belgium, 2015. [Google Scholar]
  6. Rail Accident Investigation Branch. Rail Accident Report: Derailment at Grayrigg, 23 February 2007: Rail Accident Investigation Branch, Report No: 20/2008; Department for Transport: Derby, UK, 2009.
  7. Cornish, A.; Smith, R.A.; Dear, J. Monitoring of strain of in-service railway switch rails through field experimentation. Proc. Inst. Mech. Eng. Part F J. Rail Rapid Transit 2016, 230, 1429–1439. [Google Scholar] [CrossRef]
  8. Vitásek, S.; Měšťanová, D. Life cycle cost of a railroad switch. Procedia Eng. 2017, 196, 646–652. [Google Scholar] [CrossRef]
  9. Zwanenburg, W. Modelling Degradation Processes of Switches & Crossings for Maintenance & Renewal Planning on the Swiss Railway Network. Ph.D. Thesis, École Polytechnique Fédérale de Lausanne, Lausanne, Switzerland, March 2009. [Google Scholar]
  10. Kassa, E.; Gebretsadik, D. Analysis of failures within railway switches and crossings using failure modes and effects analysis methodology. In Proceedings of the Third International Conference on Railway Technology: Research, Development and Maintenance, Cagliari, Sardinia, Italy, 5–8 April 2016. [Google Scholar]
  11. Fuqing, Y. Failure Diagnostics Using Support Vector Machine. Ph.D. Thesis, Luleå University of Technology, Luleå, Sweden, December 2011. [Google Scholar]
  12. Cheng, Y.; Zhao, H. Fault detection and diagnosis for railway switching points using fuzzy neural network. In Proceedings of the 10th Conference on Industrial Electronics and Applications (ICIEA), Auckland, New Zealand, 15–17 June 2015; pp. 860–865. [Google Scholar]
  13. Silmon, J.A.; Roberts, C. Improving railway switch system reliability with innovative condition monitoring algorithms. Proc. Inst. Mech. Eng. Part F J. Rail Rapid Transit 2010, 224, 293–302. [Google Scholar] [CrossRef]
  14. Cornish, A.T. Life-Time Monitoring of In Service Switches and Crossings Through Field Experimentation. Ph.D. Thesis, Imperial College London, London, UK, May 2014. [Google Scholar]
  15. Asada, T.; Roberts, C. Improving the dependability of DC point machines with a novel condition monitoring system. Proc. Inst. Mech. Eng. Part F J. Rail Rapid Transit 2013, 227, 322–332. [Google Scholar] [CrossRef]
  16. Márquez, F.P.G.; Roberts, C.; Tobias, A.M. Railway point mechanisms: Condition monitoring and fault detection. Proc. Inst. Mech. Eng. Part F J. Rail Rapid Transit 2010, 224, 35–44. [Google Scholar] [CrossRef]
  17. McHutchon, M.A.; Staszewski, W.J.; Schmid, F. Signal processing for remote condition monitoring of railway points. Strain 2005, 41, 71–85. [Google Scholar] [CrossRef]
  18. Shih, J.Y.; Hemida, H.; Stewart, E.; Roberts, C. Understanding the impact of train run-throughs on railway switches using finite element analysis. Proc. IMechE Part F J. Rail Rapid Transit 2019, 233, 359–369. [Google Scholar] [CrossRef]
  19. Cope, D.L. British Railway Track: Volume 1, Switches and Crossings; Permanent Way Institution: Warley, Brentwood, UK, 2009. [Google Scholar]
  20. Wright, N.; Bemment, S.; Ward, C.; Dixon, R. A model of a REPOINT track switch for control. In Proceedings of the 2014 UKACC International Conference on Control, CONTROL, Loughborough, UK, 9–11 July 2014; pp. 549–554. [Google Scholar]
  21. Bemment, S.; Dixon, R.; Goodall, R.; Brown, S. Redundantly engineered track switching for enhanced railway nodal capacity. IFAC Proc. Vol. 2013, 46, 25–30. [Google Scholar] [CrossRef]
  22. IRSE. Minor Railways Section Guideline on Mechanically Operated Points. Technical Report. Available online: http://www.irse.org/minorrailways/publicdocuments/PA01-Mechanically Operated Points v2.pdf (accessed on 21 August 2019).
  23. Márquez, F.P.G.; Schmid, F.; Collado, J.C. A reliability centered approach to remote condition monitoring: A railway points case study. Reliab. Eng. Syst. Safe. 2003, 80, 33–40. [Google Scholar]
  24. Márquez, F.P.G.; Schmid, F.; Collado, J.C. Wear assessment employing remote condition monitoring: A case study. Wear 2003, 255, 1209–1220. [Google Scholar] [CrossRef]
  25. Chen, J.; Roberts, C. Effective condition monitoring of line side assets. In Proceedings of the 2006 IET International Conference on Railway Condition Monitoring, Birmingham, UK, 29–30 November 2006; pp. 78–83. [Google Scholar]
  26. Zattoni, E. Detection of incipient failures by using an H2-norm criterion: Application to railway switching points. Control Eng. Prac. 2006, 14, 885–895. [Google Scholar] [CrossRef]
  27. Márquez, F.P.G.; Schmid, F. A digital filter-based approach to the remote condition monitoring of railway turnouts. Reliab. Eng. Syst. Saf. 2007, 92, 830–840. [Google Scholar] [CrossRef]
  28. Zhou, F.; Archer, N.; Bowles, J.; Duta, M.; Henry, M.; Tombs, M.; Zamora, M.; Baker, S.; Burton, C. Remote condition monitoring and validation of railway points. Comput. Control Eng. J. 2002, 13, 221–230. [Google Scholar] [CrossRef]
  29. Pabst, M. Remote monitoring of points based on effective power dissipation. In Proceedings of the IEE Seminar on Condition Monitoring for Rail Transport Systems (Ref. No. 1998/501), London, UK, 10 November 1998. [Google Scholar]
  30. Ovali, O. Comparison of Constructional Aspects of Different Railway Point Machines. Ph.D. Thesis, Middle East Technical University, Ankara, Turkey, January 2019. [Google Scholar]
  31. Igarashi, Y.; Siomi, S. Development of monitoring system for electric switch machine. Q. Rep. RTRI 2006, 47, 78–82. [Google Scholar] [CrossRef]
  32. Asada, T.; Roberts, C.; Koseki, T. An algorithm for improved performance of railway condition monitoring equipment: Alternating-current point machine case study. Transport. Res. C Emerg. Technol. 2013, 30, 81–92. [Google Scholar] [CrossRef]
  33. Siemens AG. Switchguard Surelock Points Drive System [Brochure]. Available online: https://www.mobility.siemens.com/mobility/global/SiteCollectionDocuments/en/rail-solutions/rail-automation/signaling-components/switchguard-surelock-en.pdf (accessed on 19 August 2019).
  34. IAD Rail Systems. High Performance Switch System, Powered by the High Performance Switch Actuator and the ‘Powerlink’ Backdrive; IAD Rail Systems, Claverham Ltd.: Bristol, UK, 2001. [Google Scholar]
  35. Sarmiento-Carnevali, M.L.; Harrison, T.J.; Dutta, S.; Ward, C.P.; Dixon, R. On the development of a full-scale REPOINT Light track switch. In Proceedings of the 8th International Conference on Railway Engineering (ICRE 2018), London, UK, 16–17 May 2018. [Google Scholar]
  36. Kaijuka, P.L.; Dixon, R.; Ward, C.P.; Dutta, S.; Bemment, S. Model-based controller design for a lift-and-drop railway track switch actuator. IEEE/ASME Trans. Mechatron. 2019. [Google Scholar] [CrossRef]
  37. Thales Transportation Systems GmbH. Point Machine L710H [Brochure]. Available online: https://myproducts-thales.com/brochures-documents/812-leaflet-point-machine-l710h/file (accessed on 20 August 2019).
  38. Bemment, S.D. Improving the Performance of Railway Track-Switching Through the Introduction of Fault Tolerance. Ph.D. Thesis, Loughborough University, Loughborough, UK, July 2018. [Google Scholar]
  39. Voestalpine Signaling Zeltweg GmbH. Switching Systems Standard AH950 [Brochure]. Available online: https://www.voestalpine.com/signaling/static/sites/signaling/.downloads/produkte/ah950-weichenantrieb/voestalpine_signaling_ah950_pointmachine_switchmachine.pdf (accessed on 20 August 2019).
  40. Dutta, S.; Harrison, T.J.; Sarmiento-Carnevali, M.L.; Ward, C.P.; Dixon, R. Modelling and controller design for self-adjusting railway track switch system. In Proceedings of the 7th Transport Research Arena (TRA), Vienna, Ausatria, 16–19 April 2018. [Google Scholar]
  41. Bemment, S.D.; Dixon, R.; Goodall, R. An evaluation of redundancy concepts for fault tolerant railway track switching. IFAC Proc. Vol. 2012, 8, 763–769. [Google Scholar] [CrossRef]
  42. Shih, J.Y.; Hemida, H.; Stewart, E.; Roberts, C.; Dixon, R.; Ward, C.P. A conceptual design for a new railway switch and crossing system. In Proceedings of the Fourth International Conference on Railway Technology: Research, Development and Maintenance, Barcelona, Spain, 3–7 September 2018. [Google Scholar]
  43. Oyebande, B.O.; Renfrew, A.C. Condition monitoring of railway electric point machines. IEE Proc. Elec. Power Appl. 2002, 149, 465–473. [Google Scholar] [CrossRef]
  44. Zhou, F.B.; Duta, M.D.; Henry, M.P.; Baker, S.; Burton, C. Remote condition monitoring for railway point machine. In Proceedings of the ASME/IEEE Joint Railroad Conference, Washington, DC, USA, 23–25 April 2002; pp. 103–108. [Google Scholar]
  45. Zhou, F.; Duta, M.; Henry, M.; Baker, S.; Burton, C. Condition monitoring and validation of railway point machines. In Proceedings of the ASME/IEEE Joint Railroad Conference, Washington, DC, USA, 19 April 2001; pp. 6/1–6/7. [Google Scholar]
  46. Institution of Railway Signal Engineers. On Mechanically Operated Points, Minor Railways Section Guideline PA01 Issue 2.0, Mechanically Operated Points Periodic Review; IRSE: London, UK, 2013. [Google Scholar]
  47. Rusu, M.F. Automation of Railway Switch and Crossing Inspection. Ph.D. Thesis, University of Birmingham, Birmingham, UK, December 2015. [Google Scholar]
  48. Rail Safety and Standards Board. Formal Inquiry: Derailment of Train 1T60, 1245 hrs Kings Cross to Kings Lynn at Potters Bar on 10 May 2002, Appendix; RSSB: London, UK, 2005; pp. 1–164. [Google Scholar]
  49. Baysari, M.T.; McIntosh, A.S.; Wilson, J.R. Understanding the human factors contribution to railway accidents and incidents in Australia. Accid. Anal. Prev. 2008, 40, 1750–1757. [Google Scholar] [CrossRef]
  50. Minde, S.I.; Jorg, L. Switch Rolling System BWG-S—Voestalpine BWG GmbH. Available online: https://www.voestalpine.com/bwg/en/products/Switch-Rolling-System-BWG-S/ (accessed on 19 August 2019).
  51. Bemment, S.D.; Goodall, R.M.; Dixon, R.; Ward, C.P. Improving the reliability and availability of railway track switching by analysing historical failure data and introducing functionally redundant subsystems. Proc. Inst. Mech. Eng. Part F J. Rail Rapid Transit 2018, 232, 1407–1424. [Google Scholar] [CrossRef]
  52. Zwanenburg, W.J. The Swiss experience on the wear of railway switches & crossings. In Proceedings of the 7th Swiss Transport Research Conference, Monte Verità/Ascona, Switzerland, 12–14 September 2007. [Google Scholar]
  53. Rail Accident Investigation Branch. Rail Accident Report; RAIB: Derby, UK, 2008.
  54. Kande, M.; Isaksson, A.J.; Thottappillil, R.; Taylor, N. Rotating electrical machine condition monitoring automation—A review. Machines 2017, 5, 24. [Google Scholar] [CrossRef]
  55. Hamadache, M.; Lee, D.; Veluvolu, K.C. Rotor speed-based bearing fault diagnosis (RSB-BFD) under variable speed and constant load. IEEE Trans. Ind. Electro. 2015, 62, 6486–6495. [Google Scholar] [CrossRef]
  56. Isermann, R. Fault-Diagnosis Systems; Springer: Berlin, Germany, 2006; p. 20. [Google Scholar]
  57. Venkatasubramanian, V. A review of process fault detection and diagnosis Part I: Quantitative model-based methods. Comput. Chem. Eng. 2003, 27, 293–311. [Google Scholar] [CrossRef]
  58. Venkatasubramanian, V. A review of process fault detection and diagnosis Part II: Qualitative models and search strategies. Comput. Chem. Eng. 2003, 27, 313–326. [Google Scholar] [CrossRef]
  59. Venkatasubramanian, V. A review of process fault detection and diagnosis Part III: Process history based methods. Comput. Chem. Eng. 2003, 27, 327–346. [Google Scholar] [CrossRef]
  60. Kassa, E.; Nielsen, J.C.O. Dynamic interaction between train and railway turnout: Full-scale field test and validation of simulation models. Veh. Syst. Dyn. 2008, 46, 521–534. [Google Scholar] [CrossRef]
  61. Lagos, R.F.; Alonso, A.; Vinolas, J.; Pérez, X. Rail vehicle passing through a turnout: Analysis of different turnout designs and wheel profiles. Proc. Inst. Mech. Eng. Part F J. Rail Rapid Transit 2012, 226, 587–602. [Google Scholar] [CrossRef]
  62. Guo, S.L.; Sun, D.Y.; Zhang, F.C.; Feng, X.Y.; Qian, L.H. Damage of a Hadfield steel crossing due to wheel rolling impact passages. Wear 2013, 305, 267–273. [Google Scholar] [CrossRef]
  63. Pålsson, B.A. Optimisation of Railway Switches and Crossings. Ph.D. Thesis, Chalmers University of Technology, Göteborg, Sweden, February 2014. [Google Scholar]
  64. Dos Santos, G.F.M.; Barbosa, R.S. Modeling of a railway vehicle travelling through a turnout. Proc. Inst. Mech. Eng. Part F J. Rail Rapid Transit 2016, 230, 1397–1404. [Google Scholar] [CrossRef]
  65. Wiedorn, J.; Daves, W.; Ossberger, U.; Ossberger, H.; Pletz, M. Simplified explicit finite element model for the impact of a wheel on a crossing: Validation and parameter study. Tribol. Int. 2017, 111, 254–264. [Google Scholar] [CrossRef]
  66. Wiedorn, J.; Daves, W.; Ossberger, U.; Ossberger, H.; Pletz, M. Finite element model for predicting the initiation of subsurface damage in railway crossings: A parametric study. Proc. Inst. Mech. Eng. Part F J. Rail Rapid Transit 2018, 233, 614–628. [Google Scholar] [CrossRef]
  67. Wiedorn, J.; Daves, W.; Ossberger, U.; Ossberger, H.; Pletz, M. Numerical assessment of materials used in railway crossings by predicting damage initiation: Validation and application. Wear 2018, 414–415, 136–150. [Google Scholar] [CrossRef]
  68. Sun, Y.Q.; Colea, C.; Boyd, P. A numerical method using VAMPIRE modelling for prediction of turnout curve wheel–rail wear. Wear 2011, 271, 482–491. [Google Scholar] [CrossRef]
  69. Xiao, J.; Zhang, F.; Qian, L. Numerical simulation of stress and deformation in a railway crossing. Eng. Fail. Anal. 2011, 18, 2296–2304. [Google Scholar] [CrossRef]
  70. Johansson, A.; Pålsson, B.; Ekh, M.; Nielsen, J.C.O.; Ander, M.K.A.; Brouzoulis, J.; Kassa, E. Simulation of wheel–rail contact and damage in switches & crossings. Wear 2011, 271, 472–481. [Google Scholar]
  71. Xin, L.; Markine, V.L.; Shevtsov, I.Y. Numerical analysis of rolling contact fatigue crack initiation and fatigue life prediction of the railway crossing. In Proceedings of the 10th International Conference on Contact Mechanics CM2015, Colorado Springs, CO, USA, 30 August–3 September 2015. [Google Scholar]
  72. Nielsen, J.C.O.; Pålsson, B.A.; Torstensson, P.T. Switch panel design based on simulation of accumulated rail damage in a railway turnout. Wear 2016, 366–367, 241–248. [Google Scholar] [CrossRef]
  73. Kolitsch, S.; Gänsera, H.; Pippan, R. Damage tolerance concepts for railway switch components. Struct. Integ. Procedia 2017, 4, 95–105. [Google Scholar] [CrossRef]
  74. Márquez, F.P.G.; Tercero, D.J.P.; Schmid, F. Unobserved component models applied to the assessment of wear in railway points: A case study. Eur. J. Oper. Res. 2007, 176, 1703–1712. [Google Scholar] [CrossRef]
  75. Wang, G.; Xu, T.; Tang, T.; Yuan, T.; Wang, H. A Bayesian network model for prediction of weather-related failures in railway turnout systems. Expert Syst. Appl. 2017, 69, 247–256. [Google Scholar] [CrossRef]
  76. Hamadache, M.; Dutta, S.; Ambur, R.; Olaby, O.; Stewart, E.; Dixon, R. Residual-based fault detection method: Application to railway switch & crossing (S&C) system. In Proceedings of the 19th International Conference on Control, Automation and Systems (ICCAS 2019), ICC Jeju, Jeju, Korea, 15–18 October 2019. in press. [Google Scholar]
  77. Liu, X. High speed switch switching equipment problems and their solutions. Pop. Sci. Technol. 2006, 2, 126–127. [Google Scholar]
  78. Feng, L. Analysis of speed-up switch faults through current curve on microcomputer monitoring system. Railw. Signal. Commun. Eng. 2011, 1, 73–75. [Google Scholar]
  79. Xue, F. Find hidden trouble of high speed switch and diagnose the faults using the microcomputer monitoring. Shanghai Railw. Sci. Technol. 2011, 4, 48–49. [Google Scholar]
  80. Shi, Z.; Liu, Z.; Lee, J. An auto-associative residual based approach for railway point system fault detection and diagnosis. Measurement 2018, 119, 246–258. [Google Scholar] [CrossRef]
  81. Hines, J.W.; Seibert, R.; Usynin, A. Technical Review of On-Line Monitoring Techniques for Performance Assessment; United States Nuclear Regulatory Commission: Rockville, MD, USA, 2016; Volume 2. [Google Scholar]
  82. Güçlü, A.; Yılboga, H.; Eker, O.F.; Camci, F.; Jennions, I. Prognostics with autoregressive moving average for railway turnouts. In Proceedings of the Annual Conference of the Prognostics and Health Management Society, Portland, OR, USA, 10–16 October 2010. [Google Scholar]
  83. Sobhani-Tehrani, E.; Khorasani, K. Fault Diagnosis of Nonlinear Systems Using a Hybrid Approach, Lecture Notes in Control and Information Sciences; Springer: New York, NY, USA, 2009; p. 39. [Google Scholar]
  84. Hamadache, M.; Jung, J.H.; Park, J.; Youn, B.D. A comprehensive review of artificial intelligence-based approaches for rolling element bearing PHM: Shallow & deep learning. JMST Adv. 2019, 1, 125–151. [Google Scholar] [CrossRef] [Green Version]
  85. Hamadache, M.; Lee, D.; Mucchi, E.; Dalpiaz, G. Vibration-based bearing fault detection and diagnosis via image recognition technique under constant and variable speed conditions. Appl. Sci. 2018, 8, 1392. [Google Scholar] [CrossRef] [Green Version]
  86. Adachi, H.; Kikuchi, M.; Watanabe, Y. Electric switch machine failure detection using data-mining technique. Q. Rep. RTRI 2006, 47, 182–186. [Google Scholar] [CrossRef]
  87. Márquez, F.P.G.; Pedregal, D.J. Applied RCM2 algorithms based on statistical methods. Int. J. Autom. Comput. 2007, 4, 109–116. [Google Scholar] [CrossRef]
  88. Zoll, A.; Luke, D. Diagnosis and State Monitoring of Junctions, Crossings, Cross Roads or Rail Joints by Means of a Rail Vehicle. US Patent N. US 7,539,596 B2, 4 March 2010. [Google Scholar]
  89. Atamuradov, V.; Camci, F.; Baskan, S.; Sevkli, M. Failure diagnostics for railway point machines using expert systems. In Proceedings of the 2009 IEEE International Symposium on Diagnostics for Electric Machines, Power Electronics and Drives, Cargese, France, 31 August–3 September 2009. [Google Scholar]
  90. Eker, O.F.; Camci, F.; Kumar, U. Failure diagnostics on railway turnout systems using support vector machines. In Proceedings of the 1st International Workshop and Congress on eMaintenance, Luleå, Sweden, 22–24 June 2010; pp. 22–24. [Google Scholar]
  91. Kaewunruen, S. Monitoring structural deterioration of railway turnout systems via dynamic wheel/rail interaction. Case Stud. Nondestr. Test. Eval. 2014, 1, 19–24. [Google Scholar] [CrossRef] [Green Version]
  92. Wei, Z.; Núñez, A.; Li, Z.; Dollevoet, R. Evaluating degradation at railway crossings using axle box acceleration measurements. Sensors 2017, 17, 2236. [Google Scholar] [CrossRef] [Green Version]
  93. Márquez, G.F.P.; Pedregal, D.J.; Roberts, C. Time series methods applied to failure prediction and detection. Reliab. Eng. Syst. Safe. 2010, 95, 698–703. [Google Scholar]
  94. Ardakani, H.D.; Lucas, C.; Siegel, D.; Chang, S.; Dersin, P.; Bonnet, B.; Lee, J. PHM for railway system—A case study on the health assessment of the point machines. In Proceedings of the 2012 IEEE Conference on Prognostics and Health Management, Detroit, MI, USA, 8–10 June 2012. [Google Scholar]
  95. Bolbolamiri, N.; Sanai, M.S.; Mirabadi, A. Time-domain stator current condition monitoring: Analyzing point failures detection by Kolmogorov-Smirnov (K-S) test. WASET Int. J. Elec. Comp. Eng. 2012, 6, 587–592. [Google Scholar]
  96. Vileiniskis, M.; Remenyte-Prescott, R.; Rama, D. A fault detection method for railway point systems. Proc. Inst. Mech. Eng. Part F J. Rail Rapid Transit 2016, 230, 852–865. [Google Scholar] [CrossRef]
  97. Alessi, A.; Piero La-Cascia, P.; Lamoureux, B.; Pugnaloni, M.; Dersin, P. Health assessment of railway turnouts: A case study. In Proceedings of the Third European Conference of the Prognostics and Health Management Society, Bilbao, Spain, 5–8 July 2016. [Google Scholar]
  98. Wright, N.P.; Gan, R.; McVae, C. Software and machine learning tools for monitoring railway track switch performance. In Proceedings of the 7th IET Conference on Railway Condition Monitoring 2016 (RCM 2016), Birmingham, UK, 27–28 September 2016. [Google Scholar]
  99. Bryan, K.J.; Solomon, M.; Jensen, E.; Coley, C.; Rajan, K.; Tian, C.; Mijatovic, N.; Kiss, J.M.; Lamoureux, B.; Dersin, P.; et al. Classification of rail switch data using machine learning techniques. In Proceedings of the 2018 Joint Rail Conference, Pittsburgh, PA, USA, 18–20 April 2018. [Google Scholar]
  100. Güçlü, A.; Yilboga, H.; Eker, O.F.; Camci, F. Classification of uncertain data streams using modified k-nearest neighbor method: A case study on railway turnouts. In Proceedings of the International Symposium on Innovations in Intelligent SysTems and Applications, Kayseri, Turkey, 21–24 June 2010. [Google Scholar]
  101. Asada, T.; Roberts, C. Development of an effective condition monitoring system for AC point machines. In Proceedings of the 5th IET Conference on Railway CM and Non-Destructive Testing (RCM 2011), Derby, UK, 29–30 November 2011. [Google Scholar]
  102. Márquez, F.P.G.; Muñoz, J.M.C. A pattern recognition and data analysis method for maintenance management. Int. J. Syst. Sci. 2012, 43, 1014–1028. [Google Scholar] [CrossRef]
  103. Böhm, T. Accuracy improvement of condition diagnosis of railway switches via external data integration. In Proceedings of the 6th European Workshop on Structural Health Monitoring, German Aerospace Center, Institute of Transportation Systems, Braunschweig, Germany, 3–6 July 2012. [Google Scholar]
  104. Eker, O.F.; Camci, F.; Kumar, U. SVM based diagnostics on railway turnouts. Int. J. Perform. Eng. 2012, 8, 289–298. [Google Scholar]
  105. Mo, X.; Fang, Y.; Yang, Y. Method on the fault detection and diagnosis for the railway turnout based on the current curve of switch machine. Appl. Mech. Mater. 2013, 427–429, 1022–1027. [Google Scholar] [CrossRef]
  106. Zhang, K.; Du, K.; Ju, Y. Algorithm of railway turnout fault detection based on PNN neural network. In Proceedings of the Seventh International Symposium on Computational Intelligence and Design, Hangzhou, China, 14–15 December 2014; pp. 545–547. [Google Scholar] [CrossRef]
  107. Zhang, K. The railway turnout fault diagnosis algorithm based on BP neural network. In Proceedings of the 2014 IEEE International Conference on Control Science and Systems Engineering, Yantai, China, 29–30 December 2014; pp. 135–138. [Google Scholar] [CrossRef]
  108. Jin, W.; Shi, Z.; Siegel, D.; Dersin, P.; Douziech, C.; Pugnaloni, M.; Cascia, P.L.; Lee, J. Development and evaluation of health monitoring techniques for railway point machines. In Proceedings of the 2015 IEEE Conference on Prognostics and Health Management (PHM), Austin, TX, USA, 22–25 June 2015. [Google Scholar] [CrossRef]
  109. Lee, J.; Choi, H.; Park, D.; Chung, Y.; Kim, H.; Yoon, S. Fault detection and diagnosis of railway point machines by sound analysis. Sensors 2016, 16, 549. [Google Scholar] [CrossRef] [Green Version]
  110. Zhou, F.; Xia, L.; Dong, W.; Sun, X.; Yan, X.; Zhao, Q. Fault diagnosis of high-speed railway turnout based on support vector machine. In Proceedings of the 2016 IEEE International Conference on Industrial Technology (ICIT), Taipei, Taiwan, 14–17 March 2016; pp. 1539–1544. [Google Scholar] [CrossRef]
  111. Kim, H.; Sa, J.; Chung, Y.; Park, D.; Yoon, S. Fault diagnosis of railway point machines using dynamic time warping. Electron. Lett. 2016, 52, 818–819. [Google Scholar] [CrossRef] [Green Version]
  112. Kollment, W.; O’Leary, P.; Harker, M.; Oßberger, U.; Eck, S. Towards condition monitoring of railway points: Instrumentation, measurement and signal processing. In Proceedings of the IEEE International Instrumentation and Measurement Technology Conference (I2MTC), Taipei, Taiwan, 20–23 May 2016; pp. 612–617. [Google Scholar] [CrossRef]
  113. Oßberger, U.; Kollment, W.; Eck, S. Insights towards condition monitoring of fixed railway crossings. Procedia Struct. Integ. 2017, 4, 106–114. [Google Scholar] [CrossRef]
  114. Huang, S.; Zhang, F.; Yu, R.; Chen, W.; Hu, F.; Dong, D. Turnout fault diagnosis through dynamic time warping and signal normalization. J. Adv. Transport. 2017, 2017, 3192967. [Google Scholar] [CrossRef] [Green Version]
  115. Ou, D.; Tang, M.; Xue, R.; Yao, H. Hybrid fault diagnosis of railway switches based on the segmentation of monitoring curves. Ekspl. Niezawodn. Maint. Reliab. 2018, 20, 514–522. [Google Scholar] [CrossRef]
  116. Huang, S.; Yang, X.; Wang, L.; Chen, W.; Zhang, F.; Dong, D. Two-stage turnout fault diagnosis based on similarity function and fuzzy c-means. Adv. Mech. Eng. 2018, 10, 1–12. [Google Scholar] [CrossRef]
  117. Ou, D.; Xue, R.; Cui, K. A data-driven fault diagnosis method for railway turnouts. Transport. Res. Rec. 2019, 2673, 448–457. [Google Scholar] [CrossRef]
  118. Hamadache, M.; Lee, D. Principal component analysis based signal-to-noise ratio improvement for inchoate faulty signals: Application to ball bearing fault detection. Int. J. Control Autom. Syst. 2017, 15, 506–517. [Google Scholar] [CrossRef]
  119. Hamadache, M.; Lee, D. Improving signal-to-noise ratio (SNR) for inchoate fault detection based on principal component analysis (PCA). In Proceedings of the 14th International Conference on Control, Automation and Systems (ICCAS 2014), KINTEX, Seoul, South Korea, 22–25 October 2014; pp. 561–566. [Google Scholar]
  120. Matei, I.; Kleer, J.D.; Feldman, A.; Zhenirovskyy, M.; Rai, R. Classification based diagnosis: Integrating partial knowledge of the physical system. In Proceedings of the Annual Conference of the PHM Society 2019, Scottsdale, AZ, USA, 21–26 September 2019. [Google Scholar]
  121. Yilboga, H.; Eker, Ö.F.; Güçlü, A.; Camci, F. Failure prediction on railway turnouts using time delay neural networks. In Proceedings of the 2010 IEEE International Conference on Computational Intelligence for Measurement Systems and Applications, Taranto, Italy, 28 October 2010. [Google Scholar] [CrossRef]
  122. Eker, O.F.; Camci, F.; Güçlü, A.; Yilboga, H.; Sevkli, M.; Baskan, S. A simple state-based prognostic model for railway turnout systems. IEEE Trans. Ind. Electron. 2011, 58, 1718–1726. [Google Scholar] [CrossRef] [Green Version]
  123. Maulik, U.; Bandyopadhyay, S. Performance evaluation of some clustering algorithms and validity indices. IEEE Trans. Pattern Anal. Mach. Intell. 2002, 24, 1650–1654. [Google Scholar] [CrossRef]
  124. Eker, O.F.; Camcia, F. State-based prognostics with state duration information. Qual. Reliab. Eng. Int. 2013, 29, 465–476. [Google Scholar] [CrossRef]
  125. Letot, C.; Dersin, P.; Pugnaloni, M.; Dehombreux, P.; Fleurquin, G.; Douziech, C.; La-Cascia, P. A data driven degradation-based model for the maintenance of turnouts: A case study. IFAC PapersOnLine 2015, 48, 958–963. [Google Scholar] [CrossRef]
  126. Marugán, A.P.; Márquez, F.P.G. A novel approach to diagnostic and prognostic evaluations applied to railways: A real case study. Proc. Inst. Mech. Eng. Part F J. Rail Rapid Transit 2016, 230, 1440–1456. [Google Scholar] [CrossRef]
  127. Camci, F.; Eker, O.F.; Baskan, S.; Konur, S. Comparison of sensors and methodologies for effective prognostics on railway turnout systems. Proc. Inst. Mech. Eng. Part F J. Rail Rapid Transit 2016, 230, 24–42. [Google Scholar] [CrossRef]
  128. Böhm, T. Remaining useful life prediction for railway switch engines using classification techniques. Int. J. Progn. Health Manag. 2017, 8, 1–15. [Google Scholar]
  129. Márquez, F.P.G.; Pliego, A.; Lorente, J.; Trapero, J. A new ranking approach for decision making in maintenance management. Lect. Notes Electr. Eng. 2014, 241, 27–38. [Google Scholar]
  130. Atamuradov, V.; Medjaher, K.; Camci, F.; Dersin, P.; Zerhouni, N. Degradation-level assessment and online prognostics for sliding chair failure on point machines. IFAC PapersOnLine 2018, 51, 208–213. [Google Scholar] [CrossRef]
  131. Sysyn, M.; Nabochenko, O.; Kovalchuk, V.; Gruen, D.; Pentsak, A. Improvement of inspection system for common crossings by track side monitoring and prognostics. Struct. Monit. Maint. 2019, 6, 219–235. [Google Scholar]
  132. REPOINT: Innovative Rail Track Switching Technology with the Potential to Improve Reliability and Safety, Reduce Maintenance Costs, and Boost Capacity on Rail Networks. Available online: https://www.lboro.ac.uk/enterprise/repoint/ (accessed on 29 May 2019).
Figure 1. World market regions with market volume (EUR) and market development until 2022 (%) by region [3].
Applsci 09 05129 g001
Figure 2. Overall structure of the paper.
Applsci 09 05129 g002
Figure 3. Conventional railway S&C layout.
Applsci 09 05129 g003
Figure 4. Stub-type railway track S&C layout.
Applsci 09 05129 g004
Figure 5. Schematic of actuators: (a) traditional electromechanical switch actuator, (b) hydraulic actuator.
Applsci 09 05129 g005
Figure 6. Schematic of a lift-hop-drop actuation: REPOINT light track switch.
Applsci 09 05129 g006
Figure 7. Schematic of HPSS actuator with LVDTs attached.
Applsci 09 05129 g007
Figure 8. Mechanical lock.
Applsci 09 05129 g008
Figure 9. Railway S&C system failure modes/sources.
Applsci 09 05129 g009
Figure 10. Model-based FDD method for S&C system.
Applsci 09 05129 g010
Figure 11. Framework for weather-related failure prediction in railway S&C systems [75].
Applsci 09 05129 g011
Figure 12. AAMSET-based FDD scheme [80].
Applsci 09 05129 g012
Figure 13. Data-driven FDD method for S&C system.
Applsci 09 05129 g013
Figure 14. Three phases of switch current curve under normal operation conditions (healthy) [115].
Applsci 09 05129 g014
Figure 15. Current curve for each fault type [117].
Applsci 09 05129 g015
Figure 16. Two signals with failure progression from healthy to close to failure states: (a) current signal, (b) force signal [121].
Applsci 09 05129 g016
Figure 17. Seven phases of the switch speed and power signals under normal operation condition (healthy) [125].
Applsci 09 05129 g017
Figure 18. Quantitative summary of the approach used in the reviewed articles in the field of FDD for railway S&C systems: (a) model-based, (b) data-driven.
Applsci 09 05129 g018
Figure 19. Failure mode distribution in 2009 [10].
Applsci 09 05129 g019
Figure 20. Different signals analyzed in the field of FDD for railway S&C systems.
Applsci 09 05129 g020
Figure 21. Frequency of applying signals in the field of FDD for railway S&C systems.
Applsci 09 05129 g021
Table 1. Different switch systems and their actuation mechanism and type.
Actuation MechanismActuation TypeReference
MechanicalManual[22]
ElectromechanicalHW[23,24]
P80[25,26]
Style 63[27,28]
S700K[29,30]
NTS-type[31,32]
SURELOCK[33]
High-performance switch system (HPSS)[34]
REPOINT[20,35,36]
Hydraulic/electrohydraulicL700H, L710H[37]
Clamplock[19,38]
AH90[39]
Table 2. Summary of all reviewed FDD methods for railway S&C systems.
ApproachApplicationMethod(s) UsedSignals (Sensors) AcquiredFaults Type(s) Considered
Model-based approachesFD methods [10,74,75,76]KF combined with FIS algorithm and ML approach [74]; Bayesian network model [75]; Monte Carlo simulation [75]; accumulative residual based method [76].Voltage [74,76]; force [74,76]; current [10,74,76]; weather-related data (e.g., date, min and max temperature, wind speed) [75]; motor temperature [75]; speed [76]; linear position of the switch rails [76].Slide chair-related faults (i.e., dry, contaminated, excessive friction or resistance) [74,75,76]; switch-related faults (i.e., stuck, bad contact with the base plate, idle, resistance, hard to release, cannot lock, misalignments) [75].
FDD methods [12,80]Fuzzy neural network algorithm [12]; AAR technique (i.e., AAMSET approach) [80].Current [12]; speed [80]; torque [80].Slide chair-related faults (i.e., dry, contaminated, excessive friction or resistance) [12,80]; switch-related faults (i.e., stuck, bad contact with the base plate, idle, resistance, hard to release, cannot lock, misalignments) [12,80].
FP methods [82]ARMA model [82].Voltage; force; current; tension; distance between the stock rail and switch rail; linear position of the switch rails [82].Slide chair-related faults (only contaminated slide chair fault) [82].
Data-driven approachesFD methods [86,87,88,89,90,91,92,93,94,95,96,97,98,99]SVM with Gaussian kernel [90]; OCSVM [96]; SOM technique [97]; PCA [94]; data-mining techniques [86]; harmonic regression and VARMA [93]; K-S test [95]; DTW [89]; GNB [98]; LSTM and DWST [99].Voltage [86,96]; force [87,90]; current [86,90,92,93,95,96,98]; speed [88,90]; vibration [88,94,97]; linear position of the switch rails [90]; maneuver information [96]; GPS [97]; 3D measurements [97], pressure [98].Slide chair-related faults [87,93,95]; wear in junction, crossing [88,97]; drive rod out of adjustment [89,90]; obstacles (hard or soft) [93,96]; structural deterioration [94]; crushed cables [95]; switch-related faults [86,91,92,96]; switch hard to release [98]; sensor fault [98].
FDD methods [11,13,15,28,34,100,101,102,103,104,105,106,107,108,109,110,111,112,113,114,115,116,117,120]PCA [102,117]; SVM [11,104,105,110]; SVM combined with other algorithms (e.g., PCA, envelope, etc.) [15,101,117]; wavelet transform (WT) and its variants (e.g., CWT and discrete WT (DWT)) [15,101]; DTW [111,112,114,115]; SOM [108]; backpropagation (BP) neural network (NN) [107]; probabilistic NN (PNN) [106]; 3D reconstruction [113]; k-nearest neighbor method [100]; fuzzy c-mean [116]; qualitative trend analysis (QTA) [13]; ANN [103]; BLT and NN [120].Voltage [15,100,101,104,108]; force [13,15,34,100,101,102,120]; current [13,15,28,100,101,102,103,105,106,107,108,110,111,114,115,116,117]; power [11,34,117,120]; strain signal [110,113]; switch displacement [13]; linear position of the switch rails [104]; motor temperature [108]; audio signal (sound sensor) [117]; 2D measurements [113]; speed [120].Wear in crossing [113]; switch-related faults [105,106,107,110,111,112,114,117]; slide chair-related faults [109,117]; startup circuit disconnection (bad contact) [106,107,114,115,117]; actuator is not flexible [114,115]; abnormal fluctuations [115]; electric relay switch failure [115]; mechanical jam fault [117]; abnormal impedance [117]; lack of motor lubrication [11]; overdriven and underdriven [13,15,34,101]; drive rod out of adjustment [104]; motor deblocking [107]; obstacles (hard or soft) [108,120]; left and right misaligned adjuster bolts [120]; missing bearings [120].
FP methods [121,122,124,125,126,127,128,130,131]ANN and TDNN algorithms [121]; SSBP method [122]; SBPD technique [124]; mean active power index and Monte Carlo simulation [125]; fault tree analysis (i.e., BDD approach) [126]; ANN and SVM [128]; k-mean clustering and double exponential function [130]; MODWPT, SE, and Lasso [131].Voltage [122,127]; force [121,122,124,127,130]; current [121,122,127]; linear position of the switch rails [122,127]; distance between the stock rail and switch rail [122,127]; speed [125,127]; torque [125]; power [128]; weather-related data (e.g., temperature and humidity) [128], vibration [131].Electromechanical S&C failure degradation [121,122,124,125,127,130]; electromechanical S&C failure degradation focusing on dry slide chair failure mode [122,124,127,130]; M63 point machine failure degradation [126]; S700K electromechanical engine failures [128].