Process Optimization and Modeling of Methylene Blue Adsorption Using Zero-Valent Iron Nanoparticles Synthesized from Sweet Lime Pulp


 ,
, 
Abstract
1. Introduction
2. Materials and Methods
2.1. Adsorbate
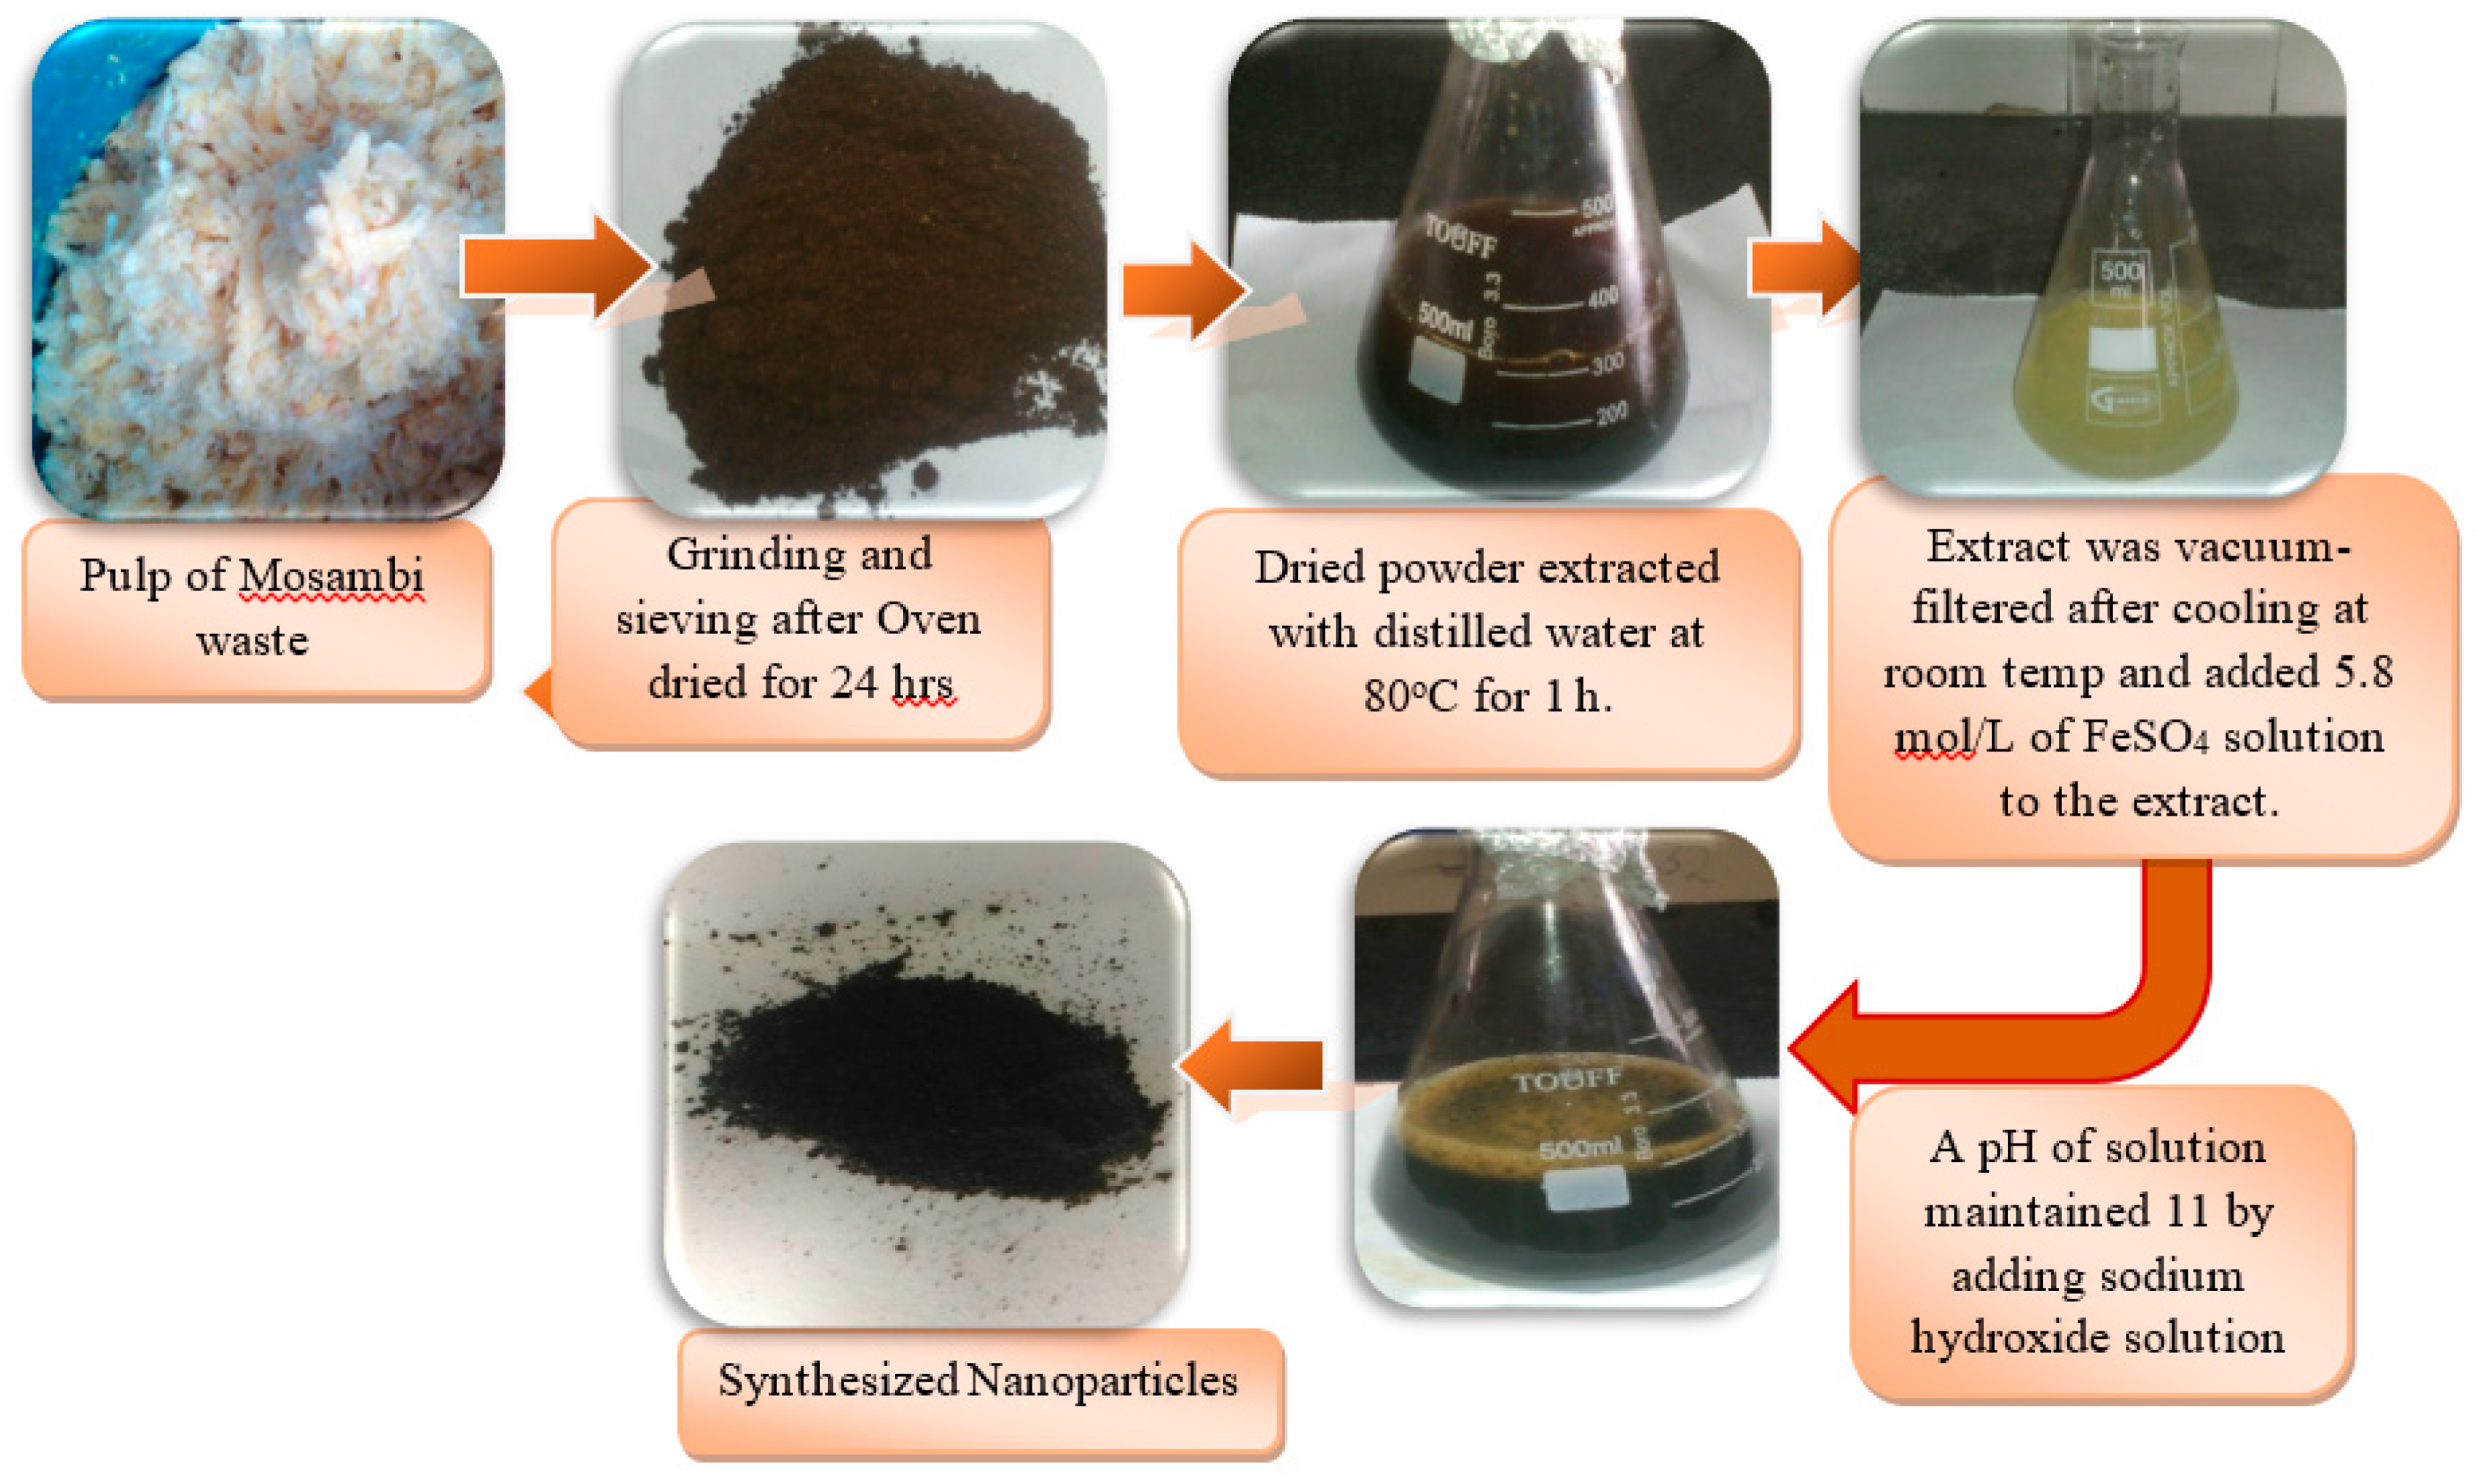
2.2. Synthesis of nZVISLP
2.3. Characterization of MB-Adsorbed nZVISLP
2.4. Adsorption Process
2.5. Isotherm and Kinetic Model Parameter Evaluation
2.5.1. Equilibrium Isotherm Models
2.5.2. Optimization Technique
2.5.3. Equilibrium Kinetic Models
3. Results and Discussion
3.1. Characterization of nZVISLP
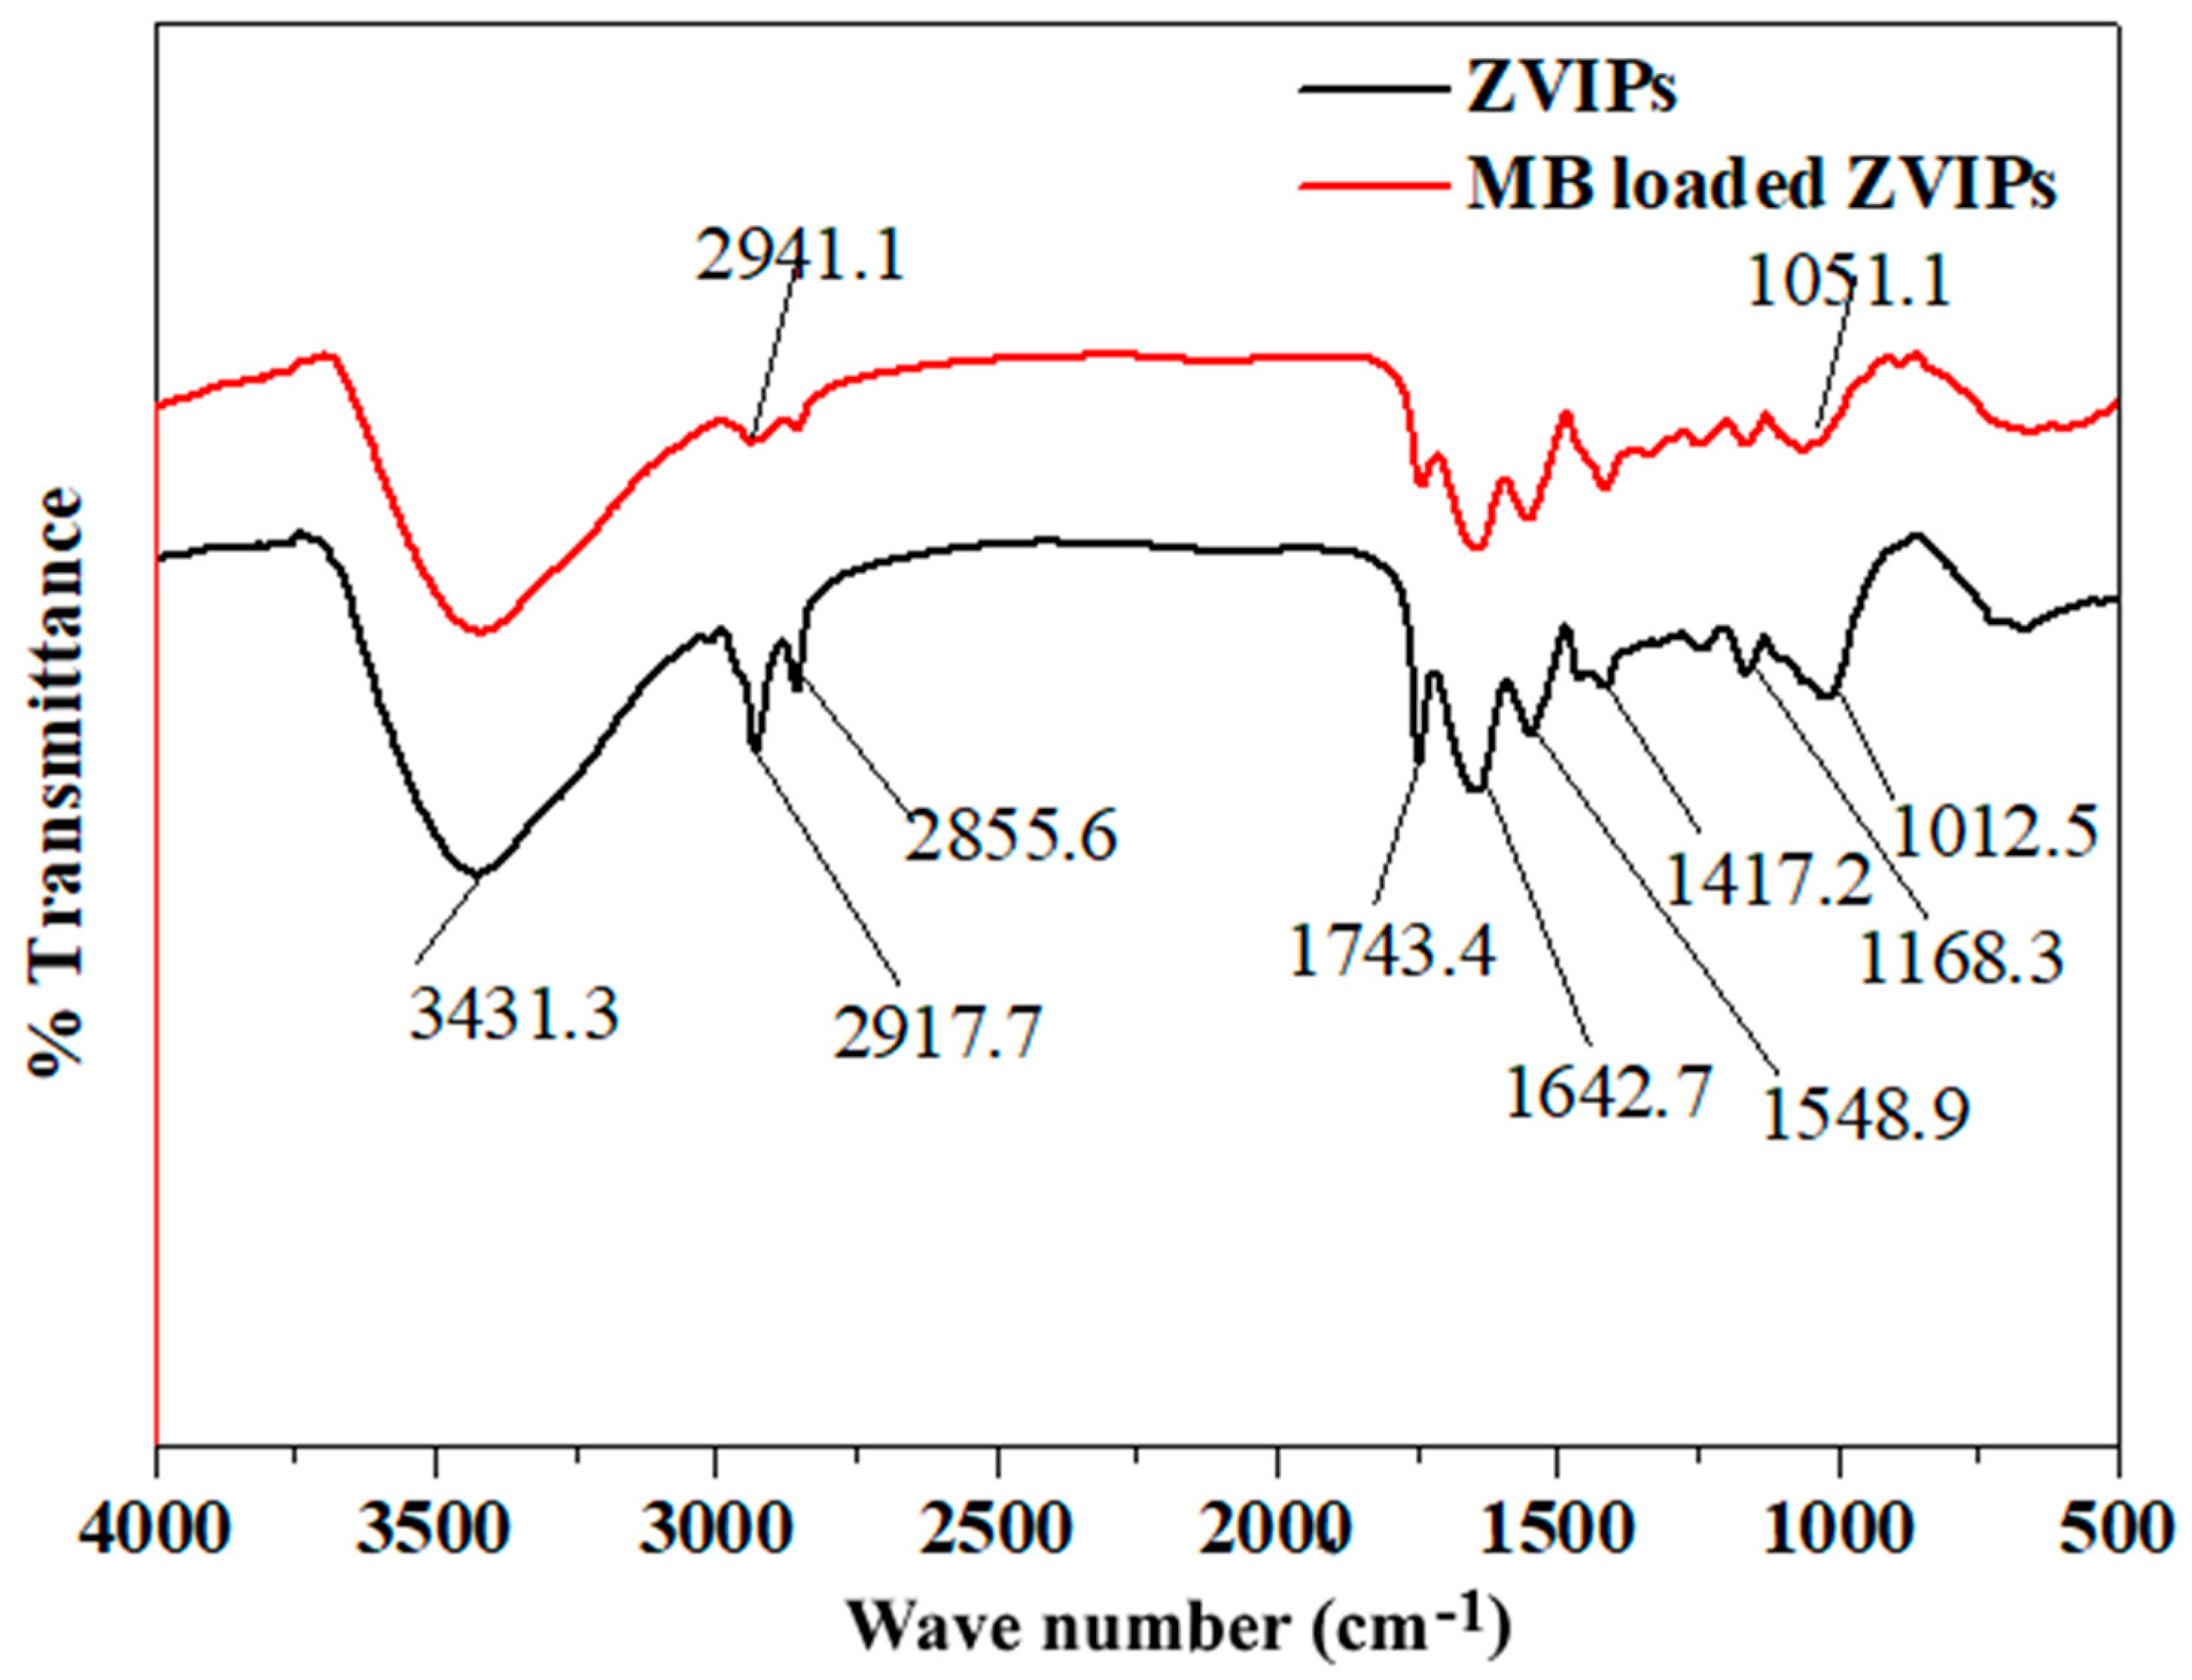
3.1.1. FT-IR
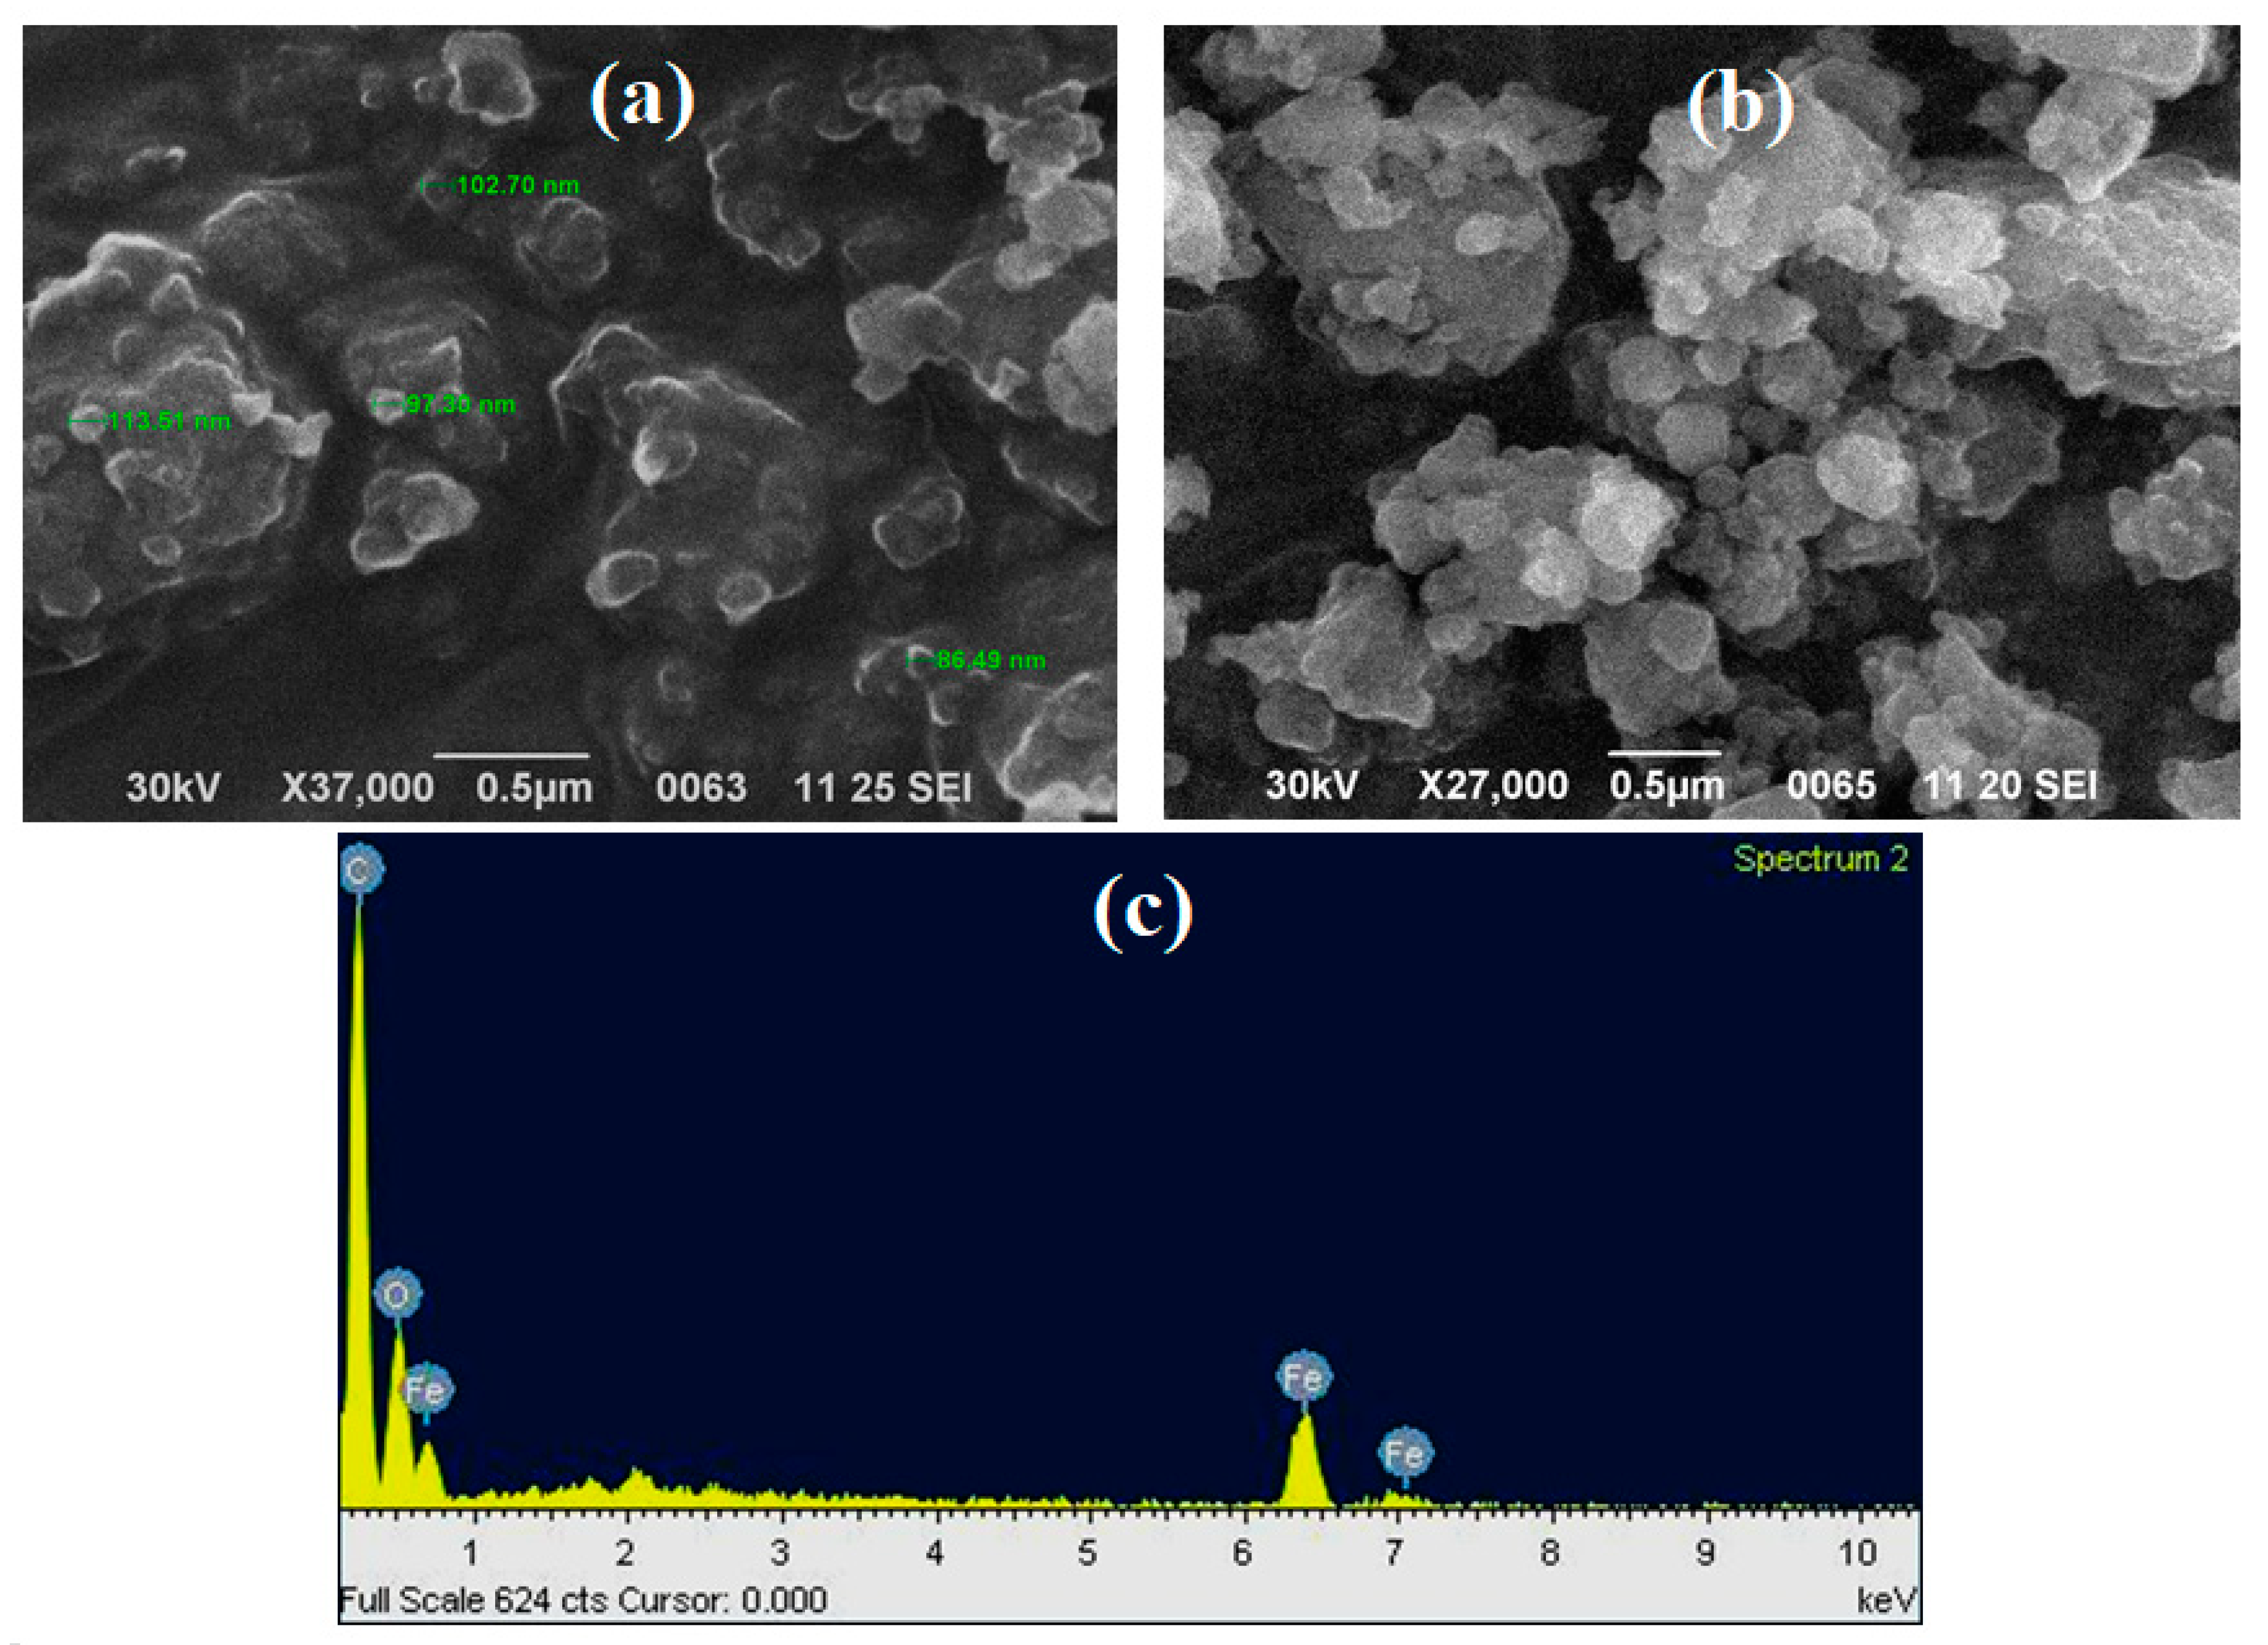
3.1.2. SEM and EDX
3.1.3. Zero-Point Charge
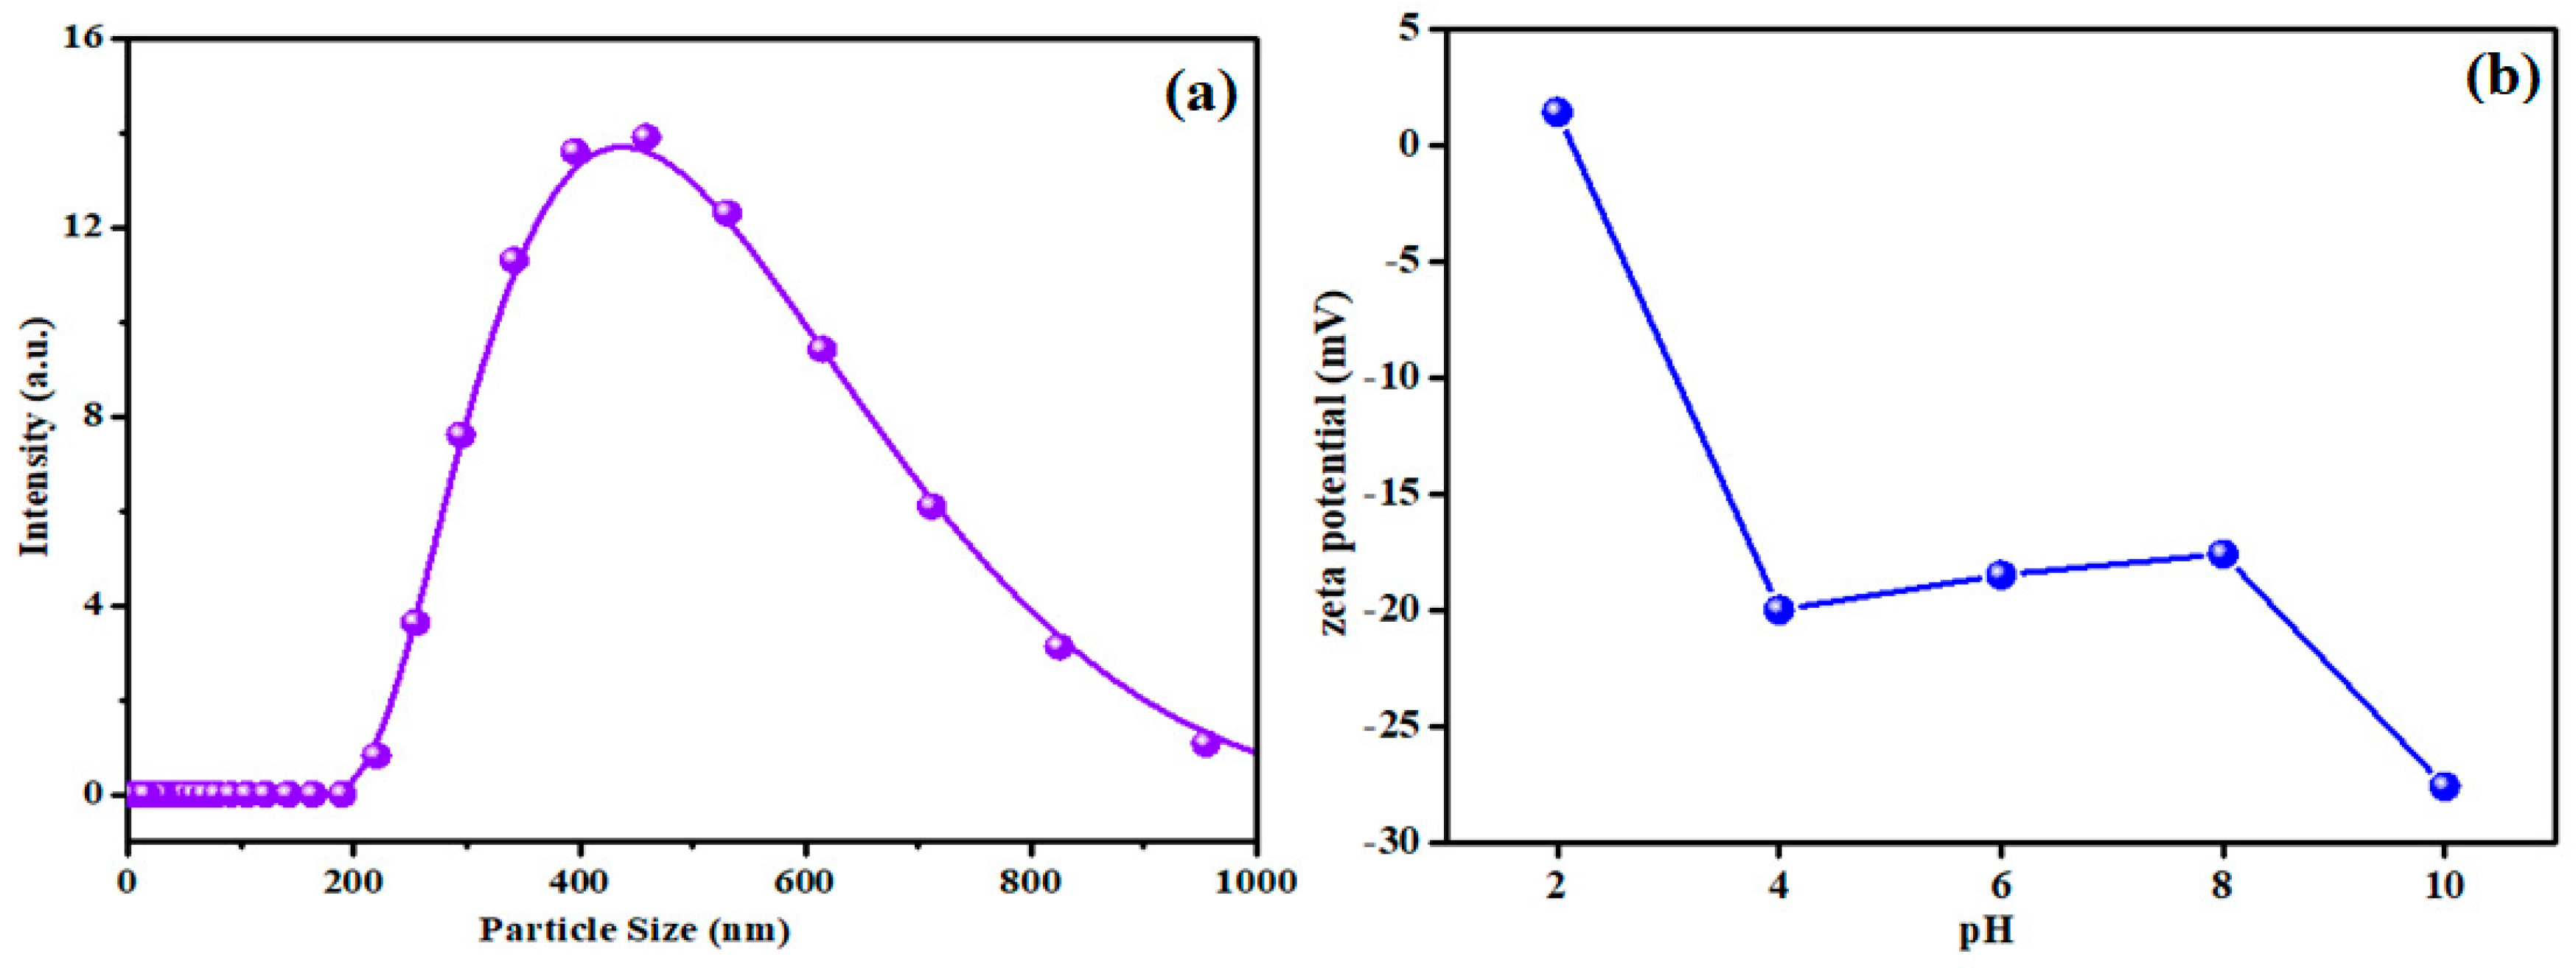
3.1.4. Particle Size and Zeta Potential Analysis
3.1.5. Determination of Porosity and Internal Structure
3.1.6. X-Ray Diffraction (XRD)
3.2. Adsorption Study
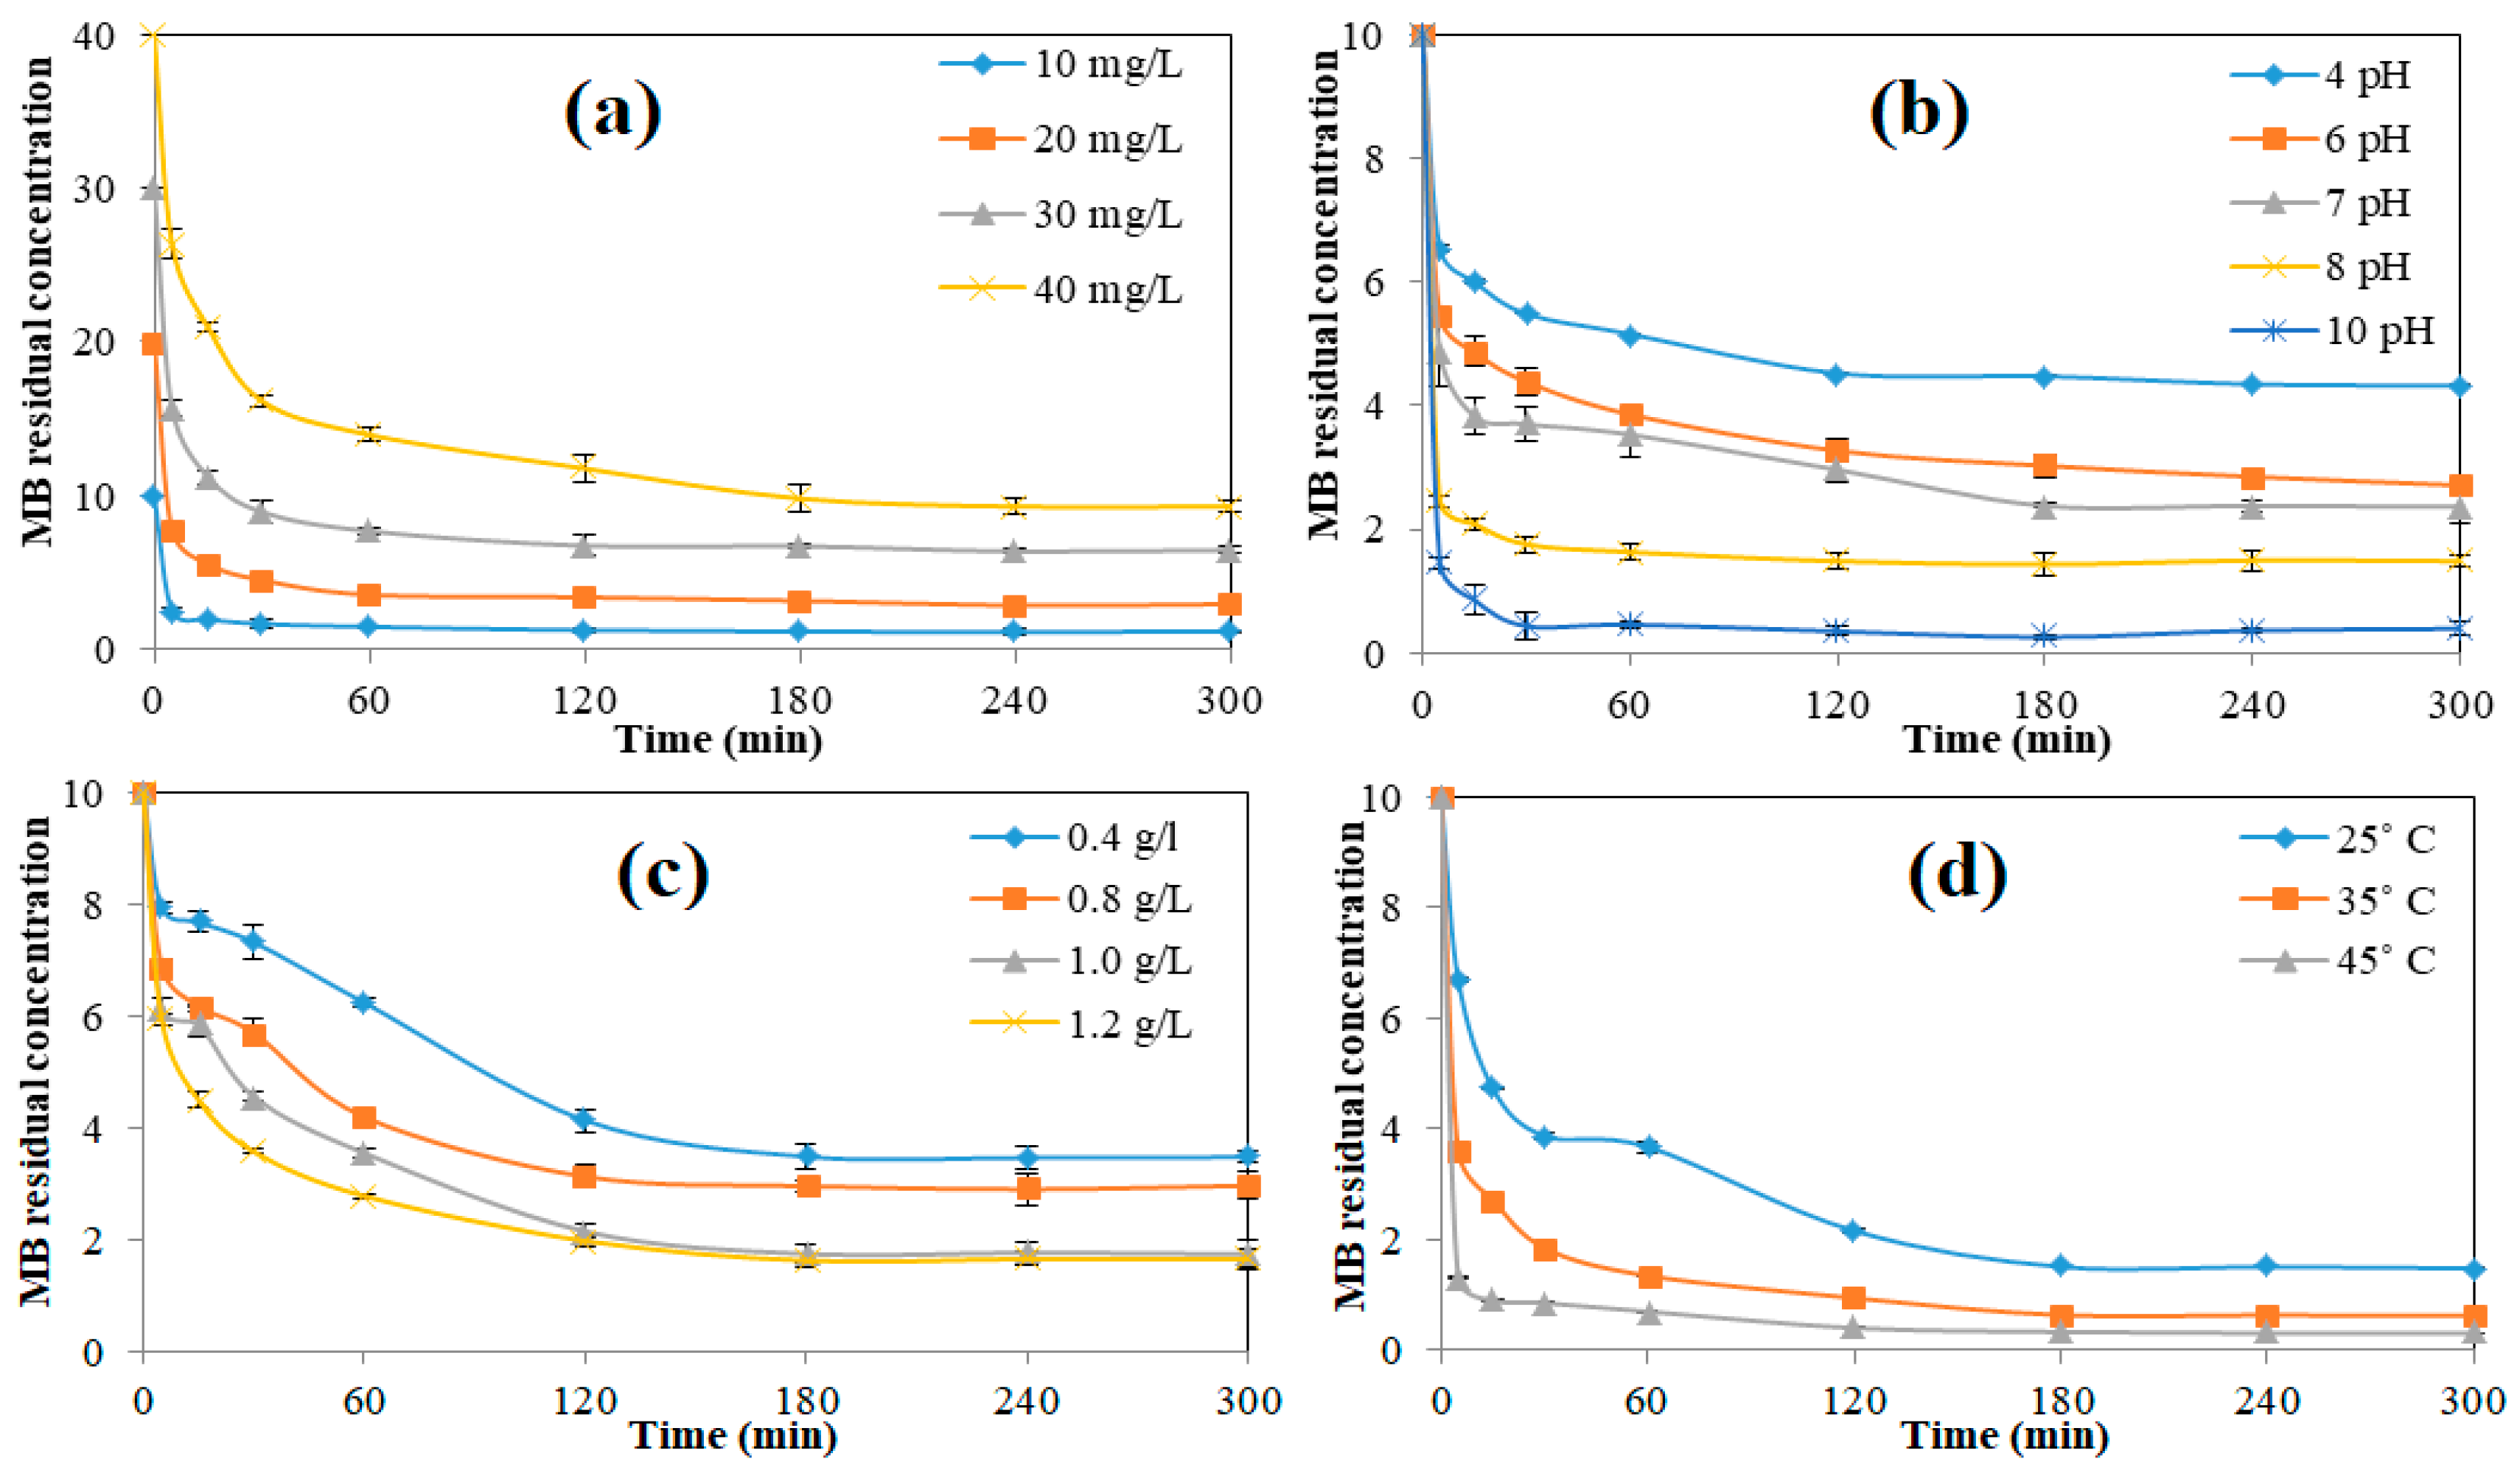
3.2.1. Impact of MB Initial Concentration (C0) and Equilibrium Time
3.2.2. Impact of Solution pH
3.2.3. Impact of nZVISLP Dosage
3.2.4. Impact of Process Temperature
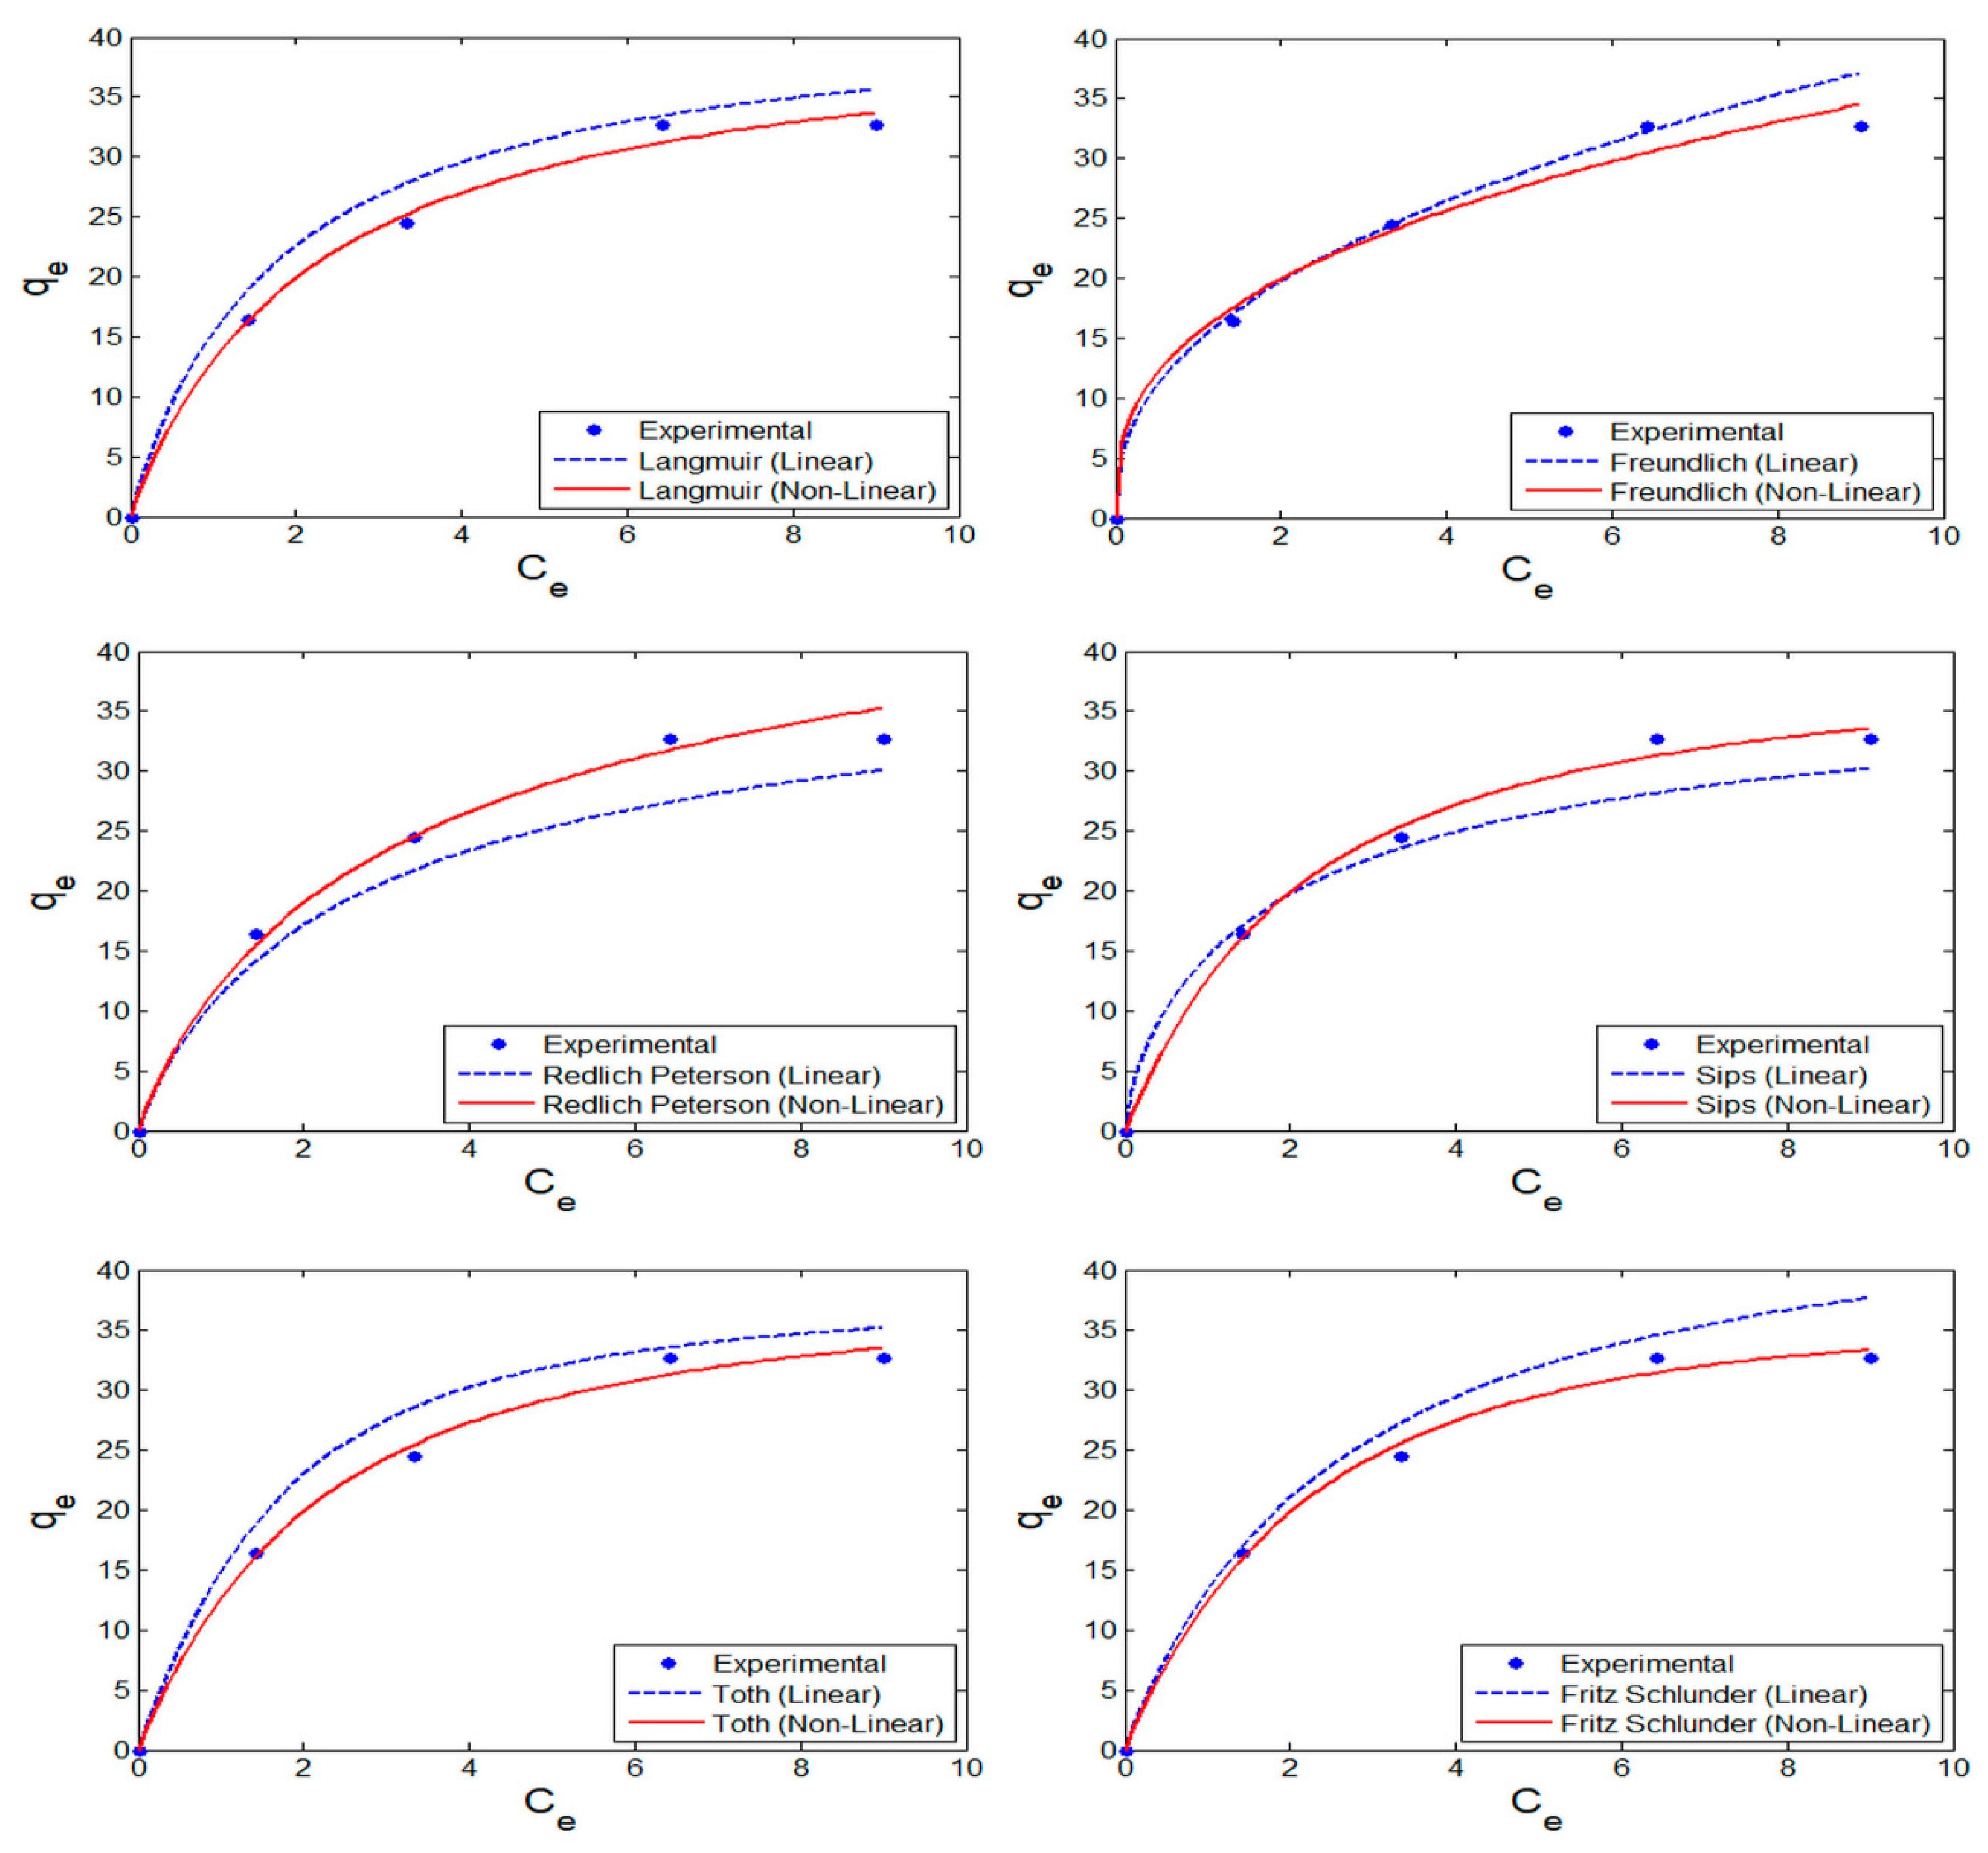
3.3. Identification of Equilibrium Isotherm Models
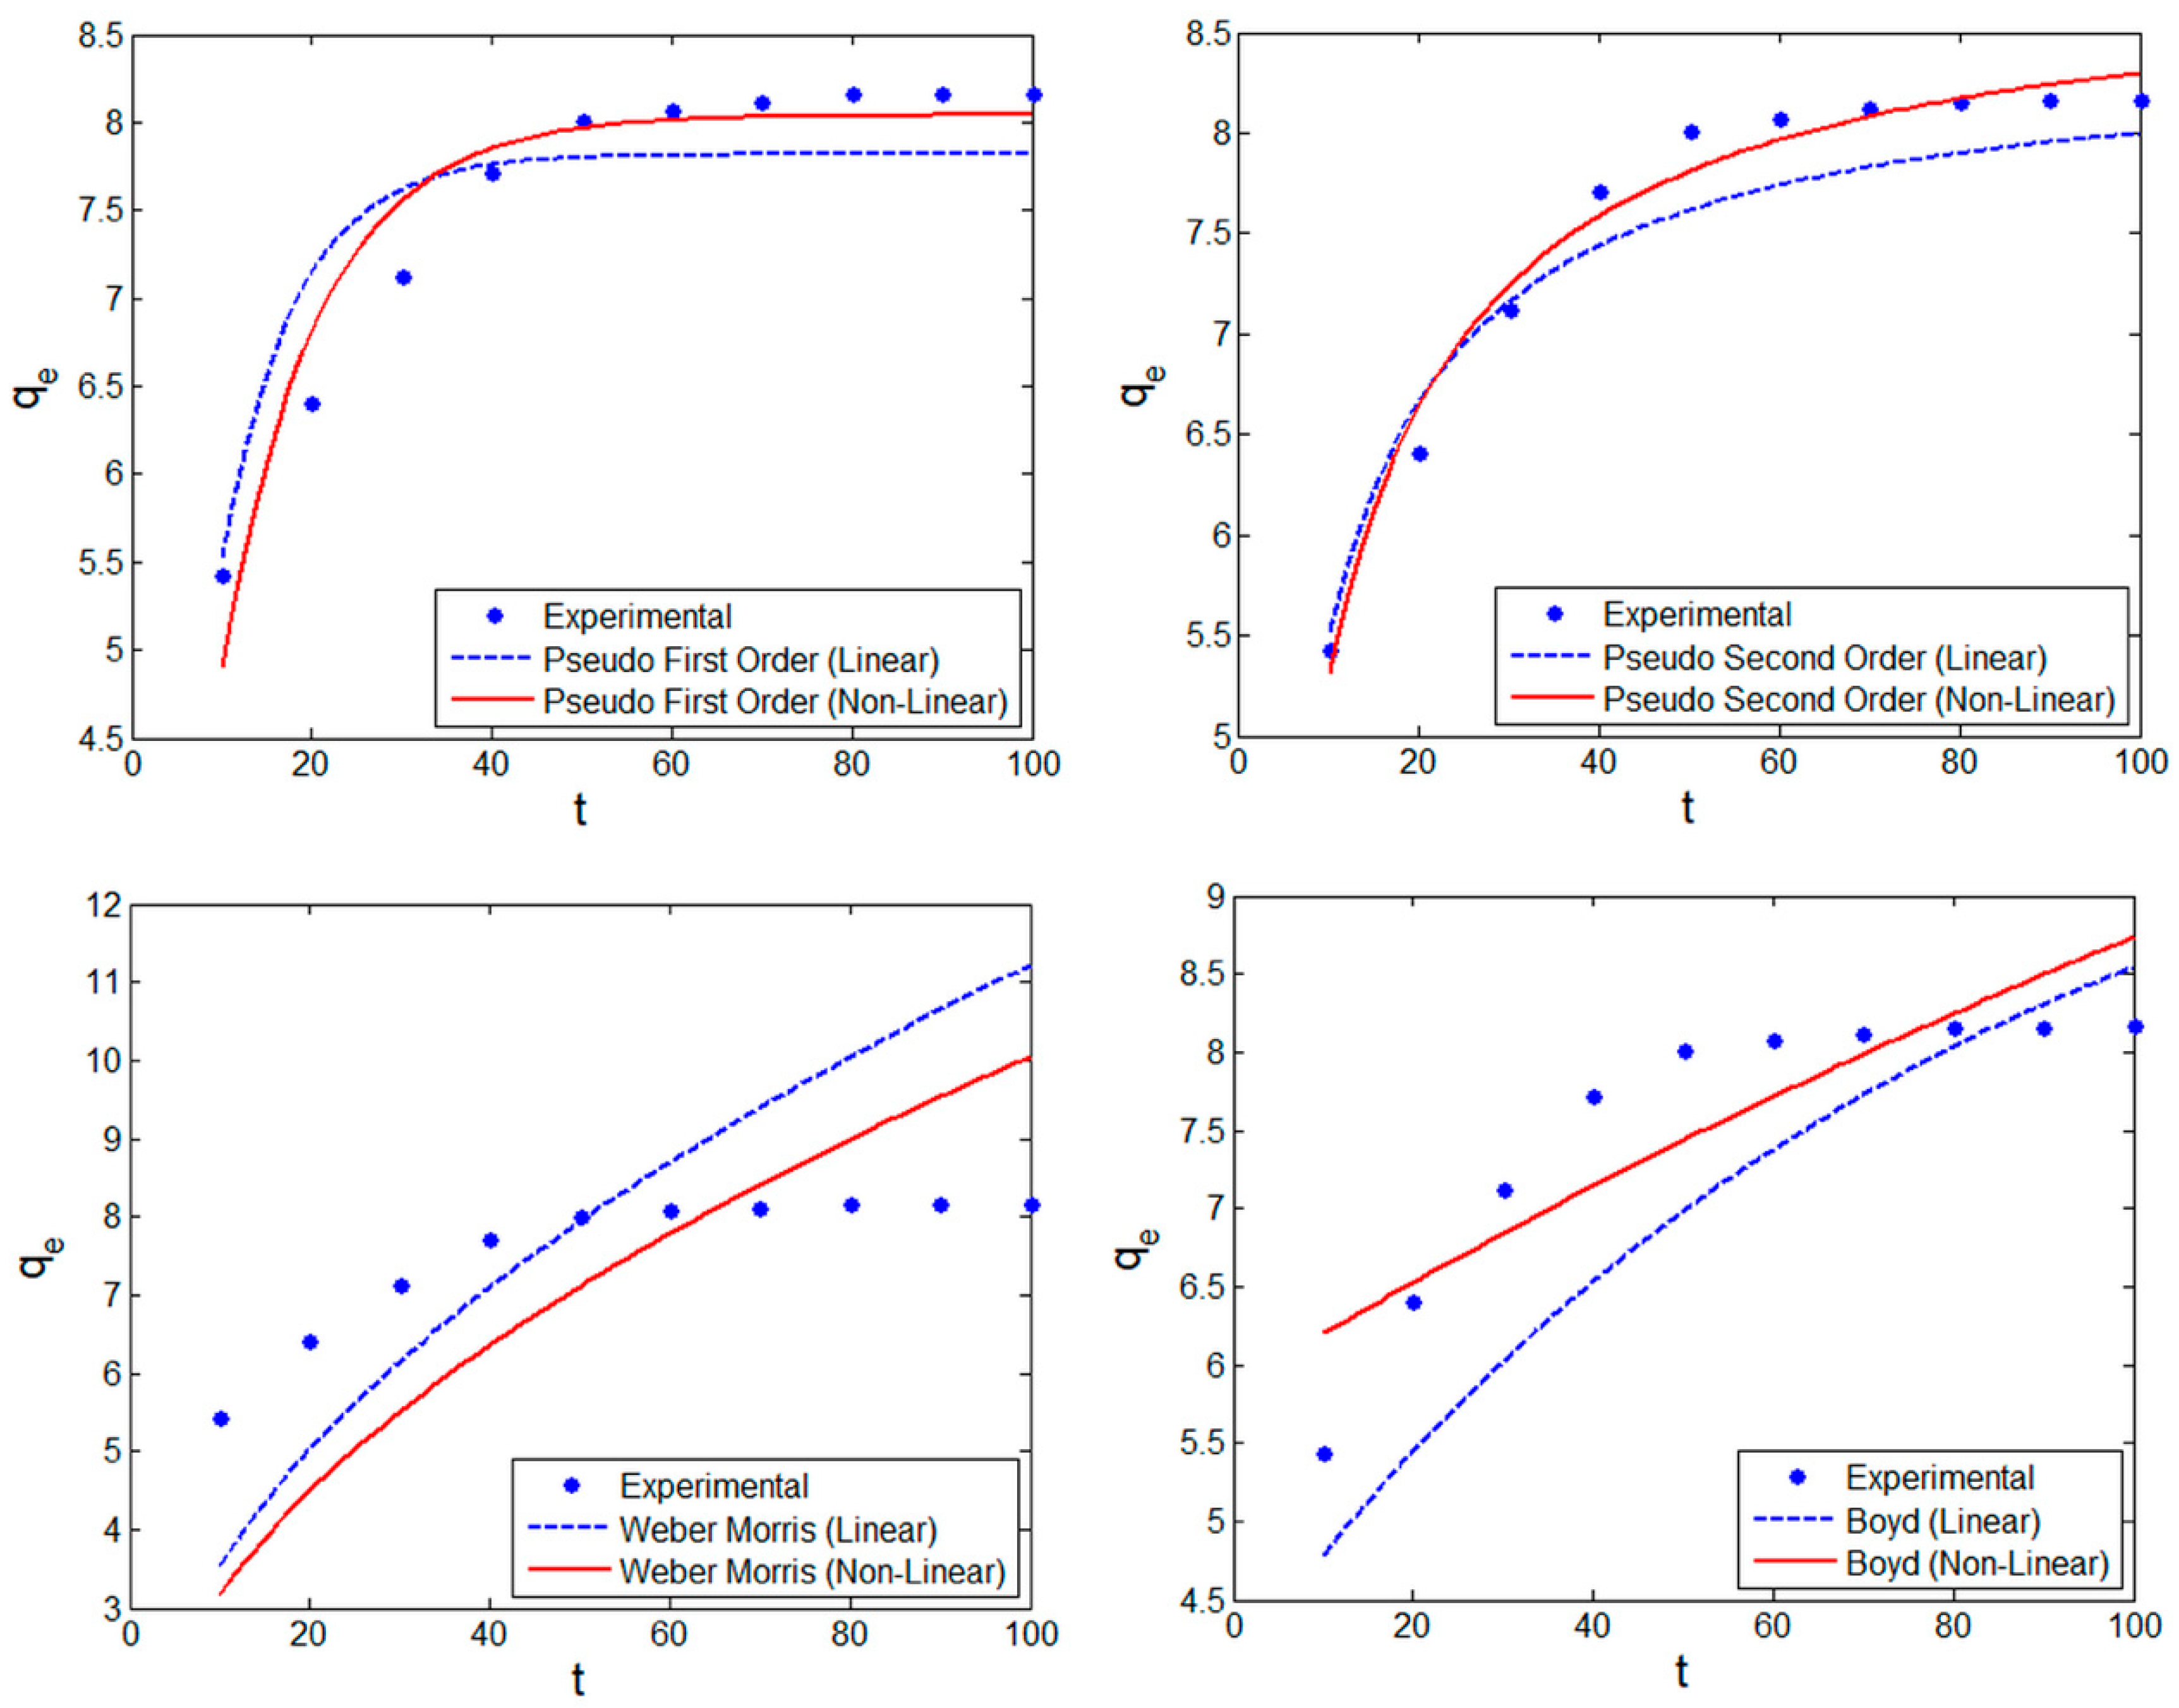
3.4. Evaluation of Intrinsic Parameters in Kinetic Models
3.5. Thermodynamic Studies
4. Conclusions
Supplementary Materials
Author Contributions
Funding
Acknowledgments
Conflicts of Interest
References
- Fan, Y.; Liu, H.-J.; Zhang, Y.; Chen, Y. Adsorption of anionic MO or cationic MB from MO/MB mixture using polyacrylonitrile fiber hydrothermally treated with hyperbranched polyethylenimine. J. Hazard. Mater. 2015, 283, 321–328. [Google Scholar] [CrossRef] [PubMed]
- Wang, Y.; López-Valdivieso, A.; Zhang, T.; Mwamulima, T.; Zhang, X.; Song, S.; Peng, C. Preparation of microscale zero-valent iron-fly ash-bentonite composite and evaluation of its adsorption performance of crystal violet and methylene blue dyes. Environ. Sci. Pollut. Res. 2017, 24, 20050–20062. [Google Scholar] [CrossRef] [PubMed]
- Zhu, N.; Yan, T.; Qiao, J.; Cao, H. Adsorption of arsenic, phosphorus and chromium by bismuth impregnated biochar: Adsorption mechanism and depleted adsorbent utilization. Chemosphere 2016, 164, 32–40. [Google Scholar] [CrossRef] [PubMed]
- Tan, K.B.; Vakili, M.; Horri, B.A.; Poh, P.E.; Abdullah, A.Z.; Salamatinia, B. Adsorption of dyes by nanomaterials: Recent developments and adsorption mechanisms. Sep. Purif. Technol. 2015, 150, 229–242. [Google Scholar] [CrossRef]
- Rasalingam, S.; Peng, R.; Koodali, R.T. An insight into the adsorption and photocatalytic degradation of rhodamine B in periodic mesoporous materials. Appl. Catal. B Environ. 2015, 174–175, 49–59. [Google Scholar] [CrossRef]
- Alkan, M.; Doğan, M.; Turhan, Y.; Demirbaş, Ö.; Turan, P. Adsorption kinetics and mechanism of maxilon blue 5G dye on sepiolite from aqueous solutions. Chem. Eng. J. 2008, 139, 213–223. [Google Scholar] [CrossRef]
- Doğan, M.; Özdemir, Y.; Alkan, M. Adsorption kinetics and mechanism of cationic methyl violet and methylene blue dyes onto sepiolite. Dyes Pigment. 2007, 75, 701–713. [Google Scholar] [CrossRef]
- Mall, I.D.; Srivastava, V.C.; Agarwal, N.K. Removal of Orange-G and Methyl Violet dyes by adsorption onto bagasse fly ash—Kinetic study and equilibrium isotherm analyses. Dyes Pigm. 2006, 69, 210–223. [Google Scholar] [CrossRef]
- Zhang, P.; Lo, I.; O’Connor, D.; Pehkonen, S.; Cheng, H.; Hou, D. High efficiency removal of methylene blue using SDS surface-modified ZnFe2O4 nanoparticles. J. Colloid Interface Sci. 2017, 508, 39–48. [Google Scholar] [CrossRef]
- Zirak, M.; Abdollahiyan, A.; Eftekhari-Sis, B.; Saraei, M. Carboxymethyl cellulose coated Fe3O4@SiO2 core–shellmagnetic nanoparticles for methylene blue removal: Equilibrium, kinetic, and thermodynamic studies. Cellulose 2018, 25, 503–515. [Google Scholar] [CrossRef]
- Annadurai, G.; Ling, L.Y.; Lee, J.-F. Adsorption of reactive dye from an aqueous solution by chitosan: Isotherm, kinetic and thermodynamic analysis. J. Hazard. Mater. 2008, 152, 337–346. [Google Scholar] [CrossRef] [PubMed]
- Rauf, M.A.; Bukallah, S.B.; Hamour, F.A.; Nasir, A.S. Adsorption of dyes from aqueous solutions onto sand and their kinetic behavior. Chem. Eng. J. 2008, 137, 238–243. [Google Scholar] [CrossRef]
- Demirbas, A. Agricultural based activated carbons for the removal of dyes from aqueous solutions: A review. J. Hazard. Mater. 2009, 167, 1–9. [Google Scholar] [CrossRef] [PubMed]
- Dong, P.; Wu, X.; Sun, Z.; Hu, J.; Yang, S. Removal performance and the underlying mechanisms of plasma-induced CD/MWCNT/iron oxides towards Ni (II). Chem. Eng. J. 2014, 256, 128–136. [Google Scholar] [CrossRef]
- Wang, T.; Lin, J.; Chen, Z.; Megharaj, M.; Naidu, R. Green synthesized iron nanoparticless by green tea and eucalyptus leaves extracts used for removal of nitrate in aqueous solution. J. Clean. Prod. 2014, 83, 413–419. [Google Scholar] [CrossRef]
- Sweet, M.J.; Chessher, A.; Singleton, I. Review: Metal-Based Nanoparticless; Size, Function, and Areas for Advancement in Applied Microbiology. In Advances in Applied Microbiology; Elsevier: Amsterdam, The Netherlands, 2012; Volume 80, pp. 113–142. [Google Scholar] [CrossRef]
- Aslam, S.; Zeng, J.; Subhan, F.; Li, M.; Lyu, F.; Li, Y.; Yan, Z. In situ one-step synthesis of Fe3O4@MIL-100(Fe) core-shells for adsorption of methylene blue from water. J. Colloid Interface Sci. 2017, 505, 186–195. [Google Scholar] [CrossRef]
- Muthukumaran, C.; Sivakumar, V.M.; Thirumarimurugan, M. Adsorption isotherms and kinetic studies of crystal violet dye removal from aqueous solution using surfactant modified magnetic nanoadsorbent. J. Taiwan Inst. Chem. Eng. 2016, 63, 354–362. [Google Scholar] [CrossRef]
- Gautam, A.; Rawat, S.; Verma, L.; Singh, J.; Sikarwar, S.; Yadav, B.C.; Kalamdhad, A.S. Green synthesis of iron nanoparticle from extract of waste tea: An application for phenol red removal from aqueous solution. Environ. Nanotechnol. Monit. Manag. 2018, 10, 377–387. [Google Scholar] [CrossRef]
- Konicki, W.; Sibera, D.; Mijowska, E.; Lendzion-Bielun, Z.; Narkiewicz, U. Equilibrium and kinetic studies on acid dye Acid Red 88 adsorption by magnetic ZnFe2O4 spinel ferrite nanoparticles. J. Colloid Interface Sci. 2013, 398, 152–160. [Google Scholar] [CrossRef]
- Ebrahiminezhad, A.; Taghizadeh, S.; Ghasemi, Y.; Berenjian, A. Green synthesized nanoclusters of ultra-small zero valent iron nanoparticles as a novel dye removing material. Sci. Total Environ. 2018, 621, 1527–1532. [Google Scholar] [CrossRef]
- Fazlzadeh, M.; Rahmani, K.; Zarei, A.; Abdoallahzadeh, H.; Nasiri, F.; Khosravi, R. A novel green synthesis of zero valent iron nanoparticles (NZVI) using three plant extracts and their efficient application for removal of Cr(VI) from aqueous solutions. Adv. Powder Technol. 2016, 28, 122–130. [Google Scholar] [CrossRef]
- Wang, X.; Wang, A.; Ma, J.; Fu, M. Facile green synthesis of functional nanoscale zero-valent iron and studies of its activity toward ultrasound-enhanced decolorization of cationic dyes. Chemosphere 2017, 166, 80–88. [Google Scholar] [CrossRef]
- Ali, I.; AL-Othman, Z.A.; Alwarthan, A. Green synthesis of functionalized iron nano particles and molecular liquid phase adsorption of ametryn from water. J. Mol. Liq. 2016, 221, 1168–1174. [Google Scholar] [CrossRef]
- Rafiq, S.; Kaul, R.; Sofi, S.A.; Bashir, N.; Nazir, F.; Nayik, G.A. Citrus peel as a source of functional ingredient: A review. J. Saudi Soc. Agric. Sci. 2018, 17, 351–358. [Google Scholar] [CrossRef]
- Shaik, M.R.; Khan, M.; Kuniyil, M.; Al-Warthan, A.; Alkhathlan, H.Z.; Siddiqui, M.R.H.; Shaik, J.P.; Ahamed, A.; Mahmood, A.; Khan, M.; et al. Plant-Extract-Assisted Green Synthesis of Silver Nanoparticles Using Origanum vulgare L. Extract and Their Microbicidal Activities. Sustainability 2018, 10, 91327. [Google Scholar] [CrossRef]
- Karri, R.R.; Jayakumar, N.S.; Sahu, J.N. Modelling of fluidised-bed reactor by differential evolution optimization for phenol removal using coconut shells based activated carbon. J. Mol. Liq. 2017, 231, 249–262. [Google Scholar] [CrossRef]
- Karri, R.R.; Sahu, J.N.; Jayakumar, N.S. Optimal isotherm parameters for phenol adsorption from aqueous solutions onto coconut shell based activated carbon: Error analysis of linear and non-linear methods. J. Taiwan Inst. Chem. Eng. 2017, 80, 472–487. [Google Scholar] [CrossRef]
- Singh, J.; Reddy, K.J.; Chang, Y.-Y.; Kang, S.-H.; Yang, J.-K. A novel reutilization method for automobile shredder residue as an adsorbent for the removal of methylene blue: Mechanisms and heavy metal recovery using an ultrasonically assisted acid. Process. Saf. Environ. Prot. 2016, 99, 88–97. [Google Scholar] [CrossRef]
- Su, Y.-F.; Cheng, Y.-L.; Shih, Y.-H. Removal of trichloroethylene by zerovalent iron/activated carbon derived from agricultural wastes. J. Environ. Manag. 2013, 129, 361–366. [Google Scholar] [CrossRef]
- Sharma, Y.C.; Srivastava, V.; Weng, C.H.; Upadhyay, S.N. Removal of Cr(VI) from wastewater by adsorption on iron nanoparticless. Can. J. Chem. Eng. 2009, 87, 921–929. [Google Scholar] [CrossRef]
- Sun, Y.-P.; Li, X.-Q.; Zhang, W.-X.; Wang, H.P. A method for the preparation of stable dispersion of zero-valent iron nanoparticless. Colloids Surfaces A Physicochem. Eng. Asp. 2007, 308, 60–66. [Google Scholar] [CrossRef]
- Konicki, W.; Hełminiak, A.; Arabczyk, W.; Mijowska, E. Adsorption of cationic dyes onto Fe@graphite coreshell magnetic nanocomposite: Equilibrium, kinetics and thermodynamics. Chem. Eng. Res. Des. 2018, 129, 259–270. [Google Scholar] [CrossRef]
- Machado, S.; Pacheco, J.G.; Nouws, H.P.A.; Albergaria, J.T.; Delerue-Matos, C. Characterization of green zero-valent iron nanoparticless produced with tree leaf extracts. Sci. Total Environ. 2015, 533, 76–81. [Google Scholar] [CrossRef] [PubMed]
- Kržišnik, N.; Mladenovič, A.; Škapin, A.S.; Škrlep, L.; Ščančar, J.; Milačič, R. Nanoscale zero-valent iron for the removal of Zn2+, Zn (II)–EDTA and Zn (II)–citrate from aqueous solutions. Sci. Total Environ. 2014, 476, 20–28. [Google Scholar] [CrossRef]
- Shokoohi, R.; Torkshavand, Z.; Mahmoudi, M.M.; Behgoo, A.M.; Ghaedrahmati, E.; Hosseini, F.M. Effective Removal of Azo Dye Reactive Blue 222 from Aqueous Solutions Using Modified Magnetic Nanoparticles with Sodium Alginate/Hydrogen Peroxide. Environ. Prog. Sustain. Energy 2018. [Google Scholar] [CrossRef]
- Tor, A.; Cengeloglu, Y.; Aydin, M.E.; Ersoz, M. Removal of phenol from aqueous phase by using neutralized red mud. J. Colloid Interface Sci. 2006, 300, 498–503. [Google Scholar] [CrossRef]
- Borah, L.; Goswami, M.; Phukan, P. Adsorption of methylene blue and eosin yellow using porous carbon prepared from tea waste: Adsorption equilibrium, kinetics and thermodynamics study. J. Environ. Chem. Eng. 2015, 3, 1018–1028. [Google Scholar] [CrossRef]
- Li, Y.; Zhang, Y.; Zhang, Y.; Wang, G.; Li, S.; Han, R.; Wei, W. Reed biochar supported hydroxyapatite nanocomposite: Characterization and reactivity for methylene blue removal from aqueous media. J. Mol. Liq. 2018, 263, 53–63. [Google Scholar] [CrossRef]
- Anirudhan, T.S.; Ramachandran, M. Adsorptive removal of basic dyes from aqueous solutions by surfactant modified bentonite clay (organoclay): Kinetic and competitive adsorption isotherm. Process. Saf. Environ. Prot. 2015, 95, 215–225. [Google Scholar] [CrossRef]
- Hamdy, A.; Mostafa, M.K.; Nasr, M. Zero-valent iron nanoparticles for methylene blue removal from aqueous solutions and textile wastewater treatment, with cost estimation. Water Sci. Technol. 2018, 78, 367–378. [Google Scholar] [CrossRef]
- Karagöz, S.; Tay, T.; Ucar, S.; Erdem, M. Activated carbons from waste biomass by sulfuric acid activation and their use on methylene blue adsorption. Bioresour. Technol. 2008, 99, 6214–6222. [Google Scholar] [CrossRef] [PubMed]
- Sun, X.; Kurokawa, T.; Suzuki, M.; Takagi, M.; Kawase, Y. Removal of cationic dye methylene blue by zero-valent iron: Effects of pH and dissolved oxygen on removal mechanisms. J. Environ. Sci. Health Part. A 2015, 50, 1057–1071. [Google Scholar] [CrossRef] [PubMed]


| Element | Weight (%) |
|---|---|
| C (K) | 54.31 |
| O (K) | 15.03 |
| Si (K) | 1.71 |
| Ca (K) | 3.10 |
| Fe (K) | 11.98 |
| Zr (L) | 13.86 |
| Total | 100.00 |
| Models → | Freundlich | Langmuir | Redlich–Peterson | Sips | Toth | Fritz–Schlunder | |||||||
|---|---|---|---|---|---|---|---|---|---|---|---|---|---|
| Metrics ↓ | Expressions ↓ | L | NL | L | NL | L | NL | L | NL | L | NL | L | NL |
| Parameters → | KL: 42.68 bF: 0.563 | KL: 41.99 bF: 0.450 | KL: 14.76 bL: 2.38 | KL: 15.44 bL: 2.735 | KR: 17.93 aR: 0.572 α: 0.926 | KR: 18.60 aR: 0.511 α: 0.907 | Ks: 40.210 bs: 0.569 ns: 1.156 | Ks: 40.064 bs: 0.462 ns: 0.911 | Kth: 38.21 bth: 0.353 nth: 1.423 | Kth: 38.97 bth: 0.336 nth: 1.222 | KFS: 51.04 bFS: 0.354 nFS: 0.982 | KFS: 59.20 bFS: 0.265 nFS: 0.878 | |
| Correlation coefficient of determination (R2) | 0.979 | 0.979 | 0.940 | 0.945 | 0.973 | 0.974 | 0.973 | 0.979 | 0.971 | 0.975 | 0.971 | 0.973 | |
| Average relative error (ARE) | 6.378 | 1.742 | 3.153 | 3.470 | 7.880 | 2.672 | 3.098 | 1.952 | 6.660 | 2.005 | 5.711 | 2.101 | |
| Sum of the squares of errors (SSE) | 26.429 | 3.900 | 20.814 | 10.107 | 48.309 | 8.547 | 11.106 | 3.790 | 29.314 | 3.716 | 36.175 | 3.459 | |
| Sum of the absolute errors (SAE) | 9.439 | 3.285 | 5.754 | 5.789 | 12.994 | 4.536 | 5.199 | 3.466 | 9.825 | 3.494 | 10.170 | 3.484 | |
| Root-mean-square error (RMSE) | 2.099 | 0.806 | 1.863 | 1.298 | 2.838 | 1.194 | 1.360 | 0.795 | 2.210 | 0.787 | 2.455 | 0.759 | |
| Pearson’s chi-square measure | 0.905 | 0.989 | 0.902 | 0.950 | 0.877 | 0.964 | 0.940 | 0.988 | 0.779 | 0.989 | 0.788 | 0.989 | |
| Hybrid fractional error function (HYBRID) | 17.785 | 1.977 | 10.407 | 5.611 | 27.241 | 4.599 | 5.980 | 1.999 | 19.943 | 1.995 | 19.100 | 1.973 | |
| Models → | PFO | PSO | Weber–Morris | Boyd | |||||
|---|---|---|---|---|---|---|---|---|---|
| Metrics ↓ | Expressions ↓ | L | NL | L | NL | L | NL | L | NL |
| Parameters → | K1: 0.0938 qe: 8.0228 | K1: 0.1226 qe: 7.818 | K2: 0.0170 qe: 8.8485 | K2: 0.0226 qe: 8.418 | Kid: 1.123 | Kid: 1.005 | B: 0.0038 qe: 14.9468 | B: 0.0126 qe: 10.326 | |
| Correlation coefficient of determination (R2) | 0.9219 | 0.9514 | 0.9362 | 0.9778 | 0.8378 | 0.8862 | 0.7430 | 0.7825 | |
| Average relative error (ARE) | 3.879 | 2.790 | 2.718 | 1.444 | 17.388 | 16.206 | 8.247 | 4.741 | |
| Sum of the squares of errors (SSE) | 3.185 | 2.077 | 2.316 | 1.158 | 14.252 | 12.705 | 6.637 | 3.792 | |
| Sum of the absolute errors (SAE) | 1.363 | 0.718 | 0.640 | 0.174 | 27.877 | 20.285 | 5.802 | 1.930 | |
| Root-mean-squared error (RMSE) | 0.389 | 0.283 | 0.267 | 0.139 | 1.760 | 1.501 | 0.803 | 0.463 | |
| Pearson’s chi-square measure (χ2) | 0.967 | 0.984 | 0.987 | 0.991 | 0.937 | 0.971 | 0.958 | 0.982 | |
| Hybrid fractional error function (HYBRID) | 2.142 | 1.290 | 0.925 | 0.274 | 41.831 | 33.549 | 9.019 | 3.127 | |
© 2019 by the authors. Licensee MDPI, Basel, Switzerland. This article is an open access article distributed under the terms and conditions of the Creative Commons Attribution (CC BY) license (http://creativecommons.org/licenses/by/4.0/).
Share and Cite
Sahu, N.; Rawat, S.; Singh, J.; Karri, R.R.; Lee, S.; Choi, J.-S.; Koduru, J.R. Process Optimization and Modeling of Methylene Blue Adsorption Using Zero-Valent Iron Nanoparticles Synthesized from Sweet Lime Pulp. Appl. Sci. 2019, 9, 5112. https://doi.org/10.3390/app9235112
Sahu N, Rawat S, Singh J, Karri RR, Lee S, Choi J-S, Koduru JR. Process Optimization and Modeling of Methylene Blue Adsorption Using Zero-Valent Iron Nanoparticles Synthesized from Sweet Lime Pulp. Applied Sciences. 2019; 9(23):5112. https://doi.org/10.3390/app9235112
Chicago/Turabian StyleSahu, Naincy, Shalu Rawat, Jiwan Singh, Rama Rao Karri, Suhyun Lee, Jong-Soo Choi, and Janardhan Reddy Koduru. 2019. "Process Optimization and Modeling of Methylene Blue Adsorption Using Zero-Valent Iron Nanoparticles Synthesized from Sweet Lime Pulp" Applied Sciences 9, no. 23: 5112. https://doi.org/10.3390/app9235112
APA StyleSahu, N., Rawat, S., Singh, J., Karri, R. R., Lee, S., Choi, J.-S., & Koduru, J. R. (2019). Process Optimization and Modeling of Methylene Blue Adsorption Using Zero-Valent Iron Nanoparticles Synthesized from Sweet Lime Pulp. Applied Sciences, 9(23), 5112. https://doi.org/10.3390/app9235112