Article

Experimental Study on Vertical Shear Behaviors of an Immersion Joint with Steel Shear Keys

1
State Key Laboratory for Disaster Reduction in Civil Engineering, Tongji University, Shanghai 200092, China
2
Department of Geotechnical Engineering, Tongji University, Shanghai 200092, China
3
Key Laboratory of Geotechnical and Underground Engineering of the Ministry of Education, Tongji University, Shanghai 200092, China
*
Author to whom correspondence should be addressed.
Appl. Sci. 2019, 9(23), 5056; https://doi.org/10.3390/app9235056
Submission received: 6 November 2019 / Revised: 20 November 2019 / Accepted: 21 November 2019 / Published: 23 November 2019
(This article belongs to the Section Civil Engineering)

Abstract

:
The vertical shear behaviors of an immersion joint with steel shear keys subjected to multidirectional loads are investigated in this paper. An experiment of an immersion joint model is carried out. Two kinds of compression–shear tests of the joint are considered in this experiment. The first kind of compression–shear test applies a specific vertical shear load and five different levels of longitudinal compressive loads on the joint. An additional compression–vertical shear destruction test is also conducted under the minimum longitudinal compressive load, wherein the vertical shear load is incrementally increased until failure of the joint. The other kind of compression–shear test is a bidirectional shear test, in which both the longitudinal compressive load and the transverse shear load are fixed, and the vertical shear load is gradually increased until reaching a target value. The results show that the shear force–displacement curves of the joint in any loading case can be divided into two stages: a non-linear development stage and a quasi-linear development stage. The vertical shear stiffness of the joint is found to increase with increasing longitudinal compressive load, and the existence of a transverse shear load enhances this effect. The ultimate shear capacity of the joint is smaller than the sum of the shear capacities of all vertical steel keys. In addition, the failure of the joint appears at the shear key on one sidewall of the joint.

1. Introduction

Since the first immersed tunnel was constructed in the USA in 1894, the technology of the immersed tunnel has developed quickly and spread around the world for over a century [1]. As a type of tunnel constructed by prefabricated components, the immersion joints connecting contiguous elements are the weakest [2,3,4]. Of the mechanical properties of an immersion joint, the shear behavior is a significant factor when subjected to differential settlements [5,6,7], earthquakes [8,9], wave impacts [10], etc. Flexible immersion joints, consisting of rubber gaskets, vertical shear keys and transverse shear keys, have been widely applied in immersed tunnel projects for years [11,12,13]. Since the shear keys are the vital components of an immersion joint, studies of their shear behaviors have been paid much attention. However, as the structures and arrangements of vertical shear keys and transverse shear keys in immersion joints are different, there is a difference between the shear resistance modes of immersion joints in the two directions. Hence, the shear behaviors of an immersion joint should be investigated in both directions.
The shear behaviors of an immersion joint subjected to seismic shaking were studied in a previous study [14]. Although a suitable design criterion for immersion joints was suggested, the deformation mechanisms of the joint were discussed only under longitudinal and transverse seismic excitations, respectively. Several studies have been performed on the immersed tunnel of the Hong Kong–Zhuhai–Macau Bridge (HZMB) project. A numerical model of the immersion joint, composed of GINA rubber gaskets and shear keys, was presented. Analysis of the shear behavior of the joint in the transverse direction was implemented, and the results showed that different compressive loads in the longitudinal direction had little influence on the shear behaviors [15]. Hybrid fiber-reinforced concrete (HFRC) shear keys of a segmental joint were developed in a study, and an experiment was performed to investigate the seismic behaviors of the HFRC shear keys in the transverse direction. Based on the experimental results, analytical models were achieved to predict the ultimate transverse shear capacity of the shear keys [16]. A 1/10 scale experiment was designed to explore the mechanical behavior of an immersion joint under transverse shear action. The transverse shear stiffness and the capacity of the joint were obtained, and the transverse shear failure mode with steel shear keys was discussed [17]. The foregoing studies either focused only on the transverse shear behaviors of the immersion joint or did not take the vertical shear keys into consideration.
According to the static equilibrium, an analytical mechanical model of the immersion joint was established. The longitudinal, transverse and vertical displacement of the immersion joint were calculated by the corresponding mechanical relationship [18]. However, this theoretical analysis was based on many idealized assumptions, which cannot be guaranteed in engineering practice. A simplified numerical model of the immersed tunnel was established, where immersion joints were simulated by non-linear hyperelastic springs. The vertical shear behaviors of the joints subjected to seismic shaking were investigated, and a surprising conclusion emerged from the results, wherein the overstressed joints improved the safety of the immersed tunnel after the seismic shaking [19]. Another numerical simulation study on the vertical shear behavior of the segmental joint in an immersed tunnel was also performed. Considering the stiffness of rubber gaskets and the friction between contiguous tunnel segments, the vertical shear capacities of the concrete shear keys in different kinds of segmental joints were investigated [20]. However, the aforementioned numerical methods either rely on various contact parameters of the immersion joint or are specific to the simplified components of the joint, which cannot fully reflect the mechanical properties of the joint on account of the complex composition. A 1/4.69 scale model experiment of a segmental joint was conducted on a settlement platform. Considering different vertical settlements, the distribution and transfer mechanisms of the shear force were investigated in the experiment. Moreover, the allowed settlements of the tunnel segments and the vertical shear failure features of the concrete shear keys were also studied [21]. However, this experiment focused on the vertical shear behaviors of the segmental joint, whose structure and components are different from those of the immersion joint.
Although the shear behaviors of the immersed tunnel have received much attention, no sufficient studies have been performed with an emphasis on the vertical shear behaviors of the immersion joint with steel shear keys. In addition, vertical shear loads are occasionally accompanied by the transverse shear loads [22,23]. Hence, a comprehensive study of the vertical shear behaviors is necessary. This paper presents an experiment of an immersion joint with steel shear keys to investigate the corresponding vertical shear behaviors under multidirectional loads. Two kinds of compression–shear tests are designed for this experiment. Different compression loads on the elements are considered to simulate different water pressures on the immersion joint at various water depths. The vertical shear stiffness and the ultimate shear capacity of the immersion joint are obtained to characterize the vertical shear behaviors. The failure phenomenon is also observed. Finally, conclusions and suggestions are outlined according to the experimental results.

2. Experimental Design

2.1. Immersion Joint Model

Since flexible joints have been the most representative form of immersion joints in the current immersed tunnel engineering projects [24,25], this paper designs an immersion joint model based on the structure and material characteristics of the flexible joint. The immersion joint model is composed of two elements made of reinforced concrete and several joint parts including four sets of vertical steel shear keys, two sets of transverse concrete shear keys, and GINA rubber gasket. The vertical steel shear keys are installed on the sidewalls and the middle walls of the elements, whereas the transverse concrete shear keys are installed on the bottom of the elements. The GINA rubber gasket is installed on the steel shell along the periphery of the cross-section. The cross-sectional size of the joint and the schematic of the shear keys are shown in Figure 1a. A side view of the joint and a plan view of the transverse concrete shear keys can be seen in Figure 1b and Figure 1c, respectively.

2.1.1. Element Model

The cross-sectional size of the element is 6000 mm × 1660 mm, and the length of a single element is 1600 mm. The element is made of cast-in-place reinforced concrete. According to the Chinese code (GB50010-2010), the strength grade of the concrete is C40, and the steel rebars are HRB400. The weight of each element is approximately 14 tons. The prefabricated element 1 and element 2 are shown in Figure 2.

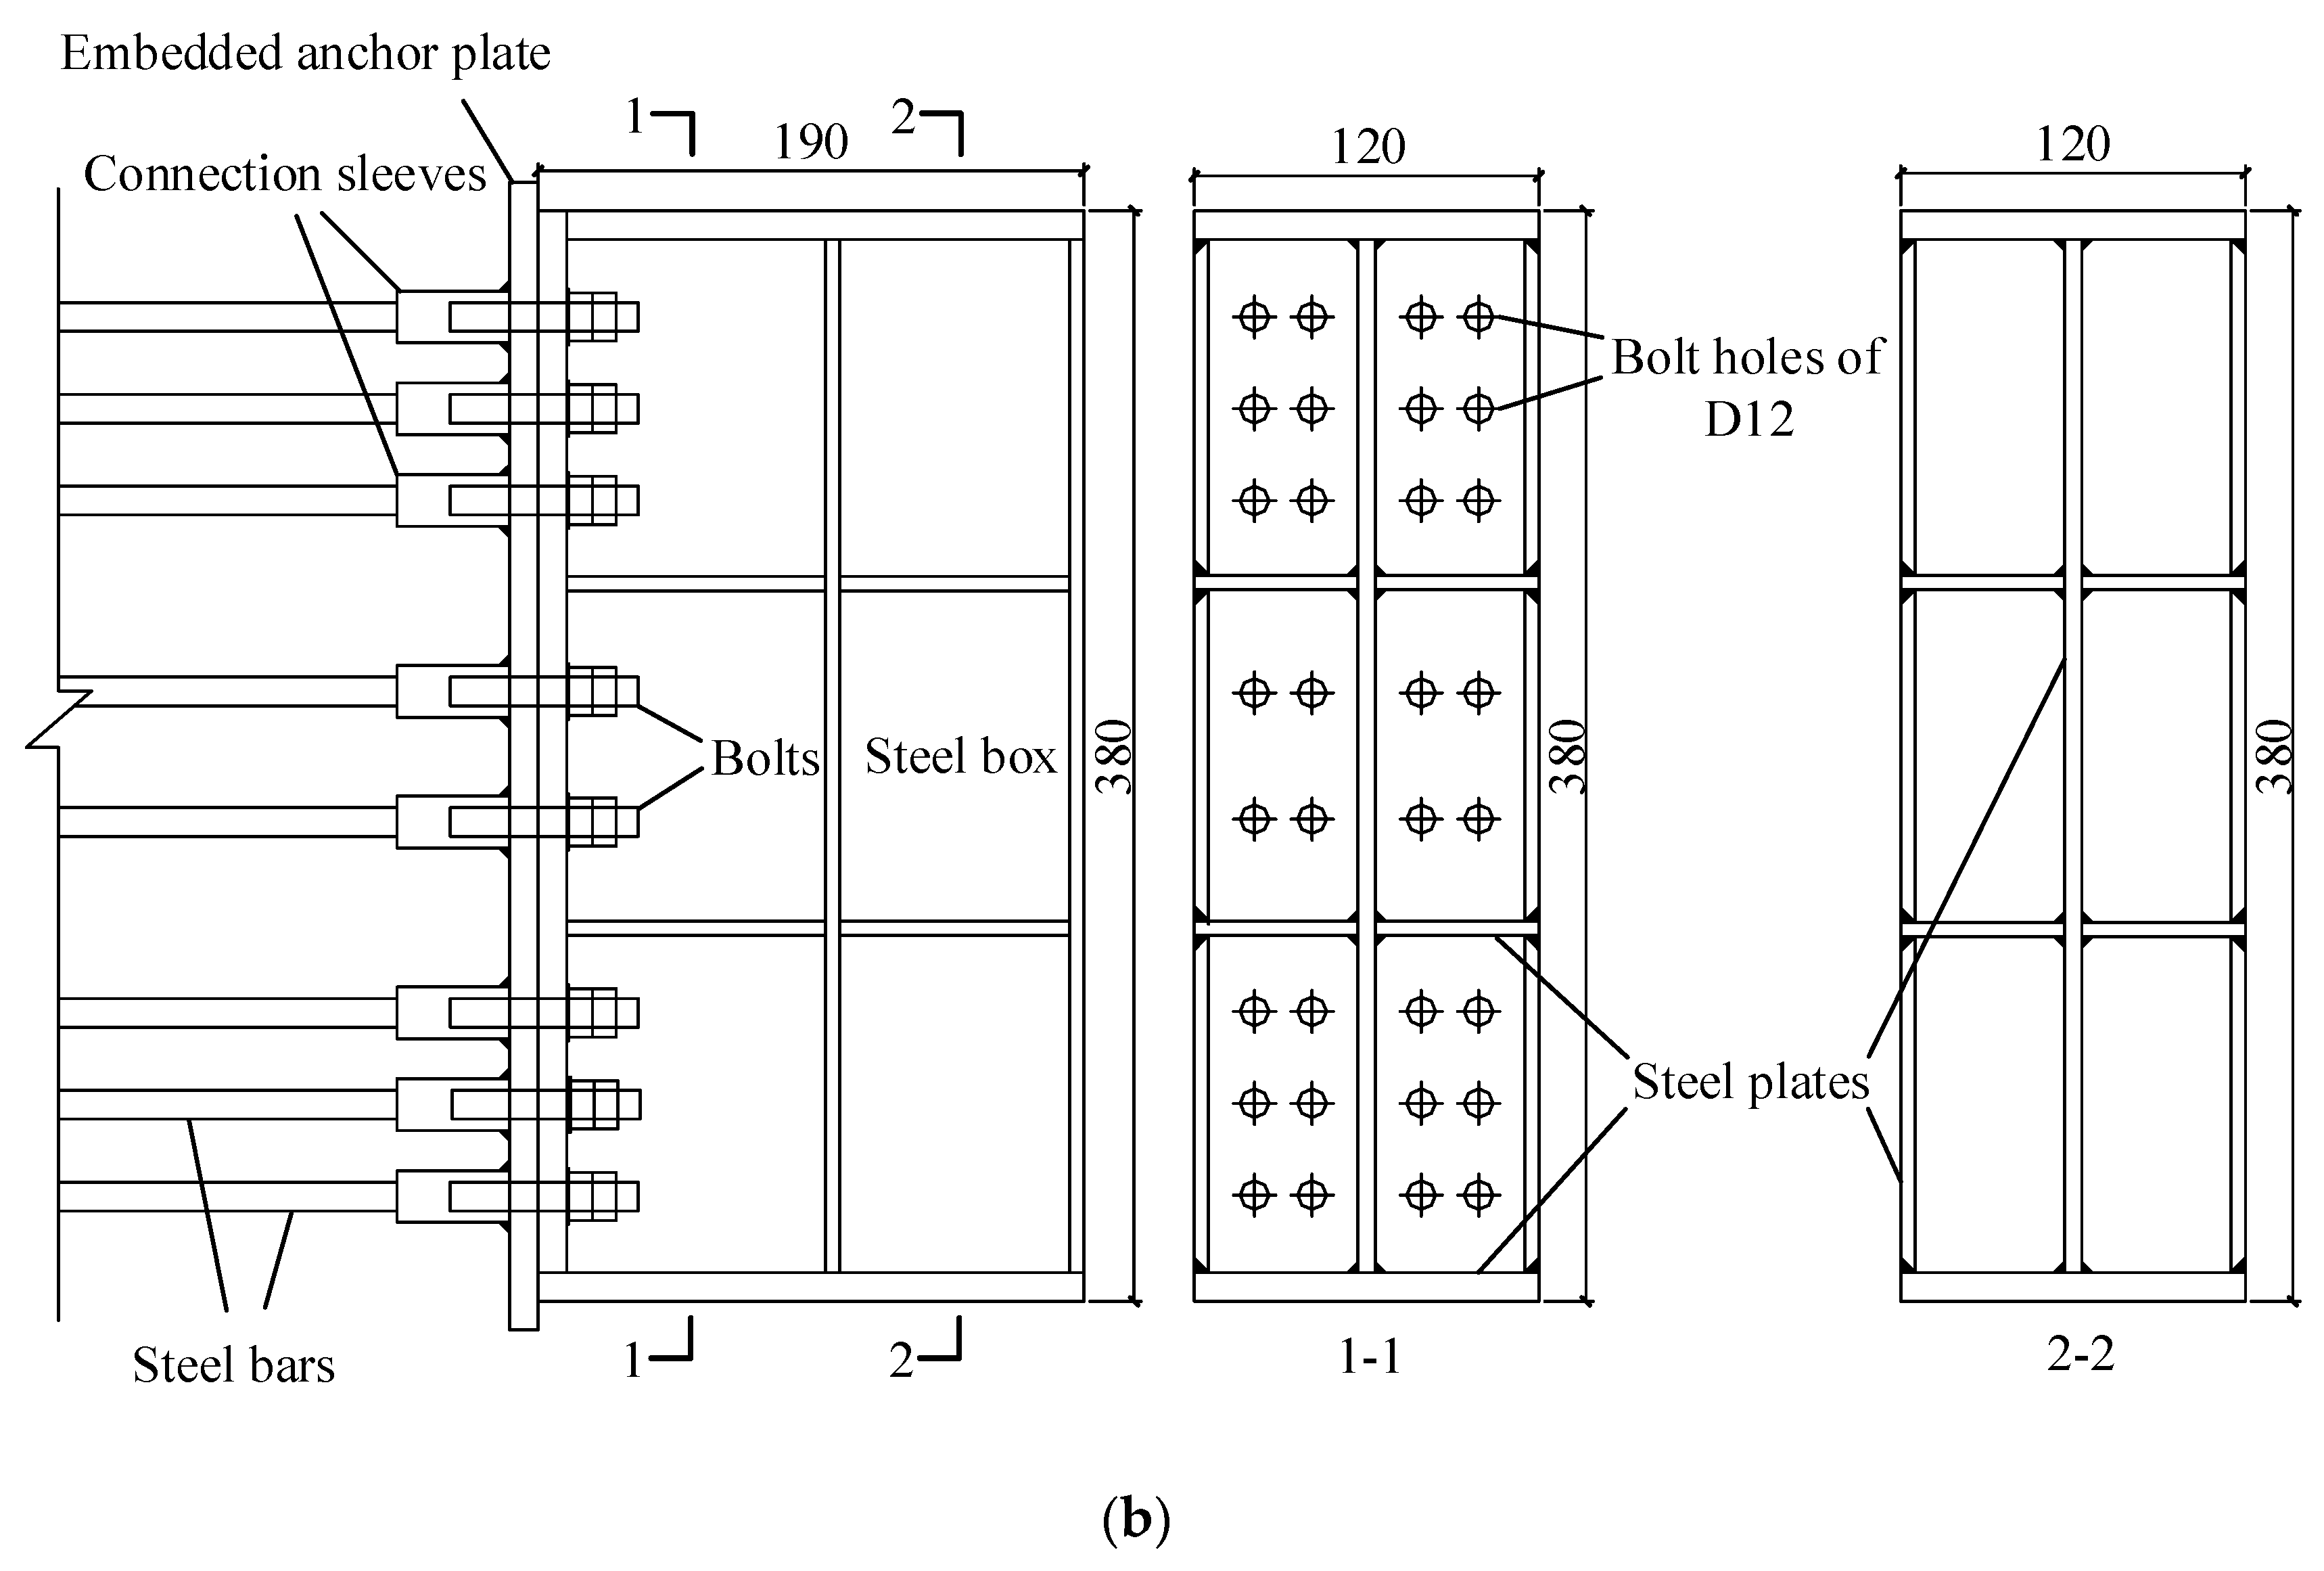
2.1.2. Vertical Steel Shear Keys

As shown in Figure 2, four sets of vertical steel shear keys are divided into two types, VSKA and VSKB. Each set consists of three steel keys. The size of VSKA is 60 mm × 274 mm × 190 mm, whereas the size of VSKB is 120 mm × 380 mm × 190 mm. All shear keys are box-type structures installed on the embedded anchor plates. Two sets of VSKA are installed on the two sidewalls of the element, and two sets of VSKB are installed on the two middle walls. The top and the bottom shear keys are fixed on element 1, and the middle shear keys are fixed on element 2. Details of VSKA and VSKB are depicted in Figure 3.
The shear capacity of the vertical steel shear key is assumed to be provided by the bolts. Hence, the shear capacity of the vertical shear key can be approximately calculated with Equation (1).
S C V S K = S C B ,
where S C V S K and S C B represent the shear capacity of the vertical shear key and that of the bolt, respectively. Based on Equation (1), the design shear capacities of one VSKA and one VSKB are 120 and 320 kN, respectively. Additionally, the design shear capacity of the immersion joint in the vertical direction is assumed to be the sum of the shear capacities of the four sets of steel shear keys, which is 880 kN.
As shown in Figure 2, in each set, two shear keys are installed on element 1, whereas the other shear key is installed on element 2. The connection is formed when two elements contact each other. As shown in Figure 1, a rubber bearing is installed between every two keys in each set.

2.1.3. Transverse Concrete Shear Keys

The two sets of transverse concrete shear keys are also divided into two types, TSKA and TSKB. As shown in Figure 1, TSKA is composed of four shear tenons and is installed on the bottom of element 1. TSKB is composed of three shear tenons and is installed on the bottom of element 2. The gaps between the shear tenons are filled with rubber bearings. Since the main focus of this experiment is the vertical shear behaviors of the immersion joint, the transverse concrete shear keys will not be discussed in further detail.

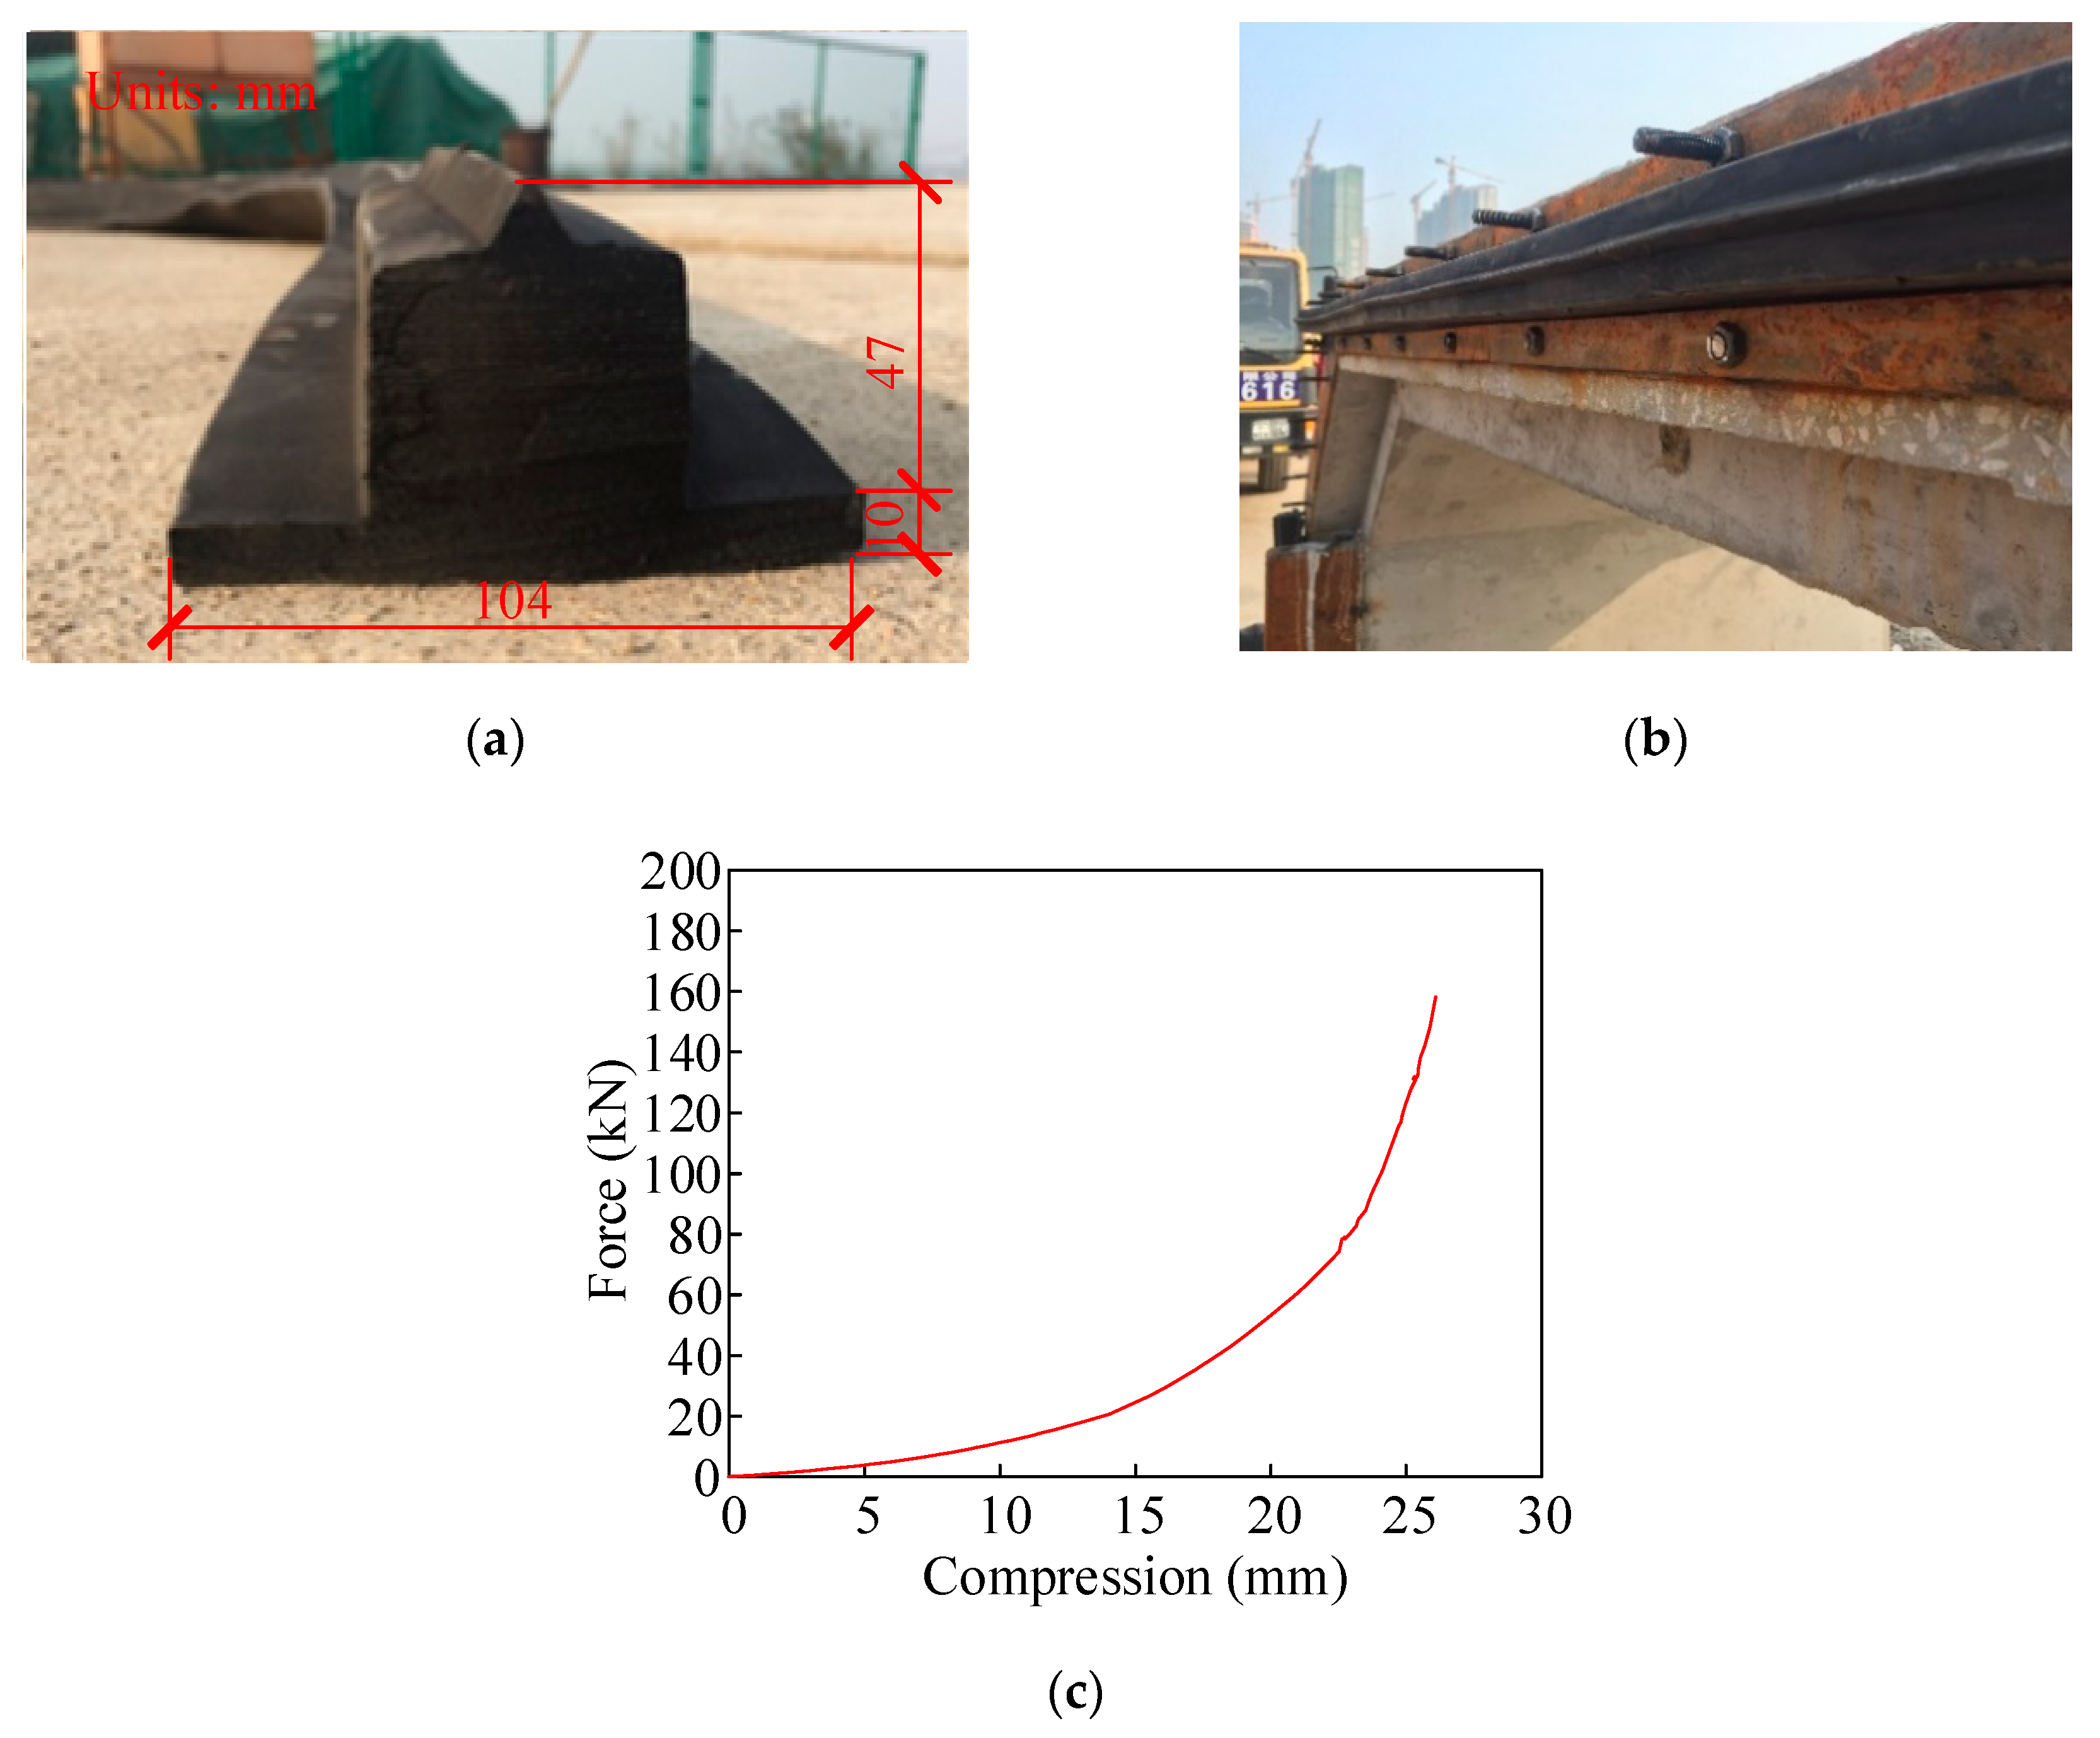
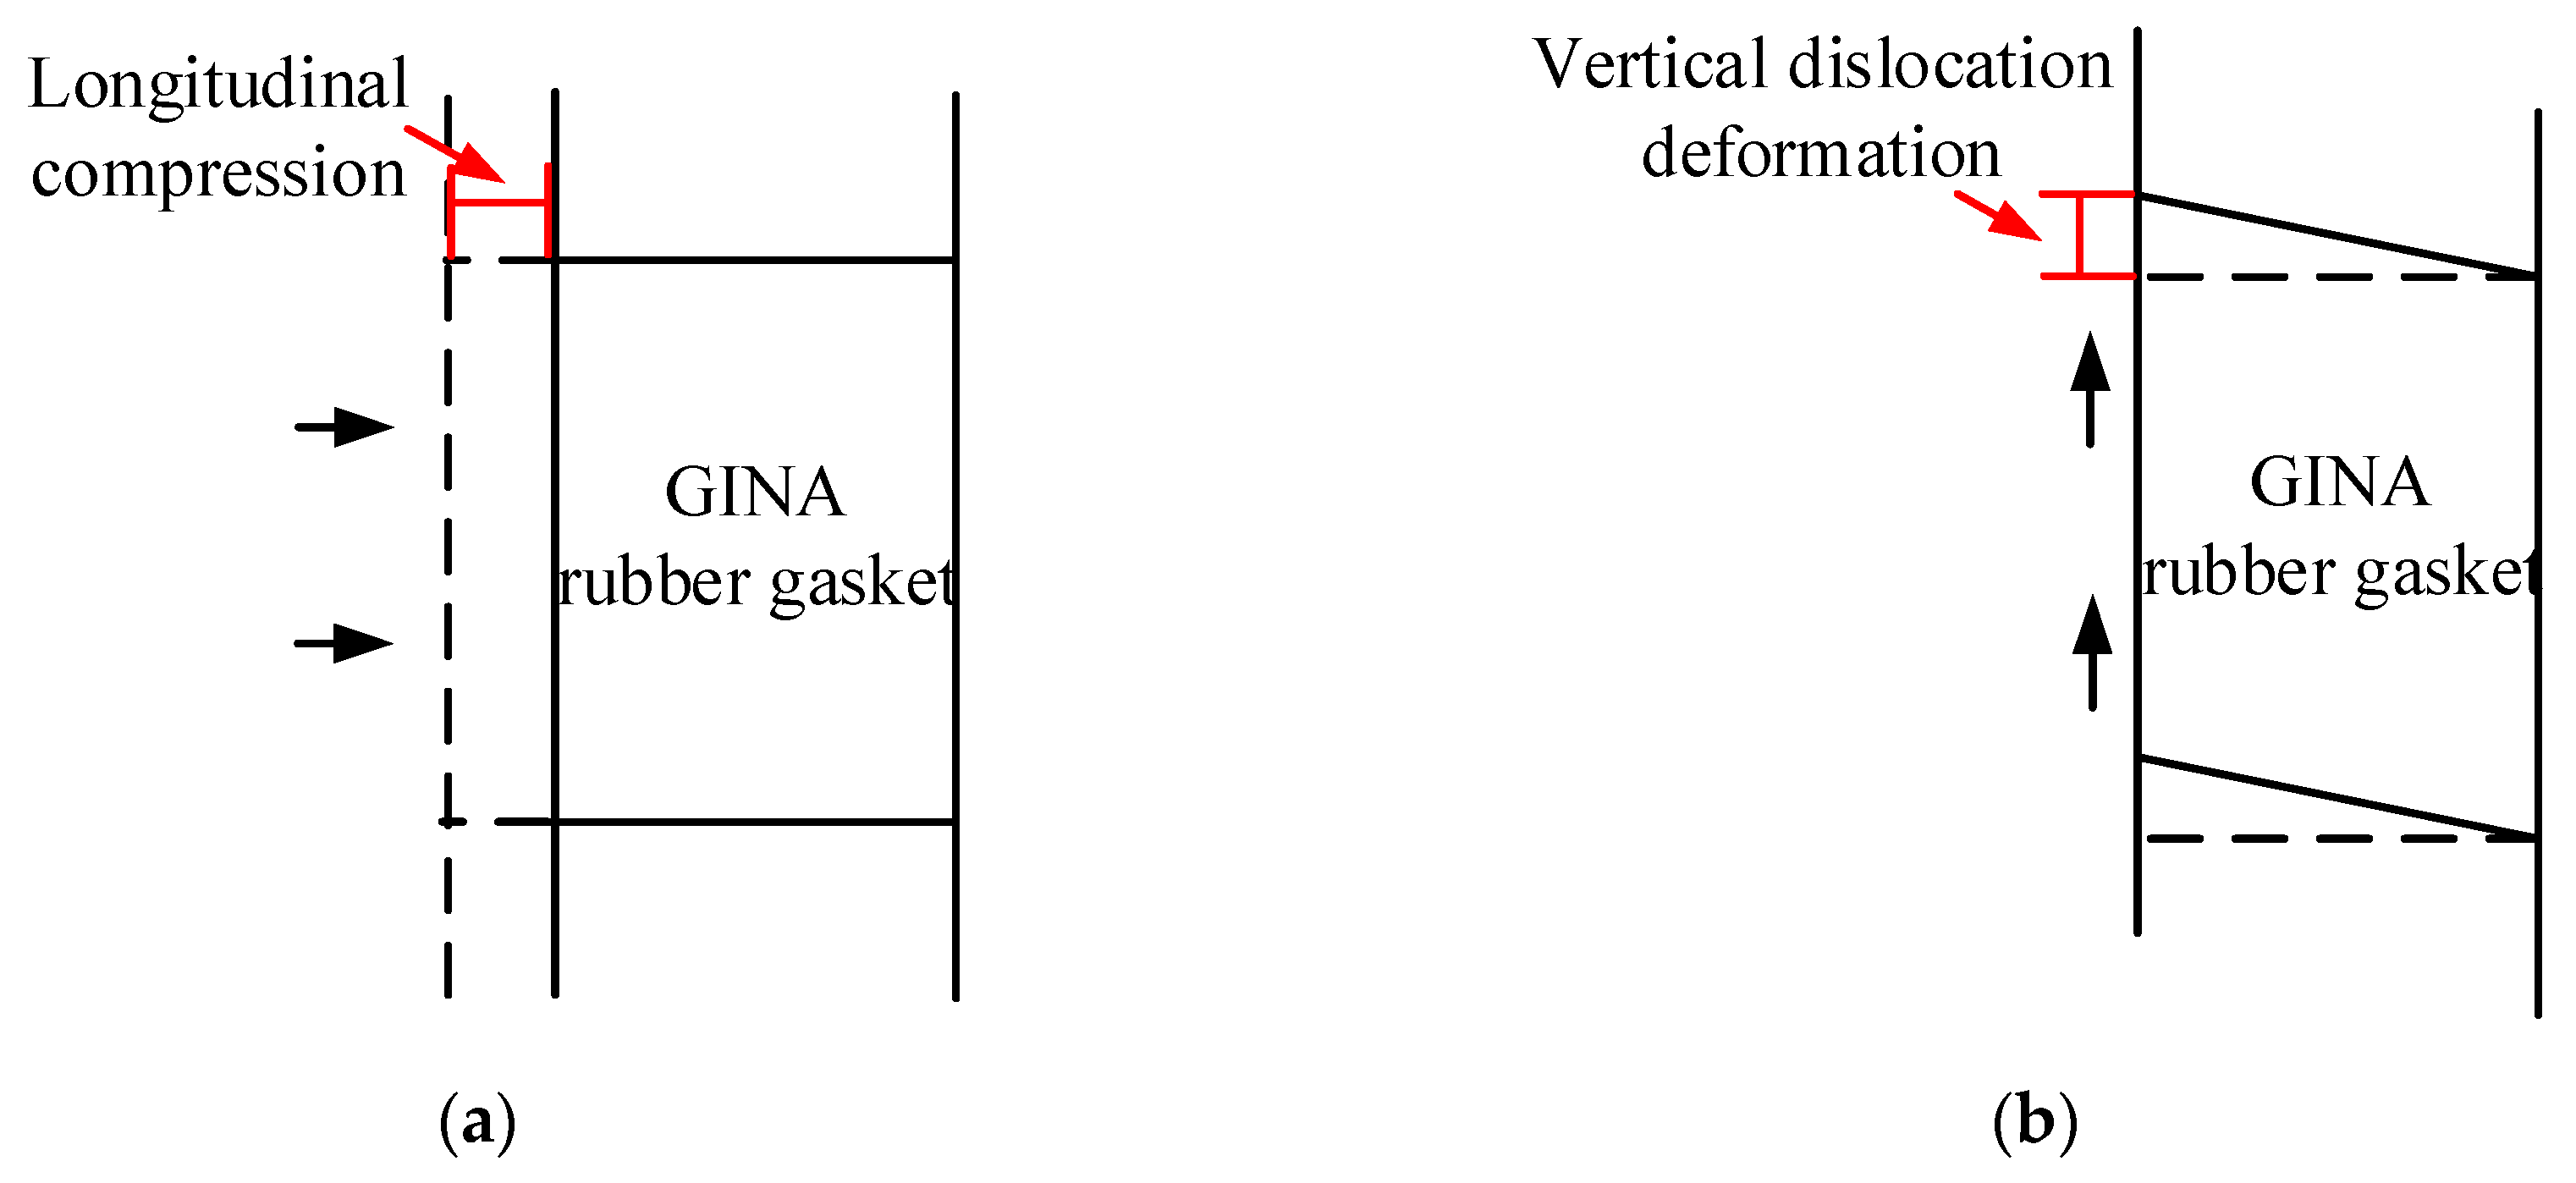
2.1.4. GINA Rubber Gasket
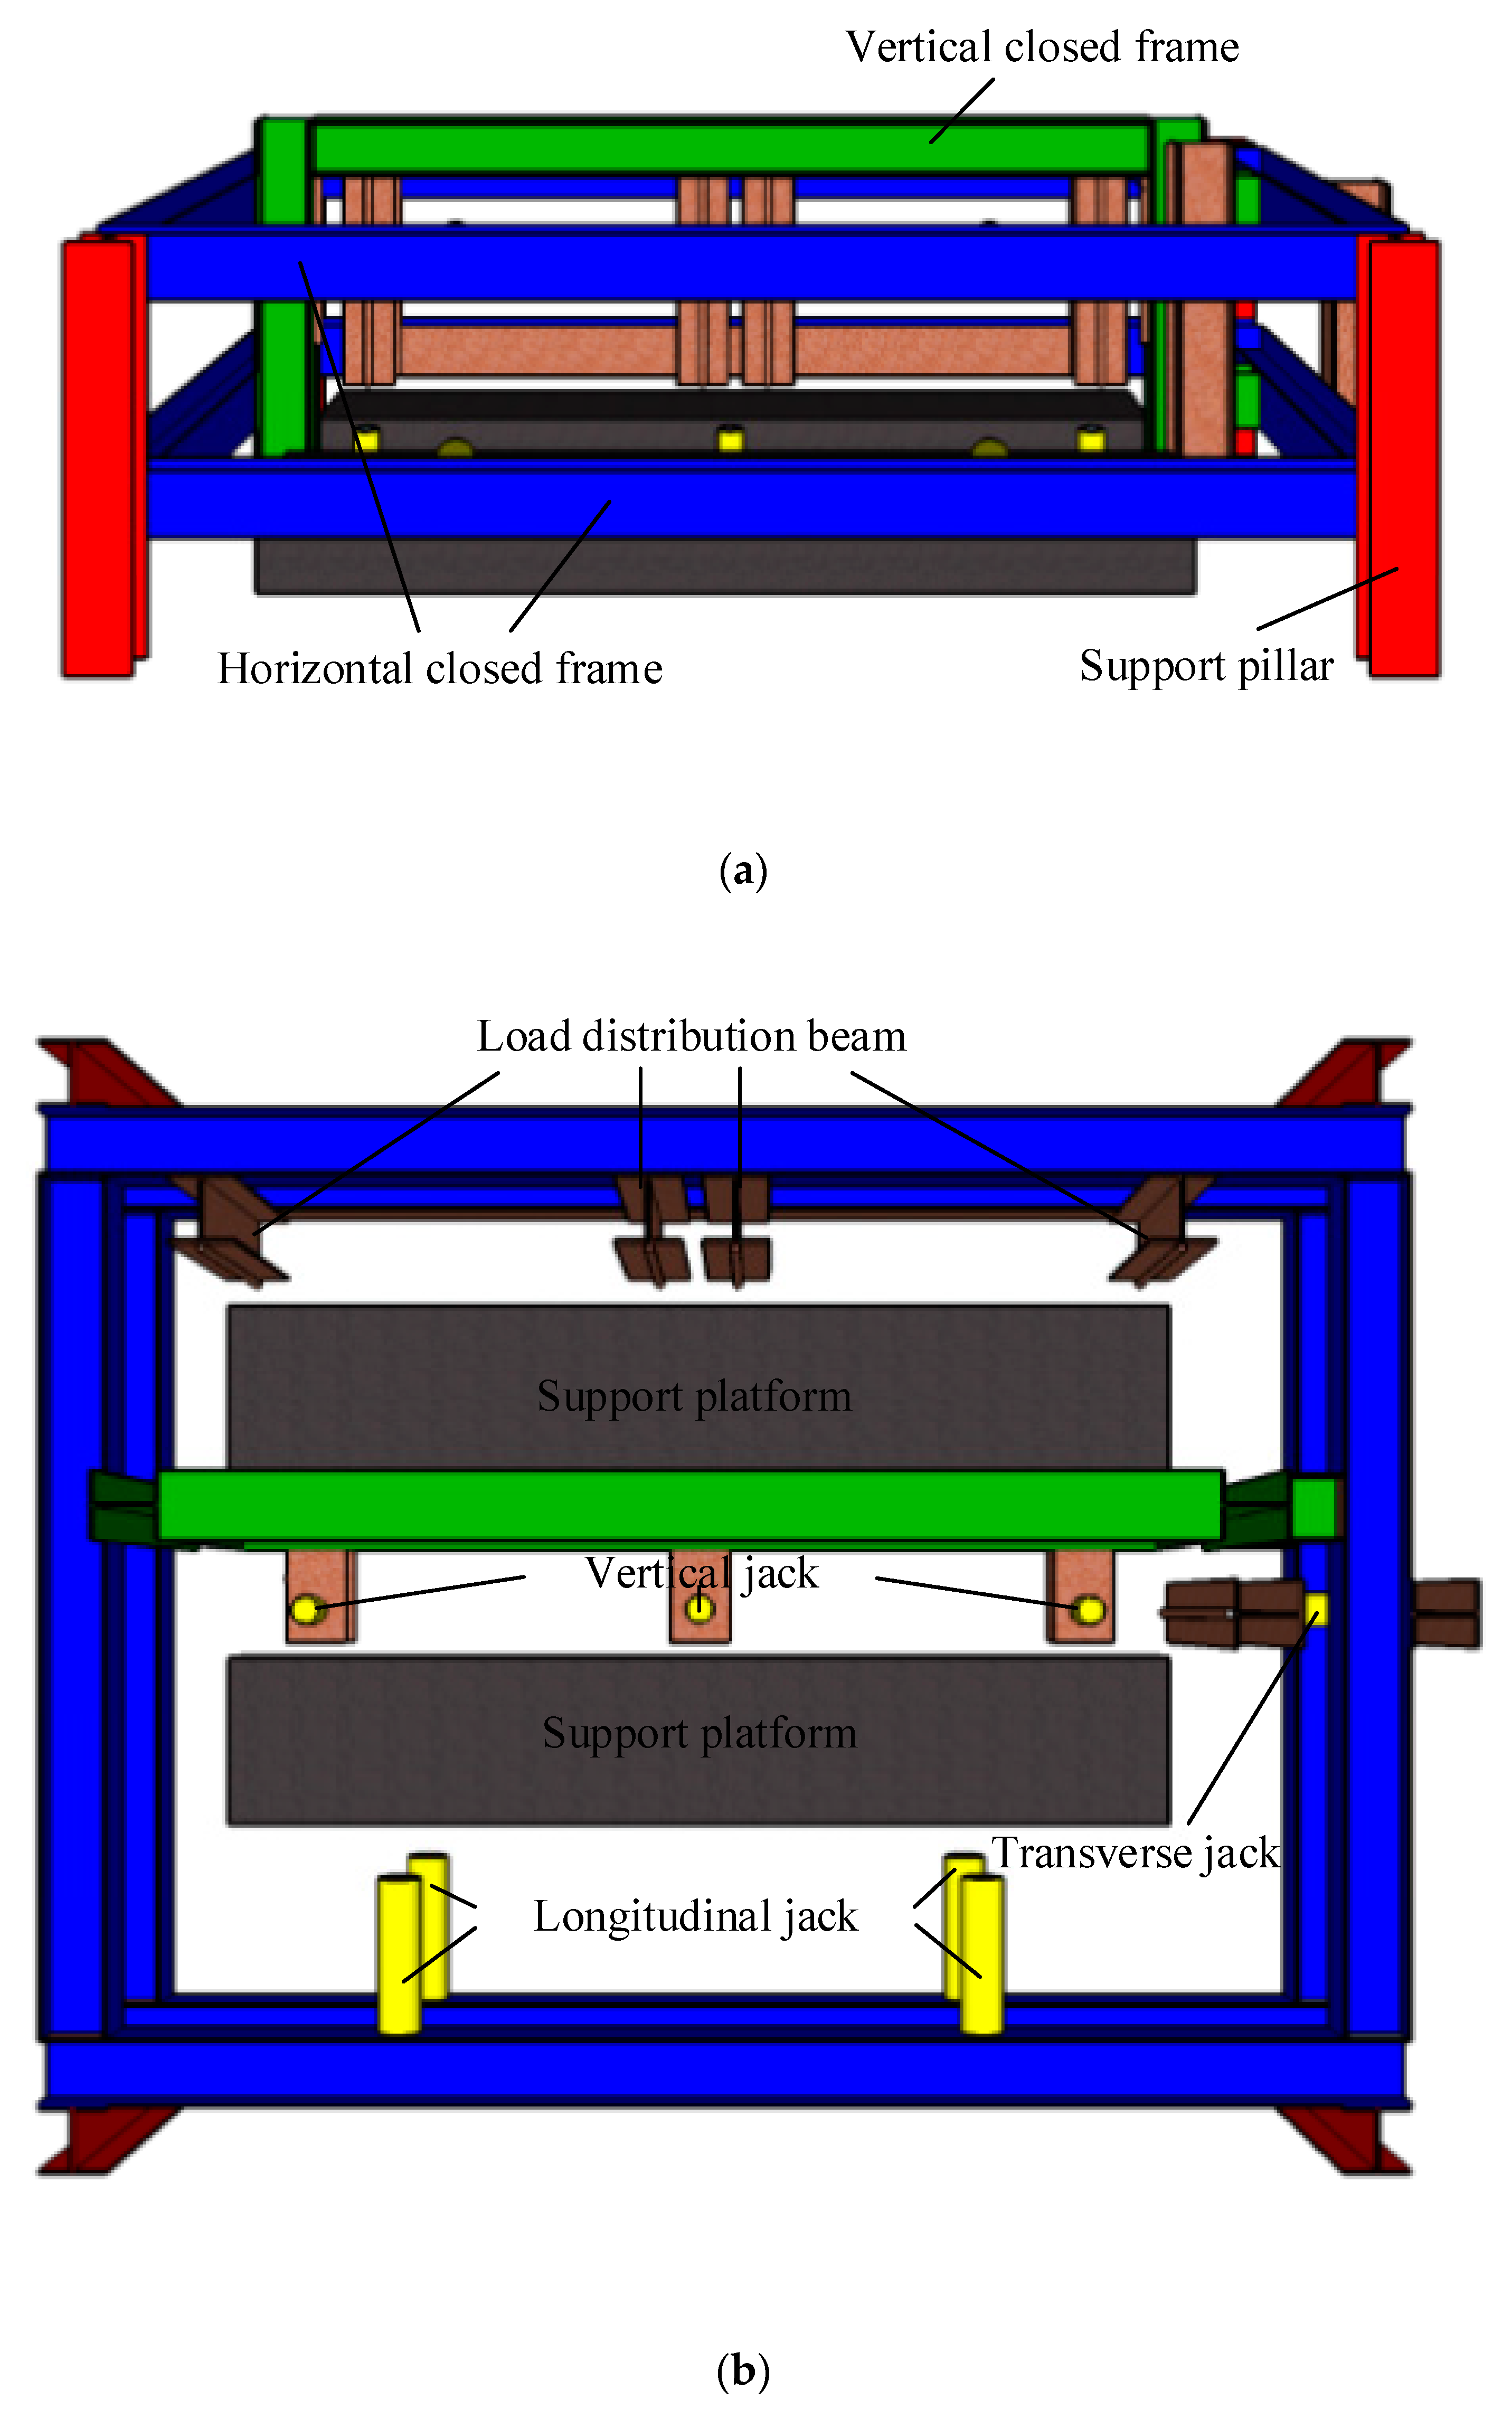
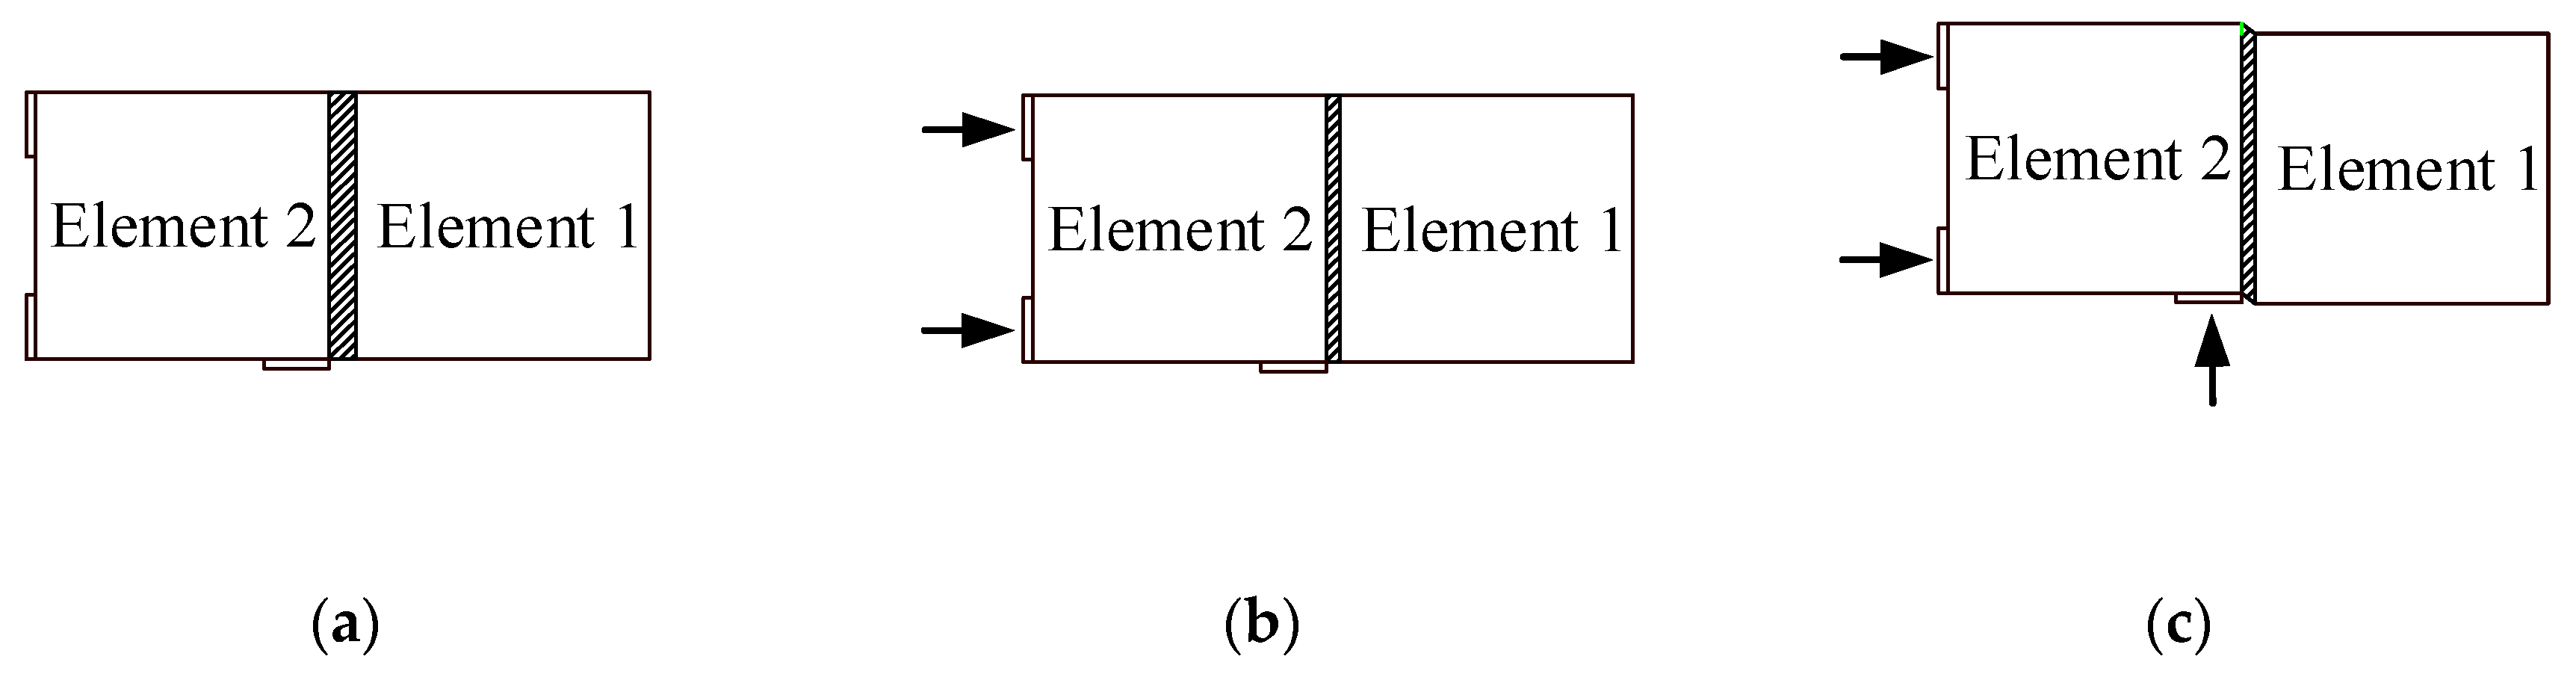
The GINA rubber gasket adopted in this experiment is manufactured with neoprene material from a Chinese neoprene rubber manufacturer. The dimensions and profile of the GINA rubber gasket are shown in Figure 4a. The length of this gasket is 14.27 m. As shown in Figure 4b, the GINA rubber gasket is fixed on the embedded steel plates to avoid horizontal and axial slip or fall-off when subjected to external force. Figure 4c shows the performance curves of the GINA rubber gaskets.

2.2. Loading System

In this experiment, the loads are designed to be simultaneously applied in three directions, i.e., longitudinal, transverse, and vertical directions. To achieve this loading scheme, a multidimensional and multidirectional self-balancing loading system is developed. The system consists of a self-balancing reaction framework, support platforms, and a loading device. Hence, the loading system can be loaded in multiple directions, and this system is also self-balancing without any extra facilities such as anchors or reaction walls.
As shown in Figure 5, the self-balancing framework mainly consists of two horizontal closed frames (blue), one vertical closed frame (green), four support pillars (red), two support platforms (black), and several load distribution beams (brown). Each horizontal closed frame (blue) is made of a loading beam, a reaction beam, and two tension beams. The tension beams are connected by connection plates and bolts; the beams are under axial tension. The loading beams provide the reaction force in the longitudinal direction via four jacks (yellow) in the front. The vertical closed frame (green) is made of two bending beams and two tension beams. The tension beams are parallelly installed on the two tension beams of the horizontal closed frames (blue) in the vertical direction. Two bending beams are installed on the top and the bottom of the vertical closed frame (green), respectively. The four support pillars (red) are fixed on the ground and are used to support the horizontal closed frameworks. The support platforms (black) are used to place the tunnel elements (grey). The load distribution beams (brown) are used to support the jacks (yellow) and provide uniformly distributed reaction force. The horizontal closed frames restrain the horizontal displacement of element 1 (grey). The vertical closed framework ensures that element 1 (grey) does not experience vertical displacement under any condition. Three vertical jacks (yellow) provide the vertical shear load at the bottom of element 2 (grey), while one horizontal jack (yellow) provides the transverse shear load from the right side. The on-site loading system can be seen in Figure 5d.

2.3. Arrangement of Displacement Measuring Points

To obtain the displacements of the immersion joint in three directions during the loading process, guide bar displacement gauges are used in the experiment. There are six measuring points in total, which are divided into two groups. As shown in Figure 6, three measuring points (1 through 3) are arranged in parallel at the top of the inner cavity of element 2, whereas the other three measuring points (4 through 6) are arranged in parallel at the bottom. One axial displacement gauge, one horizontal displacement gauge, and one vertical displacement gauge, labeled AD, HD, and VD, respectively, are placed at each measuring point to measure the relative displacements in the longitudinal, transverse, and vertical directions of the joint, respectively. The gauges have the same labels as the measuring points, which are also shown in Figure 6.

3. Loading Cases

3.1. Loading Protocol

According to the research focus of this experiment, it is more appropriate to study the mechanical performance of the structure under clear load conditions. Hence, a load-controlled loading method is determined. Moreover, longitudinal compressive loading, transverse shear loading, and vertical shear loading are considered. A longitudinal compressive load is applied in front of element 2 to simulate water pressure on the joint. A transverse shear load is applied horizontally on the right side of element 2 to simulate possible transverse shear actions caused by earthquakes or wave impacts. A vertical shear load is applied vertically on the bottom of element 2 to simulate the possible vertical shear actions caused by differential settlements. To obtain time histories of the loading forces during the entire process, a semi-automatic servo-controlled actuator is adopted in the experiment. This servo-controlled actuator can control the jacks, thereby applying the loads in a stepwise manner until reaching the target values.
Compared with the longitudinal compressive load and the transverse shear load, the vertical shear load is more difficult to implement due to the gravity of the element. The free body diagram during the vertical loading process is shown in Figure 7. Apparently, when the vertical shear load is applied, element 2 will have a tiny rotational displacement along the left endpoint of the support platform. The equations of equilibrium can be obtained as shown in Equation (2).
{ M =   0 , G cos θ L / 2 ( F v S ) L = 0 F =   0 , G cos θ + S F n Cos θ F v = 0 ,
where G , F n , F v , S , L , and θ represent the gravity of the element, the supporting force provided by the support platform, the vertical shear load applied by the jacks, the total shear force carried by the joint, the length of the element, and the rotation of element 2 along the left endpoint of the support platform, respectively.
The shear force ( S ) carried by the joint can be obtained by eliminating F n from Equation (2).
S = F v G cos θ / 2
Because the rotational displacement of element 2 ( θ ) is very small, cos θ 1 . Therefore, Equation (3) can be simplified as shown in Equation (4).
S = F v G / 2
Hence, theoretical values of the shear force carried by the joint can be obtained with Equation (4). Since the weight of a single element is 14 tons, i.e., the gravity ( G ) is 140 kN, there will be a positive shear force ( S ) after the vertical shear load ( F v ) reaches 70 kN.

3.2. Compression–Vertical Shear Test

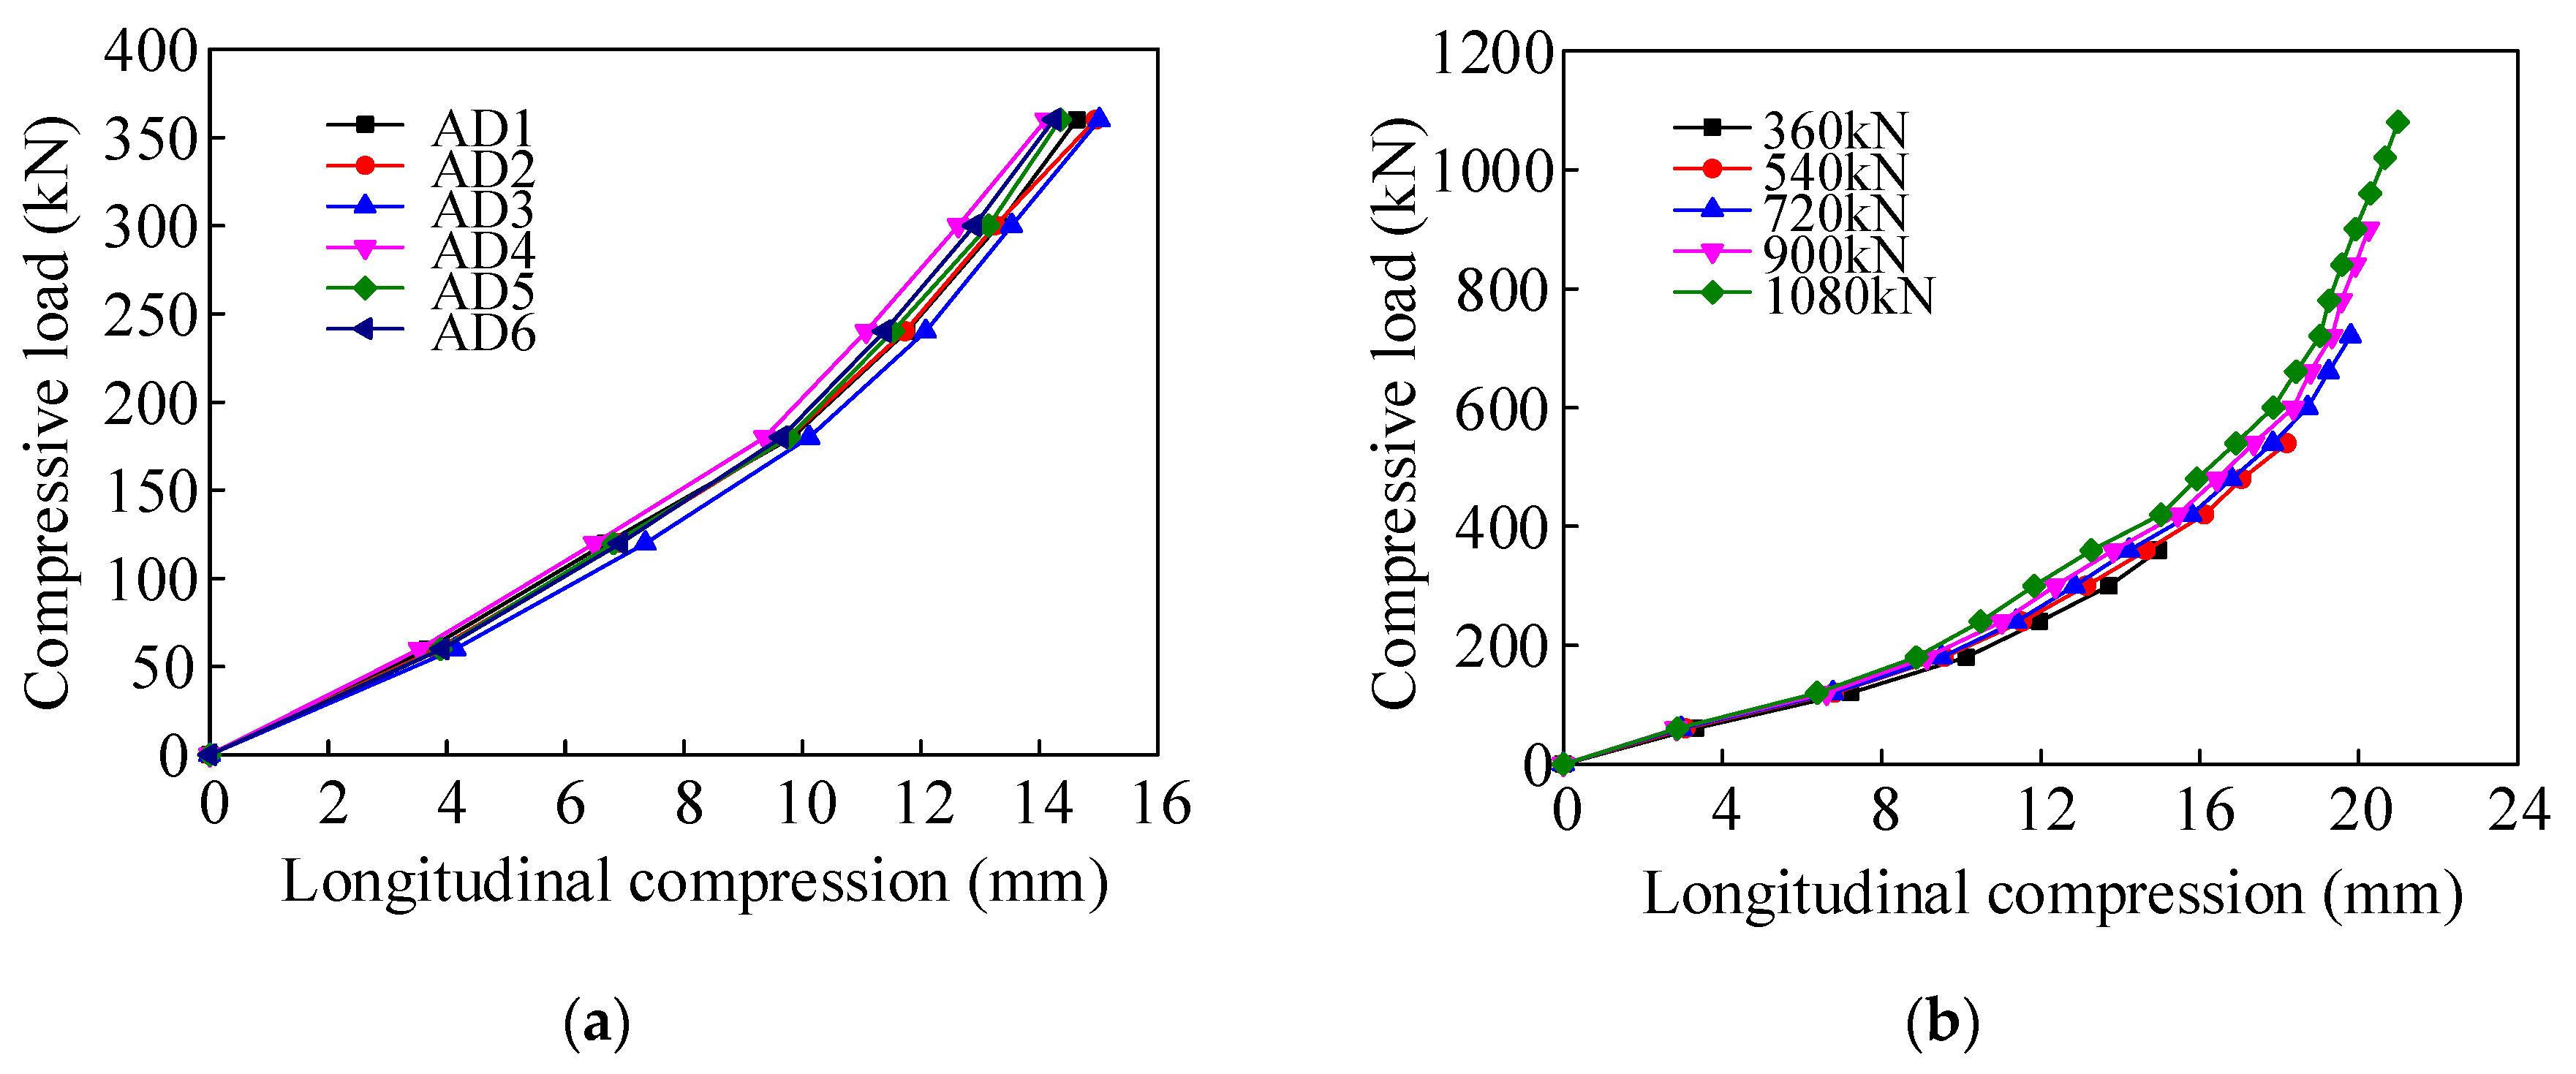
3.2.1. Compression–Vertical Shear Test Subjected to Incremental Longitudinal Compressive Loads

The side view of the loading process is shown in Figure 8. The longitudinal compressive load is first applied by the jacks on the front of element 2 (see Figure 8b). Then, the vertical shear load is applied by the jacks on the bottom in a stepwise manner (see Figure 8c). In the unloading process of each case, the vertical shear load is unloaded first. Then, the longitudinal compressive load follows. When the immersion joint has returned to the initial state, the following case can be initiated. Since the tunnel elements are located at different water depths, the water pressure on the immersion joint varies with respect to the location. In this test, the longitudinal compressive loads are limited within the range of possible water pressures corresponding to the minimum and the maximum water tightness requirements in normal working conditions of immersion joints. The calculated values of the minimum and the maximum longitudinal compressive loads in the test are 360 and 1080 kN, respectively. Hence, five cases of incremental compressive loads are designed, i.e., 360, 540, 720, 900, and 1080 kN.
According to the Chinese code (JGJ/T 101-2015), the vertical shear load is designed as 350 kN, which is approximately 40% of the estimated shear capacity of the vertical steel shear keys. At the beginning of each case, the longitudinal compressive load is applied gradually until reaching the target value. The vertical shear load is first increased to 70 kN, while the longitudinal compressive load remains constant. Afterwards, the vertical shear load will be exerted in seven incremental steps, in which each increment is 50 kN. At the end of every step, there will be a 3-minute gap to allow the joint to stabilize. Then, the vertical shear load and the longitudinal compressive load are sequentially unloaded. The next case will start once the joint returns to the initial state. The loading conditions of the five cases are shown in Table 1.

3.2.2. Compression–Vertical Shear Destruction Test

The focus of this test is the destruction of the joint under vertical shear actions. First, the definition of destruction of the joint should be declared. The destruction of the joint is defined as the state in which the shear resistance of the joint is lost. More specifically, the destruction state will be reached once the shear keys of the joint are broken or no longer fixed to the element, resulting in an inability to carry the shear load.
Taking the water tightness of the immersion joint into account, the minimum longitudinal compressive load (360 kN) is considered as a representative of the water pressure on the immersion joint under the severest condition of the normal work state. The damage phenomenon of the immersion joint subjected to a 360 kN longitudinal compressive load should be the most obvious one among all the cases of different longitudinal compressive loads. Hence, the minimum longitudinal compressive load (360 kN) is selected in the compression–vertical shear destruction test. The loading process of this test is the same as that of the compression–vertical shear test in Section 3.2.1. After the longitudinal compressive load is first applied, the vertical shear load will be gradually increased until reaching the destruction of the joint. The vertical shear load is first raised to 70 kN, and then, the shear load is increased in ten equal increments of 50 kN. There is a 3-minute gap at the end of each increment. After the vertical shear load reaches 570 kN, each increment is reduced to 20 kN until reaching the destruction of the joint. The loading steps are shown in Table 2.

3.3. Compression–Bidirectional Shear Test

This test investigates the vertical shear behaviors of the immersion joint subjected to both longitudinal compressive load and transverse shear load. As mentioned in Section 3.2.2, the case subjected to the minimum longitudinal compressive load of 360 kN is the severest and most representative condition. Hence, the longitudinal compressive load is fixed at 360 kN in the compression–bidirectional shear test. According to the Chinese code (GB 50010-2010), the transverse shear load is set to 80 kN, which ensures that the concrete shear keys are still in the elastic stage. As mentioned in Section 3.2.1, the vertical shear load is the same value of 350 kN.
To achieve the goal of compression–bidirectional shear, the longitudinal compressive load is applied first, which will remain constant after reaching the target value of 360 kN. Afterwards, the transverse shear load is applied, which will remain constant after reaching the target value of 80 kN. Following the same process as that used in Section 3.2.1, the vertical shear load is applied as 70 kN first, after which the load will be gradually increased in seven increments until reaching 350 kN. The loading steps are shown in Table 3.

4. Results and Analysis

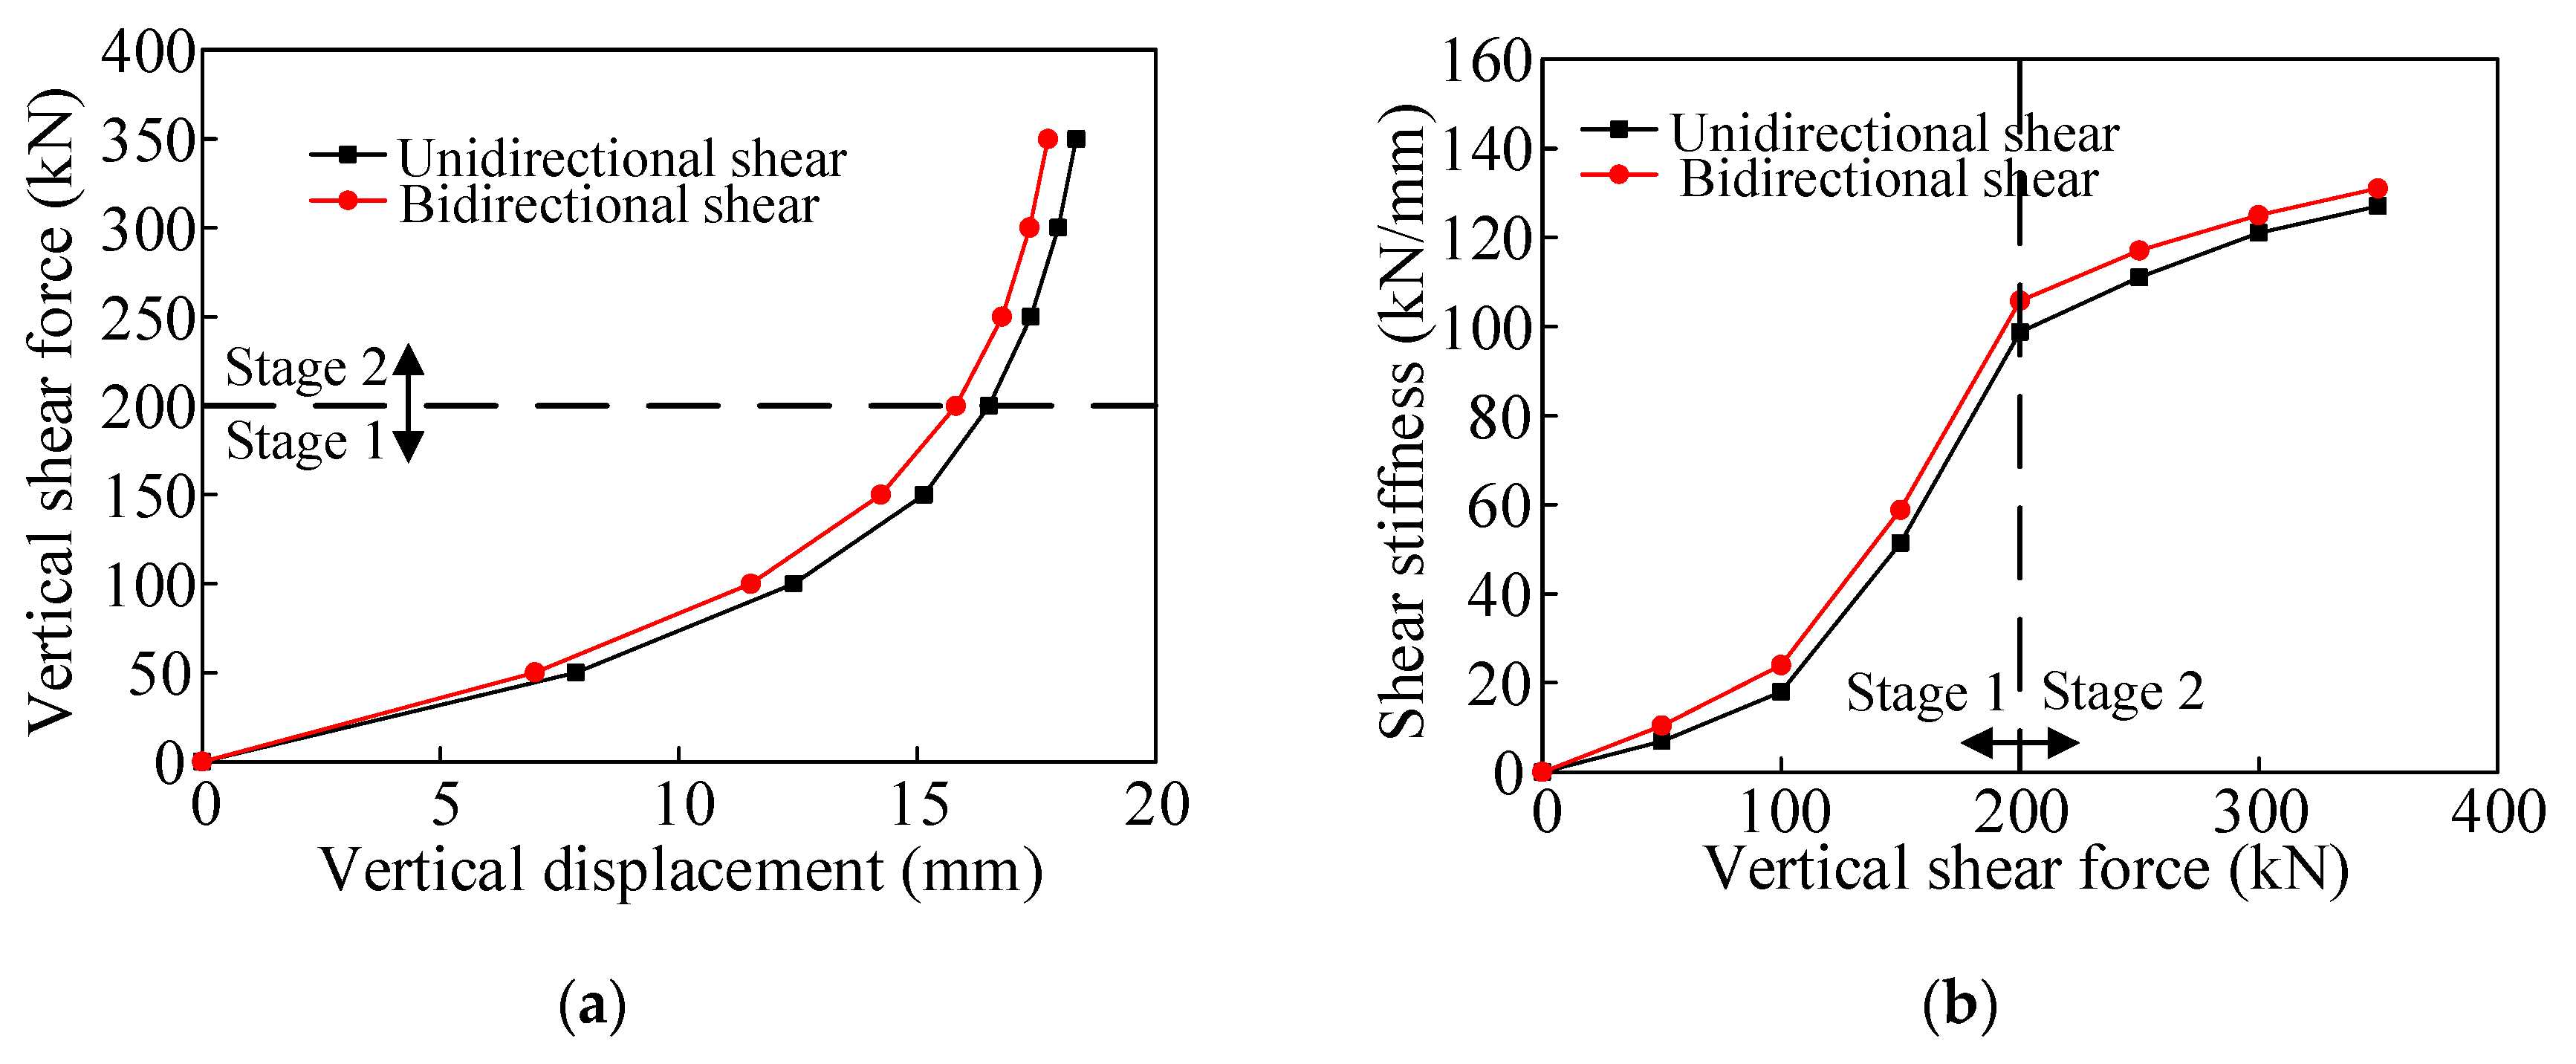
4.1. Vertical Shear Behaviors in Compression–Vertical Shear Test

4.1.1. Longitudinal Compression

Figure 9a shows the relational graph between the data from the six AD gauges with the longitudinal compressive load of 360 kN. The differences in displacements among the gauges are within 1.5 mm, which can be considered as normal measurement error. Hence, the longitudinal compression of the joint can be calculated by the average value of the six AD gauges. Figure 9b shows that the longitudinal compression of the joint increases with increasing compressive load. The difference between the compressions under the maximum and the minimum longitudinal compressive loads is 6.1 mm. Meanwhile, the gradient of each curve increases with increasing longitudinal compressive load, which indicates that the compressive stiffness of the GINA rubber gasket is strengthened through continuous loading and unloading.

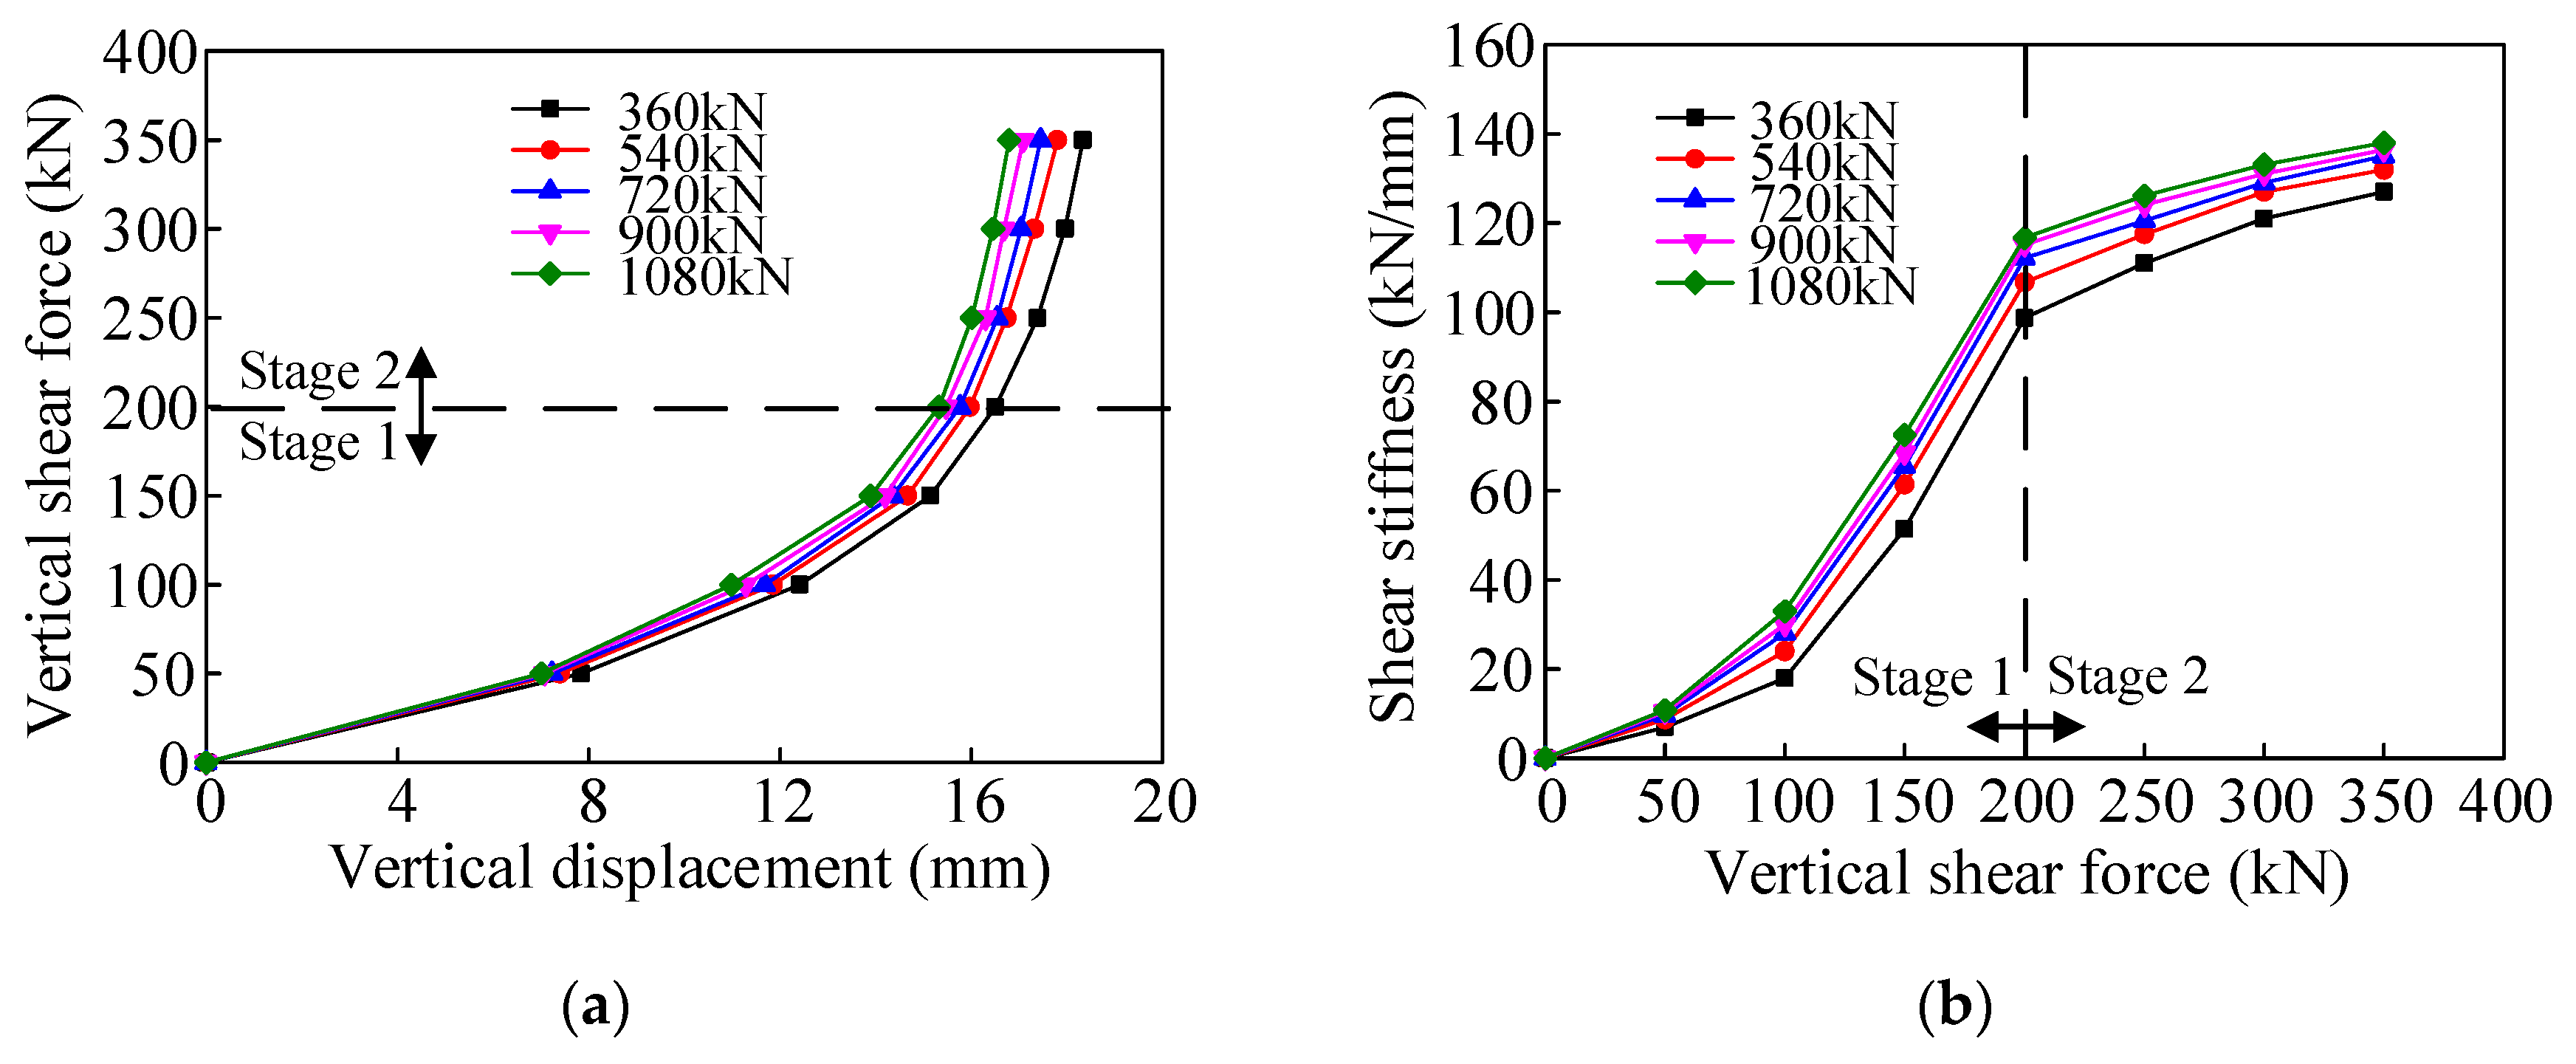
4.1.2. Shear Force–Displacement Curves

Note that the values of the vertical shear force in Figure 10 have already excluded 70 kN. Similar to the longitudinal compression discussed in Section 4.1.1, the vertical displacement can also be calculated by the average values of the six VD gauges. The shear force–displacement curves subjected to incremental longitudinal compressive loads are plotted in Figure 10a. In general, Figure 10a shows that the gradients of the shear force–displacement curves increase with increasing longitudinal compressive loads. Furthermore, all the shear force–displacement curves can be divided into two stages.
Stage 1 is the non-linear development stage. This stage starts from the beginning of the test to a vertical shear force of 200 kN. In this stage, the main behavior of the joint is the compression of the rubber bearings. Due to the non-linear compressive stiffness of the rubber bearings, the shear force–displacement curves in stage 1 also exhibit a non-linear development trend, in which the displacement increases rapidly after the primary load is applied.
Stage 2 is the quasi-linear development stage. This stage starts after the vertical shear force reaches 200 kN. In this stage, the shear resistance provided by the steel shear keys is gradually enhanced and finally occupies the main shear capacity of the joint. Due to the tight compression, the compressive stiffness of the rubber bearings gradually increases to be equal to the shear capacity of the steel shear keys. Therefore, the displacement increase with respect to the growth of the vertical shear force is slower in stage 2 than in stage 1, and the shear force–displacement curves exhibit a quasi-linear development trend.
It can be seen that the shear force–displacement curves subjected to incremental longitudinal compressive loads exhibit the same increasing trend. However, the gradient of each curve varies from the minimum compressive load to the maximum compressive load.

4.1.3. Vertical Shear Stiffness

The vertical shear stiffness can be defined as shown in Equation (5).
k s = Δ P Δ d ,
where k s , Δ P , and Δ d represent the vertical shear stiffness of the immersion joint, the increment of the shear force, and the increment of the displacement, respectively. The vertical shear stiffnesses values calculated by Equation (5) are shown in Figure 10b. Similar to the shear force–displacement curves in Section 4.1.2, the curves of the vertical shear stiffnesses are also divided into stage 1 and stage 2.
In general, the vertical shear stiffness increases with increasing shear force. However, the gradients of the vertical shear stiffnesses increase with increasing shear force in stage 1, whereas these gradients decrease rapidly in stage 2 and have a trend to approach zero. From the beginning to a shear force of 50 kN, all the curves are basically coincident. After the shear force reaches 50 kN, the curves start to exhibit different gradients, indicating that the vertical shear stiffness increases with increasing longitudinal compressive load. Comparing the two cases subjected to the longitudinal compressive loads of 360 and 540 kN, the vertical shear stiffness increases significantly after the shear force reaches 50 kN. Beyond the longitudinal compressive load of 540 kN, the shear stiffness increase is gradually reduced as the longitudinal compressive load increases. In stage 2, the gradients of the vertical shear stiffnesses subjected to different longitudinal compressive loads have a trend to become stable. Under the vertical shear force of 350 kN, the vertical shear stiffnesses subjected to the longitudinal compressive loads of 540, 720, 900, and 1080 kN are 6.8%, 9.4%, 10.9%, and 11.8% greater than that subjected to a longitudinal compressive load of 360 kN, respectively.
Based on the analysis in Section 4.1.1, the longitudinal compression of the GINA rubber gasket increases with increasing longitudinal compressive load. The pressure of the GINA rubber gasket on the steel shell of element 1 increases due to a larger compression, resulting in a greater friction on the steel shell. However, in the early vertical loading process, a vertical dislocation deformation (as shown in Figure 11) occurs on the GINA rubber gasket, which is the reason why all the curves are basically coincident below a vertical shear force of 50 kN. Afterwards, the dislocation deformation reaches the limit and a relative displacement occurs between the GINA rubber gasket and the steel shell, resulting in a friction force that shares part of the vertical shear force. The friction increases with the growth of the longitudinal compressive load. Hence, the vertical shear stiffness of the joint increases when subjected to a larger longitudinal compressive load.

4.2. Vertical Shear Behaviors in Compression–Bidirectional Shear Test

4.2.1. Shear Force–Displacement Curves

As stated in Section 4.1.2, the values of the vertical shear force in the following figures have already excluded 70 kN. The red line in Figure 12a represents the shear force–displacement curve of the joint in the compression–bidirectional shear test, where both a longitudinal compressive load of 360 kN and a transverse shear load of 80 kN are applied. The black line represents the shear force–displacement curve of the joint in the compression–shear test, where only a longitudinal compressive load of 360 kN is applied. A comparison of the two curves shows that the shear force–displacement curve in the compression–bidirectional shear test consists of the same two stages as those shown in Figure 10a. However, the gradient of the curve in the compression–bidirectional shear test is larger than that in the compression–unidirectional shear test, which means that the vertical shear stiffness in the compression–bidirectional shear test is greater.

4.2.2. Vertical Shear Stiffness

Figure 12b shows the curves of the vertical shear stiffness in the compression–bidirectional shear test (red) and in the compression–unidirectional shear test (black). Unlike the results in the compression–vertical shear test, the two curves show different growth trends from the very beginning, indicating that the vertical shear stiffness in the compression–bidirectional shear test is greater than that in the compression–unidirectional shear test from the beginning. However, the difference between the vertical shear stiffnesses in the two cases becomes larger after the vertical shear force reaches 50 kN, and this difference remains approximately the same to the end. In stage 2, the difference has a trend to become stable, and the vertical shear stiffness in compression–bidirectional shear test is 5.3% greater than that in the compression–unidirectional shear test under the vertical shear force of 350 kN.
As stated, the horizontal concrete shear keys will contact each other once the transverse shear load is applied. The friction generated between the horizontal shear keys will share part of the shear force and enhance the vertical shear stiffness during the vertical loading process. Therefore, the vertical shear stiffness in the compression–bidirectional shear test is greater than that in the compression–unidirectional shear test from the very beginning. As aforementioned, due to the vertical dislocation deformation of the GINA rubber gasket, the friction between the GINA rubber gasket and the steel shell takes place after the vertical shear force reaches 50 kN, resulting in a larger difference between the vertical shear stiffnesses in the two cases.

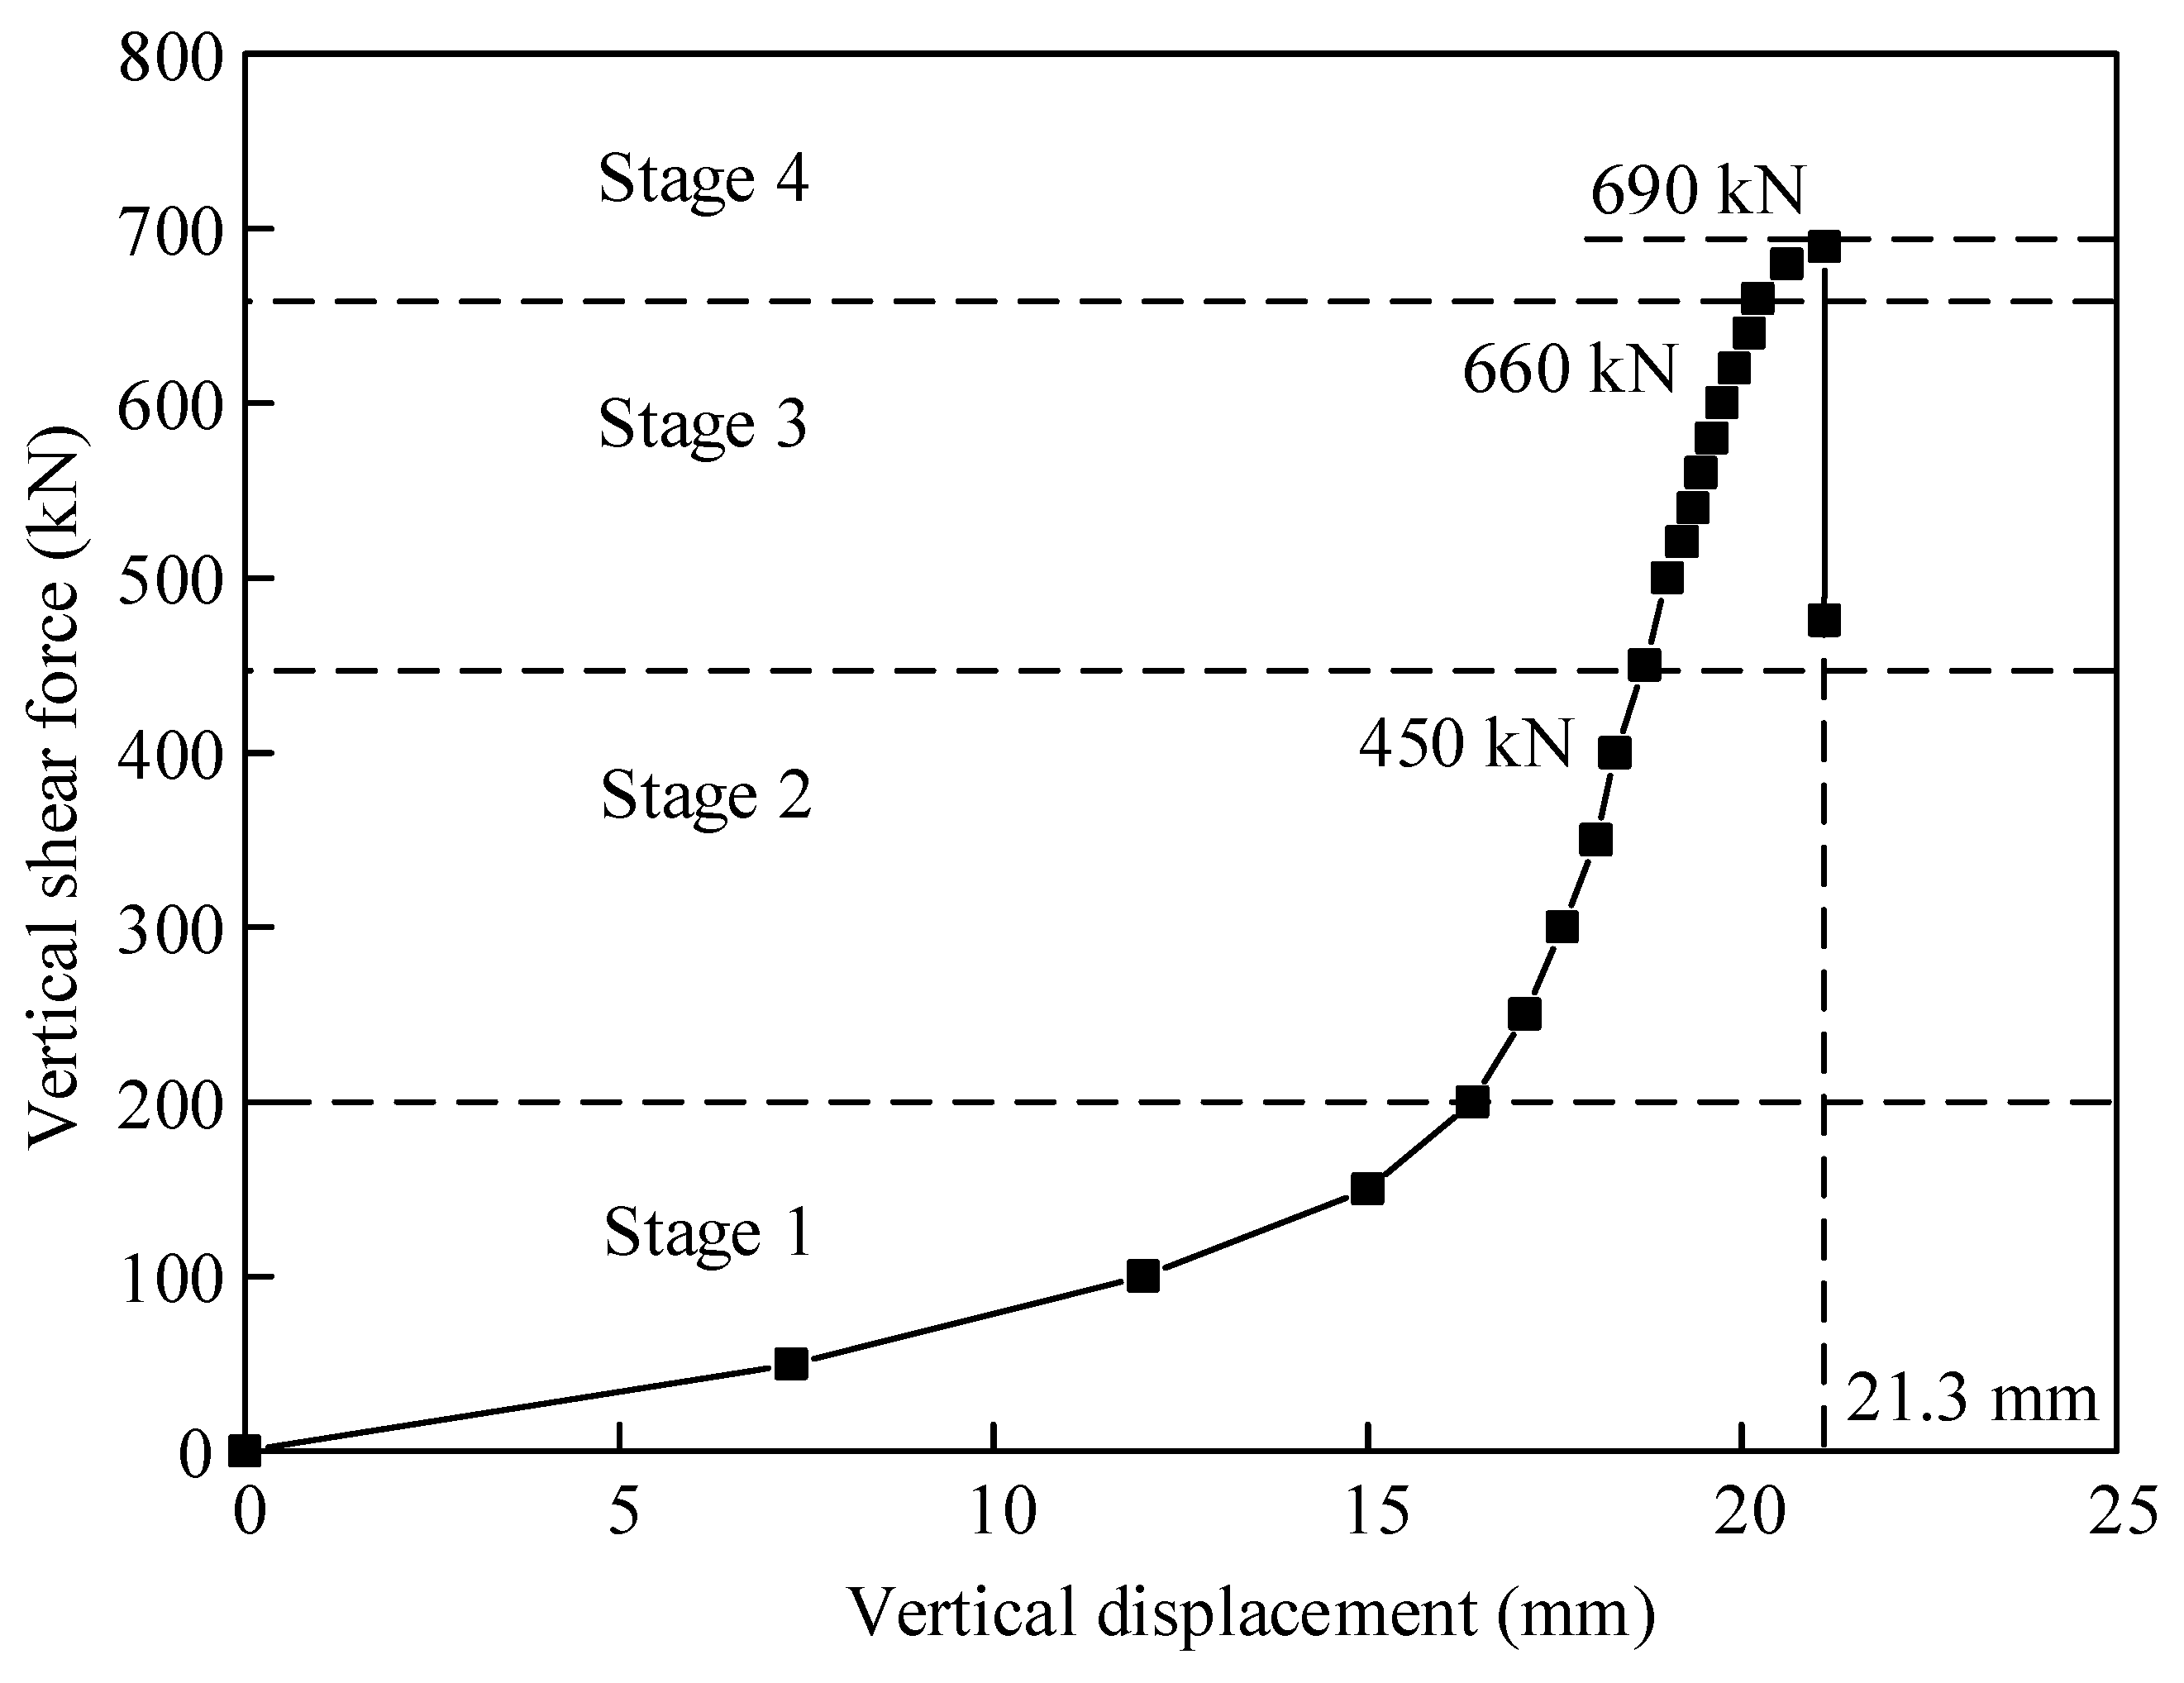
5. Vertical Shear Failure of the Joint

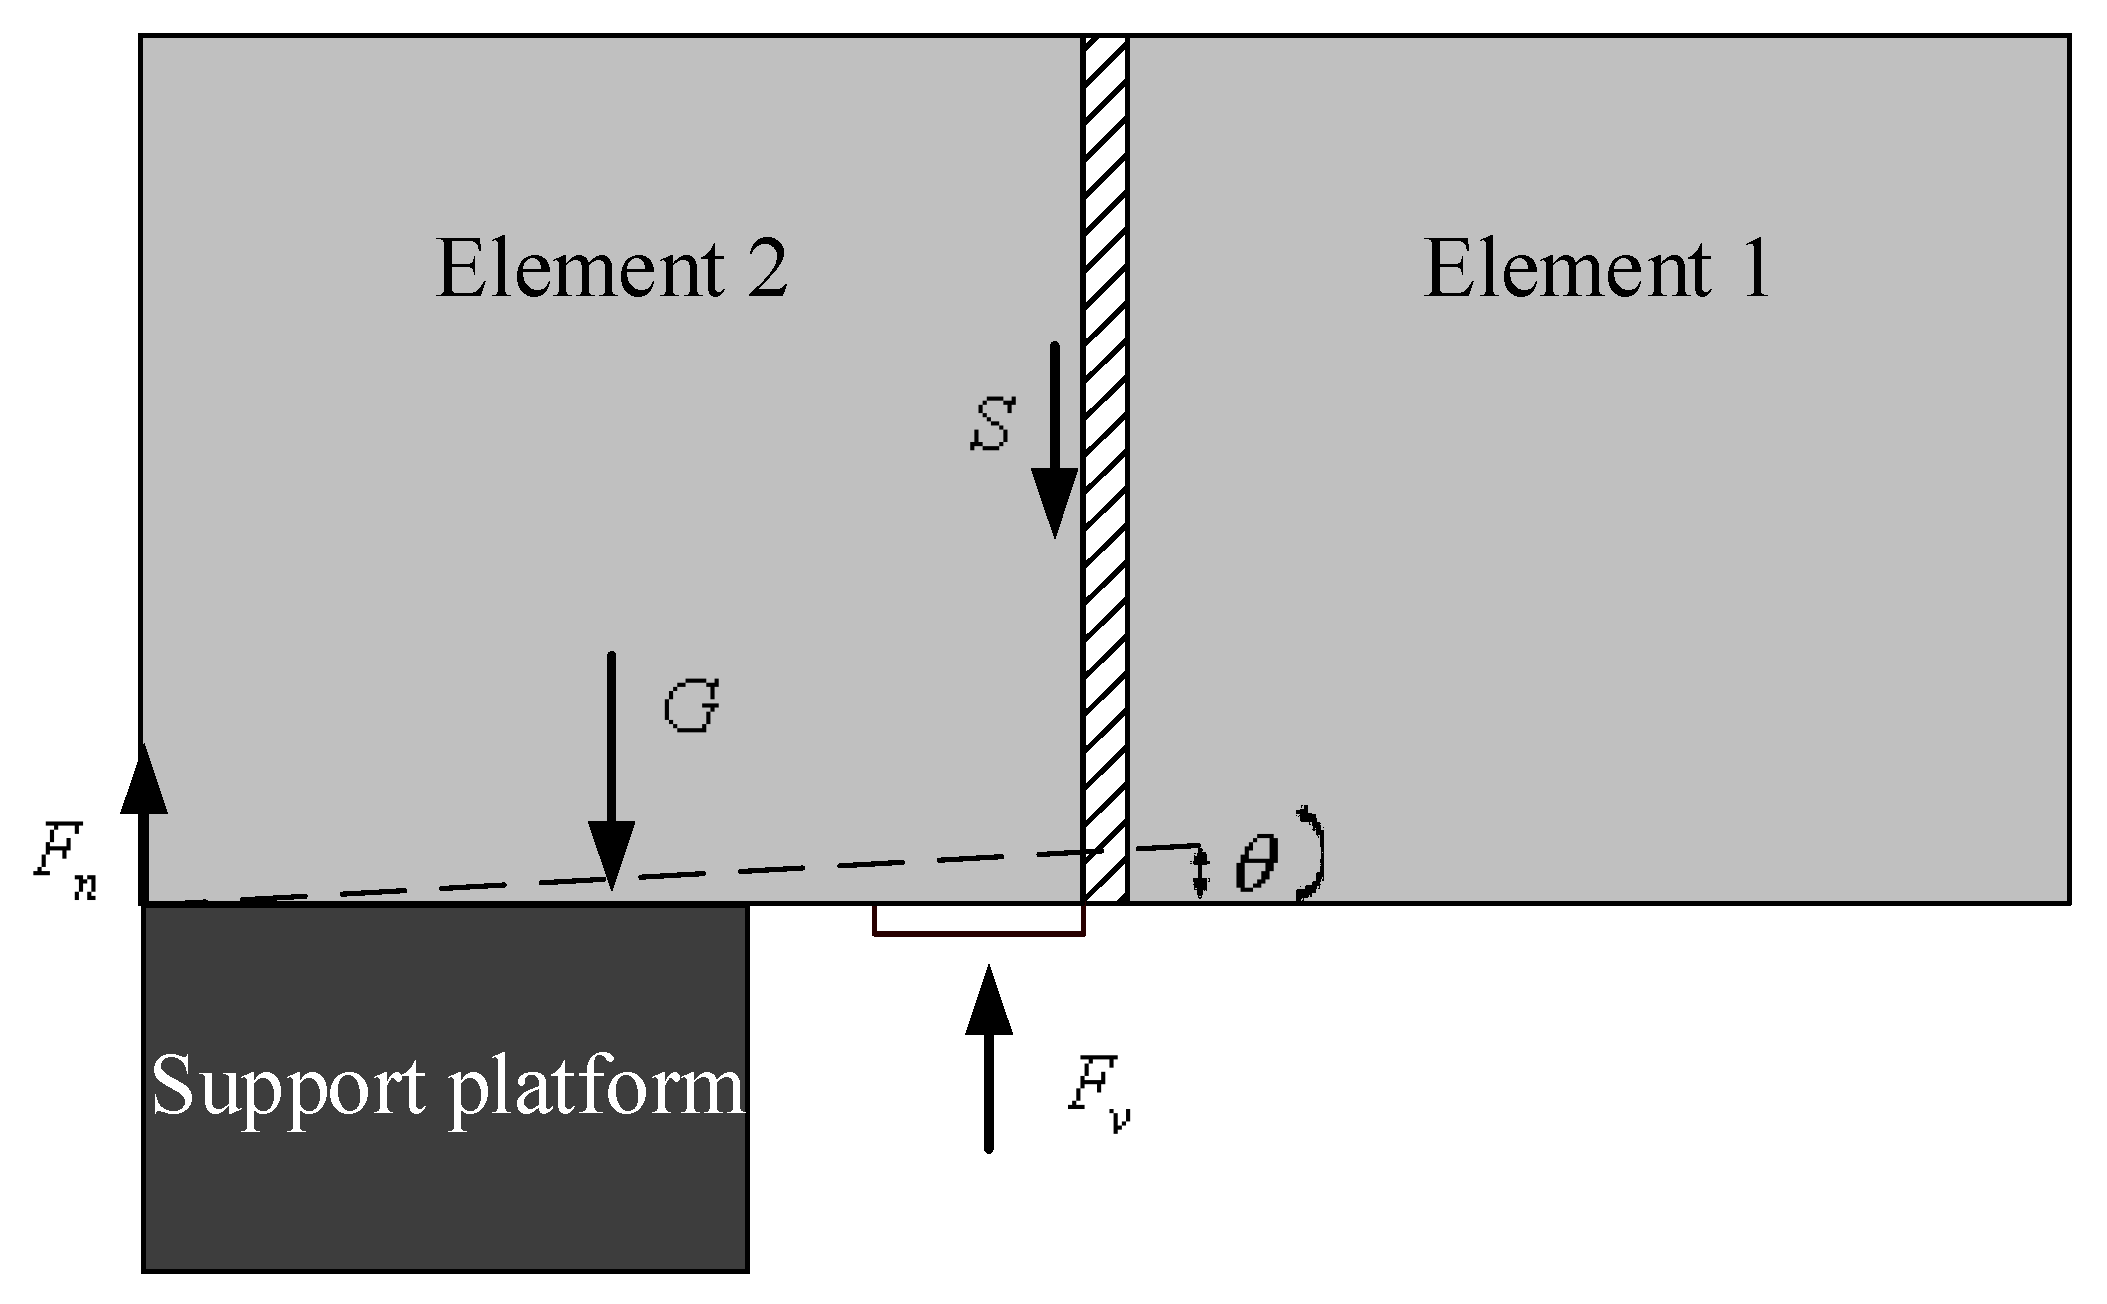
5.1. Ultimate Shear Capacity

Figure 13 shows the shear force–displacement curve of the joint in the compression–vertical shear destruction test, which can be divided into four stages. Similar to the above analysis, stage 1 is mainly the compression of the rubber bearings, which exhibits a non-linear development from the very beginning to a vertical shear force of 200 kN. Stage 2 represents a state where the shear resistance provided by the steel shear keys is gradually enhanced and finally occupies the main shear capacity of the joint, which exhibits a quasi-linear development from the vertical shear force of 200 to 450 kN. From the vertical shear force of 450 to 660 kN, stage 3 is a state where the shear resistance of the joint is mainly provided by the steel shear keys. From the vertical shear force of 660 to 690 kN, stage 4 is a short plastic failure state, which means that the joint reaches the yield state until the destruction state is quickly reached. After the vertical shear force reaches 690 kN, the shear force suddenly drops to 475 kN, and the jacks fail to apply larger vertical shear load. Hence, this situation is defined as the destruction state of the joint.
It can be obtained from Figure 13 that the ultimate shear capacity of the joint is 690 kN, and the final vertical shear displacement is 21.3 mm. In the design, the shear capacity is assumed to be the sum of the shear capacities of all steel shear keys. However, the ultimate shear capacity of the joint (690 kN) obtained in this test is smaller than the sum of those of all steel shear keys (880 kN). Note that the obtained ultimate shear capacity of the joint is contributed by both the steel shear keys and the GINA rubber gasket. Hence, a conclusion can be made that not all the shear keys carry the shear force simultaneously, which is consistent with the conclusion reported in the literature [17]. Because of the deviations in installation and location, the steel shear keys in different sets do not contact each other simultaneously. Moreover, although the shear performance of the GINA rubber gasket can not be obtained in this test, the contribution of the gasket to the shear stiffness and the shear capacity of the joint should not be ignored.

5.2. Damage and Failure of the Joint

The damage phenomena can be observed in the end of the test. As shown in Figure 14a, the VSKA in the middle of the right sidewall of element 2 has fallen off from the embedded anchor plate. The other steel shear keys are still fixed on the elements. Figure 14b shows that the rubber bearing fixed on the fallen shear key is compressed until it burst, whereas the others are compressed but not broken. It can be concluded from the above observations that the shear keys of the right sidewall share more shear force than the others during the vertical loading process. Moreover, all the bolts of the fallen shear key are cut off, whereas no obvious deformations or cracks in the body of the fallen shear key or the other shear keys are found, indicating that the bolts contribute much to the shear capacity of a steel shear key. Furthermore, plastic extensions of the bolts are observed on the fracture surfaces in Figure 14c. Hence, it can be concluded that the bolts experience a short plastic state before complete failure, which conforms to the short period of the plastic failure state in the shear force–displacement curve in Figure 13 (i.e., stage 4).
These observations indicate that the failure of the joint is a single failure of one shear key on the sidewall, not a simultaneous failure of all the shear keys. In other words, the shear keys share different shear forces at the same time during the vertical loading process. When an individual shear key carries more shear force, the failure of that single shear key occurs, leading to the failure of the entire joint.
Generally, the shear keys are thought to evenly share the vertical shear force in the immersion joint. However, the results of the experiment show a specific and different conclusion, which challenges the general assumption in conventional designs.

6. Conclusions

This paper presents an experiment to investigate the vertical shear behaviors of an immersion joint with steel shear keys subjected to multidirectional loads. Three different specific loading cases are carried out, and the values of the applied loads as well as the displacements are obtained. Based on the results and analysis of the experiment, the following conclusions can be drawn:
(1) Below the vertical shear load of 350 kN, the shear force–displacement curves can be divided into two stages. Stage 1 is mainly the compression of the rubber bearings and exhibits a non-linear development. Stage 2 is where the shear resistance provided by the steel shear keys is gradually enhanced and finally occupies the main shear capacity of the joint, which exhibits a quasi-linear development. Moreover, due to a larger compression of the GINA rubber gasket, the vertical shear stiffness of the joint increases when subjected to a larger compressive load.
(2) As the transverse shear load is applied, friction will be generated because of the contact between the horizontal shear keys. Hence, the friction shares part of the shear force and enhances the vertical shear stiffness of the joint in the compression–bidirectional shear test.
(3) Because the shear keys do not carry the shear force simultaneously, the ultimate shear capacity of the joint (690 kN) turns out to be smaller than the sum of the shear capacities of all the vertical steel keys (880 kN). In addition, it can be deduced that the GINA rubber gasket contributes to the shear stiffness and shear capacity of the joint.
(4) The failure of the joint appears at the VSKA in the middle of the right sidewall. The rubber bearing fixed on this shear key is compressed until it bursts, and all the bolts are cut off. These phenomena indicate that the failure mode of the joint is a single failure of one shear key on the sidewall, which leads to a shear resistance failure of the entire joint.
It should be noted that limitations of the experiment still exist and subsequent research works also need to be done. This paper mainly introduced the design ideas, test procedures and test results of this experiment in detail, however the corresponding numerical simulation studies and validations will be introduced in the subsequent papers. Different kinds of the GINA rubber gaskets and temperature conditions should be taken into consideration in the future studies. Moreover, parametric analysis of different geometric parameters and component positions of the immersion joint should be taken into account as well.

Author Contributions

Conceptualization, Y.Y. and J.L.; methodology, H.Y.; software, J.L.; validation, Y.Y., J.L. and H.Y.; investigation, J.L.; resources, Y.Y.; writing—original draft preparation, J.L.; writing—review and editing, Y.Y.; supervision, Y.Y. and H.Y.

Funding

This research was funded by the National Key Research and Development Plan of China (2018YFC0809602 & 2017YFC1500703), and the National Natural Science Foundation of China (51778487 & 51678438).

Acknowledgments

The research has been supported by the National Key Research and Development Plan of China (2018YFC0809602 & 2017YFC1500703), and the National Natural Science Foundation of China (51778487 & 51678438). The above supports are greatly acknowledged.

Conflicts of Interest

The authors declare no conflicts of interest.

References

  1. Lunniss, R.; Baber, J. Immersed Tunnels, 1st ed.; CRC Press: London UK, 2013. [Google Scholar]
  2. Ai, Q.; Yuan, Y.; Mahadevan, S.; Jiang, X. Probabilistic degradation modelling of circular tunnels assembled from segmental linings. Struct. Concr. 2016, 17, 257–273. [Google Scholar] [CrossRef]
  3. Ai, Q.; Yuan, Y. State-oriented maintenance strategy for deteriorating segmental Lining of tunnel. J. Civ. Eng. Manage. 2018, 24, 469–480. [Google Scholar] [CrossRef]
  4. Ingerslev, C. Immersed and floating tunnels. Procedia Eng. 2010, 4, 51–59. [Google Scholar] [CrossRef]
  5. Grantz, W.C. Immersed tunnel settlements Part 1: Nature of settlements. Tunn. Undergr. Space Technol. 2001, 16, 195–201. [Google Scholar] [CrossRef]
  6. Grantz, W.C. Immersed tunnel settlements part 2: Case histories. Tunn. Undergr. Space Technol. Inc. Trenchless Technol. Res. 2001, 16, 203–210. [Google Scholar] [CrossRef]
  7. Aart, A.J.C.V.; Wet, J.V. The second Benelux tunnel. Tunn. Undergr. Space Technol. 1999, 14, 171–182. [Google Scholar] [CrossRef]
  8. Kiyomiya, O. Earthquake-resistant design features of immersed tunnels in Japan. Tunn. Undergr. Space Technol. 1995, 10, 463–475. [Google Scholar] [CrossRef]
  9. Odgaard, S.S.; Jensen, O.P.; Kasper, T.; Yoon, Y.-H.; Chang, Y.; Park, R.-Y. Design of long immersed tunnel for highway in offshore conditions Busan–Geoje Fixed Link. Tunn. Undergr. Space Technol. Inc. Trenchless Technol. Res. 2006, 21, 334. [Google Scholar] [CrossRef]
  10. Kasper, T.; Steenfelt, J.S.; Pedersen, L.M.; Jackson, P.G.; Heijmans, R.W.M.G. Stability of an immersed tunnel in offshore conditions under deep water wave impact. Coast. Eng. 2008, 55, 753–760. [Google Scholar] [CrossRef]
  11. Saveur, J.; Grantz, W.C. Chapter 3 structural design of immersed tunnels. Tunn. Undergr. Space Technol. 1997, 12, 93–109. [Google Scholar] [CrossRef]
  12. Akimoto, K.; Hashidate, Y.; Kitayama, H.; Kumagai, K. Immersed tunnels in Japan: Recent technological trends. In Proceedings of the 2002 Interntional Symposium on Underwater Technology (Cat. No.02EX556), Tokyo, Japan, 19 April 2002; pp. 81–86. [Google Scholar]
  13. Yu, H.T.; Xiao, W.H.; Yuan, Y.; Taerwe, L. Seismic mitigation for immersion joints: Design and validation. Tunn. Undergr. Space Technol. 2017, 67, 39–51. [Google Scholar] [CrossRef]
  14. Anastasopoulos, I.; Gerolymos, N.; Drosos, V.; Kourkoulis, R. Nonlinear response of deep immersed tunnel to strong seismic shaking. J. Geotech. Geoenviron. Eng. 2007, 133, 1067–1090. [Google Scholar] [CrossRef]
  15. Xiao, W.H.; Yuan, Y.; Yu, H.T.; Jing, L.; Chen, Y. Numerical Analysis of Mechanical Behaviours of Immersion Joint. In Proceedings of the 11th World Congress on Computational Mechanics (WCCM XI), Barcelona, Spain, 20–25 July 2014. [Google Scholar]
  16. Li, Z.X.; Li, C.H.; Yan, J.B. Seismic behaviour of hybrid-fibre reinforced concrete shear keys in immersed tunnels. Tunn. Undergr. Space Technol. 2019, 88, 16–28. [Google Scholar] [CrossRef]
  17. Xiao, W.H.; Yu, H.T.; Yuan, Y.; Taerwe, C.; Xu, G.P. Compression-shear behavior of a scaled immersion joint with steel shear keys. Tunn. Undergr. Space Technol. 2017, 70, 76–88. [Google Scholar] [CrossRef]
  18. Ding, W.Q.; Liu, P. Research on the Three Dimensional Nonlinear Stiffness Mechanical Model of Immersed Tube Tunnel Joints. In Proceedings of the Geo Shanghai, Shanghai, China, 26–28 May 2014. [Google Scholar]
  19. Anastasopoulos, I.; Gerolymos, N.; Drosos, V.; Georgarakos, T.; Kourkoulis, R.; Gazetas, G. Behaviour of deep immersed tunnel under combined normal fault rupture deformation and subsequent seismic shaking. Bull. Earthq. Eng. 2008, 6, 213–239. [Google Scholar] [CrossRef]
  20. Van Oorsouw, R.S. Behavior of Segment Joints in Immersed Tunnels Under seismic Loading. Master’s Thesis, Delft University of Technology, Delft, Netherlands, June 2010. [Google Scholar]
  21. Hu, Z.N.; Xie, Y.L.; Xu, G.P.; Bin, S.L.; Zhang, H.G.; Lai, H.P.; Liu, H.Z.; Yan, C.G. Segmental joint model tests of immersed tunnel on a settlement platform: A case study of the Hongkong-Zhuhai-Macao Bridge. Tunn. Undergr. Space Technol. 2018, 78, 188–200. [Google Scholar] [CrossRef]
  22. Bergsma, J.G.; Bakker, K.J.; Hart, C.M.P. Immersed tunnel design in subarctic rivers. Tunn. Undergr. Space Technol. 2017, 67, 158–166. [Google Scholar] [CrossRef]
  23. Cheng, X.J.; Jing, L.P.; Cui, J.; Li, Y.Q.; Dong, R. Shaking-table tests for immersed tunnels at different sites. Shock Vibr. 2017, 2017, 2546318. [Google Scholar] [CrossRef]
  24. Kiyomiya, O.; Higashiyama, Y.; Ohgoshi, Y.; Yokota, H. New type flexible joint for the Yumeshima Immersed Tunnel. Tunn. Undergr. Space Technol. 2006, 21, 331. [Google Scholar] [CrossRef]
  25. Kiyomiya, O.; Fujisawa, T.; Yamada, M.; Honda, M. Mechanical Properties of Flexible Joint Between Submerged Tunnel Elements; Report for Port and Harbour Research Institute: Yokosuka, Japan, 1992. [Google Scholar]
Figure 1. Immersion joint model (units: mm). (a) Cross-section of the joint; (b) 1-1 cross-section; (c) 2-2 cross-section.
Applsci 09 05056 g001
Figure 2. Prefabricated elements. (a) Element 1; (b) element 2.
Applsci 09 05056 g002
Figure 3. Details of the vertical steel shear keys (units: mm). (a) VSKA; (b) VSKB.
Applsci 09 05056 g003aApplsci 09 05056 g003b
Figure 4. GINA rubber gasket. (a) Dimensions and profile; (b) installation; (c) performance curve.
Applsci 09 05056 g004
Figure 5. Loading system. (a) Front view; (b) plan view; (c) side view; (d) on-site loading system.
Applsci 09 05056 g005aApplsci 09 05056 g005b
Figure 6. Arrangement of displacement gauges.
Applsci 09 05056 g006
Figure 7. Free body diagram in the vertical loading process.
Applsci 09 05056 g007
Figure 8. Side view of the loading process of compression–vertical shear test. (a) The initial state; (b) applying longitudinal compressive load; (c) applying vertical shear load.
Applsci 09 05056 g008
Figure 9. Longitudinal compression of the joint. (a) Data from the axial displacement (AD) gauges subjected to a compressive load of 360 kN; (b) compressions under incremental longitudinal compressive loads.
Applsci 09 05056 g009
Figure 10. Shear behaviors of the joint subjected to incremental compressive loads. (a) Shear force–displacement curves; (b) shear stiffness–shear force curves.
Applsci 09 05056 g010
Figure 11. Vertical dislocation deformation of the GINA rubber gasket. (a) Applying longitudinal compressive load; (b) applying vertical shear load.
Applsci 09 05056 g011
Figure 12. Shear behaviors of the joint subjected to bidirectional shear load. (a) Shear force–displacement curves; (b) shear stiffness–shear force curves.
Applsci 09 05056 g012
Figure 13. Shear force–displacement curve of the joint in the destruction test.
Applsci 09 05056 g013
Figure 14. Immersion joint model (units: mm). (a) Failure of the shear key; (b) broken rubber bearing; (c) cross-section of the fallen shear key.
Applsci 09 05056 g014
Table 1. Loading conditions of the compression–vertical shear test.
CaseLongitudinal Compressive Load (kN)Vertical Shear Load (kN)
1360420
2540420
3720420
4900420
51080420
Table 2. Loading steps of the destruction test.
StepLongitudinal Compressive Load (kN)Vertical Shear Load (kN)
13600
236070
3360120
4360170
360
10360570
11360590
12360610
360
Table 3. Loading steps of the compression–bidirectional shear test.
StepLongitudinal Compressive Load (kN)Transverse Shear Load (kN)Vertical Shear Load (kN)
136000
2360800
33608070
436080120
536080170
36080
1036080420

