1. Introduction
Reverse osmosis (RO) is a desalination process that removes salts and minerals from seawater or brackish water with a salinity of total dissolved solids (TDS) of ~1000–60,000 mg/L to produce clean water with less than 500 mg/L TDS [
1]. The RO process currently produces about 50% of the total desalinated water available worldwide [
2]; however, it also yields a huge amount of further concentrated brines (or RO reject water) with over ~10,000 mg/L TDS as a waste byproduct.
Currently, all desalination plants (e.g., RO, nanofiltration, multi-stage flash) globally produce 51.7 billion m
3 of concentrated brines every year, ~38% of the volume of which is RO reject water (i.e., ~19.6 billion m
3/year worldwide) [
3]. The RO reject water is generally discharged to the sea or local bodies of water, which changes their salinity, alkalinity, and/or water temperature, resulting in significant negative environmental impacts [
2]. Thus, various technologies designed to minimize or reuse RO reject water have been developed, such as evaporation and crystallization, forward osmosis, membrane distillation, electrodialysis, and zero discharge desalination; however, all these technologies demand substantial additional costs [
2,
4,
5]. Therefore, it is necessary to develop a new way of treating RO reject water, such as recycling RO reject water at a low cost.
In the construction industry, fresh water has generally been used as mixing water for the production of Portland cement (PC) concrete, and a few billion tons of fresh water are used worldwide for concrete production every year in the era of fresh water scarcity [
6]. Thus, to reduce the shortage of fresh water that is worsening worldwide, many studies have investigated the viability of using natural saline water (e.g., seawater), as a mixing water for cementitious binders (e.g., PC, cementless binders) [
7,
8,
9].
However, to the best of the authors’ knowledge, there have been very few investigations (likely only three publications [
10,
11,
12]) exploring the reuse of reject brine, including RO reject water, as mixing water for cementitious binders. In these studies, PC samples made with reject brine produced lower compressive strengths than those produced with distilled water when PC was used without any supplementary cementitious materials (e.g., slag); this may suggest that PC is not a good candidate for reusing RO reject water.
It is worth noting, that calcium sulfoaluminate (CSA) cement was developed to replace PC in concrete production in the 1970s, and its mineralogical composition consists mainly of C
4A
3 (ye’elimite) (in cement chemistry [
13], C = CaO, A = Al
2O
3, S = SiO
2,
= SO
3). The hydration of ye’elimite generally produces amorphous aluminum hydroxide (AH
3), which is not detectable in X-ray diffraction (XRD), and monosulfate (C
4A
H
14 (or 12)) [
14,
15]. However, when sulfate sources such as anhydrite (C
or gypsum (C
H
2) are sufficiently present with ye’elimite, ettringite (C
6A
3H
32) dominantly forms rather than monosulfate, and the formation of ettringite is a main contributor to the strength of CSA cements [
16]. CSA cement is an environment-friendly cement because, compared to PC, the production of CSA cements requires less use of limestone and a lower sintering temperature (~1250 °C; ~1450 °C in the case of PC), resulting in lower CO
2 emissions [
17]. Alongside its environmental benefits, CSA cement shows outstanding properties, such as high early strength, shrinkage compensation, rapid setting, and self-stressing, and these properties can be adjusted by changing the amount of calcium sulfates (e.g., CaSO
4·2H
2O (gypsum)) added to the cement [
18,
19]. Earlier studies have reported that ettringite (
) (Al
2O
3-Fe
2O
3-tri (AFt)) (in cement chemistry, H = H
2O [
13]) is an important reaction product of CSA cement that facilitates the achievement of these properties [
20,
21]. Thus, to increase the environmental friendliness of recycling RO reject water, CSA cement may be a better candidate than PC.
This study explored the possibility of recycling RO reject water as a mixing water for producing bricks using CSA cement and investigated the changes in the properties of CSA cement pastes when RO reject water was used. To this end, this study compared the influences of three different types of mixing waters (i.e., purified water, seawater, and RO reject water) and gypsum incorporation on flowability, strength, reaction products, chloride binding capacity, and microstructure. In addition, mortar brick samples were also made with one of the mixture proportions, which were used in this study, using RO reject water, and these samples were tested for compressive strength and water absorption to determine whether the brick samples satisfied Korean standards for brick production. Additionally, the toxicity characteristic leaching procedure (TCLP) was carried out for the mortar brick samples. To this purpose, tests of compressive strength, powder X-ray diffraction (XRD), thermogravimetric analysis (TG), chloride binding, and scanning electron microscopy (SEM) were conducted.
2. Materials and Experimental Program
A commercial CSA cement (Grade 72.5, Oreworld Trade, Tangshan, China), which contained a high content of ye’elimite, was used in this study. X-ray fluorescence (XRF) (S8 Tiger wavelength dispersive spectrometer; Bruker, Billerica, MA, USA) was used to examine the oxide composition of the CSA cement, as shown in
Table 1. The mineralogical composition of CSA cement is given in
Table 2, measured using XRD (D/MAX 2500V/PC, Rigaku, Tokyo, Japan) with Cu-Kα radiation (λ = 1.5418 Å) from 5° to 60° in 2θ degree, and Rietveld analysis.
Table 2 shows that the CSA cement mostly consisted of ye’elimite and β-dicalcium silicate (C
2S).
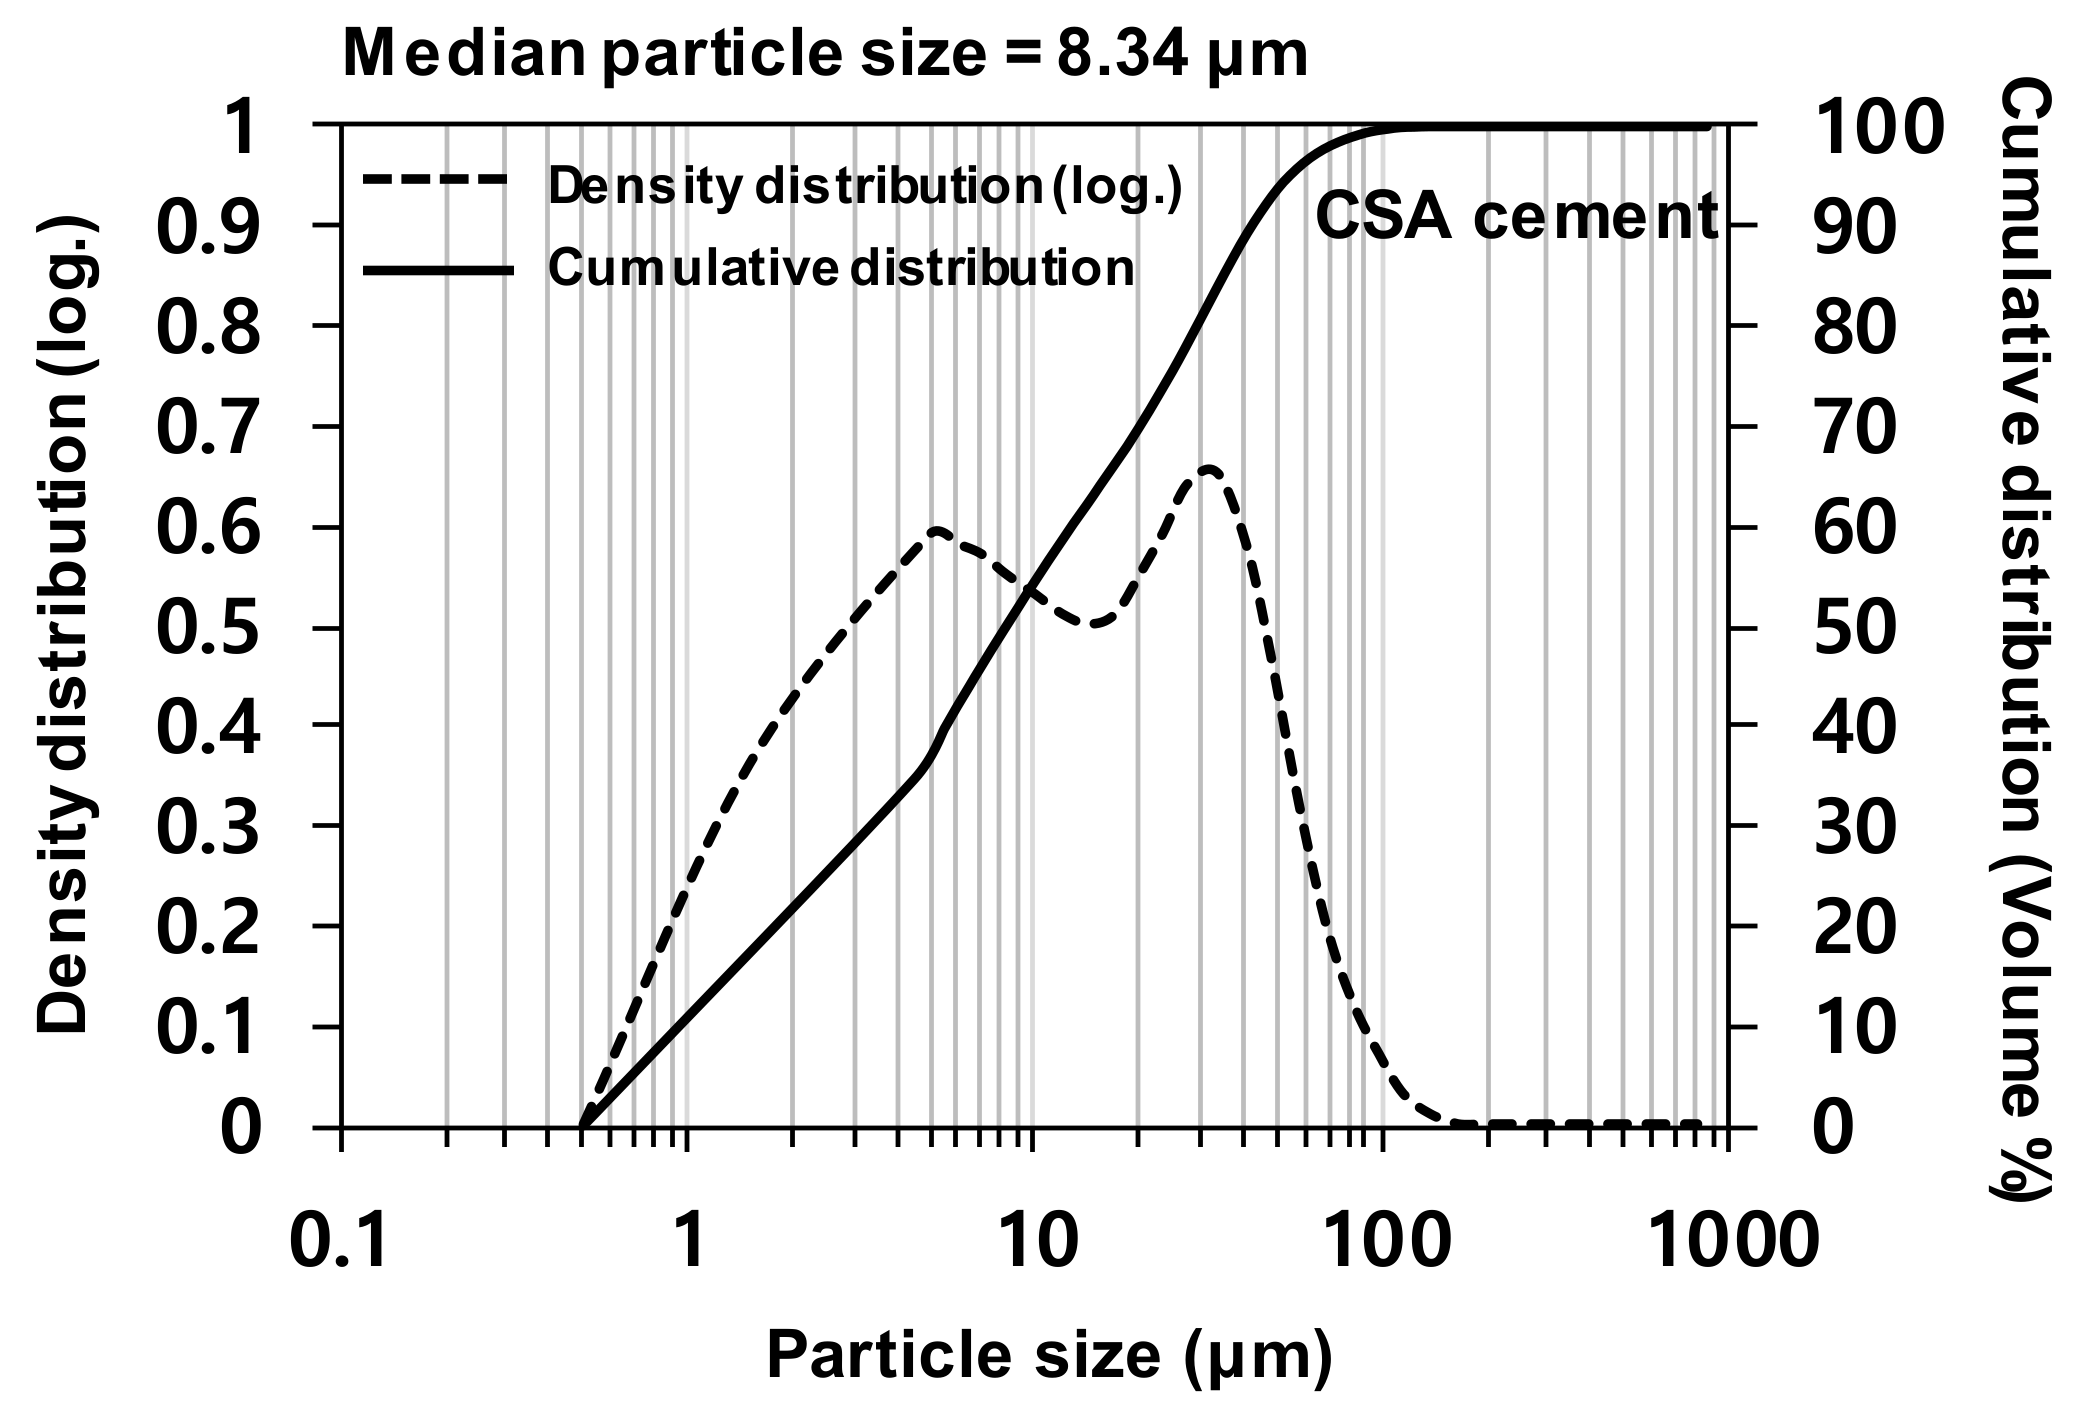
The particle size distribution of CSA cement was tested with a laser diffraction particle size analyzer (HELOS (HI199) and RODOS, Sympatec, Clausthal-Zellerfeld, Germany), as shown in
Figure 1. The CSA cement exhibited a particle size range of ~0.5–100 µm, with a median particle size of 8.34 µm.
The RO reject water was obtained from the RO desalination plant at Yeosu in South Korea. The seawater was collected from the sea close to the RO plant; thus, it had a similar ionic composition to that of the feed water of the RO plant. The purified water used in this study was a deionized (DI) water. Cations (Ca
2+, K
+, Mg
2+, and Na
+) and anions (Cl
− and SO
42−) in the water were quantified using ion chromatography (IC), as shown in
Table 3. RO reject water contains about twice as many ions as seawater. Chloride ions were the most abundant ions in RO reject water and seawater.
The mixture proportions of prepared paste samples are given in
Table 4. Analytical grades of gypsum (CaSO
4∙2H
2O, Sigma Aldrich, US) were used in this study.
An earlier study [
22] reported that CSA cement is classified by its
m-value, which is defined as the molar ratio of calcium sulfate (gypsum in this study) to ye’elimite; (1) when
m = 0–1.5, the CSA is categorized as a high-strength or a rapid hardening cement; (2) when
m = 1.5–2.5, it is an expansive cement; (3) when
m = 2.5–6, it is regarded as a self-stressing cement. It is worth noting that the weight proportion of C
was only 0.7 wt% in the CSA of this study. Thus, in this study, the weight of added gypsum was calculated to generate an
m-value of 1 because rapid hardening is more beneficial than expansion or self-stressing in producing bricks commercially.
Purified water, seawater, and RO reject water were used as mixing water. The weight ratio of water-to-binder (w/b) was set as 0.5 for all mixture samples, given that a higher w/b is generally necessary for CSA cement than PC to gain a proper mixing of paste [
23,
24]. For compressive strength testing, 3 identical paste samples were prepared for each mixture proportion. The fresh pastes were cast in 5 cm × 5 cm × 5 cm cubic molds. All samples were cured in a humidity chamber at 23 °C with greater than 99% relative humidity for all curing periods.
The flows of fresh cement paste samples were tested by using a flow table in accordance with the ASTM C1437 [
25]. Each fresh paste was placed in a mold with a bottom inner diameter (= base diameter) of 100 mm, a top inner diameter of 70 mm, and a height of 50 mm. After the mold was lifted away, the flow table was dropped 25 times in 15 s; then, the diameter of a spread paste was measured 4 times, and their average diameter was determined. Flow value was obtained by (average diameter−inner base diameter)/inner base diameter × 100.
The compressive strength tests were conducted with a universal testing machine (1500HDX; Instron, Norwood, MA, USA) at 1 day, 7 days, and 28 days of curing for all samples. For TG, XRD, and chloride binding tests, fractured pieces were collected after strength testing and ground. To cease any further reaction and remove any remaining water, all prepared samples were stored in isopropanol and dried in a vacuum desiccator according to a method previously described in the literature [
26].
For the SEM testing, the hardened samples were sliced into 2 mm-thick pieces and mounted using an epoxy resin; then the mounted samples were polished with an EcoMet 250 Grinder-Polisher (Buehler, Lake Bluff, IL, USA).
The XRD patterns of the hardened paste samples were collected using the same instrument and conditions used for the XRD of the CSA cement, at 1 day, 7 days, and 28 days. The XRD patterns were examined with the International Center for Diffraction Data (ICDD) PDF-2 database and the Inorganic Crystal Structure Database (ICSD) [
27].
The TG tests were conducted at 1 day and 28 days of curing using a simultaneous thermal analyzer (SDT Q600, TA Instruments, New Castle, DE, USA) from room temperature to 1000 °C with a heating rate of 10 °C/min in an N2 condition using an alumina pan.
The chloride binding tests were carried out to measure the contents of free and bound chlorides in hardened pastes at 28 days of curing. The Korean Standard (KS) F 2714 [
28], which is similar to the American Society of Testing and Materials (ASTM) C1218, was used to measure the acid-soluble total chloride contents. In addition, the KS F 2715 [
29], which is similar to the ASTM C1152, was used to obtain the water-soluble free chloride contents.
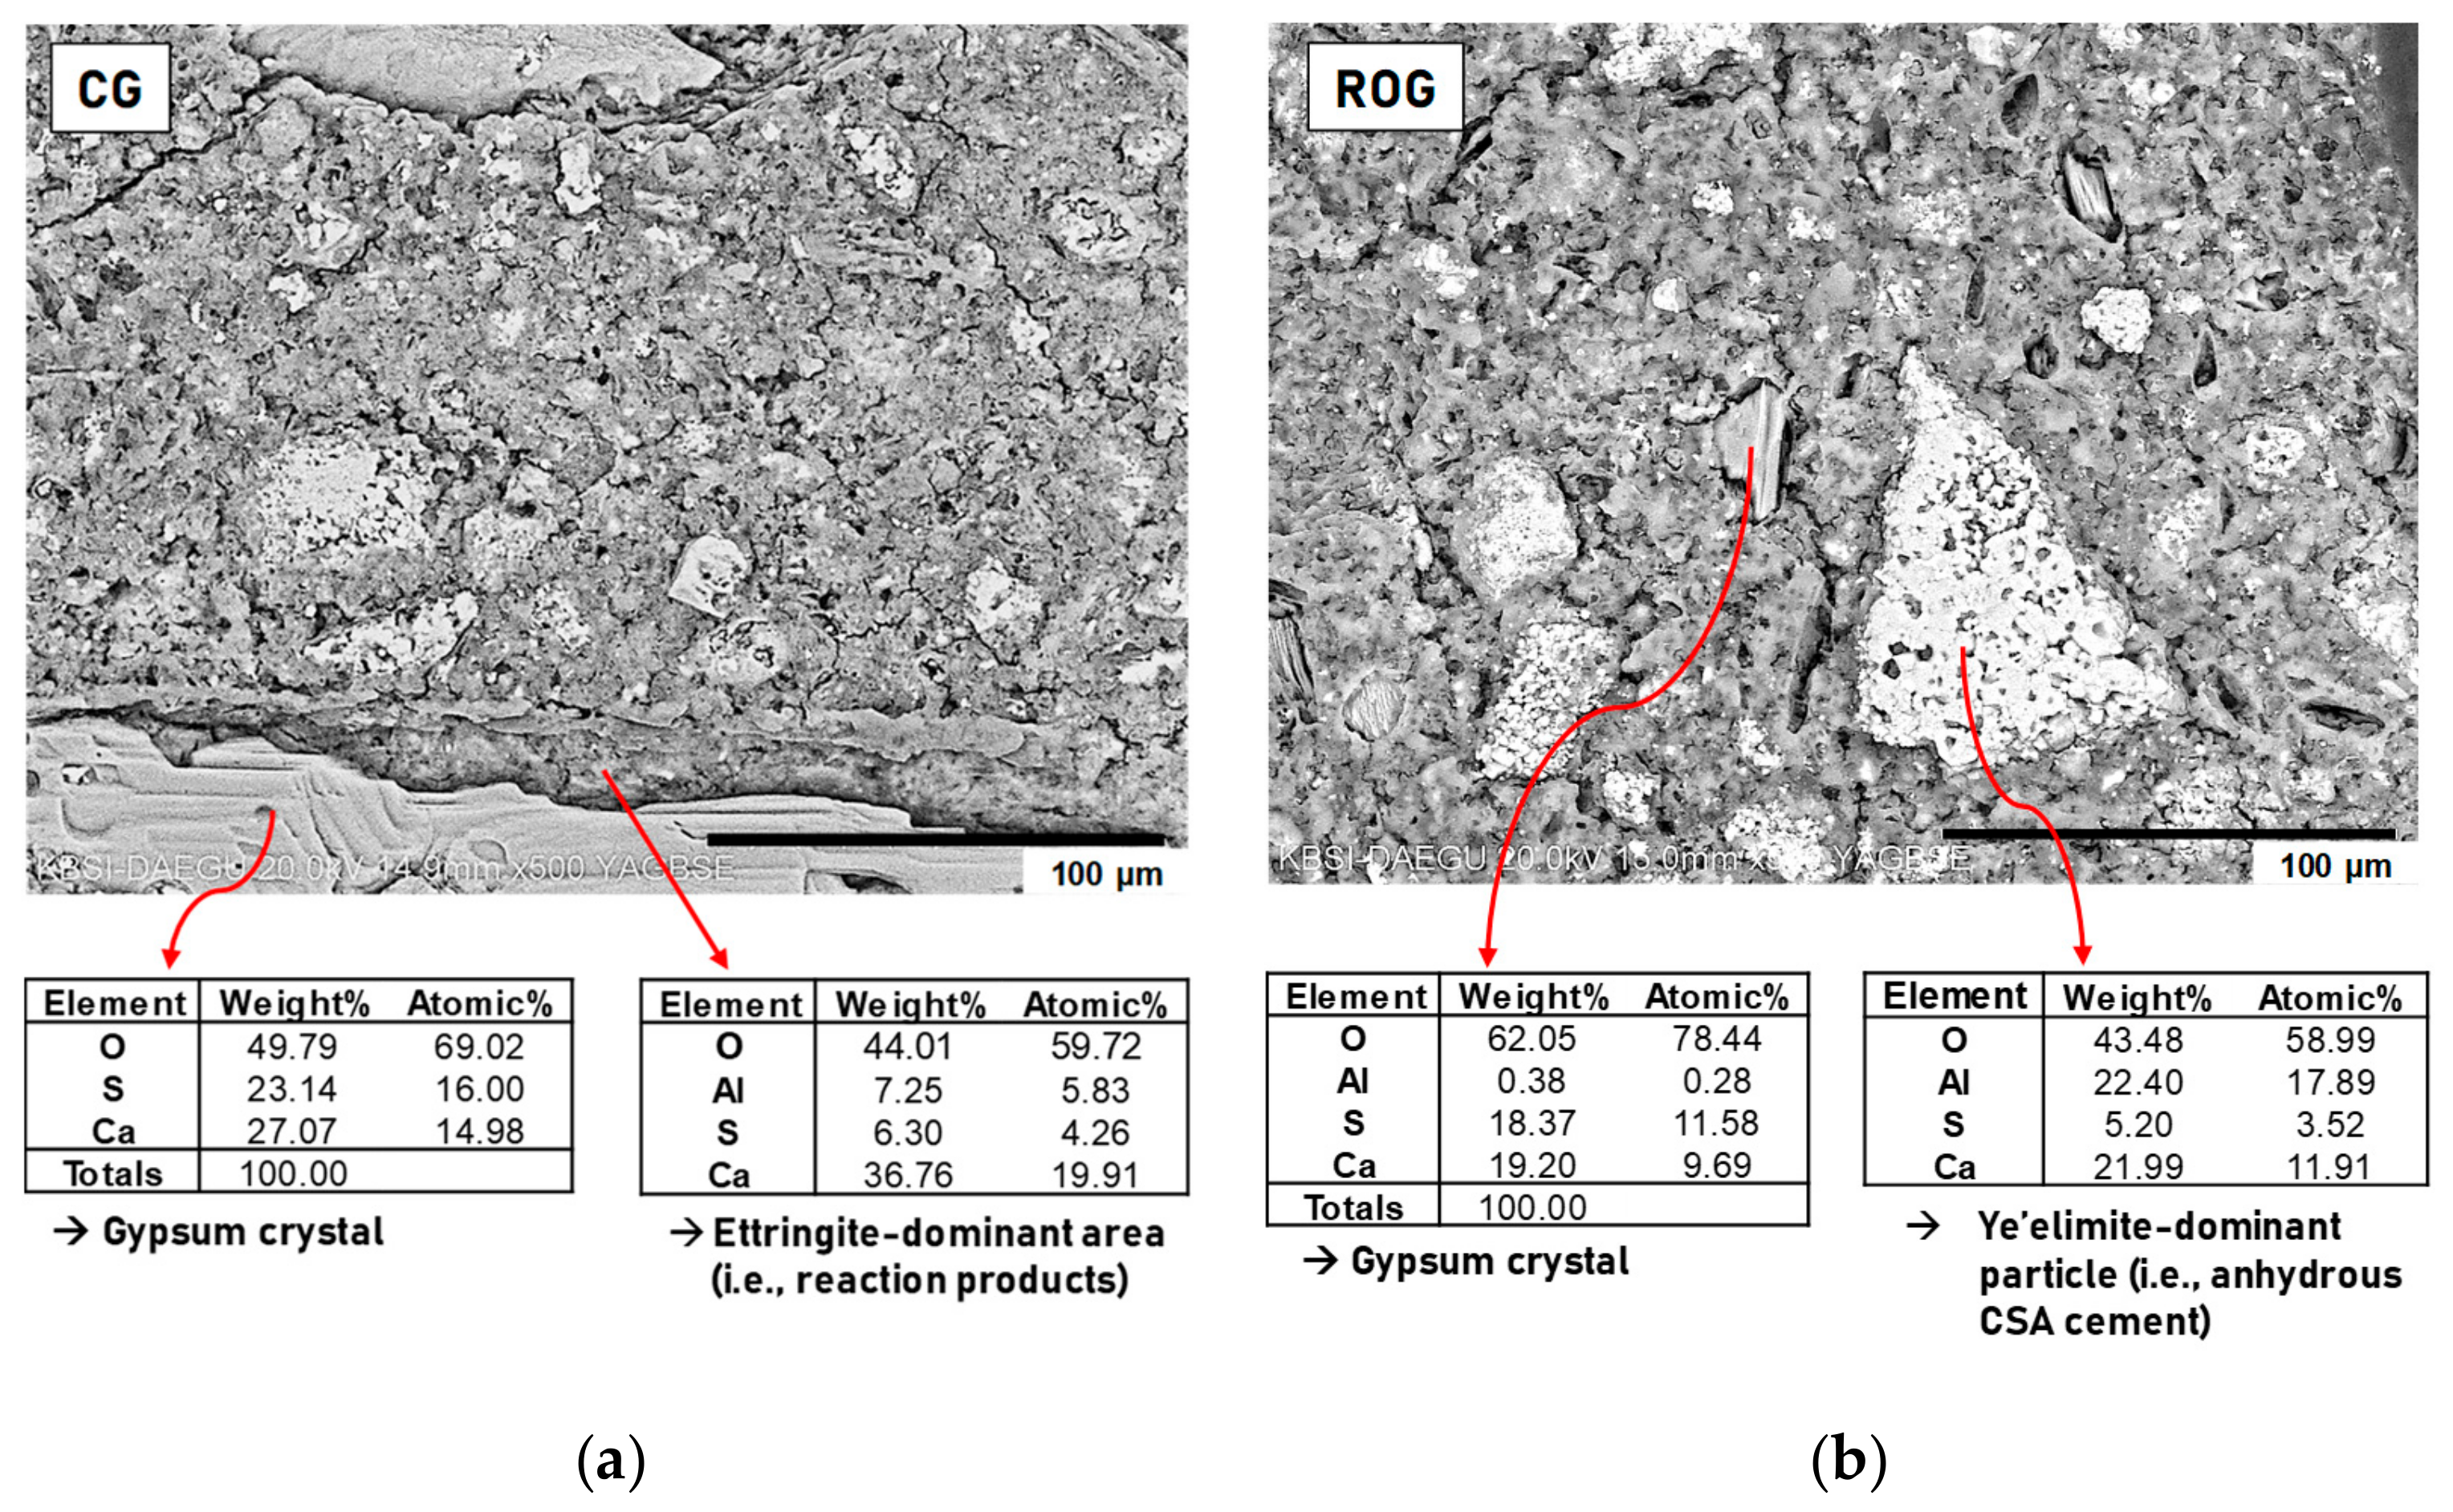
Backscattered electron (BSE) images were taken only for the CG and ROG samples because (1) the ROG mixture in
Table 4 was selected to be used for brick production at the end of this study based on the results of strength testing, XRD, TG/DTG, and chloride binding, and (2) comparing the microstructure between CG and ROG might provide useful insights into the influence of the RO reject water.
The BSE images were obtained using ultra-high-resolution field emission scanning electron microscopy (FE-SEM, Hitachi S-4800, Tokyo, Japan) with energy dispersive spectroscopy (EDS).
Triplicate brick samples were produced using mortar with water, binder, and sand in a weight ratio of 0.6:1.0:3.0, respectively as in
Table 5. Mixture proportion of bricks (kg/m3).. ROG in
Table 4 was selected as a binder mixture proportion for brick production, and this will be discussed in the results and discussion sections of this study. The dimensions of the brick were 190 mm × 90 mm × 57 mm. All specifications followed the KS F 4004 [
30]. The specific gravity and water absorption (%) of sand were determined by the KS F 2504 [
31], and their values were 2.59 and 0.78%, respectively. The fineness modulus of the sand was 2.83.
Water absorptions were measured for 3 identical 7-day cured brick samples according to the KS F 4004. After the brick samples were submerged in water for 24 h at room temperature, the samples were put on the coarse wire mesh for 1 min. The surfaces were wiped off with a wet cloth, and the weight of the saturated samples (m0) was measured. To measure the dry weight (m1), the samples were dried in an oven at 100 °C for 24 h. Then the values of water absorption were calculated using the following formula from the KS F 4004: (m0−m1)/m1 × 100.
To measure the compressive strength of the brick samples, triplicate mortar samples measuring 5 × 5 × 5 cm were prepared using the ROG mixture through curing for 7 days at 23 °C with ~99% relative humidity.
The toxicity characteristic leaching procedure (TCLP) of the US Environmental Protection Agency (EPA) was employed for a leaching test of the bricks [
32]; 0.5 N acetic acid was added to distilled water to modify the pH to 5, and the resulting solution was used as the extraction solution. The crushed sample (g) to the solution (mL) ratio was set at 1:20, and the extraction time was 18 h on an agitator. Concentrations of arsenic (As), barium (Ba), cadmium (Cd), chromium (Cr), and lead (Pb) were measured using inductively coupled plasma optical emission spectroscopy (ICP-OES).
3. Results and Discussion
3.1. Flow Test
Table 6. Flow test results using flow table following American Society of Testing and Materials (ASTM) C1437. shows the measured diameters of spread fresh paste samples in the flow test. The diameters of the samples with purified water could not be measured because the samples overflowed out of the flow table (the diameter of flow table = 253 mm). In the results, the use of RO reject water showed the smallest flow values in each group of samples compared to the other types of mixing waters, implying the increased viscosity, possibly due to the greatest ion concentrations of RO reject water; a mixing water with higher concentrations of ions may lead to faster stiffening of fresh paste by more reaction of ions with cement compounds. Wang et al. [
33] reported a similar trend that PC pastes using seawater were stiffer than using deionized water.
It is worth noting, that a stiffer mortar is more advantageous for brick production when considering common production processes of cement bricks. In addition, although the use of RO increased the viscosity of pastes to some extent, no coagulation was observed during mixing.
3.2. Compressive Strength
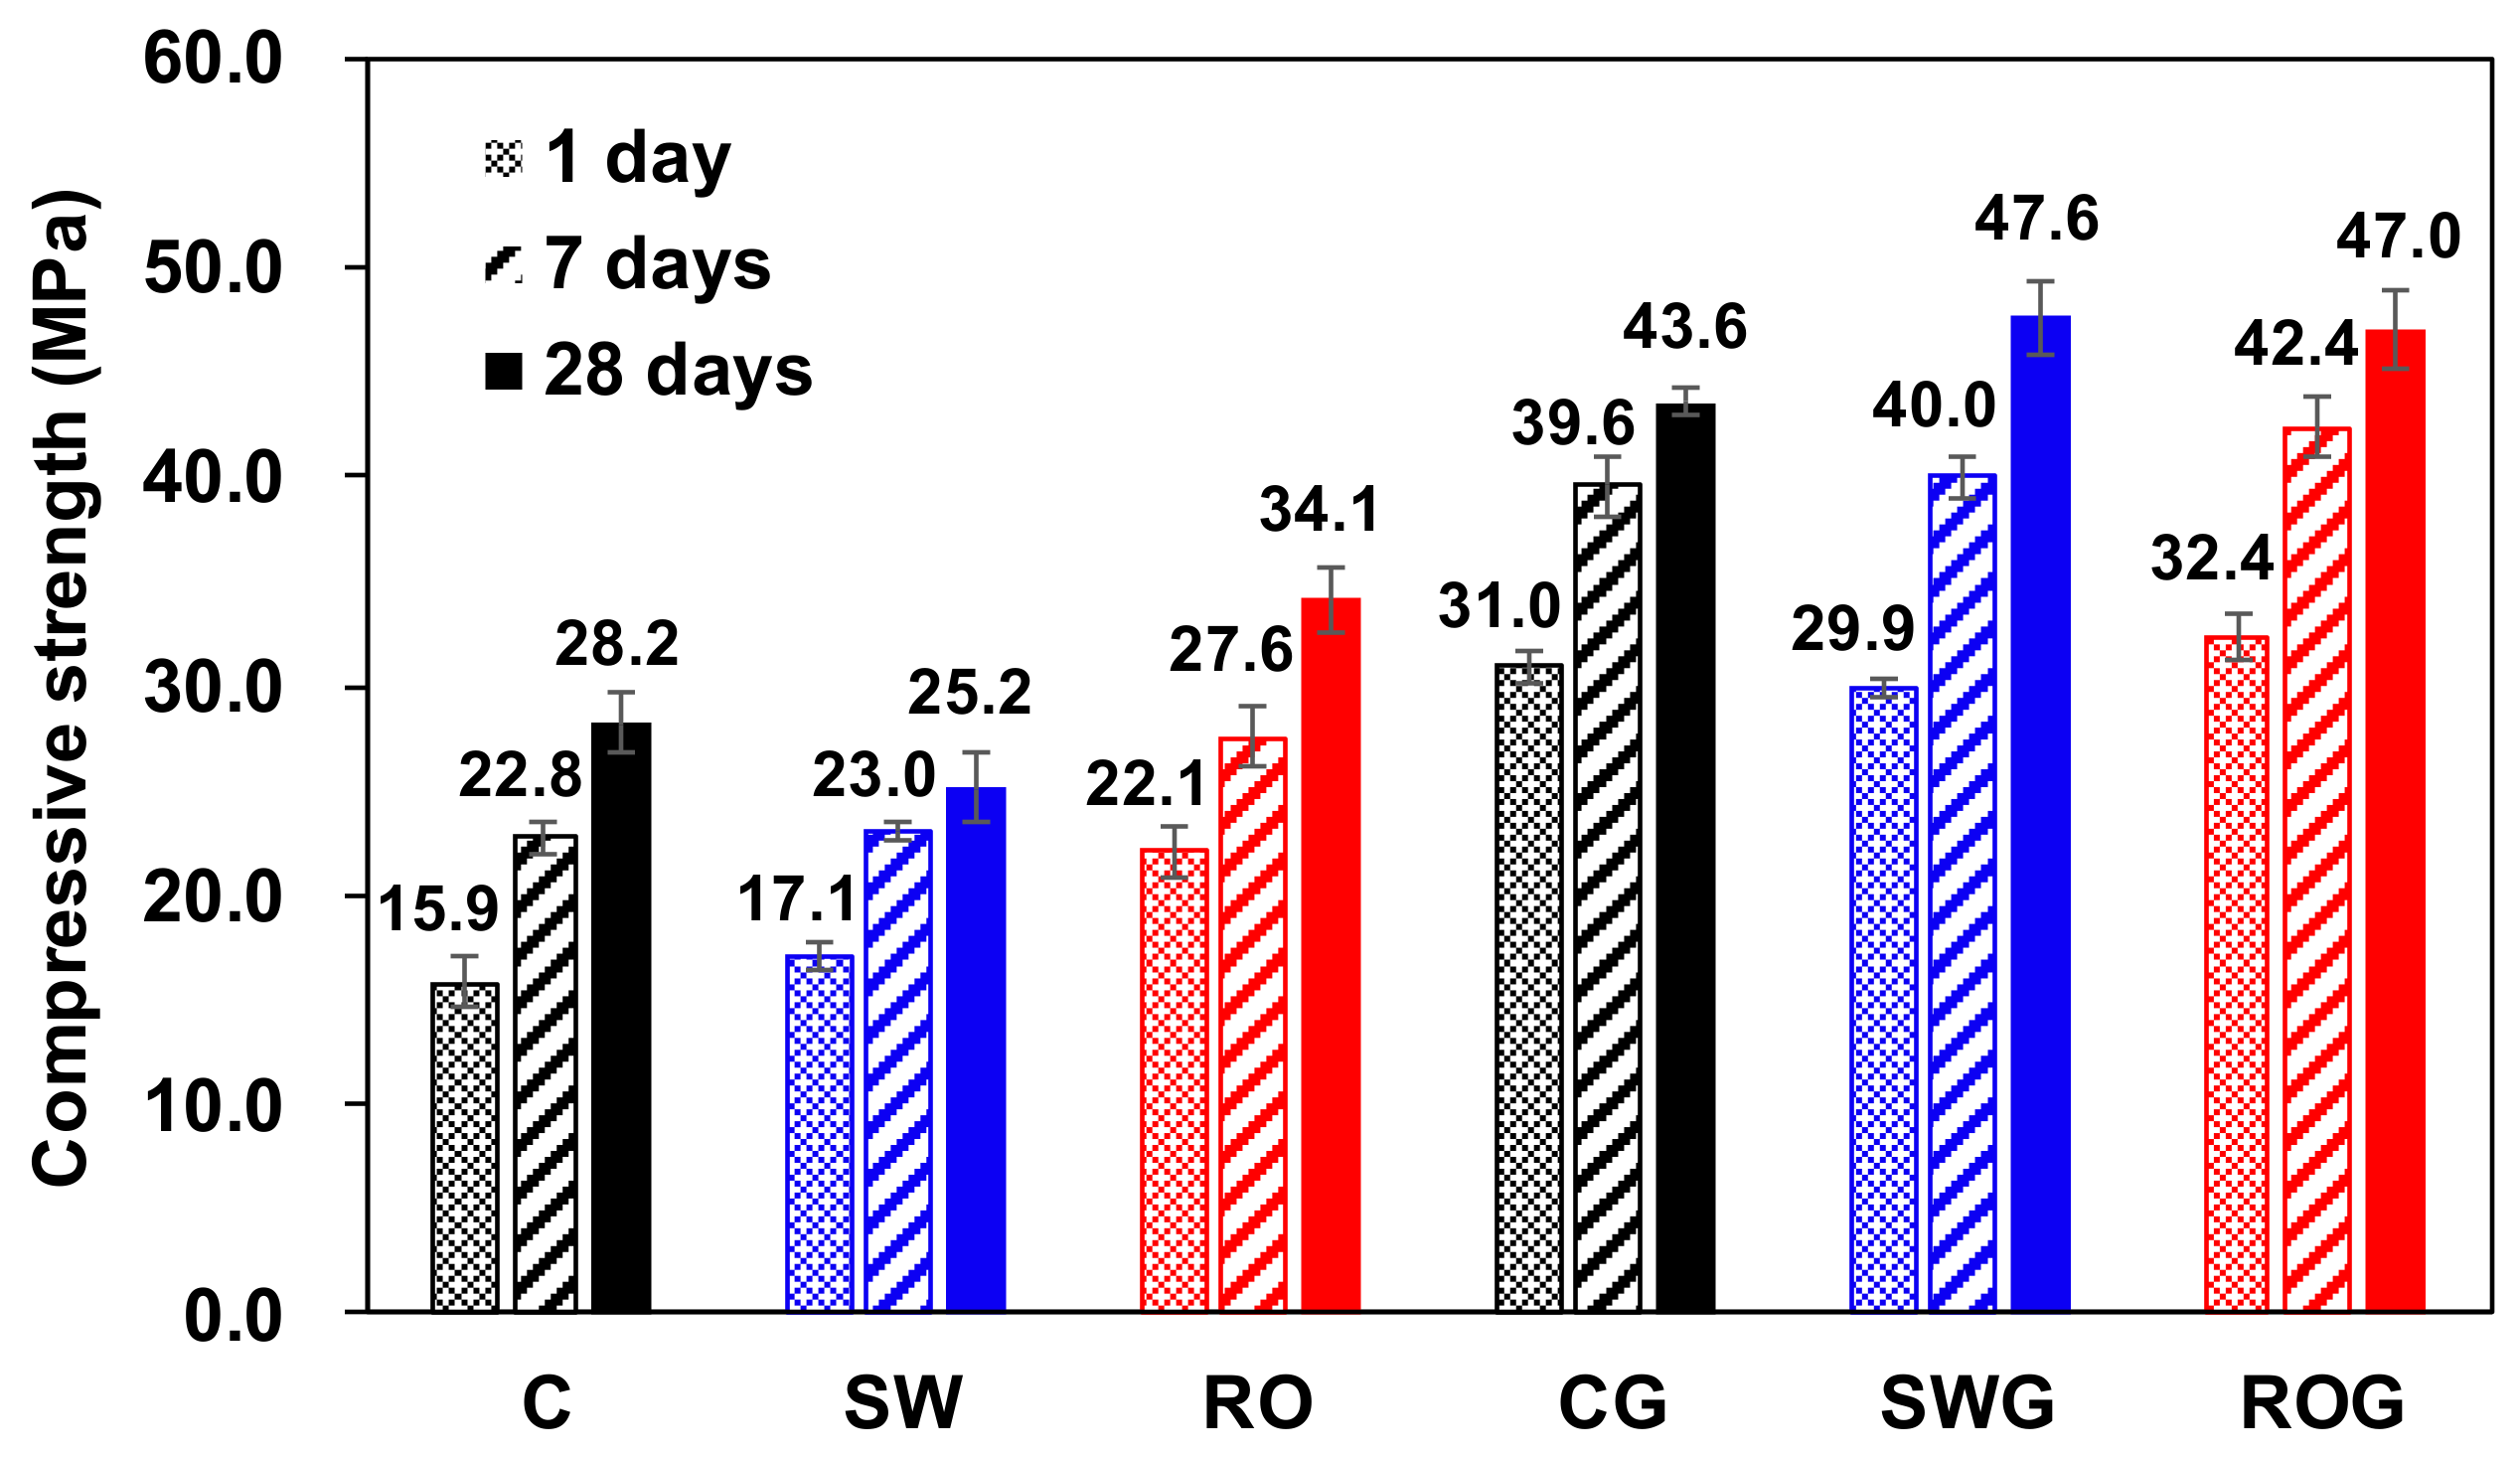
All compressive strength testing results for the hardened paste samples are present in
Figure 2.
In the case of no gypsum, the sample with RO reject water (i.e., sample RO) developed the greatest compressive strengths among mixtures throughout all ages up to 28 days. In particular, the use of RO reject water clearly enhanced the strength by 6.2 MPa at 1 day compared to the sample with purified water (i.e., sample C); however, after one day, the degrees of strength increase were similar between RO and C, without any further significant enhancement in RO up to 28 days. On the other hand, the use of seawater for CSA cement (i.e., sample SW) showed insignificant enhancements in strength until 7 days and even yielded a lower strength at 28 days than sample C.
When gypsum was used, all samples (i.e., CG, SWG, and ROG) clearly showed higher compressive strengths than the samples without gypsum (i.e., C, SW, and RO) at all days. However, the distinct differences in strength, which were observed in the samples without gypsum when different mixing waters were used, nearly disappeared, and thus all mixtures showed similar strength developments; however, the use of RO reject water still showed slightly enhanced strengths, which entailed a 4.5–7.8% improvement over those of purified water at corresponding days of curing. Unlike the case of no gypsum, the use of seawater also produced a higher strength than that of purified water in the presence of gypsum at 28 days.
3.3. XRD
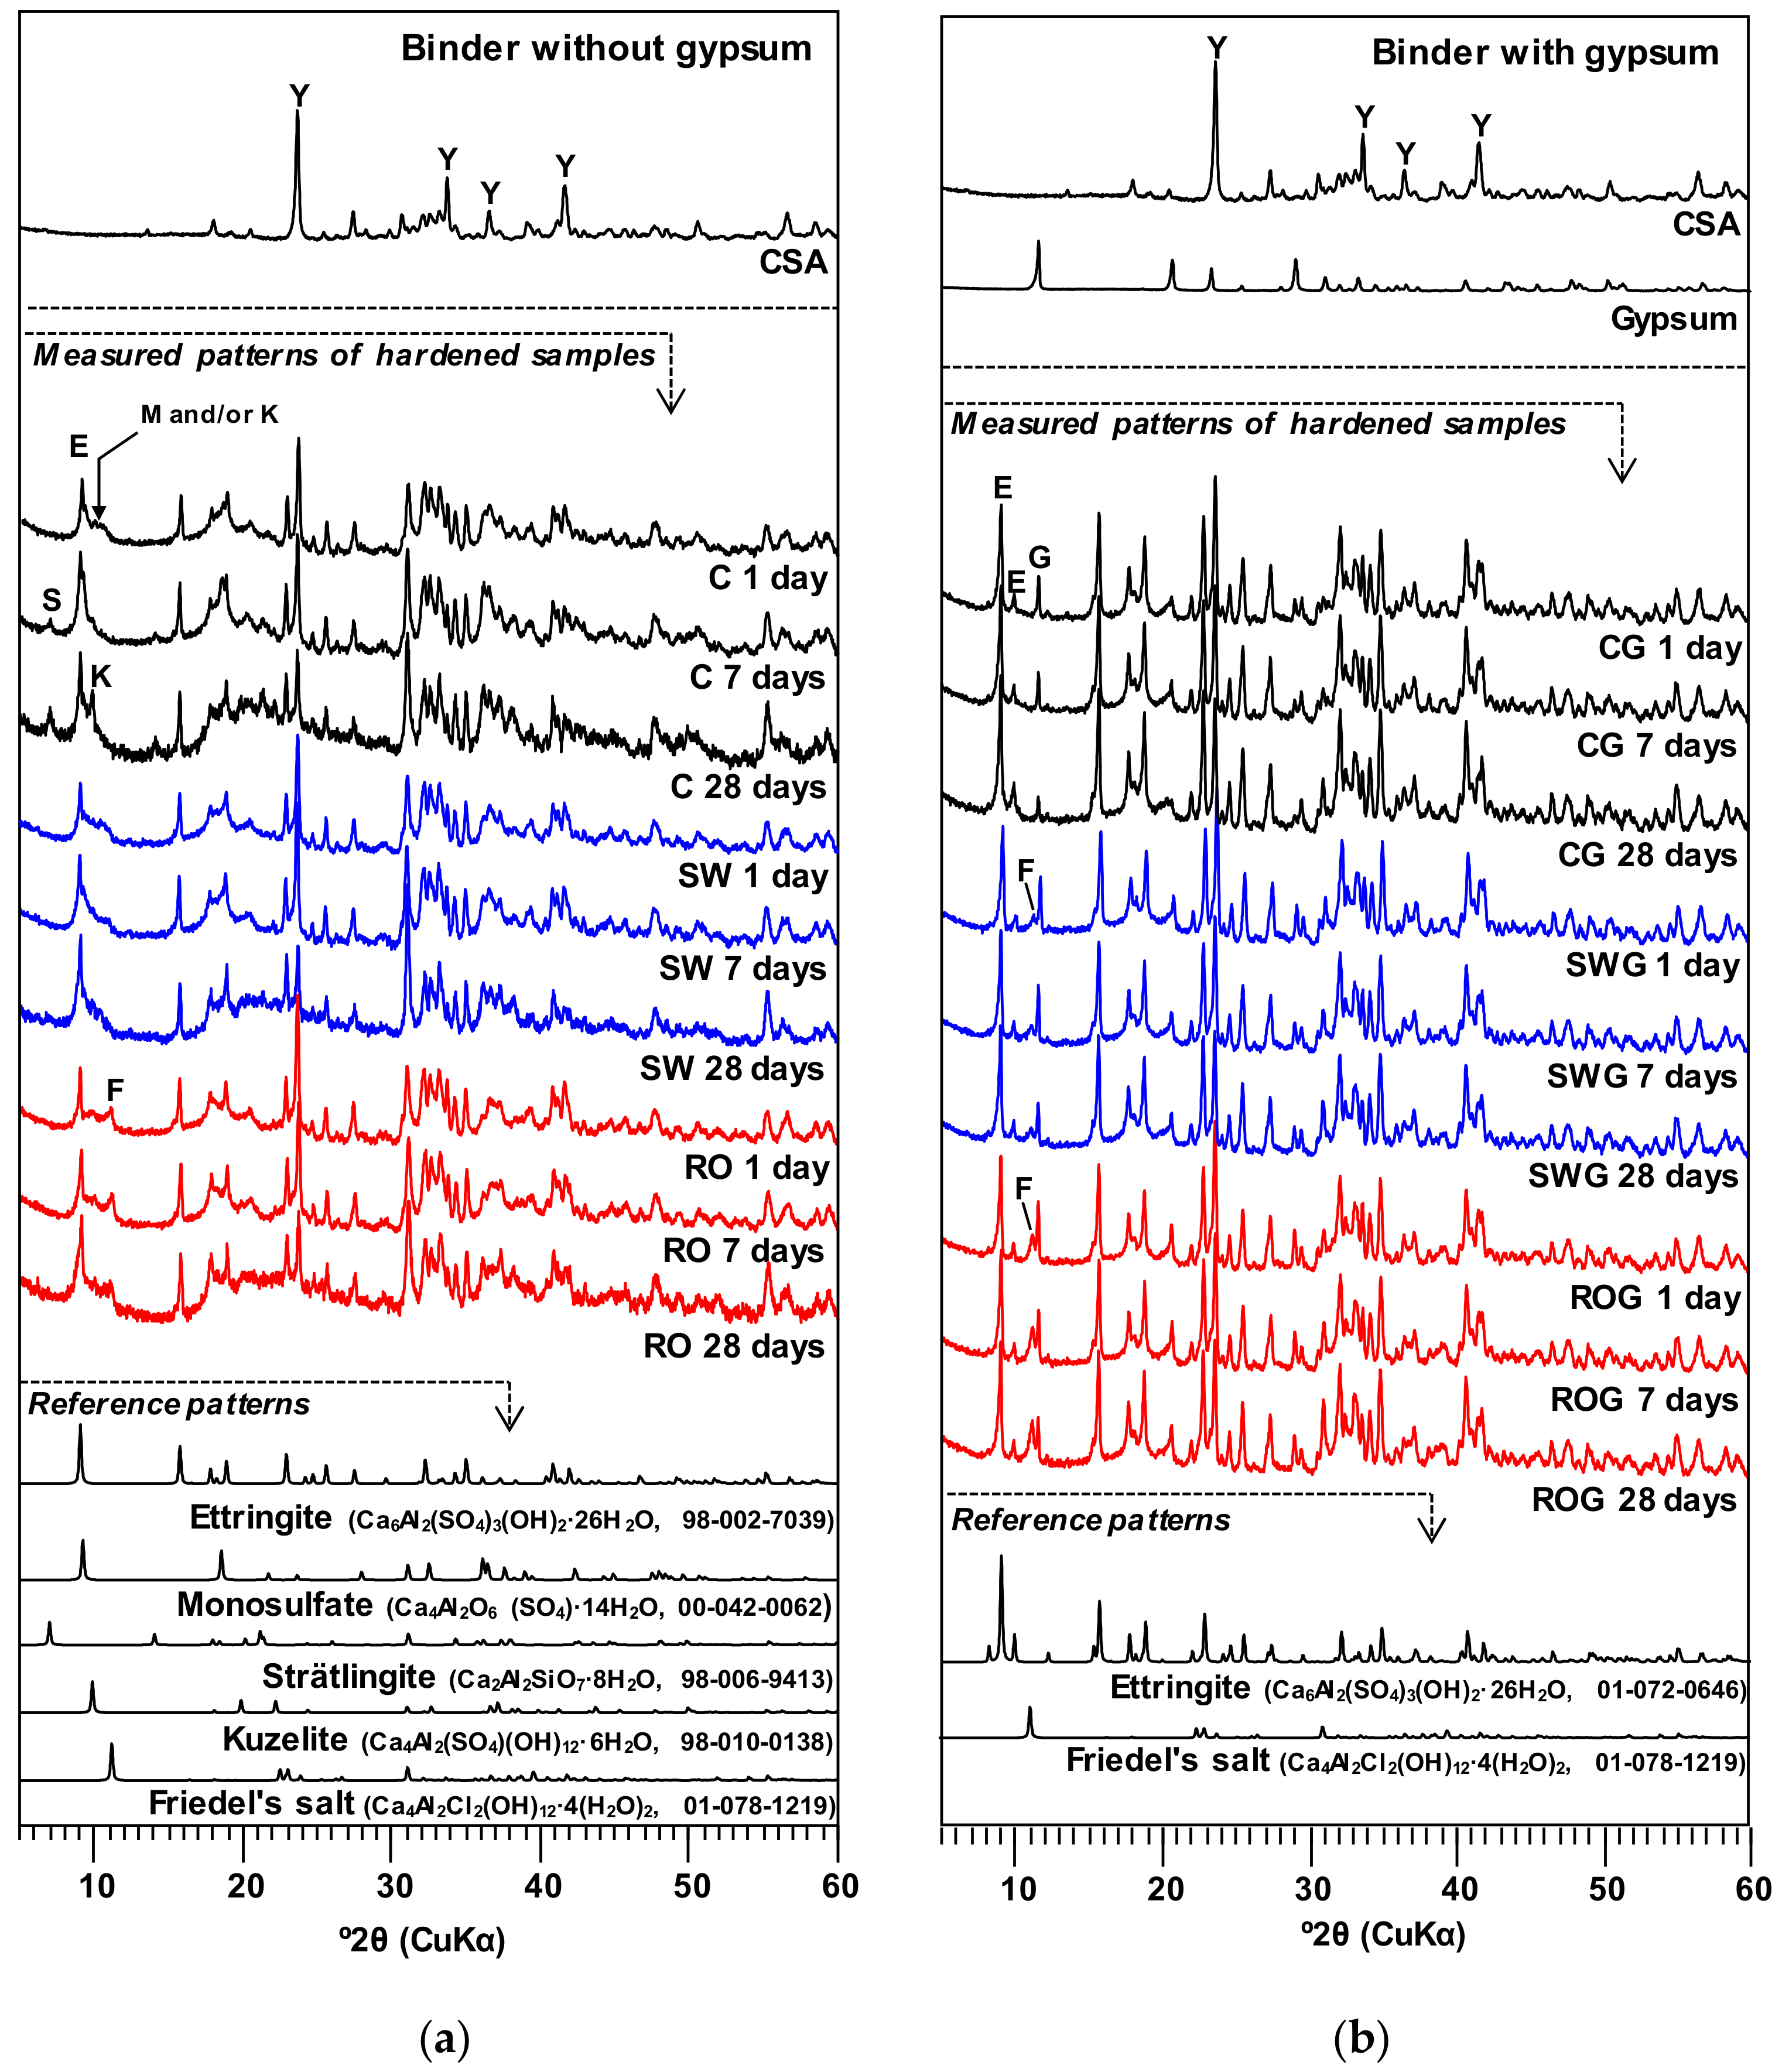
Figure 3 presents the XRD patterns of the hardened pastes at 1, 7, and 28 days. In XRD, regardless of the presence of gypsum or the type of mixing water, all samples still contained a significant portion of anhydrous CSA cement until 28 days of curing. The XRD results of this study illustrate that the use of gypsum likely slightly inhibited dissolution of ye’elimite because the stronger peaks of ye’elimite were observed in the samples with gypsum.
When no gypsum was used (i.e., C, SW, and RO), the use of seawater and RO reject water mainly changed the type of Al
2O
3-Fe
2O
3-mono (AFm) [
13] in comparison to the use of purified water. All samples without gypsum displayed monosulfate (Ca
4Al
2O
6 (SO
4)·14H
2O) and kuzelite (Ca
4Al
2(SO
4)(OH)
12·6H
2O), which belong to the AFm phase, in XRD at all days. However, when a mixing water had a higher concentration of chloride, these reaction products were largely replaced with Friedel’s salt (Ca
4Al
2Cl
2(OH)
12·4(H
2O)
2), which is also a type of AFm phase, mainly due to the substitution of sulfur (S) with chloride (Cl) [
34,
35]. Thus, sample C showed the strongest peaks of monosulfate and kuzelite, whereas the RO sample showed the strongest peaks of Friedel’s salt in the XRD results, particularly at 28 days. In addition, in all samples without gypsum, despite the small amount of calcium sulfate (~0.7 wt%) in the CSA cement of this study, ettringite (Ca
6Al
2(SO
4)
3(OH)
2·26H
2O) was also identified, although its XRD peaks were relatively weak, a result similar to those found in earlier studies [
36,
37,
38].
When gypsum was used, all samples produced strong ettringite peaks because the gypsum supplied sufficient sulfate, whereas the peaks of monosulfate and kuzelite were almost eliminated; however, Friedel’s salt still formed when seawater or RO reject water was used. Similar to the gypsum-free samples, the XRD results indicate that the largest amount of Friedel’s salt formed when RO reject water was used.
It is worth noting that the use of seawater or RO reject water did not noticeably affect the intensities of the ettringite peaks, although these mixing waters had significantly different concentrations of sulfate ions (SO
42−) (see
Table 3), regardless of the use of gypsum. In this study, the concentration of sulfate ions in the RO reject water (= ~4,609 mg/L) was the greatest among mixing waters; however, given that this concentration can be obtained when only 0.415 g of gypsum is dissolved in 50 g of purified mixing water (note that 14.96 g of gypsum was dissolved in 50 g of purified water for sample CG in
Table 4), the concentration of sulfate in the RO reject water was likely not high enough to observably increase the formation of ettringite. Thus, although the formation of ettringite has often been reported as a main cause of substantial strength increase in various cementitious binders [
39,
40], in this study, the ettringite formation hardly explained why the use of RO reject water significantly increased strength. Rather, given that earlier studies [
41,
42,
43] reported that the formation of Friedel’s salt filled pores in hardened cementitious materials, the greater strengths of the samples with RO reject water (i.e., ROG) were also likely related to the formation of Friedel’s salt in this study.
3.4. Thermogravimetric (TG) Analysis
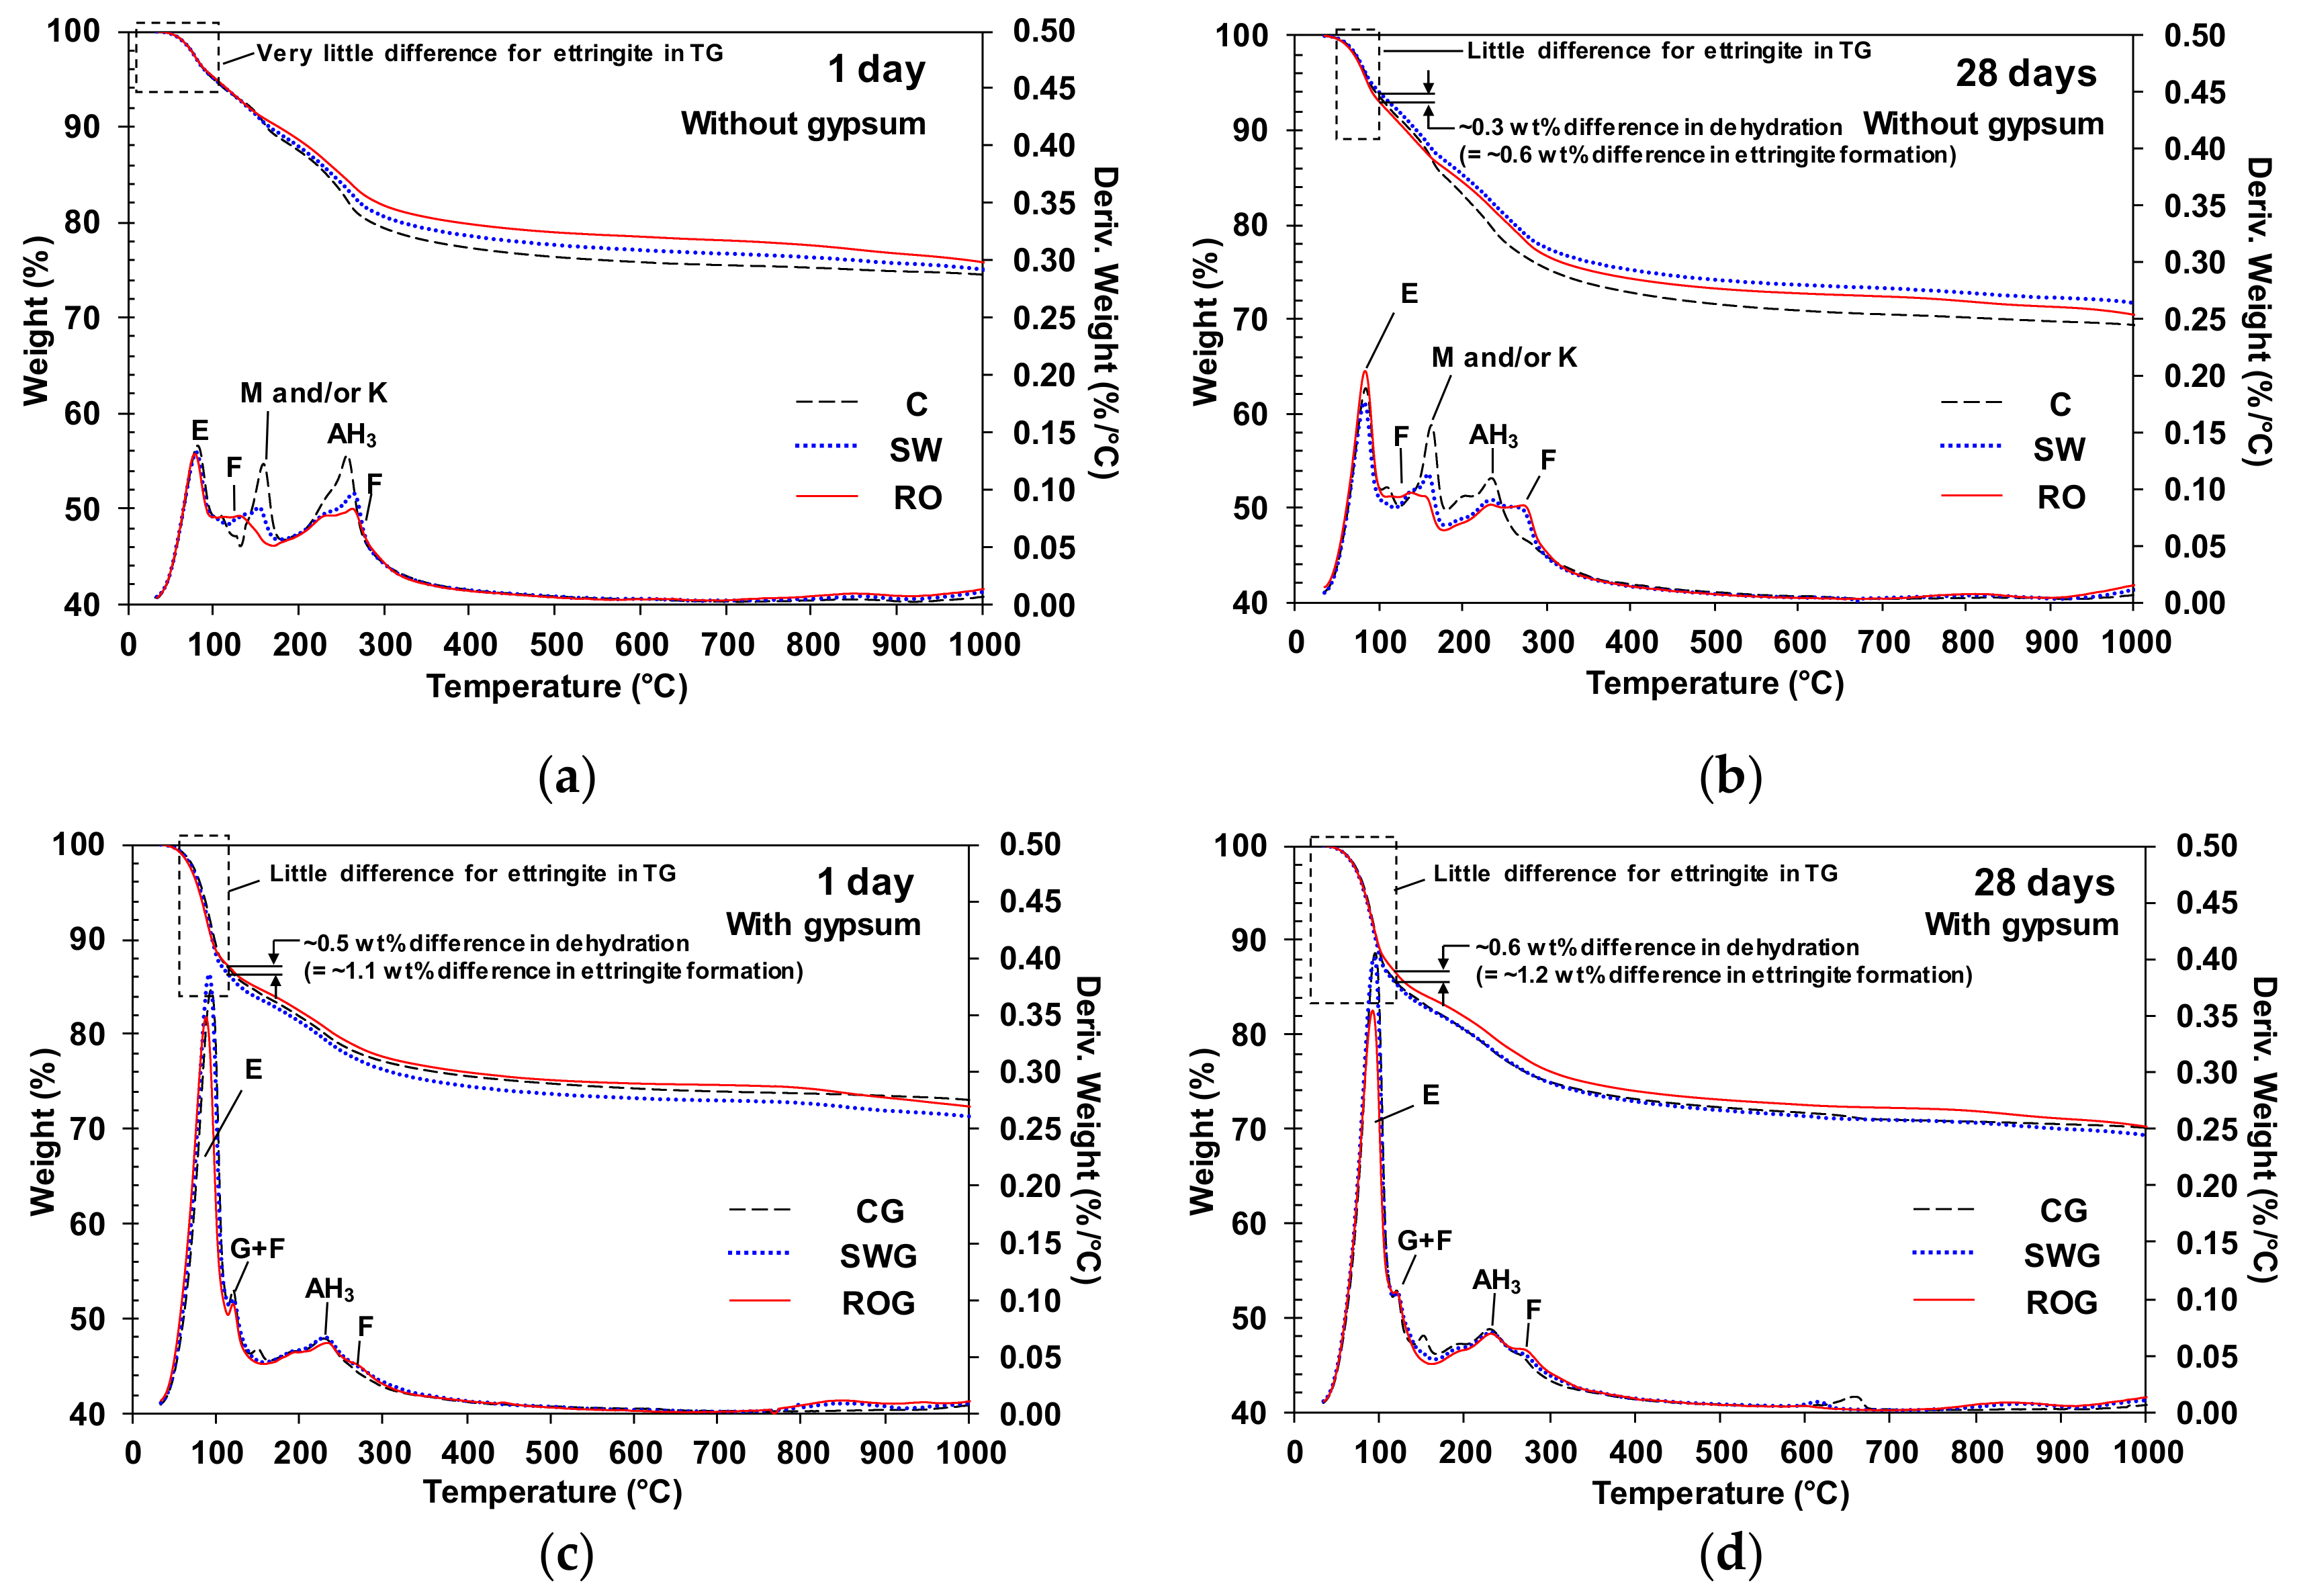
The TG and the differential thermogravimetry (DTG) curves of the 1-day and 28-day cured samples are presented in
Figure 4. In the TG results, the loss of free water was not involved because free water was removed during the sample preparation through the process of solvent exchange and vacuum drying. The peak near 80 °C was mainly associated with dehydration of ettringite; the peak around 100–200 °C was linked to water loss from monosulfate and/or kuzelite. The peak around 200–300 °C was due to water loss of AH
3 [
15,
44,
45]; gypsum is known to be decomposed around 120 °C in TG [
39,
46]; Friedel’s salt is known to undergo 2two steps of weight loss at different temperature ranges: (1) dehydration near 130 °C and (2) dehydroxylation at about 280 °C [
41,
45,
47,
48]. Although Friedel’s salt also experiences a series of phase transformations (e.g., recrystallization) from 400 °C to 1000 °C, no weight loss is involved in these transformations.
In
Figure 4a,b, when no gypsum was incorporated, the use of seawater or RO reject water considerably reduced the weight loss of monosulfate and/or kuzelite, whereas the weight loss of Friedel’s salt increased. This observation is fairly consistent with the results of XRD. As mentioned in the previous section, the formation of Friedel’s salt likely helped increase strength to some extent, which was particularly observed in the ROG sample.
In
Figure 4c,d, when gypsum was incorporated, the DTG peaks of monosulfate and kuzelite were mostly removed in all samples, and large peaks of ettringite formed. As a result, all samples with gypsum showed similar curve profiles of weight loss, unlike the gypsum-free samples, and the quantities of ettringite were similar among all samples at 1 and 28 days. However, when seawater or RO reject water was used, a slightly higher degree of Friedel’s salt formation was observed.
Note that the concentration of sulfate ions in the RO reject water was considerably lower than the sulfate amount due to gypsum addition in this study. Thus, the concentration of sulfate ions in the RO reject water was likely not high enough to noticeably increase the formation of ettringite in any sample. The DTG curves of ettringite in
Figure 4b showed a slight increase when RO reject water was used. On the other hand, the DTG curves in
Figure 4c,d indicate that ettringite production was significantly lower when RO reject water was used rather than other types of mixing water. Given that the presence of Mg
2+ has an inhibitory effect on the formation of ettringite [
49,
50,
51], the reduced amount of ettringite may be partially due to the greatest concentration of Mg
2+ in the RO reject water. However, the dashed boxes in the TG curves in
Figure 4 clarify that the weight loss of ettringite was not notably affected by changing mixing water; for instance, in
Figure 4d, the difference in weight loss between CG and ROG up to ~120 °C was merely 0.6 wt%, and this mass difference corresponds to only 1.2 wt% of ettringite formation. Given that, in
Figure 4d, the sample ROG showed ~12.7 wt% of weight loss up to ~120 °C, and this weight loss corresponds to ~27.7 wt% of ettringite formation, the 1.2 wt% of difference in ettringite formation was not significant. Thus, the strength differences among the samples were likely not significantly correlated with the influence of changing mixing water on ettringite formation, but rather more related to the formation of Friedel’s salt in this study because earlier studies demonstrated that even a small increase in Friedel’s salt notably decreased the porosities of the hardened pastes of cementitious binders [
41,
42,
43].
It is worth noting, that the incorporation of gypsum promoted the faster growth of ettringite in the CSA cement of this study because when comparing the DTG curves of the gypsum-free samples between 1 and 28 days, the DTG peaks of ettringite (near 80 °C) at 28 days were noticeably greater than those of the 1-day cured samples. However, when gypsum was used, the DTG peaks at 1 day were already similar in size to those at 28 days.
3.5. Free and Bound Chloride Contents
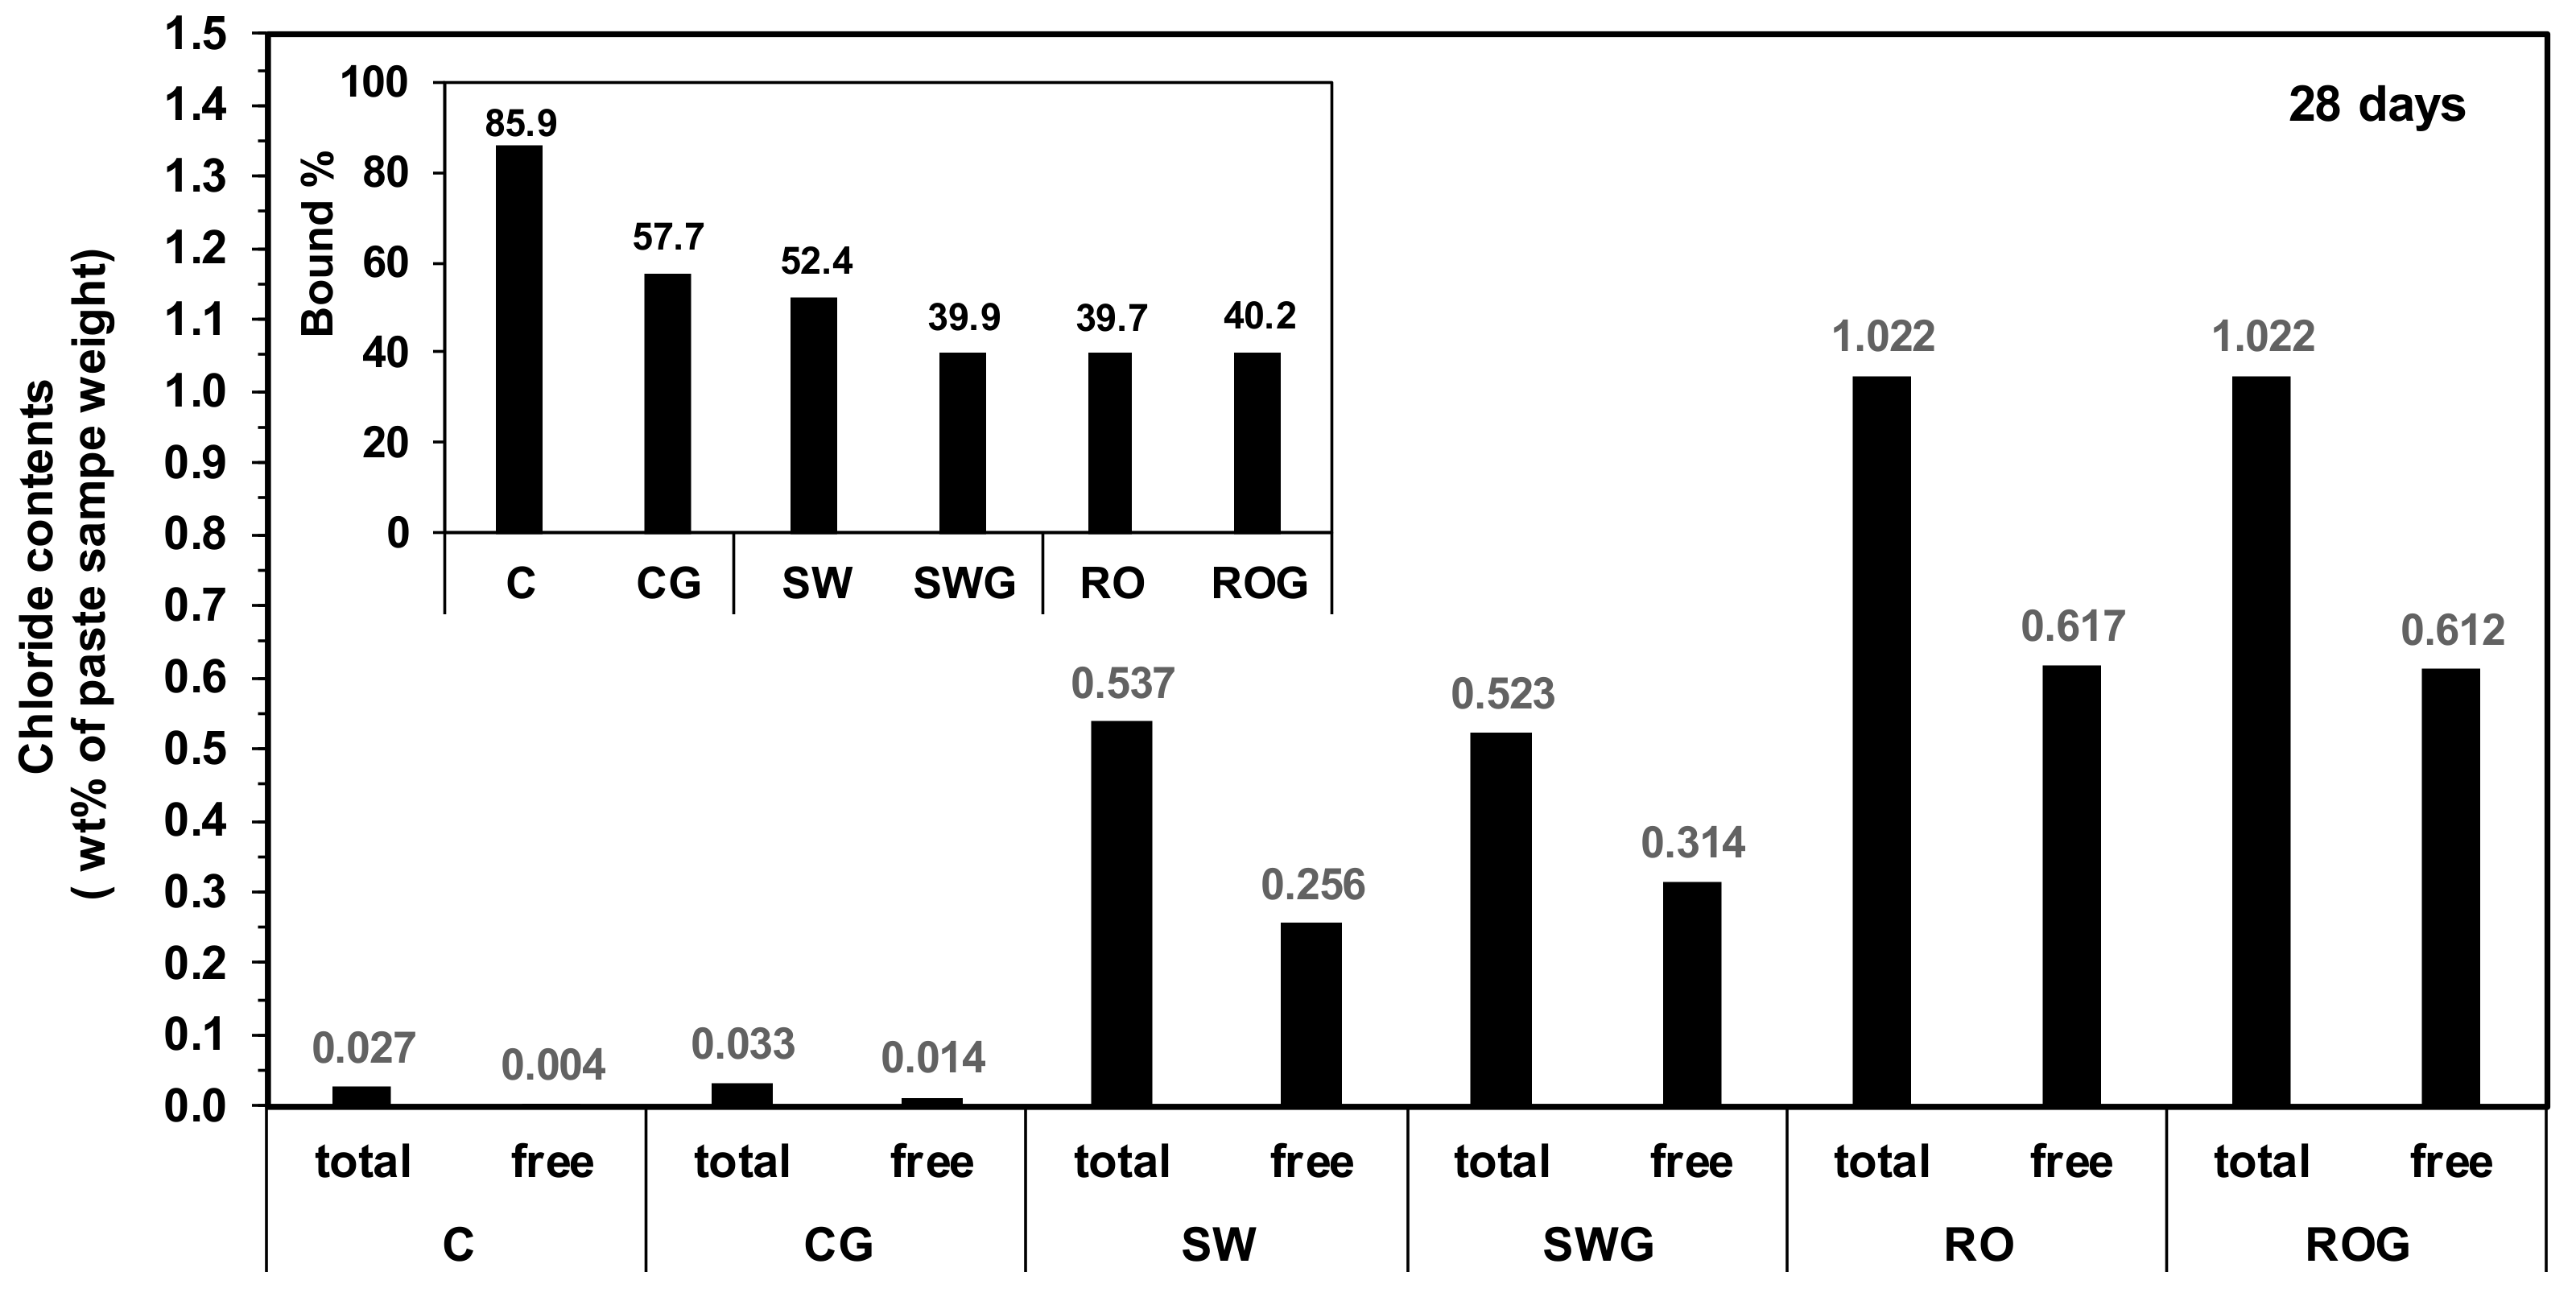
The results of the chloride binding test are given in
Figure 5. Chloride generally exists either free or bound in hardened cementitious pastes. Whereas, free chloride ions travel relatively easily through a pore solution in a hardened paste, bound chloride ions are immobile; thus, the content of the free or bound chloride is more important in estimating the risk of chloride-induced corrosion of steel reinforcements in concrete than the total chloride content [
8,
35].
AFm phases from the hydration of CSA cement (i.e., monosulfate, kuzelite, and Friedel’s salt in this study) generally have chloride binding abilities [
41,
52]. In this study, when the concentration of chloride ions was very low (i.e., as in the case of purified water) and no gypsum was present, the chloride was largely bound by monosulfate and kuzelite (e.g., 85.9% in sample C), as shown in the inset figure in
Figure 5. However,
Figure 5 illustrates that the chloride binding capacity of the CSA cement was evidently insufficient for the use of seawater or RO reject water because the percentage of bound chloride (bound%) was notably reduced when seawater or RO reject water was used, and the bound percentage was the lowest when RO reject water was used (only 39.7% in the sample RO).
In addition, the use of gypsum clearly reduced the bound percentage, particularly in the samples with purified water and seawater. Paul et al. [
52] similarly observed that the lower ratio of ye’elimite to sulfate in CSA cement resulted in reduced binding chloride capacity through chemical reaction because more ettringite formed than monosulfate. Jiang et al. [
53] also reported that the use of gypsum inhibited the formation of monosulfate by forming ettringite. These could be possible explanations for the lowered binding capacity of the gypsum-added samples.
However, although using gypsum tended to reduce the bound percentage, the bound percentage was less reduced as the ionic concentrations of mixing water became higher; for instance, when RO reject water was used, the bound percentage was barely reduced by the use of gypsum. This lessening tendency should be related to the reduced amount of monosulfate and kuzelite in the SW and RO samples (see
Figure 4b). In the case of the RO sample, the binding capacity of RO was already greatly reduced because monosulfate and kuzelite were largely removed; thus, the addition of gypsum did not produce any significant difference between the RO and ROG samples. Rather, greater amounts of Friedel’s salt were formed in the ROG sample than in the RO sample, resulting in a slight increase in the bound percentage.
In this study, although the presence of monosulfate, kuzelite, and Friedel’s salt was beneficial in binding chloride [
41,
52], the concentrations of free chloride were still significant when RO reject water or seawater was used; thus, RO reject water is not appropriate for use as a mixing water for producing reinforced concrete, nor is seawater [
9]. However, if the RO reject water is used only for producing bricks (i.e., no steel embedment), the free chloride content is hardly essential to the durability of bricks; it is likely more important whether severe leaching occurs on the brick surfaces due to the high ionic concentrations of the RO reject water.
3.6. SEM
The BSE images with EDS results are shown for polished samples of CG and ROG, taken at 28 days, in
Figure 6. In general, in the viewing area in a BSE image, the brightness of the area increases as the concentration of heavy elements increases [
54]; thus, by using the gray scale, different phases can be distinguished in the BSE image.
Figure 6 illustrates the gray scales and surface textures of gypsum in the ye’elimite-dominant phase (i.e., anhydrous CSA) and the ettringite-dominant phase (i.e., reaction products of CSA cement) as follows: (1) gypsum and anhydrous CSA showed greater brightness than the reaction products; (2) although the sample surfaces were polished, the gypsum crystals, anhydrous CSA particles, and the areas of reaction products showed distinctive texture surfaces. Thus, using the identified gray scales and surface textures, phase identification was conducted for the BSE images.
Although
Figure 6 showed different particle sizes of gypsum and anhydrous CSA between CG and ROG, when considering all BSE images for other areas observed using SEM in addition to these figures, no significant difference was found between the two samples in terms of microstructure. The overall spaces were filled with gray regions, which mostly consisted of reaction products.
3.7. Brick Production
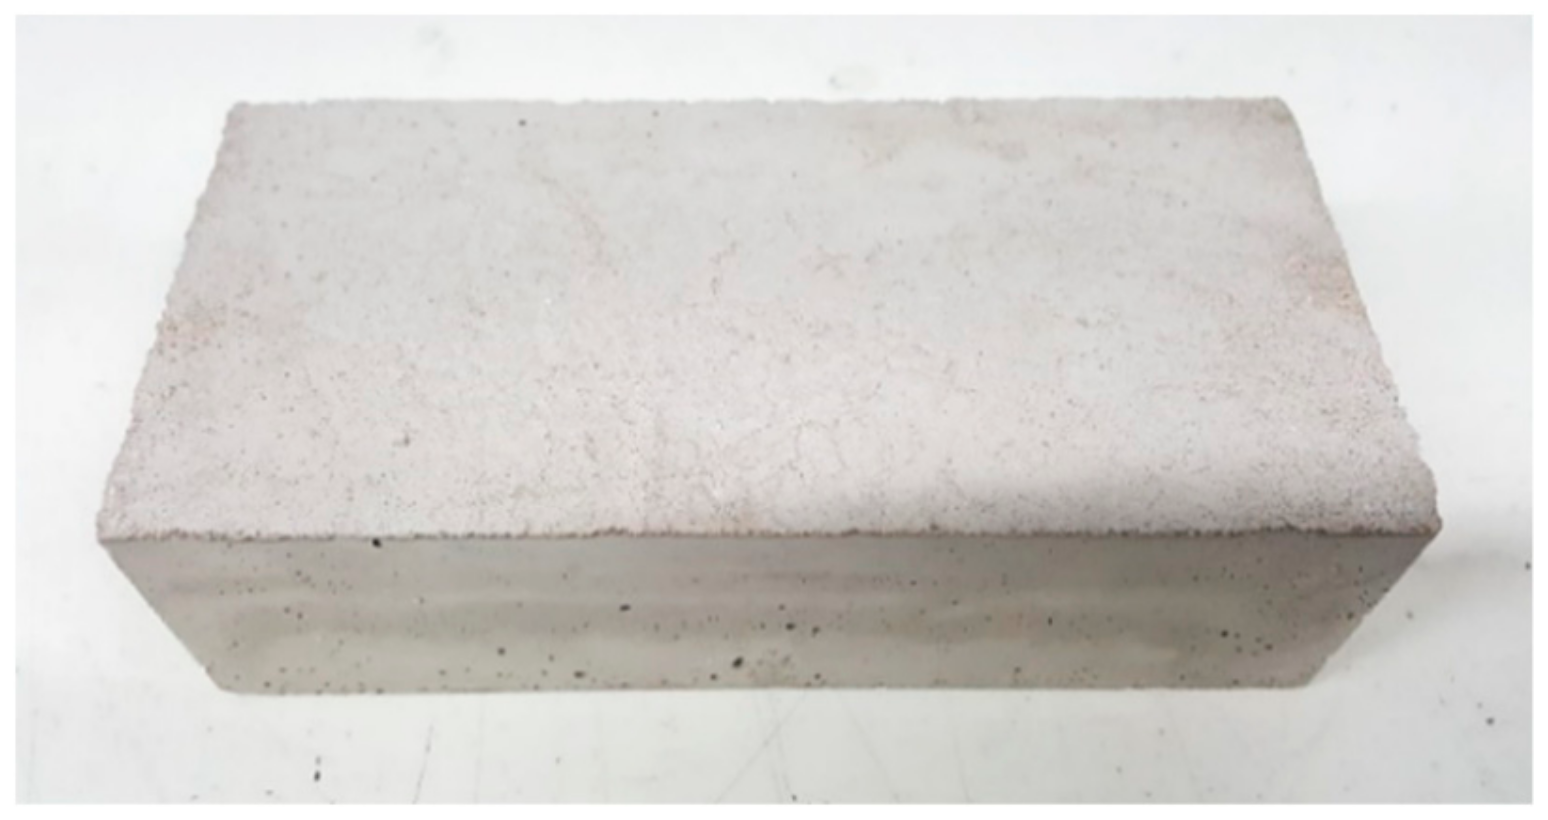
Triplicate samples of bricks with dimensions of 190 mm × 90 mm × 57 mm (
Figure 7), and triplicate cubic samples measuring 5 cm × 5 cm × 5 cm were produced using mortar based on the ROG mixture proportion after curing for 7 days. The 7-day compressive strength was 30.3 MPa, and the water absorption percentage was 7.55%, which satisfied KS F 4004. No indication of expansion of brick dimensions was observed during 56 days after the brick samples were made. The leaching test results are given in
Table 7. The concentrations of As, Ba, Cd, Cr, and Pb satisfied the criteria of TCLP.
From an economic point of view, the recycling RO reject water for brick production can be more beneficial than other costly technologies such as evaporation and crystallization, forward osmosis, membrane distillation, electrodialysis, and zero discharge desalination. This cost saving could cancel off the higher market price of CSA cement compared to the use of PC.
Therefore, it is feasible to produce bricks using CSA cement and RO reject water for commercial use.


