1. Introduction
With the increase of numerous research efforts related to the space environment, the advancements of space technology greatly influence human life in the current era. One of the most important examples is the utilization of satellites for communication and navigation. Currently, space research has been conducted by many countries showing high seriousness by establishing a national space agency that intensively supports government programs in space science and technology development. Indonesia, represented by the National Institute of Aeronautics and Space [
1], is one of the countries in the Association of Southeast Asian Nations (ASEAN) that is actively researching aeronautics developments and space weather activities. In space research, LAPAN (Indonesia National Institute of Aeronautics and Space) has an information system service that provides data, information, and forecasts related to space weather called Space Weather Information and Forecast Services (SWIFtS). SWIFtS is one of the space weather services approved as an ISES member for the ASEAN region since 2016. The International Space Weather Services (ISES) is a collaborative network of space weather service, was established to coordinate, improvise, and deliver operational space weather services. The SWIFtS website contents are daily analysis results by forecasters that include solar activity, geomagnetic activity, and ionospheric activity, as well as one-day or three-day forecasts at the weekend. Other essential information is also provided to the space weather user community, such as the current conditions on high-frequency radio communication propagation, the position error percentage for navigation, and the number of proton energies from the sun that impact satellites and high-frequency predictions [
2].
SWIFtS researchers and forecasters conduct daily data analysis and processing to provide accurate information on the SWIFtS website for the user. For this reason, the data availability from space weather observation instruments is continuously updated to maintain information. At the background process, SWIFtS are supported by the data storage system that collects the data from various instruments installed on observatory stations spread throughout areas in Indonesia. The daily information provided by SWIFtS requires the data storage system to be continuously running well. The existing system implements the client-server hierarchy based on the centralized model. However, the process that has been running did not meet our expectations. The delay in data updating on the server is a significant issue and causes problems when researchers need the latest data, but the server is unable to provide it. For instance, the Canadian Advanced Digital Ionosonde (CADI), which is a special radar for studying ionized parts in the Ionosphere. Almost every day, its data from Biak observatory that formed every 15-min gets delayed more than 30 min when synchronized to the Bandung server. This is due to the centralized model that is implemented in the current system. Each time a personal computer (PC) collects data from the instrument, it sends the data to a server located in the observatory stations.
The rapid growth of data provides great benefits for its users; thus, data is becoming a valuable asset and must, therefore, be properly maintained [
3,
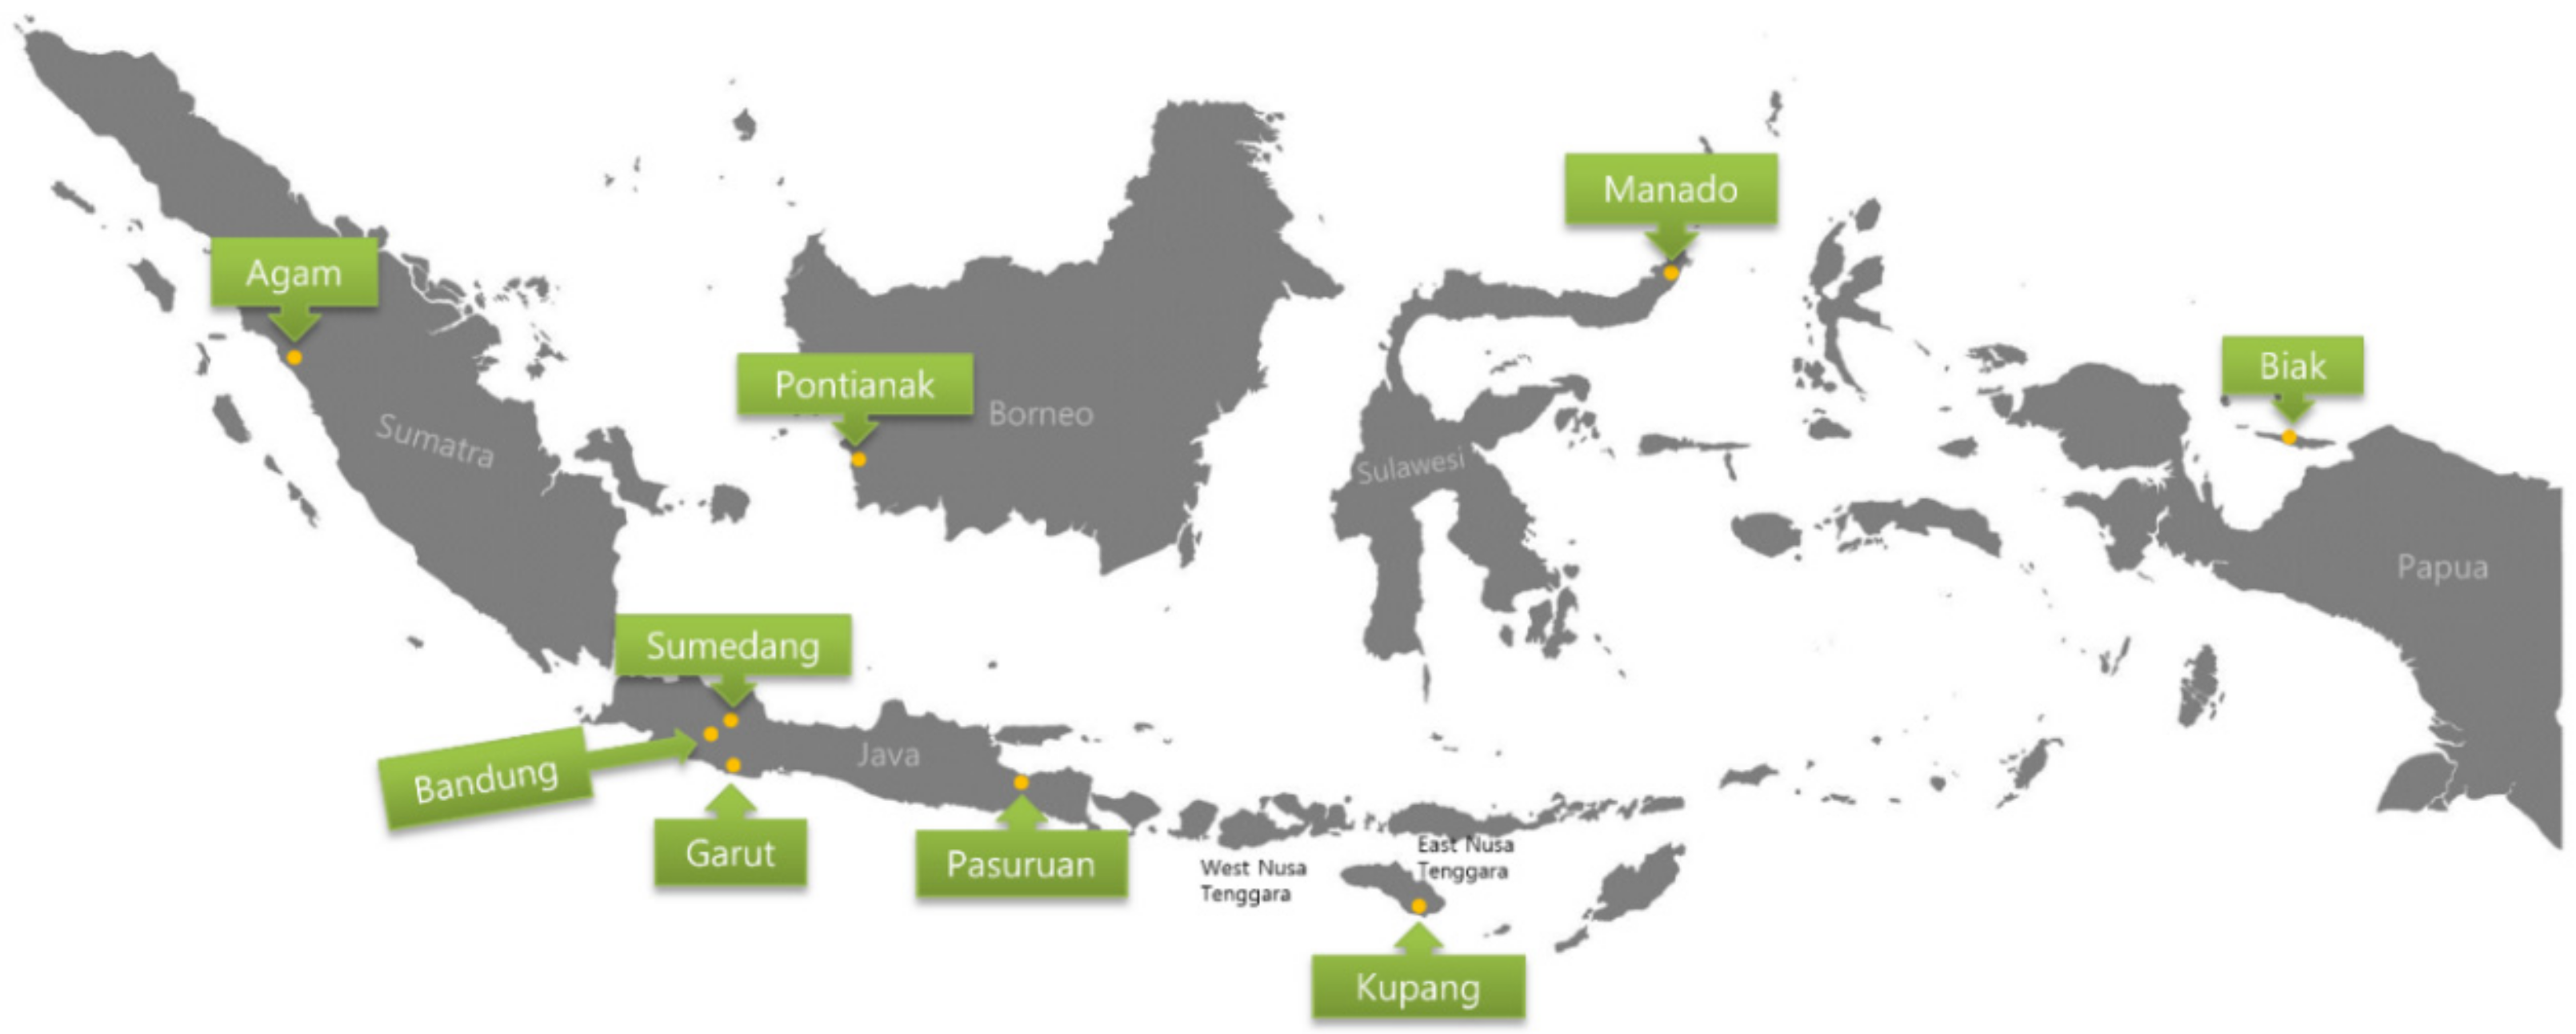
4]. In data production, LAPAN has eight observatory stations (hereafter referred to as sites) spread in different islands and one central data center (
Figure 1). Researchers in Bandung, where the data center is located, need actual data for data processing and making forecasts to update the SWIFtS website. Problems arise when servers in Bandung must provide the latest data while the site server is down. The researchers have trouble conducting their research, and the renewal of information on the SWIFtS website is hampered.
Centralized data management is a conventional method to store data that relies on one single server. A major drawback of this approach is the data availability issue; access to data is limited only by server lifetime and the connection between the user and the server. Moreover, the centralized storage system can represent a high risk of data loss without an optimal backup system. Further investigation reveals that, in addition to being a single point of failure, other issues that cause data updating delay in centralized storage include heavy traffic volumes and link bottlenecks. Moreover, the instruments that have generated the latest data cannot update the server dataset, and the data growth increases daily, requiring adequate storage capacity.
Hence, a new solution that can address these problems is needed. To improve data availability, we should move to a decentralized storage system. This can benefit by leveraging available resources from other hosts, taking advantage of high data throughput, while also mitigating single point of failures. The decentralized storage is a method of storing data by encrypting and distributing the data across a decentralized network. It does not rely on a central service provider for data storage. Decentralized storage can eliminate and solve the problem of data failures [
5] and outages in the traditional storage system by increasing security, privacy, and control of the data [
6,
7,
8]. Moreover, decentralized storage also can increase the percentage of data availability by spreading files to be stored on the hosts that are connected peer-to-peer. Consequently, this method, where each host can exchange files directly, as well as have roles as a client and server, would reduce user dependency on a single server. In addition, encryption by a hash function offers an advantage of compressing files and protecting from data corruption. Thus, data generated by the instruments can be kept on each data collection server continuously without concern about single-point failures while also providing improved data security [
9].
The InterPlanetary File System (IPFS) is a peer-to-peer decentralized system protocol for distributing files throughout connected computing devices in the same system of files. The IPFS provides a high data throughput with a content-addressed block storage model, requires no central server, and distributes and stores the data in spread locations [
10,
11]. The IPFS allows any node that has a connection to the network to be able to retrieve and store data for themselves by “pinning” content actively. In this study, a new system was proposed for data management using a decentralized storage model, leveraging the IPFS distributed system for storing and sharing the space weather observation data across the peer-to-peer network. We also coupled IPFS with IPFS-Cluster to replicate automatically as well as limit the replication of data only for peer members [
12]. Moreover, a technique for monitoring the system through active and passive approaches was developed. The passive approach was intended to gain the flow of data between nodes, and the active approach determined the status of each node (e.g., whether online or not). Afterward, system performance was evaluated and analyzed by comparing the performance of the proposed system with that of the existing one. The tested parameters were the mean time of replication of files and the mean throughput from a node.
The remainder of this paper is organized as follows.
Section 2 discusses the background of this study, and
Section 3 provides the architecture of the proposed system.
Section 4 describes the detailed implementation of the system.
Section 5 deals with the experiments and results of this work. Finally, the conclusion and future direction are presented in
Section 6.
2. Background
A reliable storage system is needed to provide a high availability of data that meets user needs with an automatic process. This is because various data are produced by the instruments continuously, such as every 5 min, 15 min, hourly, and daily. It would be impossible for a human to conduct this as a manual process.
The researchers in LAPAN need data from space weather observations as input to their research. When the necessary data is not available, the production of the latest information is hampered. We indicated that the centralized method of the existing system has several drawbacks, such as low data availability, low throughput, and increased time for data updates. Reliance on one server can result in a single point of failure when the destination server is down. Currently, the main server in Bandung is the central destination for storing data. A large number of users accessing the Bandung server can create a high network load on the server.
Furthermore, the process of synchronizing data between the Bandung server and all the site servers at the same time also affects network performance on the server. If one elaborates on those factors, the main problems associated with data updates arise from synchronization at the same time from the central server to all site servers or between site servers and PCs. The current system employs two crontabs (cron tables), which are configuration files that specify shell commands for running a script program on a schedule. First, a script on the site server runs the main program every 5 min for data synchronization between the site server and all PCs (
Figure 2). Second, a crontab job on the central server runs every 15 min. It synchronizes the data between the central server and all site servers (
Figure 3). All synchronization processes run at one time to synchronize all data through the default secure shell (SSH) port utilizing the Rsync tool. Thus, this process creates a queue of jobs that have to be executed, while the various data from each site and instrument should be stored safely in real-time and without damage. This lowers throughput in sending data because of the scripts running at the same time on one port. Low throughput affects the duration of data synchronization due to the high network load; thus, synchronization takes longer. A delay in updating files also occurs when data with small size cannot be sent immediately because of the need to wait for the larger data in the queue to finish. Of course, these situations emerge as a problem when all concurrent access is directed to one port. The queue builds and causes a delay for data updates due to the high network load.
Related Works
This section reviewed the requirements of the user and related works that leverage decentralized network approaches to store the data that needs the user as an actor to upload or download the data manually. Most of the papers explained the utilization of the IPFS as their storage system combined with blockchain. However, they did not disclose detailed information on how the IPFS works.
The requirements for the user are a good way of understanding the fundamentals to solve the problems and reach the goals. The proper formulation of requirements can decrease the system’s risk that does not meet user needs [
13,
14]. The users of space weather data are the researchers who analyze daily data to make accurate information on the latest events for the next one or three days for updating SWIFtS’ website and validate the forecast made previously. Based on the user scenario, these requirements were presented.
Researchers can download the latest data whenever they need
SWIFtS users (stakeholders) can find out the latest information from the SWIFtS website
The system is able to distribute data as fast as possible
The system is able to increase data throughput
Administrators can monitor data flow in real-time
Administrators can monitor node status in real-time
Since the focus work is to build a distributed system, the requirements revolve around the notion of a system that should be able to run with the automatic data update process, increasing data availability and monitoring the useful information.
Sia is a simple decentralized storage system proposed by Vorick et al. [
15]. They need clients as users to upload and download files in the Sia network; there is no automated process involved with getting or putting data. Likewise, there is Storj, a peer-to-peer cloud storage network [
16]. Wilkinson, assisted by some contributors, has built Storj by proposing a Proof-of-Storage. However, this system also needs actors to upload and download files manually from the system. Similar to Sia and Storj, Maidsafe comes with other demands for storing data in the decentralized and secure network [
17] and needs a manual process to store and retrieve the data. Sia, Storj, and Maidsafe rely on the blockchain network and have a more commercial focus, needing cryptocurrency to use their service.
However, our proposed system did not need cryptocurrency or tokens because there was no commercial orientation in this system. Our focus was only on file exchange without coin/token utilization. Moreover, this system also required an automatic process to store and retrieve the data without human interaction.
The building of scale-out network-attached storage (NAS) and the IPFS to store an object spread through the Fog/Edge infrastructure has been proposed by Confais et al. [
18]. This system has implemented a Proof-of-Concept using RozoFS with modifications in the IPFS source code. However, this system has not provided a detailed explanation of how the IPFS works and what protocol the IPFS uses. Another work, by Brisbane, has proposed the decentralization for big data [
19]. He leverages the IPFS by changing the Hadoop Distributed File System (HDFS) as the file system. He has not given a detailed explanation of how the IPFS stores and retrieves the data. In the distributed system, the replication file is very important to provide fault tolerance. As a default, the replication factor in the Hadoop Distributed File System provides for three nodes [
20]. In our proposed system, we implemented a replication file for the other three nodes and set a node as a leader in the cluster. We also provided a detailed explanation of how the IPFS works as a distributed file system using a P2P network.
Indeed, the IPFS provides a web user interface on each node connected to the network. One of the features that are displayed is the all global peerIDs that are connected to the IPFS. However, our system only needed status information from all nodes in the cluster and data flow from each node added to the IPFS. In addition, we needed a centralized monitoring system that could determine the current condition of all peers in our cluster that the IPFS does not have today.
3. System Design
This section analyzed the design of the proposed system, such as system architecture and network diagram. We also explained one sample process of the sequence diagram and showed flow diagrams of our monitoring approaches.
3.1. System Architecture
This paper utilized the IPFS as our core system to store data and distribute it to other nodes. In the IPFS, initializing the repository generated a key pair (public and private key) and formed a local folder that hosted the IPFS configuration and stored repository objects from a node. The identity of each node (NodeID) was made by using a hash of the node’s public key.
The proposed system was making the central and site server as a node connected to the IPFS network in a swarm. Peers were restricted to a private IPFS network that had been prepared for the process of distributing files between peers automatically. When a file was published on the IPFS, peers could access that content to keep in the local copy. For saving node’s resources space, data became publicly available only for at least 24 h; if there was no interaction (pinning) from other peers, data would be thrown to the garbage collector without recycling. The garbage collector tool was used to clear unused data in the network. In our proposed system architecture, it was necessary to handle the sharing of files by automatic pinning since the instruments generated various and continuous data to present the latest available quickly.
IPFS-Cluster is a tool used to coordinate between IPFS daemons running on different hosts [
21]. If they were interconnected in one cluster, then every object added by a peer in IPFS would be pinned by all members automatically. So, if one peer disconnected from the network or deleted that object, it was still provided by others. Thus, this scenario might not significantly increase the storage space of the nodes since each file with identical content would not be stored. Moreover, the beneficial came up since employing available resources space on nodes, which have a lot of space.
In
Figure 4, we could see the instrument’s PCs to be included as parts of this system because they were the initial contributors that collect data from the instruments. They have two types of operating systems installed, Windows and UNIX.
Figure 4 shows the architecture of the proposed system. The data communication module between server and PC was using TCP/IP. For the data transfer module, this system separated it based on the PC’s operating system. File Transfer Protocol (FTP) was used for data transfer to the Windows OS, whereas Secure File Transfer Protocol (SFTP) was used for the PC, which had the Unix OS installed. Each of them had a data collector as a place where data was stored. The data collector watcher had been used on the instrument’s PC for sending the latest file automatically to the data collector on the site server (IPFS node) and then generated a log file containing its metadata. This watcher was built with the watchdog library from python.
On the IPFS node, a data collector watcher service, which was essential to keep the latest data available, was also employed. This service was built using the pyinotify library from python and a client library of the IPFS API. On this node, also a distinct root directory was created based on the instrument’s name to receive data from the PC, which collected the observation (raw) data from the instrument. The program code used a threading technique to be a separate process for monitoring on each root directory. When the new file was produced and sent by the instrument’s PC, it was collected to a folder on the server, which was named according to the instrument’s name. The program added data to the IPFS whenever there was a change in the folder and generated a log containing metadata information, such as filename, timestamp, the instrument’s name, block hash, file size, and total size. The server ran the IPFS binary to manage its resources and connect to the network as an IPFS node. LibP2P was the major part of our system that required some mandatory tasks, such as allowing for data and communication transport, creation of a distributed hash table, and file exchange in the system. For the data communication module, the link between the PC and the server was connected by TCP/IP.
3.2. Network Diagram
Our system used a virtual private network (VPN) to build link communication in our underlying network provided by the vendor. One of the advantages of IPFS is it supports for connection behind the firewall. IPFS was applied to all servers (sites and central), which used an IPFS-Cluster to connect them as members in one cluster. Each server had a unique identifier called a node ID and used a multiaddr-formatted byte string to communicate among nodes in the overlay network. Additionally, the IPFS-Cluster was used to give the limitation of file distribution flow only in our environment.
All peers in our cluster only had two kinds of roles- peer and leader peer. Each site became a standard peer while the central server took a role as the leader. When nodes needed to exchange files, a peer-to-peer connection was built between them, so a node could connect to another directly (see
Figure 5). Bandung was essential as the main site of our data center and had a significant number of users who need the data, so Bandung must collect all files by replication, each time new files were created. Currently, the total amount of data produced by all instruments is 724 MB/day, and they are collected centrally in the Bandung data center.
As we described before, we replicated all files as fast as possible to reach real-time availability. However, the proposed system did not replicate files to all peers in consideration of network and storage costs. Each node had distinct characteristics in bandwidth capacity, link connectivity, and the total amount of data passed daily. According to
Table 1, we considered choosing other nodes for storing the data based on the same geographical location with Bandung in Java Island. This would have an impact on reducing the time when Bandung needed to get the file from other nodes, which were indicated as offline in their status. Moreover, we considered selecting the other nodes, which had the lowest total size in collecting data for daily, nodes with higher bandwidth capacity than others and preferred to choose nodes that were connected by fiber-optic links. Thus, based on these considerations, the nodes in Garut and Pasuruan were selected as the second and third center of data replication.
Currently, node Garut has 5 Mbps of bandwidth capacity with a fiber optic connection and is collecting 21 MB of data daily. Meanwhile, node Pasuruan has 7 Mbps for the bandwidth capacity by fiber-optic link and is collecting 39 MB of data daily. Our proposed scheme added the second server in Garut and Pasuruan that had the role of only receiving the data replication from others together with Bandung. This approach was inspired by the hosting role in the Sia project.
3.3. Sequence Diagram
In our system, two methods were used for collecting data between machines. First, when the instrument generated a new file and stored it in the PC, the data watcher service charged the PC for sending the latest data to the site server. A secure shell (SSH) port was used for the PC (having the installed Unix OS) to synchronize the data by Rsync, and FTP for the PC, which had Windows OS.
Secondly, a data watcher was implemented to observe the root directory of data in the site server based on instrument type. Thus, this watcher would force the server to upload the latest file into the IPFS network each time it is created. Afterward, the server, like an IPFS node, would store the data as an object in the local repository and put the metadata of the object in the distributed hash table (DHT) (
Figure 6).
3.4. Monitoring Approaches
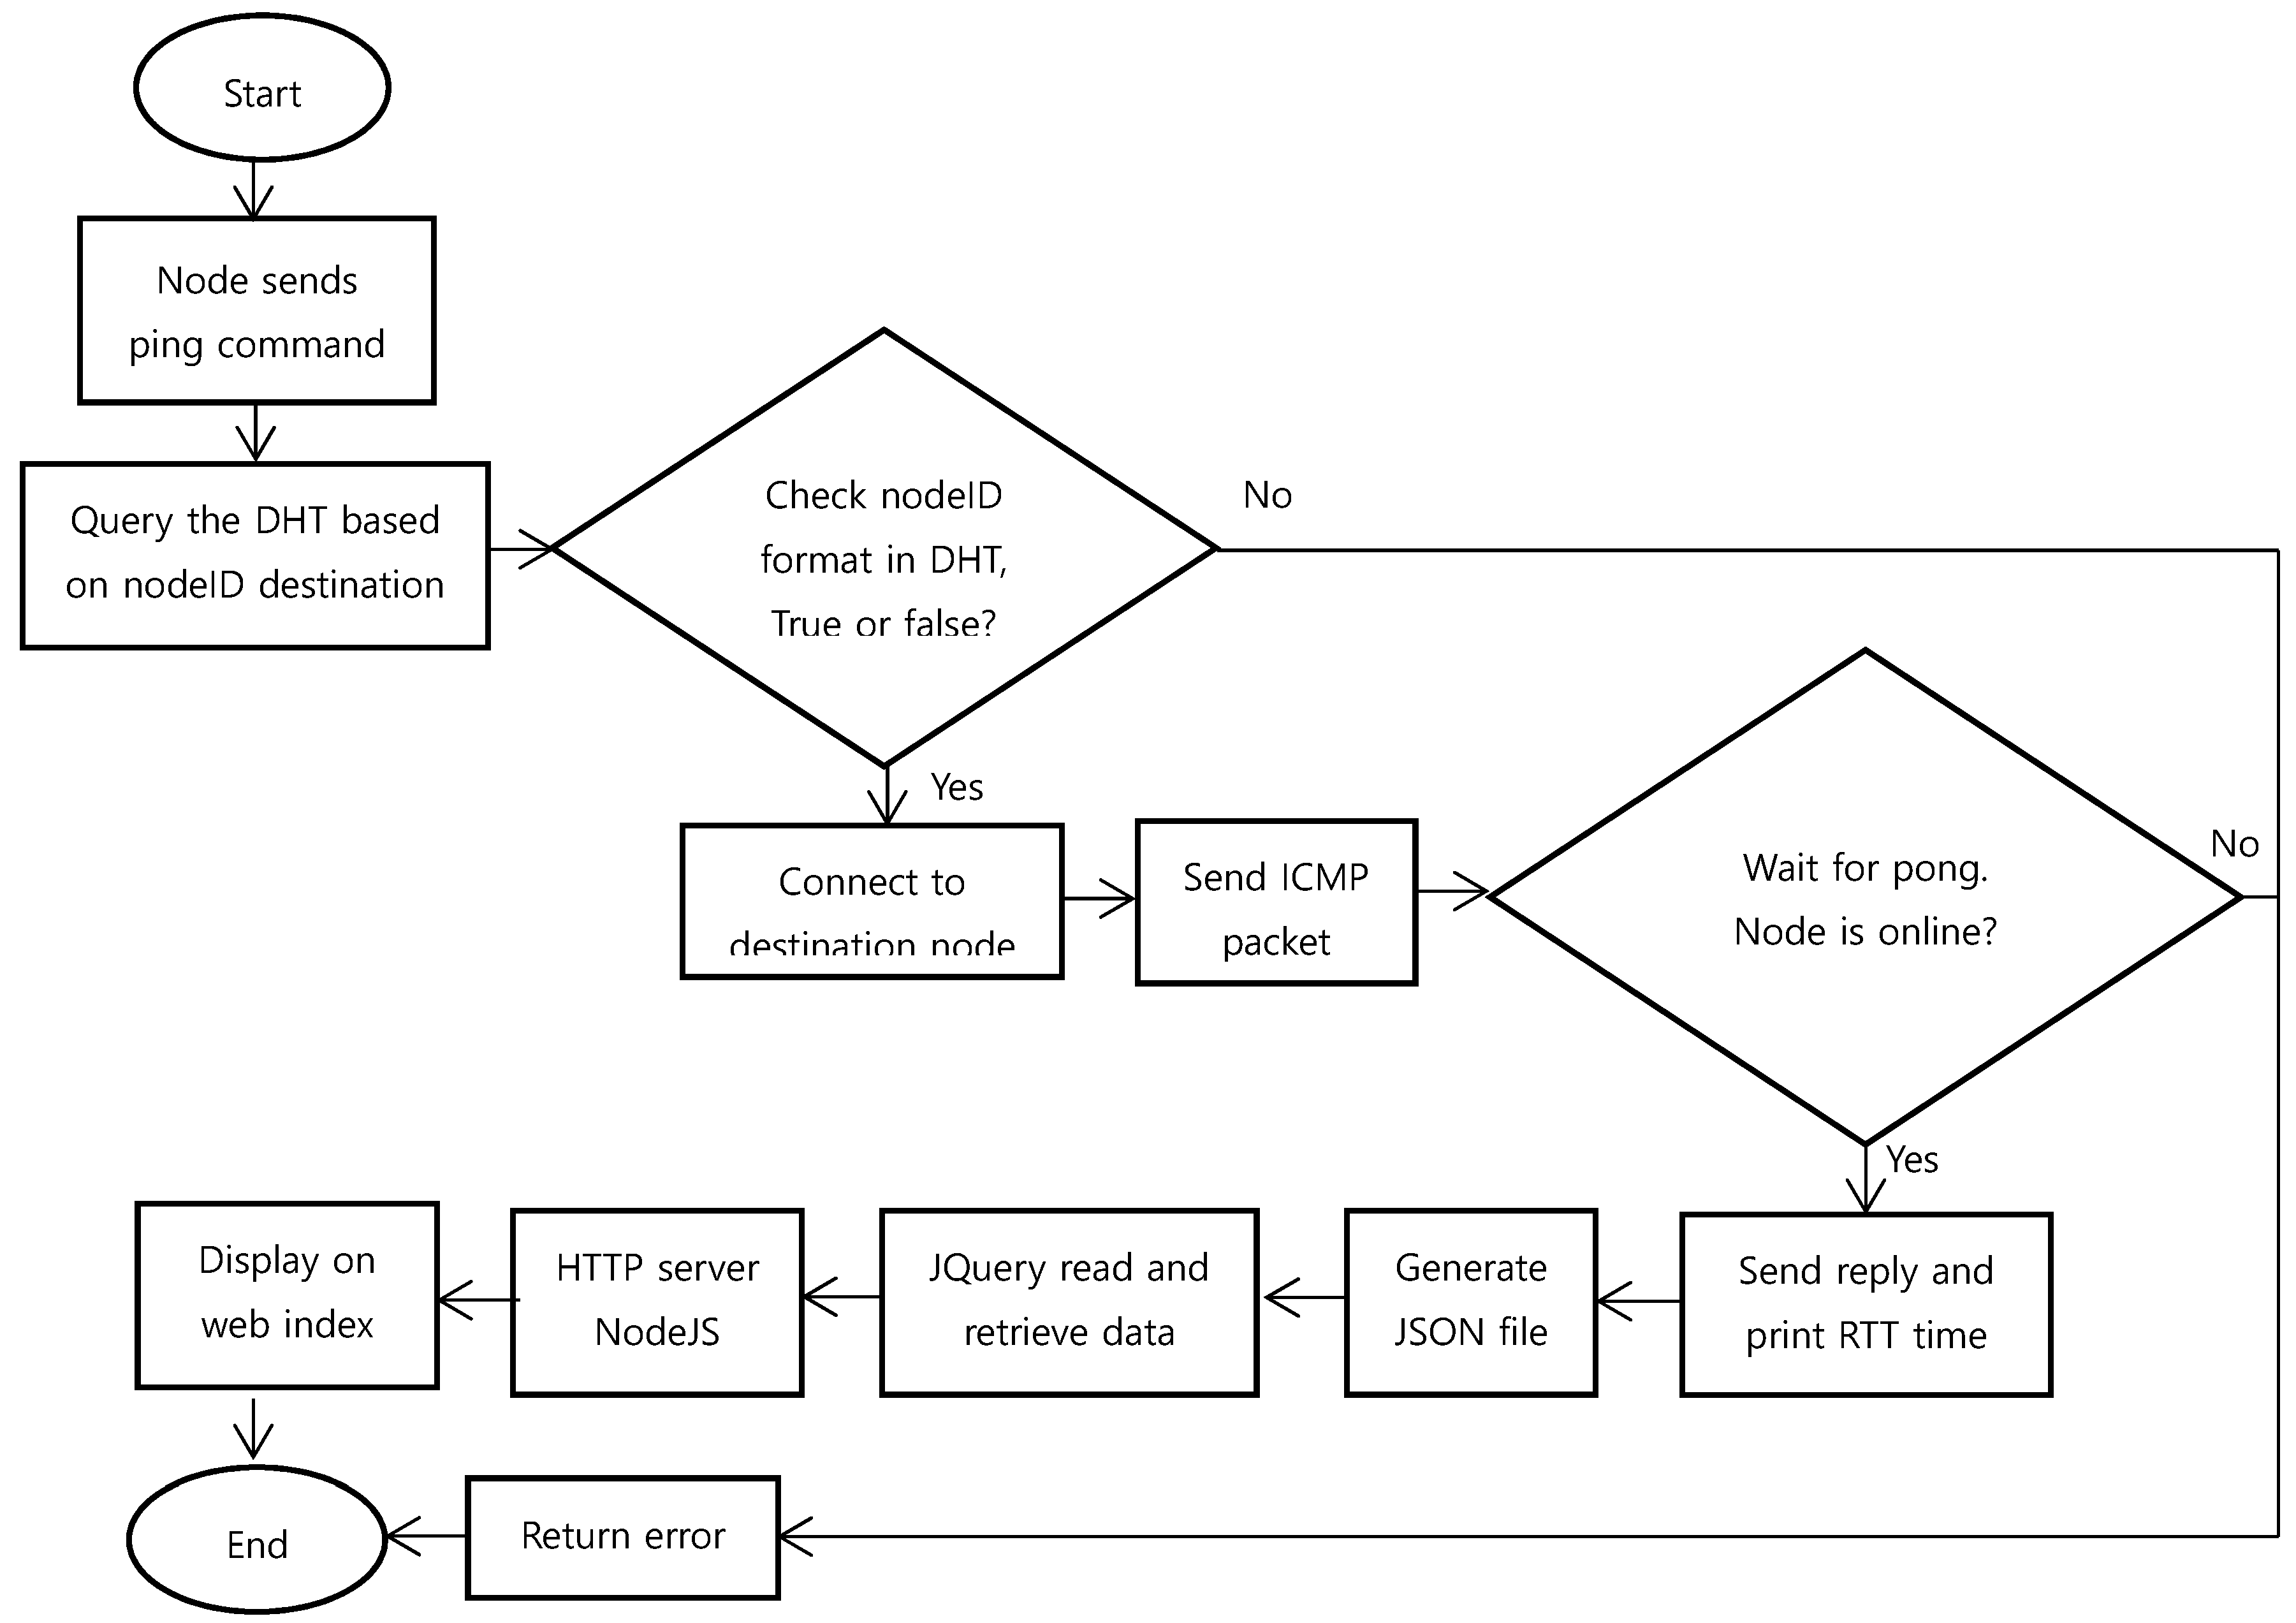
Monitoring was created on the peer leader to monitor data flow and nodes status. This monitoring was performed by relying on active and passive approaches. Active monitoring was approached by pinging the aimed nodeID in the IPFS network (
Figure 7). It ran every minute to obtain status information from all nodes. This ping was not just sending Internet Control Message Protocol (ICMP) packets to the destination node but must go through several additional stages.
When the ping command was executed, the node would find the nodeID in DHT first, then establish a connection to that node. Henceforth, it sent the ICMP packet and waited for the pong response. If the destination node was offline, then the pong produced an error; otherwise, it received a reply and finally printed out round trip time (RTT) for its latency. The pong result was formed to a JavaScript Object Notation (JSON) file and displayed on a web page by a JQuery function. NodeJS was used as our HTTP server, and the index page would update the status every 20 s.
Moreover, our passive approach utilized a data collector watcher that monitored each time the latest files were sent from the instrument’s PC to the site server. It then uploaded the file to the IPFS via the IPFS-Cluster automatically. This process generated a log file based on the instrument’s name that contained information of the metadata file, such as filename, timestamp, file size, block hash, instrument’s name, and total size. Additional synchronization of all log files was conducted between the site and central server every minute using Rsync. Updated log files on the main server would be retrieved by JQuery via HTTP and displayed on the website (
Figure 8).
5. Experiment
This section discussed the experiment that was conducted to determine the performance of the proposed system compared to the existing system by calculating mean replication time and the mean throughput of a node.
5.1. Experimental Data and Method
This experiment was intended to evaluate the Rsync that was implemented by the existing system compared to the IPFS coupled with the IPFS-Cluster. The tests were conducted using three PC machines with the specifications mentioned in
Table 2.
Several experiments with tested parameters were conducted at the computer network lab of Keimyung University. All computers (1, 2, 3) had the same role, representing servers in the system. Each machine used a different IP network mask for obtaining a fair connection between IPFS and Rsync. Computer 1 was set up using a public IP, while Computer 2 was configured by local server IP, and Computer 3 was the client. Both Computer 1 and Computer 2 were connected with Unshielded Twisted Pair (UTP) cable to a switch, while Computer 3 was connected to Wi-Fi. To observe a more realistic scenario, the environment was set as follows:
- (1)
One folder was created containing four instrument folders, namely CADI, SN4000, ALE, and FLUXGATE.
- (2)
Each instrument folder contained a year/month/day folder.
- (3)
All files were spread evenly only at folder day “01” of the month “01” (folder 2019/01/01/) on each instrument folder.
- (4)
As for the parameters, the number of files (100) was varied with distinct sizes (256 KB, 1 MB, and 100 MB). The IPFS could not store files with the same content; therefore, all data was generated randomly by the /dev/urandom interface for all tests, including Rsync. There were 100 files of each size, with five trials for both Rsync and the IPFS + IPFS-Cluster. A total of 9000 datasets were tested for a total of 33.768 GB for its overall size.
- (5)
The network latency on all computers was set, such as no latency (default), 5 ms, and 20 ms latency. Latencies were emulated artificially using the Linux traffic control (tc) tool.
The purpose of our measurements was to determine the performance of the system. The file replication time was measured among machines for both Rsync and the IPFS coupled with the IPFS-Cluster. For Rsync, the duration of a file copy sent from Computer 3 and received by another computer was obtained. Meanwhile, in the IPFS + IPFS-Cluster, all machines were set as peers in one cluster. Files were replicated from Computer 3 to Computer 1 and Computer 2. Then, the elapsed time between the “pins” of the file by the peers was computed.
In addition, the mean throughput was derived by calculating the average of the data replicated per second; this could be obtained by dividing the total file size by the time elapsed during replication.
5.2. Mean Time of Files Replication
Overall, the results showed that replication using the IPFS + IPFS-Cluster was faster than Rsync. This was because the IPFS replicated all files using chunks formed by the hash function, which has a small and fixed size.
Figure 11 presents the replication time of files as a function of latency when all files were only replicated from Computer 3 to Computer 1 and Computer 2. The main observation was that the latency had a more significant impact when replicating large files. File size determined the duration of replication due to the bandwidth limit. The effect of latency also appeared to be very significant in the replication time. It could be seen that high latency made a considerable difference compared to low latency. It took 332.35 s to replicate files of 1 GB (100 × 10 MB) when the default latency was considered, and 427.45 s when the latency of 20 ms was used for the IPFS + IPFS-Cluster. Similarly, in Rsync, it was 335.57 s at the default latency and 414.02 s when the latency was 20 ms.
Another interesting observation was that file replication by IPFS + IPFS-Cluster experienced a slight drop within small and large latencies where it took 47.91 s and 43.2 s for file sizes of 100 MB (100 × 1 MB). On the other hand, file replication by the Rsync had a rising trend when latency increased. Replication took 7.49 s to 12.83 s for the file size of 25.6 MB (100 × 256 kB) and 29.55 s to 62.92 s with the file size of 100 MB (100 × 1 MB). This might be due to the more stable bandwidth used or minimal usage sharing Wi-Fi with other users.
5.3. Mean Throughput
The mean node throughput was derived by dividing the average size of the replicated file by the transfer time.
Figure 12 shows the mean throughput based on the number of files that were replicated from Computer 3 to Computer 1 and Computer 2 with either the IPFS + IPFS-Cluster or Rsync. In general, the results showed that the throughput by the IPFS + IPFS-cluster was greater than that of Rsync for each file size. The main observation was that the file size affected the level of throughput produced. The highest throughput generated was 2.64 MiB/s for the IPFS + IPFS-Cluster and 2.59 MiB/s for Rsync for a 1 GB (100 × 10 MB) file size. Meanwhile, a slight decrease in throughput of approximately 0.25 MiB/s and 0.57 MiB/s occurred in the IPFS + IPFS-Cluster and Rsync, respectively, when replicating files with a size of 25.6 MB (100 × 256 KB) and 100 MB (100 × 1 MB). This was in contrast to the throughput generated by Rsync and IPFS + IPFS-Cluster, which showed an increasing trend of approximately 16% and 32% for files with sizes of 100 MB (100 × 1 MB) and 1 GB (100 × 10 MB), respectively.
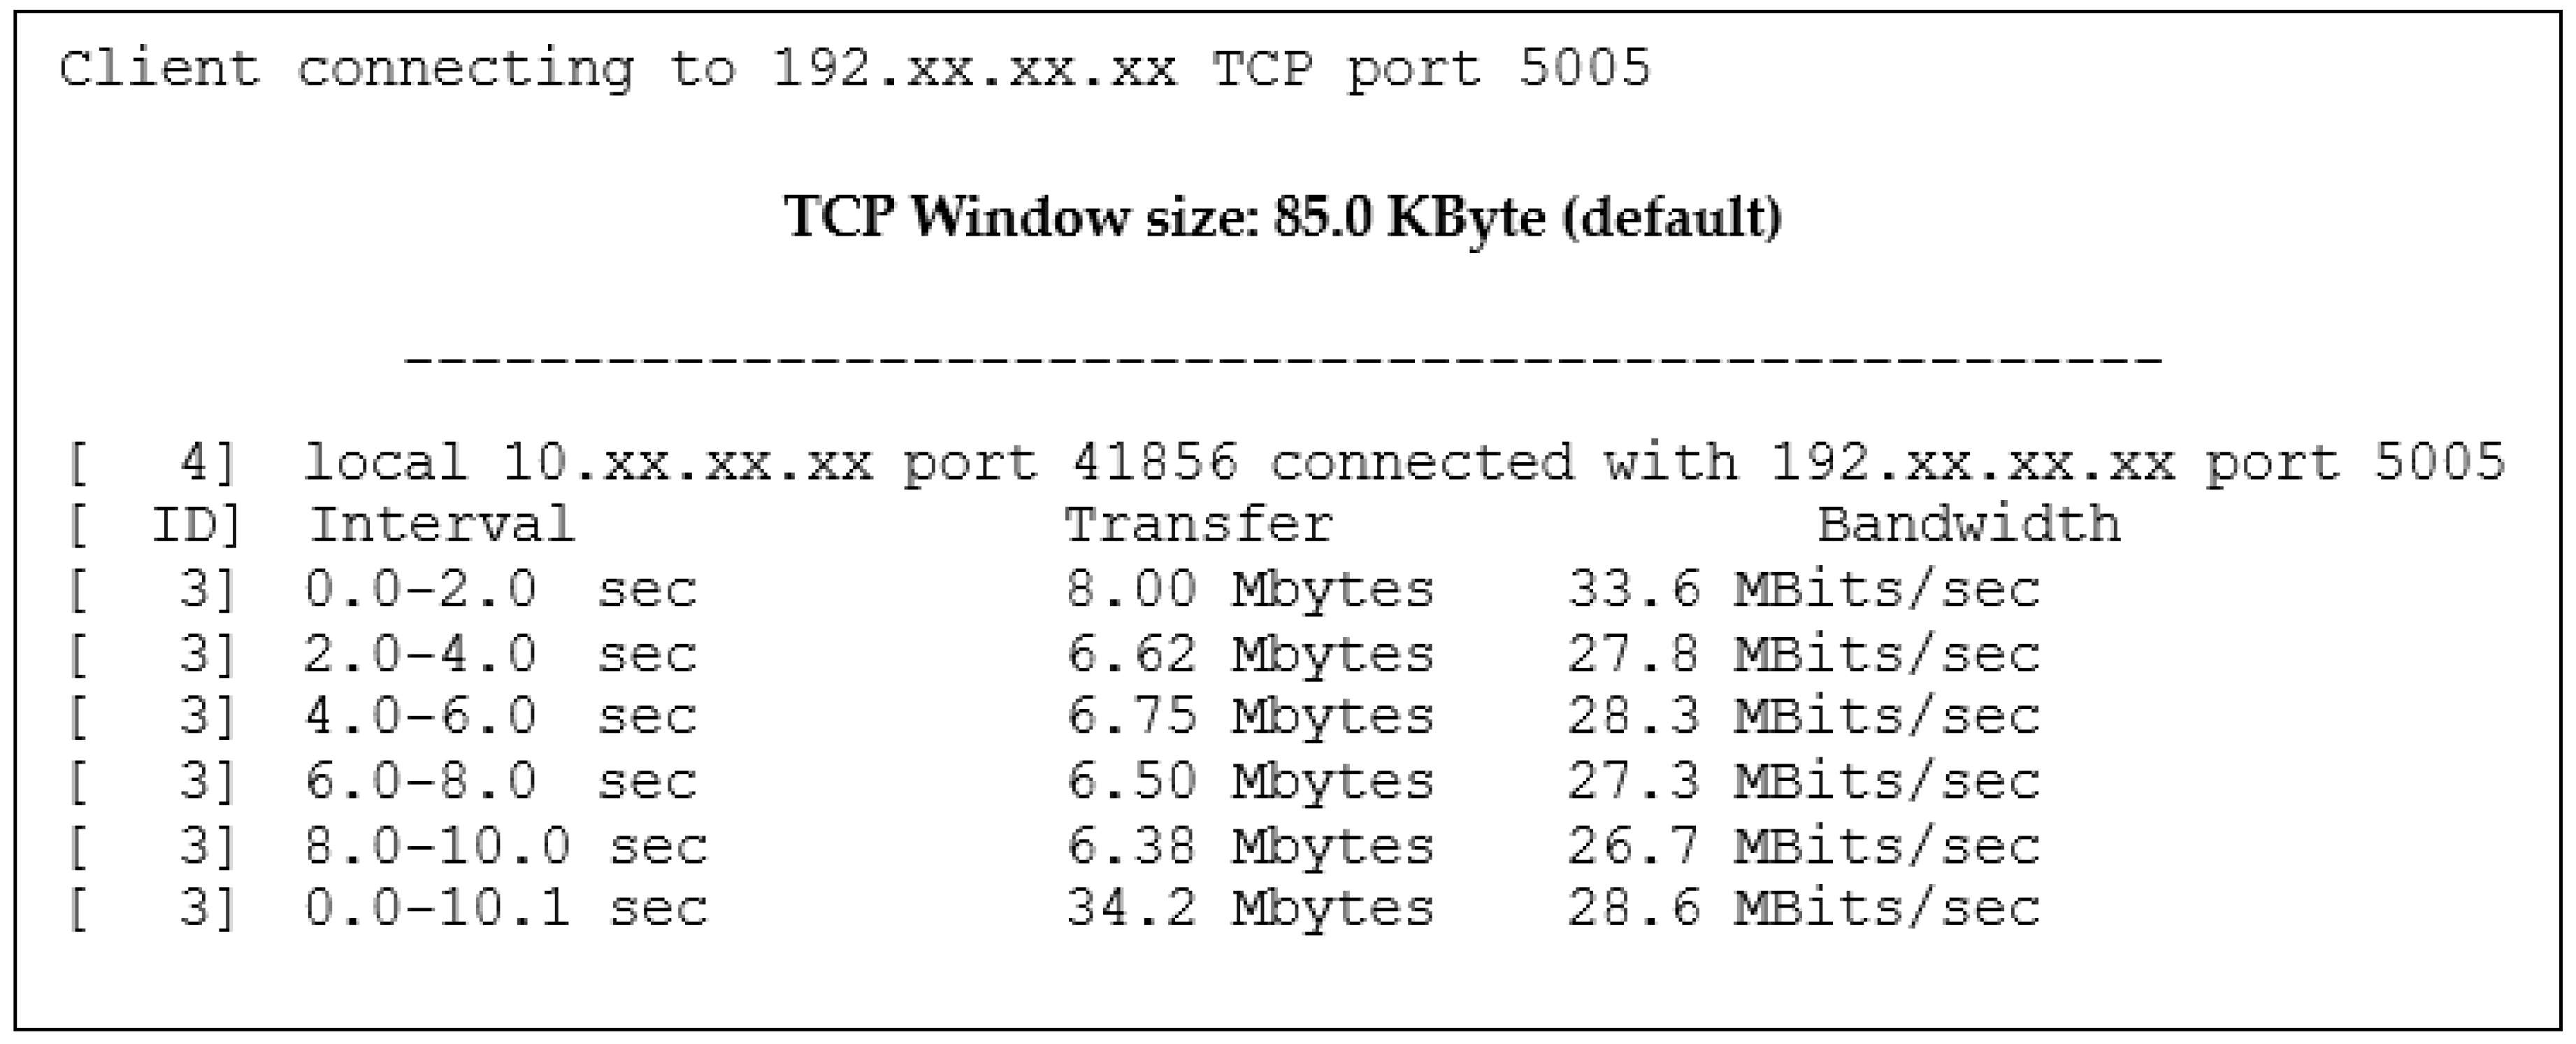
The network bandwidth measurement was supported by the
Iperf for deriving the average network bandwidth between Computer 3 and Computer 1.
Figure 13 shows the measured bandwidth with
Iperf between Computer 3 (client) and Computer 1 (server). The average bandwidth of the measurement was calculated at 28.7 Mbits/s. If we compared the highest node throughput score of the IPFS + IPFS-cluster with that of Rsync, it was seen that the IPFS + IPFS-Cluster throughput almost approached the average throughput generated by the network with a rating 2.64 MiB/s × 8 = 21.1 Mbits/s. This indicated that the IPFS-IPFS-Cluster supported high-throughput so that it reduced the time consumed by file distribution.
6. Conclusions
Today, the growth of space weather data is rapidly demanding data availability to accommodate the needs of researchers. This paper proposed a new system to increase data availability for supporting SWIFtS using a decentralized storage method. Our proposal leveraged the IPFS network to distribute and store data on the IPFS node. A directory watcher was added, forcing both the instrument’s PC to synchronize data and nodes to upload data automatically. Moreover, the implementation of the IPFS-Cluster was useful to replicate the data between peers as well as to limit the distribution process only in cluster peer members.
Furthermore, a combination technique for system monitoring was implemented and was seen to be useful in providing real-time data flow and node status. On the evaluation of the finished work, aiming to learn the proposed system performance compared with the existing system, the evaluation showed that the IPFS-based solution was able to reduce the time of file replication and support high-throughput.
Future work is needed to improve the speed of data distribution among peers and include a more extensive exploration of the hardware effect on system performance. Moreover, traffic monitoring of bandwidth usage is also an important approach to better understand the network cost from this system.


