1. Introduction
Bitcoin is a decentralized peer-to-peer cryptocurrency (or crypto) where all transactions are stored in a blockchain [
1]—a public ledger that cannot be manipulated or changed [
2]. Its features have made Bitcoin one of the most frequently used and priced cryptocurrencies.
The increasing price of Bitcoin has recently raised questions concerning the cybersecurity of the Bitcoin network. Its blockchain architecture makes Bitcoin almost invulnerable and too hard to attack [
3], which has led hackers to directly attack single nodes (entities) of the network.
According to a study presented in [
4], entities such as Exchanges, Mining Pools, Gambling operators, eWallets, and financial services are much more likely to be attacked than other services. In particular, Ref. [
4] demonstrated that the size of Mining Pools, for example, is related to the probability of being a target of an attack.
Bitcoin not only is vulnerable to cyber-attacks but is also the most frequently used cryptocurrency for concealing illicit activities, as confirmed by Jonathan Levin, co-founder and COO of Chainalysis [
5,
6]. In [
7], authors state that Bitcoin is the dominant cryptocurrency used in criminal activities due to the non-transparent transactions and due to the lack of effective regulatory mechanisms. Fanusie et al. [
8] describes that, from 2013 to 2016, the number of illicit entities (Market, Ponzi, Malware, etc.) were multiplied by five and two types of services—Mixers and Gambling—increased their volume of transactions involved in money laundering activities.
Hence, a crucial step to address Bitcoin network security and detect both cyber-attacks and illicit activities is to uncover the network behavior of sensible targets—of entities potentially involved in or targets of illicit activities. Generally, this is achieved by reducing the anonymity of users. Although Bitcoin is usually described as an anonymous system, it is actually pseudo-anonymous [
9], as it is possible to track, identify, and classify Bitcoin entities within the blockchain network by joining public addresses and private keys.
Prior studies have tried to classify entities according to classes representing specific entity behavior within the network [
10,
11,
12]. These techniques usually consider the whole blockchain and thus classification is performed considering all network (macro) dynamics among users. First of all, using the entire blockchain data typically comes at high computational and resource costs, which could be reduced by considering smaller amounts of input data. Furthermore, increasing the “temporal resolution” by considering shorter time intervals of blockchain data may highlight network micro-dynamics, i.e., small, short-term behavioral changes that can change the classification of an entity over time. These changes in classification could be useful for detecting suspicious activities. For example, a usually well-performing model for a certain entity class that all of a sudden fails to detect known elements of that class could be a hint for critical behavioral changes related to attacks or illicit activities.
The key idea behind our study is that a model trained on a batch with a certain time-interval should achieve good classification performance when testing it on another temporal batch—if similarity between behavioral patterns of the detected entities within those batches is sufficiently high.
It is to be noted that the aim of this work is not to directly investigate cyber-attacks or to improve classification rates of Bitcoin entities, but to investigate the effect of considering Bitcoin blockchain data as a time-series, dividing it into temporal batches and studying micro-changes of behavioral entity patterns over time. Results could highlight which entities show relatively consistent behavior from batch to batch (making them less likely to be affected by illicit activities and narrowing down the time interval necessary to obtain “typical” entity behavior) and which entities show strongly varying behavior over time (thus revealing short-term changes in behavior that could suggest suspicious network activities or sensible targets).
We believe that our novel approach could be valuable for future forensic tools as it may highlight the importance of considering blockchain data as a time-series to reveal short-term behavioral changes, hence shifting the paradigm of forensic blockchain analysis from a “macro” or “black-box” approach towards taking into account network micro-dynamics. As a byproduct, these considerations can reduce the complexity and the required resources for forensics analysis.
Specifically, the present analysis is based on extending cascading machine learning concepts presented in Zola et al. [
10], which essentially apply ensemble learning and stacking of several classifiers trained with different datasets derived from blockchain data. The idea behind this technique is to classify Bitcoin entities using prior classification information, combine them with new blockchain-derived data, and then compute a final classification to improve predictive performance.
All data were normalized with respect to the considered batches (time-intervals). This operation allows us to generalize the derived classifiers and use them with data from different sources or from other blockchains, which increases transferability of our results.
We carry out four experiments considering different batch sizes, where a cascading approach with data extracted from blockchain batches is used. We started using a batch size of
consecutive blocks (approx. 12 months of data); in the second experiment we used
consecutive blocks (approx. six months of data); in the third experiment we chose
consecutive blocks (approx. four months of data), and in the last experiment we used
consecutive blocks (approx. two months of data). In each experiment, we used one batch to train the initial classifiers, meanwhile the others—left out from training—were used to test them. This procedure is repeated for each batch extracted from the blockchain until each one has been used once for training (“k-fold cross-testing”). These tests allow us to analyze similarities between entity behavior over time and investigate if certain behavioral patterns are repeated across different blockchain batches. We consider six different types of Bitcoin entities: Exchange, Gambling, Marketplace, Mining Pool, Mixer, and eWallet. At the end of the four experiments, following previous studies [
4,
13] that considered Mining Pool entities as sensitive targets (potentially subject to cyber-attacks), a deeper analysis of Mining Pool behavior is shown.
The rest of the paper is organized as follows.
Section 2 describes related work. Afterwards,
Section 3 presents an overview of the used data.
Section 4 introduces the graph models and the machine learning models implemented; then, in
Section 5, the experimental analysis is presented. Finally, in
Section 6 and
Section 7, we draw conclusions and provide some guidelines for future work.
2. Related Works
Bitcoin properties have led hackers to deploy various cyber-attacks in order to introduce chaos/noise into the network and take advantage of it. In [
14], an analysis about the impact of Distributed Denial-of-Service (DDoS) attacks on the volume traded on the Exchange is presented, in particular regarding 17 attack cases that occurred across 2016 and 2018. In [
15], transactions related to 35 ransomware families (malware) are analyzed, determining a minimum market worth about USD
. These kinds of attacks allowed hackers to steal Bitcoin (BTC); for example, as admitted by Changpeng Zhao (CEO of Binance, one of the largest Exchanges), hackers stole more than 7000 BTC [
16], about 40 USD million in 7 May 2019, considering the exchange rate (closing market value on that day) equals USD
[
17].
Criminal concerns related to the Bitcoin network can be grouped into three classes: Bitcoin-specific crimes, money laundering and Bitcoin-facilitated crimes [
18]. User anonymity not only has been the keystone for dissemination of cryptocurrencies, but it has promoted illegal activities and cyber-attacks within the Bitcoin network. In fact, as discussed in the Introduction, knowing the identity of users involved in the network helps determine sensible targets [
4]. Moreover, short-term changes of entity behavior, for example in Mining Pools [
13], could be symptoms of a cyber-attack.
In [
19,
20], current measures used by the Bitcoin protocol to preserve anonymity within the network are analyzed. As shown in [
21], such measures are, however, not enough to protect user privacy. In fact, it is possible to decrease Bitcoin network anonymity by using address clustering and combining information from various sources. For example, in [
22], an address clustering is computed in order to identify the CryptoLocker (a family of ransomware) and in [
23] the clustering is based on conservative constraints (patterns). Reid et al. [
24] exploit topological and external information in order to investigate a large theft of Bitcoins. Meanwhile, Fleder et al. make use of information scraped from forums and social media in order to characterize known and unknown users [
25].
In [
26], a study on two graphs generated by the Bitcoin transaction network using anomaly detection techniques is presented, aiming to detect which users and transactions were the most suspicious. Nevertheless, Monamo et al. [
27] uses an unsupervised learning algorithm for classifying anomalies (financial fraud and money laundering) on the Bitcoin network based on transaction patterns. An unsupervised k-means classifier is applied in [
28] in order to identify atypical transactions related to money laundering. Bartoletti et al. [
29] use machine learning algorithms to identify Ponzi schemes in the Bitcoin network. Yin et al. in [
30] apply supervised learning techniques in order to determine a “big picture” of cybercrime-related entities in the Bitcoin ecosystem.
In [
10,
12], methods for attacking Bitcoin user anonymity are presented. Both methods use the whole blockchain to create supervised machine learning models and classify Bitcoin entities. In particular, a cascading machine learning model is introduced in [
10], which is essentially ensemble learning based on the stacking concept presented in [
31]. The idea of the cascading model is to implement a cascade of (weak) classifiers, such that prior classification results can be joined and can be used to enrich a final (strong) classification. The cascading machine learning approach is compared with other techniques as [
11,
32], and showed that the new approach not only reduces the complexity of the model by reducing the features implied in the classification, but also reaches a very high accuracy considering six Bitcoin entity classes.
In anomaly detection, changes in network traffic are often a symptom of attacks. Nevertheless, it is generally difficult to detect and evaluate these changes in early stages of an attack as such changes in traffic cannot easily be distinguished from usual traffic fluctuation [
33]. The following studies applied division of data into subsets or batches, similar to the work presented in this paper. In [
34], a new process for training a hidden Markov model (HMM) to detect a denial-of-service attack (DoS) in program behavior data (system calls produced by processes of a program) is described, aiming to reduce training times. Authors first divide the long observation sequence into multiple subsets of sequences. Then, they join all the generated sub-models reducing the training time by about 60% compared to conventional training.
The approach of dividing information in subsets is used as well when analyzing graph structures. In these cases, the evolution of the graph over time is analyzed, creating a graph stream [
35]. For example, in [
36], a monthly call graph is divided into weekly snapshots in order to consider new dynamics of the call network and achieve churn prediction. Furthermore, in [
37], a parallel partitioning approach to discover cyber-threats in computer network traffic focusing on substructures is presented.
In this paper, the idea is to join the machine learning model introduced in [
10] with the concept of batch analysis applied, for example, in anomalies detection [
34,
38]. We aim to add a “temporal view” to Bitcoin entity analysis in order to unveil changes in behavioral patterns over time. This approach provides a magnifying lens allowing us (a) to study how using smaller batches of Bitcoin data affects classification performance and (b) to analyze micro-dynamics present in the Bitcoin blockchain network. All used features are normalized in order to reduce dependency on the chosen block size, and results may help data scientists reduce the complexity and the size of the initial dataset in forensic analysis.
3. Datasets
In studies of Bitcoin behavior, it is difficult to identify a ground-truth labeled dataset due to the anonymity of the network and due to the activity of its entities, which can change over time. However, here we aim to analyze these changes and determine how they affect the entity behavior classification. Such change in the classification over time may help us determine suspicious situations and sensitive targets.
We therefore used two datasets, the first one downloaded from WalletExplorer [
39]—a platform that can be considered a benchmark for Bitcoin entities detection—and the second one consisting of Bitcoin blockchain data downloaded from the mainnet [
40].
WalletExplorer is a web-page where data and information about different known entities detected until today are collected. The dataset is continuously being updated and its information has been used as a starting point for many Bitcoin-related studies, such as [
15,
32,
41]. For our purpose, each entity was downloaded with its origin name and its related detected addresses.
The downloaded entities belong to seven different classes:
Exchange: entities that allow their customers to trade cryptocurrencies or to exchange cryptos for fiat currencies (or vice versa);
Gambling: entities that offer gambling services based on Bitcoin currency (casino, betting, roulette, etc.);
Mining Pool: entities composed of a group of miners that work together sharing their resources in order to reduce the volatility of their returns;
Mixer: entities that offer a service to obscure the traceability of their Bitcoin clients’ transactions;
Marketplace: entities allowing to buy any kind of goods or services using cryptocurrencies. They are frequently used to buy illegal goods;
eWallet: entities that allow an individual to create online accounts that can be used to receive and send money. Users never need to download the Bitcoin software themselves and all of the user’s transactions are made on behalf of the user by the eWallet service, using keys controlled by the service [
23];
Lending: entities that allow users to lend Bitcoins and passively earn interests on it, or allow them to request a loan.
As shown in
Table 1, 315 different entities and more than
addresses were downloaded from WalletExplorer. However, after creating a first overview of the dataset, we decided to not use the
Lending class because seven entities were considered too few to implement and train the cascading machine learning system.
The second dataset was directly downloaded from the Bitcoin mainnet through the Bitcoin Core program [
42]. Our analysis focuses on the last (about) three years of lifetime of Bitcoin blockchain only, so we used the Bitcoin blockchain data created from blocks height
to 570,000, corresponding to blocks mined from 24 December 2015, 5:33:51 p.m. until 3 April 2019, 9:20:08 a.m., respectively. This decision was taken in order to decrease the computational cost for carrying out the experiments.
Table 1 shows the amount of different entities and addresses calculated in the last three years as well, and the ratio between the samples in the considered time interval compared to the whole population.
The final dataset was composed by data belonging to six classes: Exchange, Gambling, Marketplace, Mining Pool, Mixer, and eWallet. All entities were represented by more than of distinct samples, and also by more than of distinct addresses, except for the Marketplace with just of samples. A first analysis highlighted that these Marketplace entities were mainly active in the first six years of the blockchain lifetime. Then, over time, they were closed from Law Enforcement Officers (LEOs) in case of illicit activities or owners decided to close their services.
In this study, the downloaded Bitcoin data of the last three years were cross-referenced with the (labelled) WalletExplorer data in order to re-size the original dataset and remove all unlabelled and unusable data for our supervised cascading machine learning approach.
4. Methodology
In this section, the four graph models used in this work are presented: address-transaction graph, entity-transaction graph, and 1_motif and 2_motif graph. Each graph representation allows us to analyze a different aspect of the behavior of an entity. These graph models represent the sources for extracting dataframes (tabulated data), which were used for implementing the cascading machine learning models.
4.1. Blockchain and Motifs’ Graphs
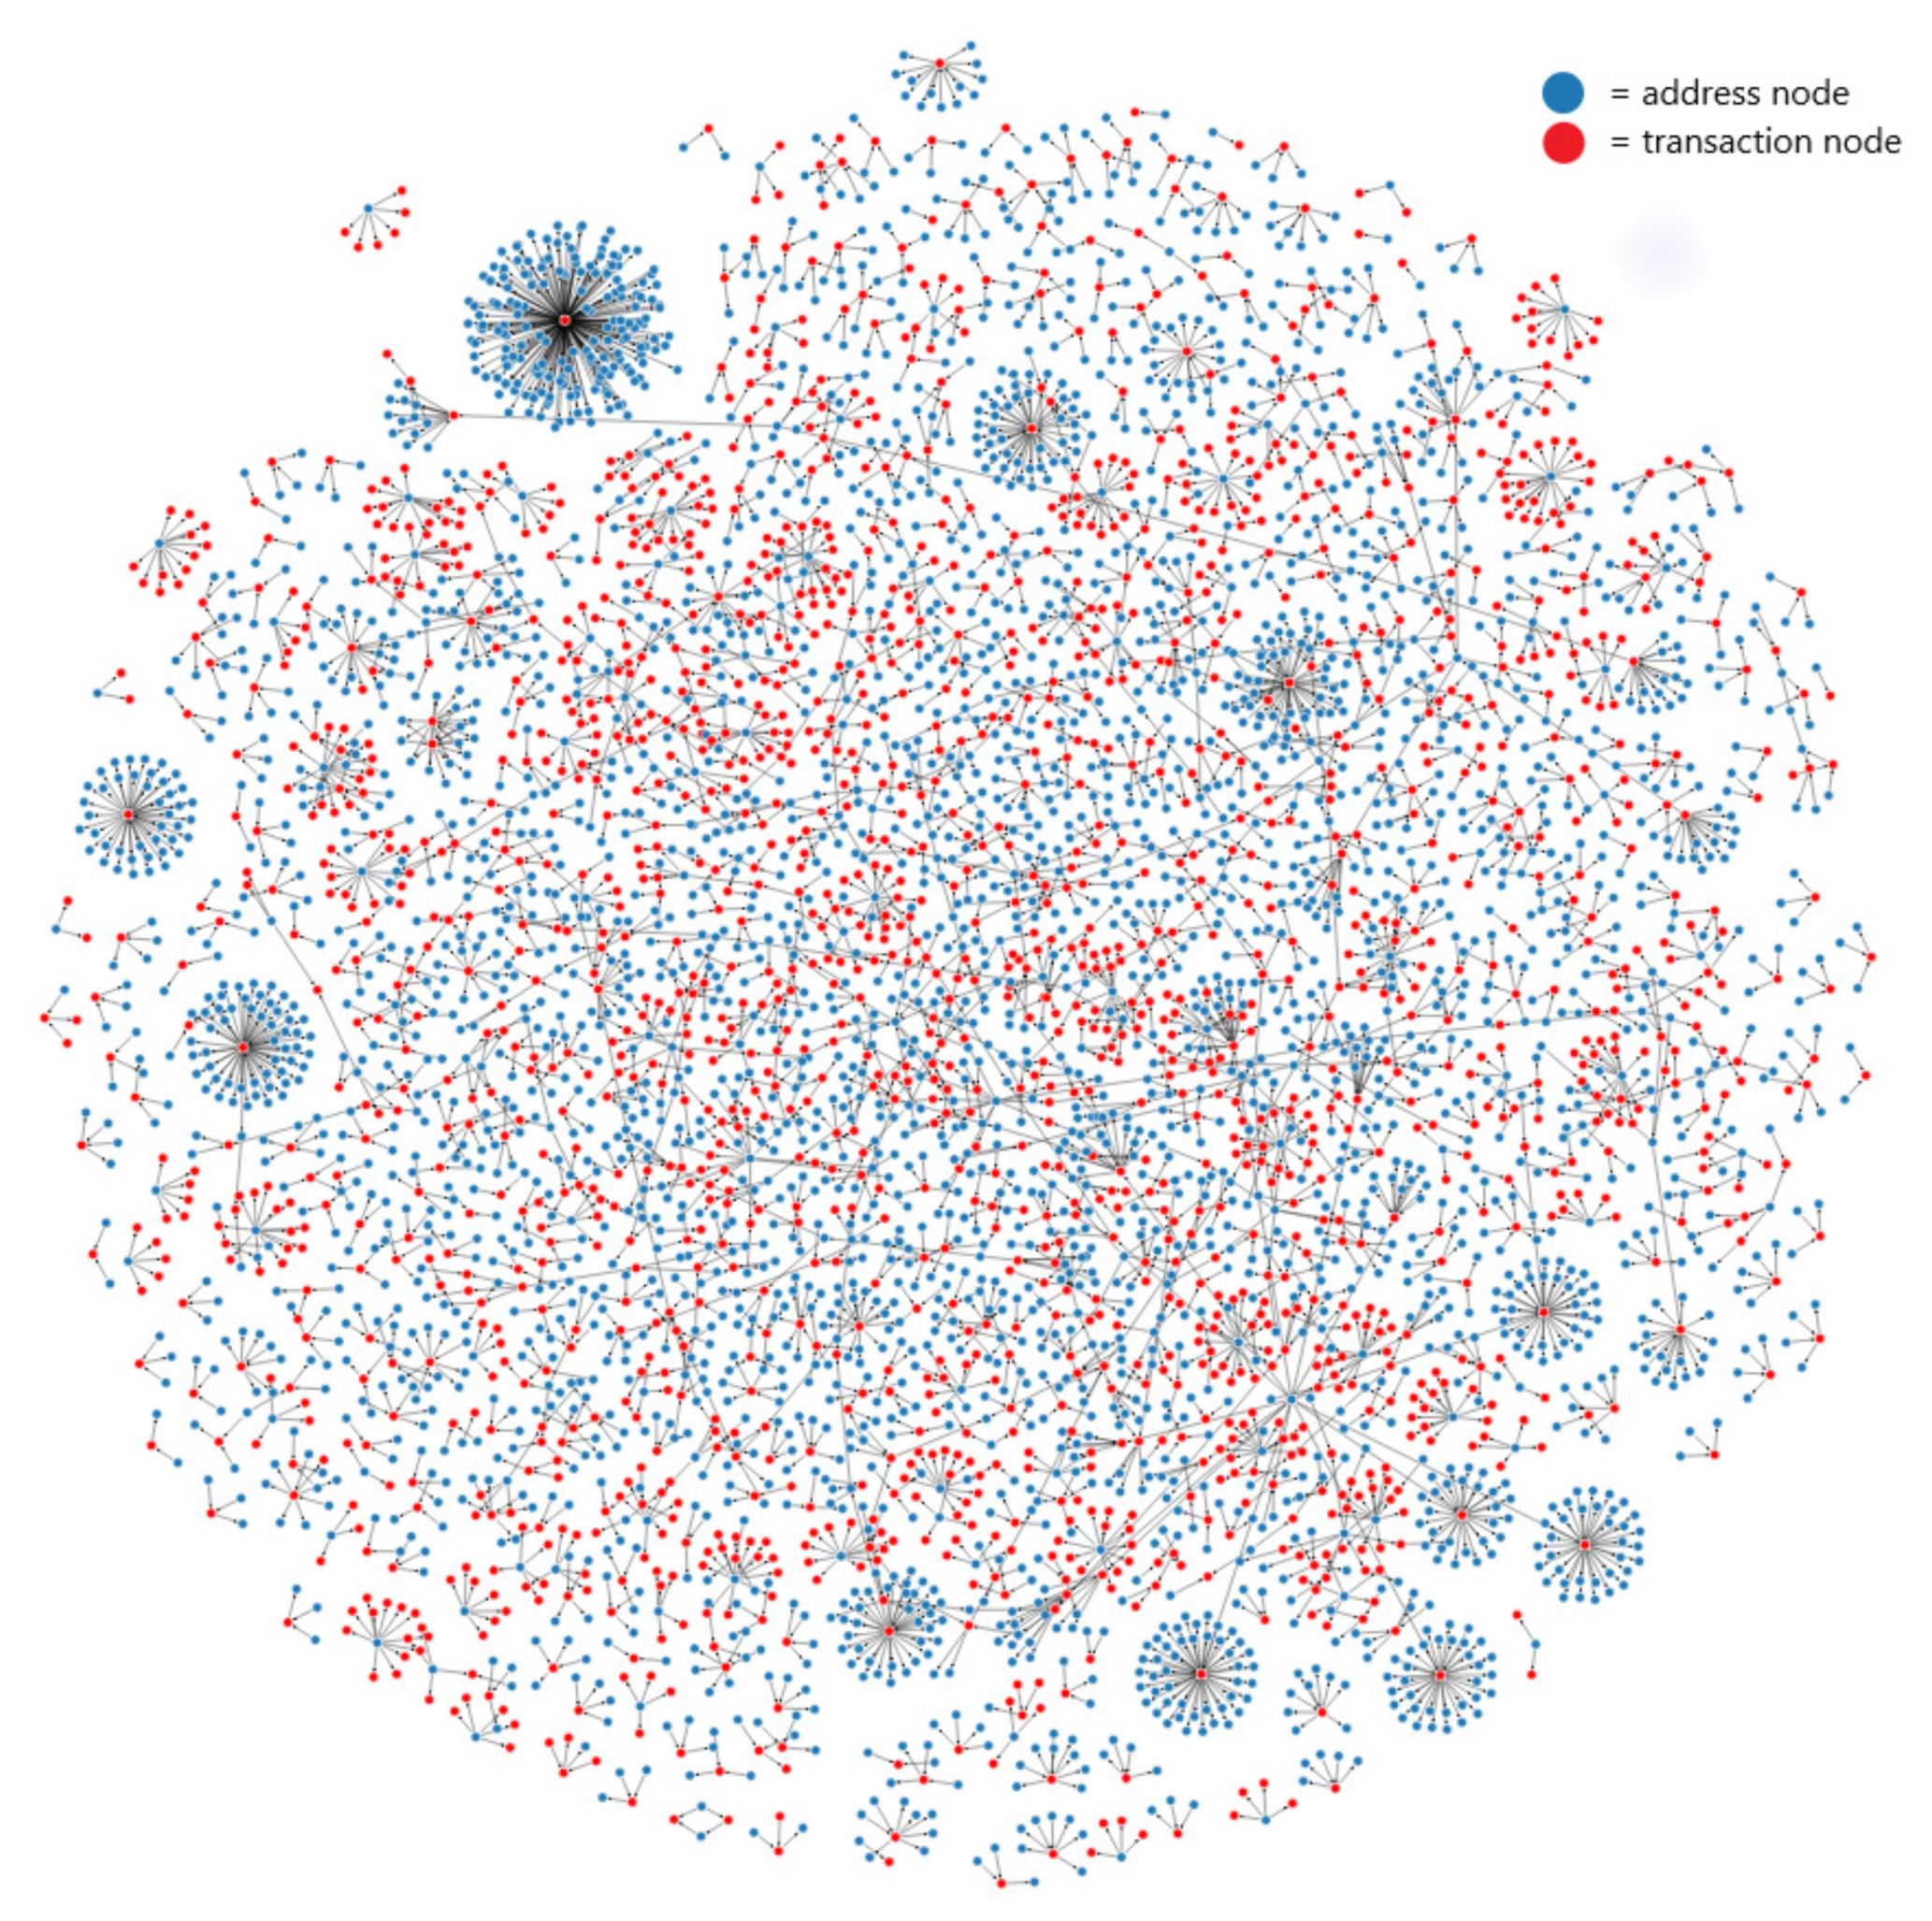
Blockchain data can be directly represented through an address-transaction graph (
Figure 1). In this graph, vertices represent addresses and transactions, while directed edges (arrows) between addresses and transactions indicate incoming relations, and directed edges between transactions and addresses correspond to outgoing relations. Each directed edge can also include additional information such as values, time-stamps, etc.
According to
Bitcoin.org [
43], each single user has the responsibility for adopting good practices in order to protect his/her anonymity and remain private. The basic recommendation is to use a new Bitcoin address for any new payment, and additionally use multiple wallets for different purposes. These suggestions create new dynamics in the network increasing the complexity of user behavior detection. Nevertheless, over time, these same concepts were used to define several heuristic properties with the aim to find related addresses for subsequent address clustering. This process is used to find all addresses that belong to a certain user, and this allows us to introduce the
entity concept. In particular, we refer to an entity as a physical person or organization related to one or multiple public key addresses belonging to one or more wallets. Using these clusters of addresses and the relation among transactions, it is possible to create the entity-transaction graph starting from the address-transaction graph.
Heuristic properties have been developed and presented in different studies such as [
20,
23,
44]. However, in this study, we do not need to apply heuristic assumptions since, as indicated in
Section 3, the Bitcoin blockchain data were combined with labelled data gathered from WalletExplorer, such that relations among addresses (i.e., clusters) are known.
The motifs graph used here is usually applied in bioinformatics, specifically in metabolic network analysis [
45]. However, prior studies such as [
11,
32] have successfully translated the concept of motifs to Bitcoin analyses.
According to [
10], a
graph is a graph composed by paths from the entity-transaction graph with length
that starts and ends with an entity. Let
be a class of entities and
be a class of transactions, with
, then:
From this particular graph, it is possible to extract information concerning the relations among entities, but also concerning the topology that such relations create among entities. If two different entities are connected through one transaction, the topology is called Direct Distinct. If one entity is connected with itself (again through one transaction) the topology is called Direct Loop (
Figure 2).
Starting from the results presented in [
10], in the present study, only the
and
graphs were used.
4.2. Temporal Batch
Larger time intervals may cover specific behavioral changes of an entity affecting its detection. Moreover, the amount of data in a larger time interval increases the complexity of the problem, often leading to the creation of highly non-transparent “black-box” models. Our approach involves dissecting data temporally, so dividing everything into smaller batches that can then be studied by themselves (thus using “smaller black-boxes”, which may help to understand better the internal dynamics within the large black-box of the full data).
The idea behind our approach is that a model trained on a batch with a certain time-interval can be used for unveiling behavioral entity patterns when testing it on another temporal batch. Thereby, higher classification performance would relate to higher similarity between behavioral entity patterns within the training and test batch. Hence, in this analysis, it is important to divide the whole Bitcoin dataset into temporal batches, where each batch represents a dataset composed by the transactions belonging to a fixed number of consecutive blocks.
Let
be the minimum block height and
the maximum block height in the (considered) Bitcoin blockchain data, and let
be the size (in blocks) of a single batch, then the number of generated batches can be computed through Equation (
2)
In our analysis, we considered with a value of blocks and with a value of , and four different values for . We started creating batches of consecutive blocks (representing approx. 12 months) in the first experiment. In the second one, we chose a value of (representing approx. six months), in the third one, a value of (representing approx. four months) was used and, finally, in the last experiment, the was fixed to consecutive blocks (representing approx. two months).
Table 2 shows the number of batches considered in each experiment and the related distinct known entities divided per class. This table shows that the majority of the detected entities belonged to batches with “old or past” data, since the number of distinct known entities for almost all the classes decreases over time.
4.3. Features
In each experiment and for each temporal batch generated, the four graph models presented in
Section 4.1 were created. Then, from each graph model, four dataframes (two-dimensional labelled data structure or data table with samples as rows and extracted features as columns) were created extracting several features. All the features are presented in detail in [
10]:
Entity dataframe contains all features extracted from the entity-transaction graph and contains a total of seven features.
Address dataframe contains all features extracted from the address-transaction graph and contains a total of seven features.
1_motif dataframe contains the information directly extracted from the graph and contains a total of nine features.
2_motif dataframe contains information gathered from the graph and contains a total of 18 features.
In order to compare information from different batches, and in order to reduce the complexity of the models, the features (excluding the ones related to an amount or balance) were normalized on a range between 0 and 1. This normalization was computed with respect to the minimum and maximum values in the corresponding batch. This process allow us to re-use these models with other batch sizes and to use them with input data from other sources/blockchains in future studies.
Let
X be the value to be normalized,
Xmin the minimum and
Xmax the maximum of the considered feature in a certain batch, then the normalized value
Xnorm was computed using Equation (
3):
4.4. Cascading Machine Learning
In this study, we used and extended the cascading machine learning concepts introduced in [
10], which have shown excellent classification results when using the whole blockchain data. As mentioned in
Section 2, the cascading machine learning optimizes the number of features used in the classification and ensures high accuracy value, comparing them with output accuracy of other techniques [
10]. Our cascading model is a type of ensemble learning applying stacking techniques [
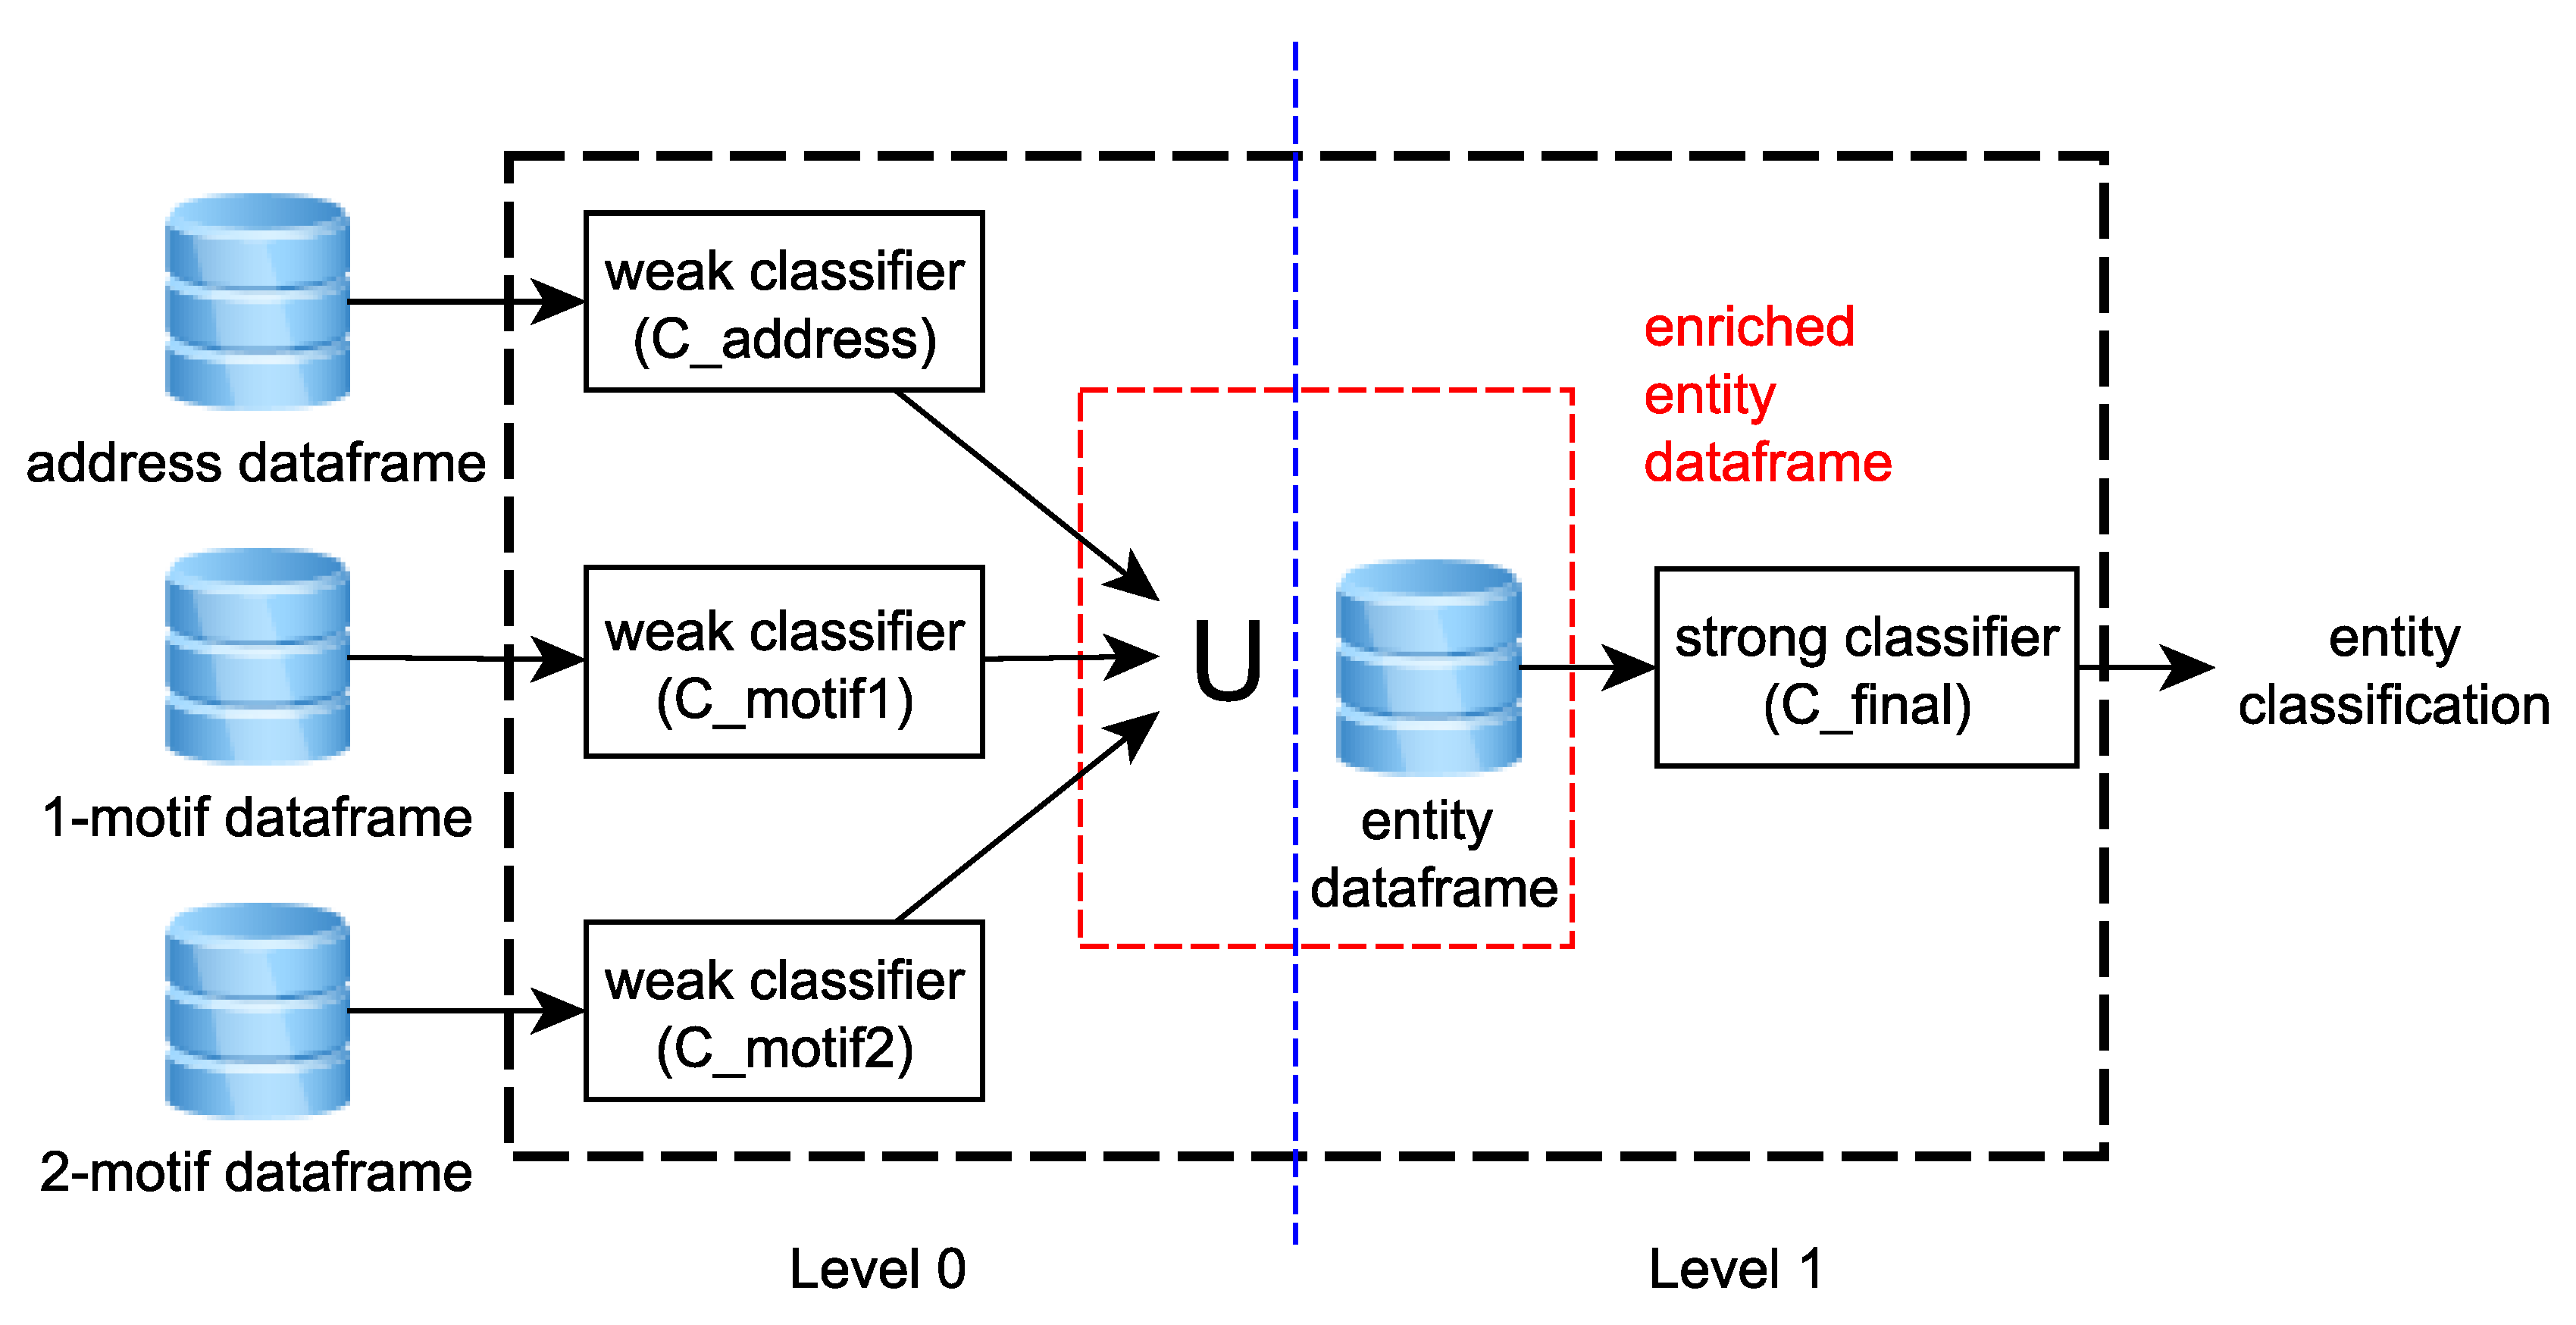
46]. The idea transferred to the Bitcoin network is based on enriching Bitcoin entity data with information obtained from prior classifications creating cascading classifiers, as shown in
Figure 3.
The first step to create the cascading system was to split the address, 1_motif and 2_motif dataframes into train/test datasets. In particular, this operation was computed using a proportion of 50/50. Then, the created train datasets were used to implement the weak classifiers called
C_address,
C_motif1 and
C_motif2 in relation with their own input data (zero-level in
Figure 3). This process was computed by applying a k-fold cross-validation with k = 5. In k-fold cross-validation, the dataset is divided into
k folds, where
folds are used for training the model and the one left out during the training phase is used to validate it. The whole process is repeated until each fold is used only once for validating.
Once the cross-validation was ended and the models were generated/trained, the test dataset was used as input. The output of the classification from the Level 0 classifiers was joined with the information in the entity dataframe in order to create the enriched entity dataframe. Then, this new enriched dataframe was used for training the final (strong) classifier called
C_final (first-level in
Figure 3).
Thanks to the initial dataset split into train and test, the information generated from the weak classifiers was created from a completely unseen dataset. In fact, if the data that were used to train the zero-level learner were also used to generate the enriched dataset for training the first-level learner, there would be a high risk of overfitting [
47], which hence has been avoided here.
The outgoing information from the zero-level classifiers was processed following an enrichment process, as indicated in [
10]. This process consists of assigning one of the six possible output classes to each entry in the input dataframe and joining the input label (from WalletExplorer) with the computed output class. Then, the input label was grouped counting how many times a sample belonging to a particular entity has been detected in each of the considered classes. This value was then normalized as indicated in Equation (
4), where
E represents the entities set and
N is the number of considered classes (
in this study). The term
represents how many times a sample originally labelled with entity
e generates a prediction belonging to class j, while the term
counts all the predictions generated from samples with labelled input belonging to entity
e:
Finally, the enrichment process allows us to generate a set of six new features from each weak model, which were used to enrich (extend) the entity dataframe extracted from blockchain data.
In this paper, we implemented the first three classifiers (weak) as Random Forest (RF) and the final one as Gradient Boosting (GB) model, since such implementation has been shown to yield good classification performance in terms of Precision, Recall, and F1-score for entity classification [
10]. Specifically, all Random Forest models were implemented with the number of estimators set to 10, with a Gini function to measure the quality of the split and without a maximum depth of the tree. The Gradient Boosting model was implemented with the number of estimators set to 100, the learning rate was set to
, and the maximum depth for limiting the number of nodes was set to 3.
In order to unveil patterns in entity behavior and detect the similarity among training and test batches, we evaluated the classification performance in terms of Precision, Recall, and F1-score calculated per class:
Precision is the number of true positives over the total number of true positives plus false positives. It represents a measure of a classifier’s exactness given as a value between 0 and 1, with 1 relating to high precision;
Recall is the number of true positives over the number of true positives plus false negatives. It represents a measure of a classifier’s completeness given as a value between 0 and 1;
F1-
score is the harmonic mean of Precision and Recall. It takes values between 0 and 1, with 1 relating to perfect Precision and Recall, and is calculated with Equation (
5);
4.5. K-Fold Cross-Testing
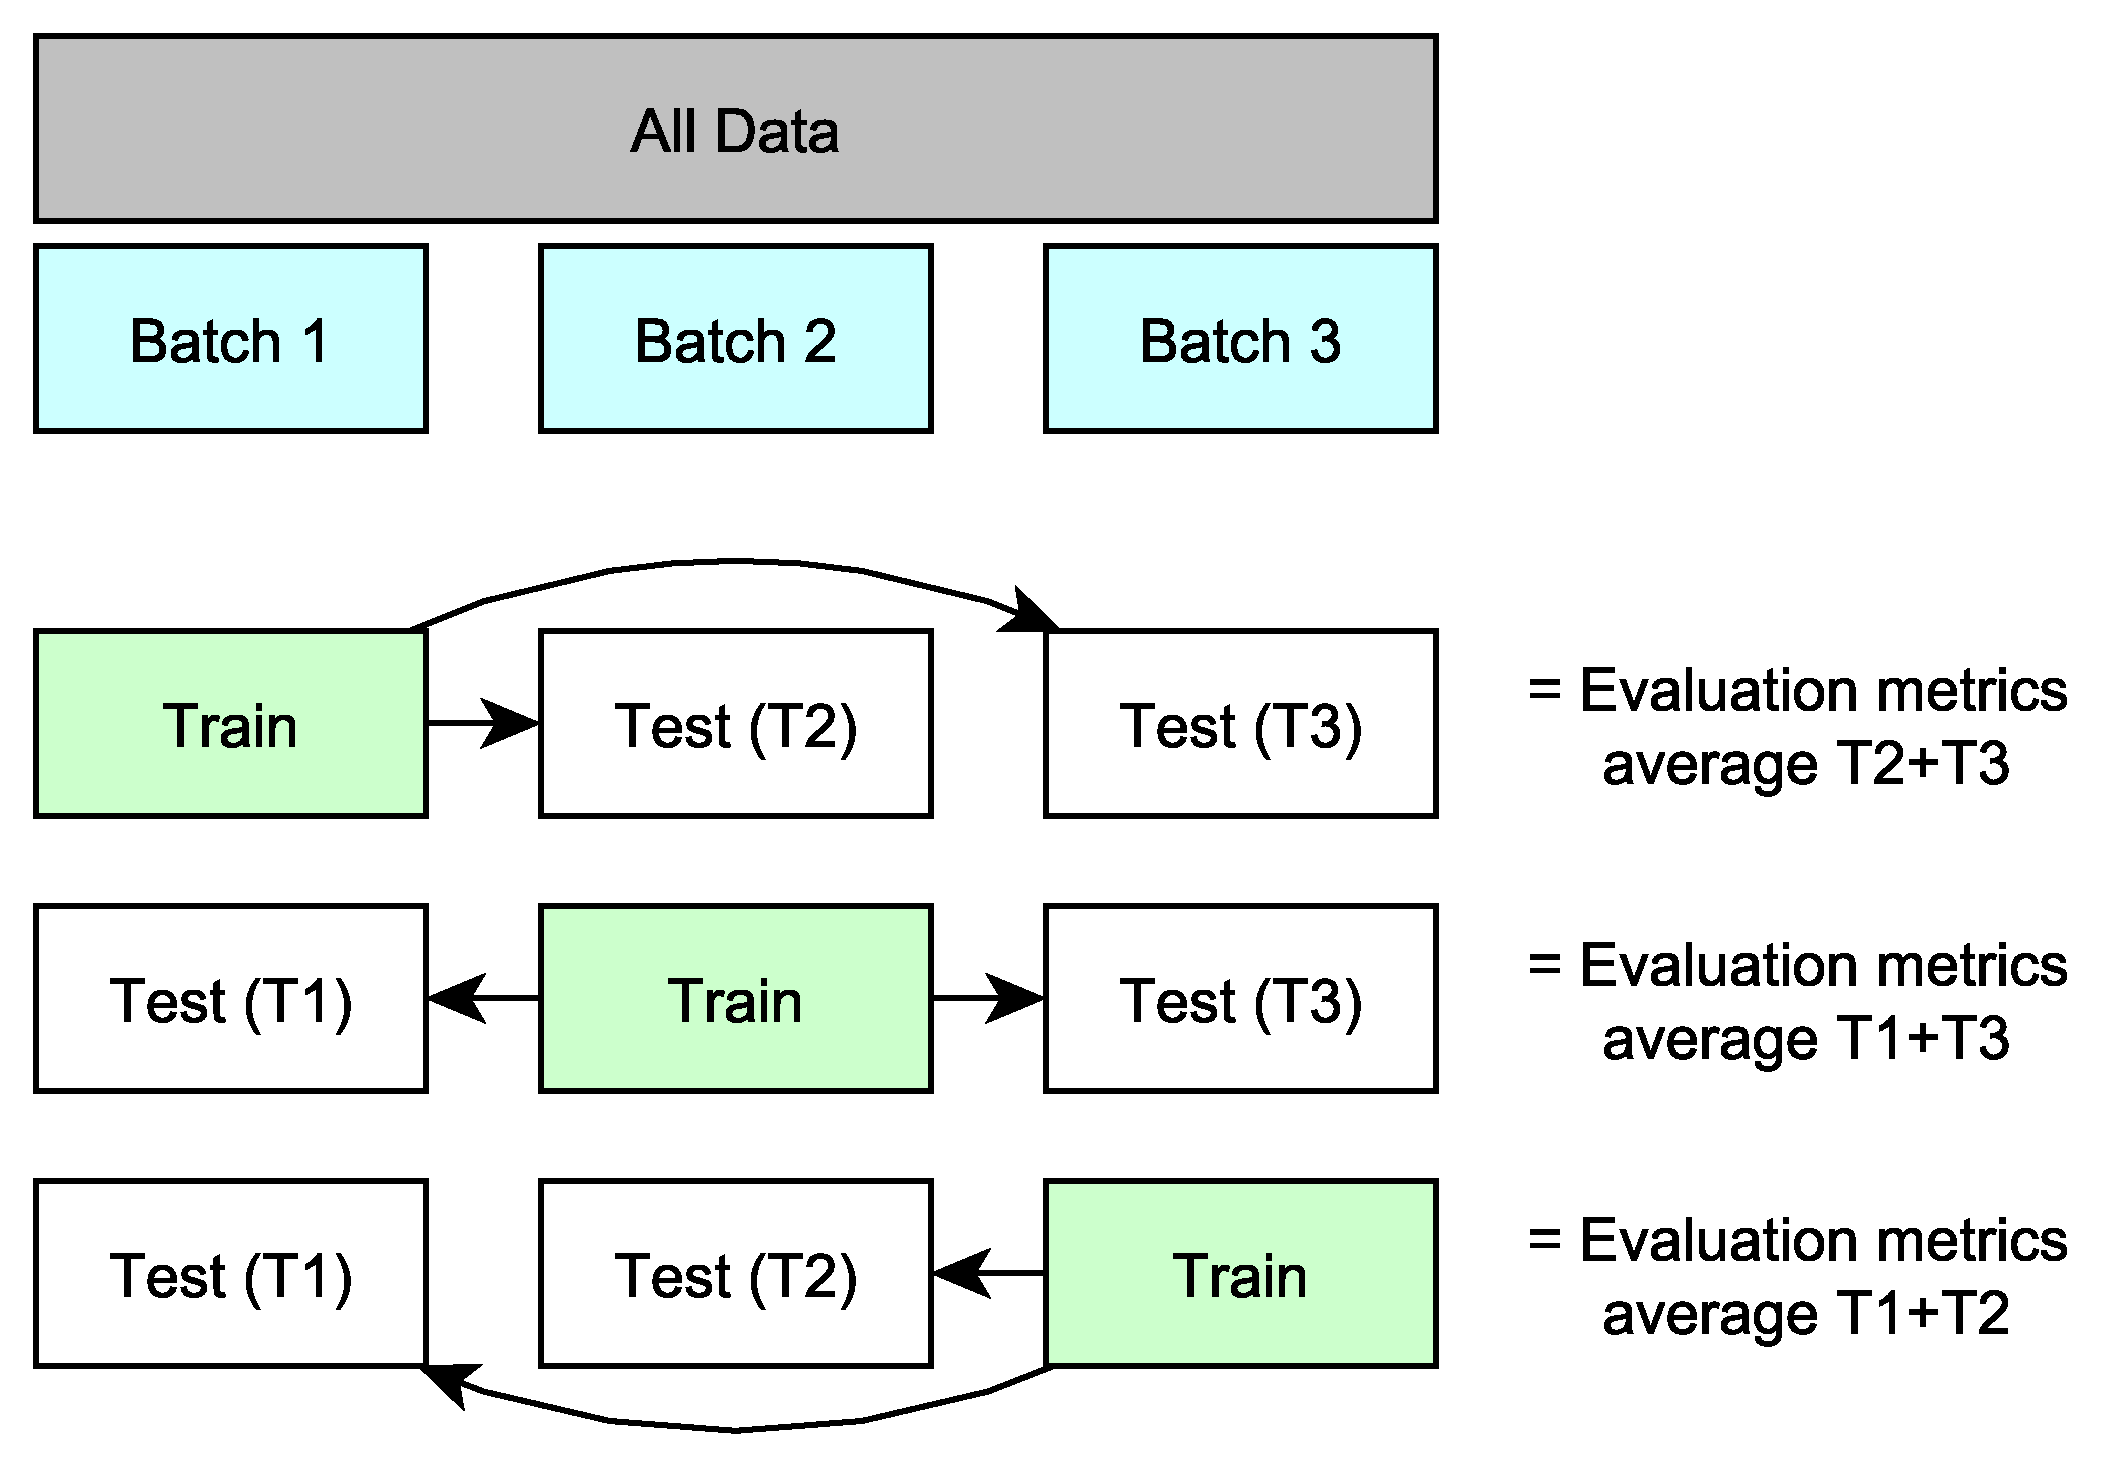
In this study, we aimed to analyze how entity behavior changes over time. The idea is to detect similarity between the distinct temporal batches, represented by good classification performance that indicates the presence of a recurrent pattern. To achieve this goal, we apply a type of “k-fold cross-testing”, which allows us to estimate the performance of the implemented cascading machine learning approach. This procedure recalls concepts from k-fold cross-validation and applies them to testing as well, hence the chosen name. In particular, this method allows us to evaluate similarity among different batches generating unique output values for each trained model.
In “k-fold cross-testing”, we divided the dataset into
k folds (or batches), as explained in the previous section. This batch creation was done without shuffling the data because in Bitcoin analysis it is important to maintain the sequentiality of the data. The number of the generated folds was computed through Equation (
2), which generated respectively 3-fold cross-testing for the first experiment, 6-fold cross-testing for the second one, 9-fold cross-testing for the third experiment, and 18-fold cross-testing for the last one. In general, the k-fold cross-testing approach generates a total of
k distinct models, each of them obtained by training a system with just one batch (i.e., each fold is used exactly one time for training a model). Then, each model is tested with the remaining
batches left out during the training, as shown in
Figure 4. The “k-fold cross-testing” generates
k outputs, one for each trained model. A single output represents the average and the standard deviation of the
tests computed over the same trained model.
5. Results
In this paper, we present an analysis for evaluating similarity between behavioral patterns of Bitcoin entities using cascading machine learning. The presented process introduces a “temporal view” of the blockchain data aiming to evaluate short-term changes in Bitcoin entity behavior. The approach consists of dividing the whole blockchain into several batches, in order to reduce the complexity of the problem, reducing the amount of data, simplifying the implemented models, and increasing the transferability of the solution.
In order to unveil behavioral patterns in the Bitcoin network and study how the size of the batches affects the final classification, four experiments are presented. Each experiment was achieved with a different value of batch size, respectively with blocks (approx. 12 months), (approx. six months), (approx. four months) and blocks (approx. two months). The discovered behavioral patterns were divided into six classes: Exchange, Gambling, Market, Mining Pool, Mixer, and eWallet.
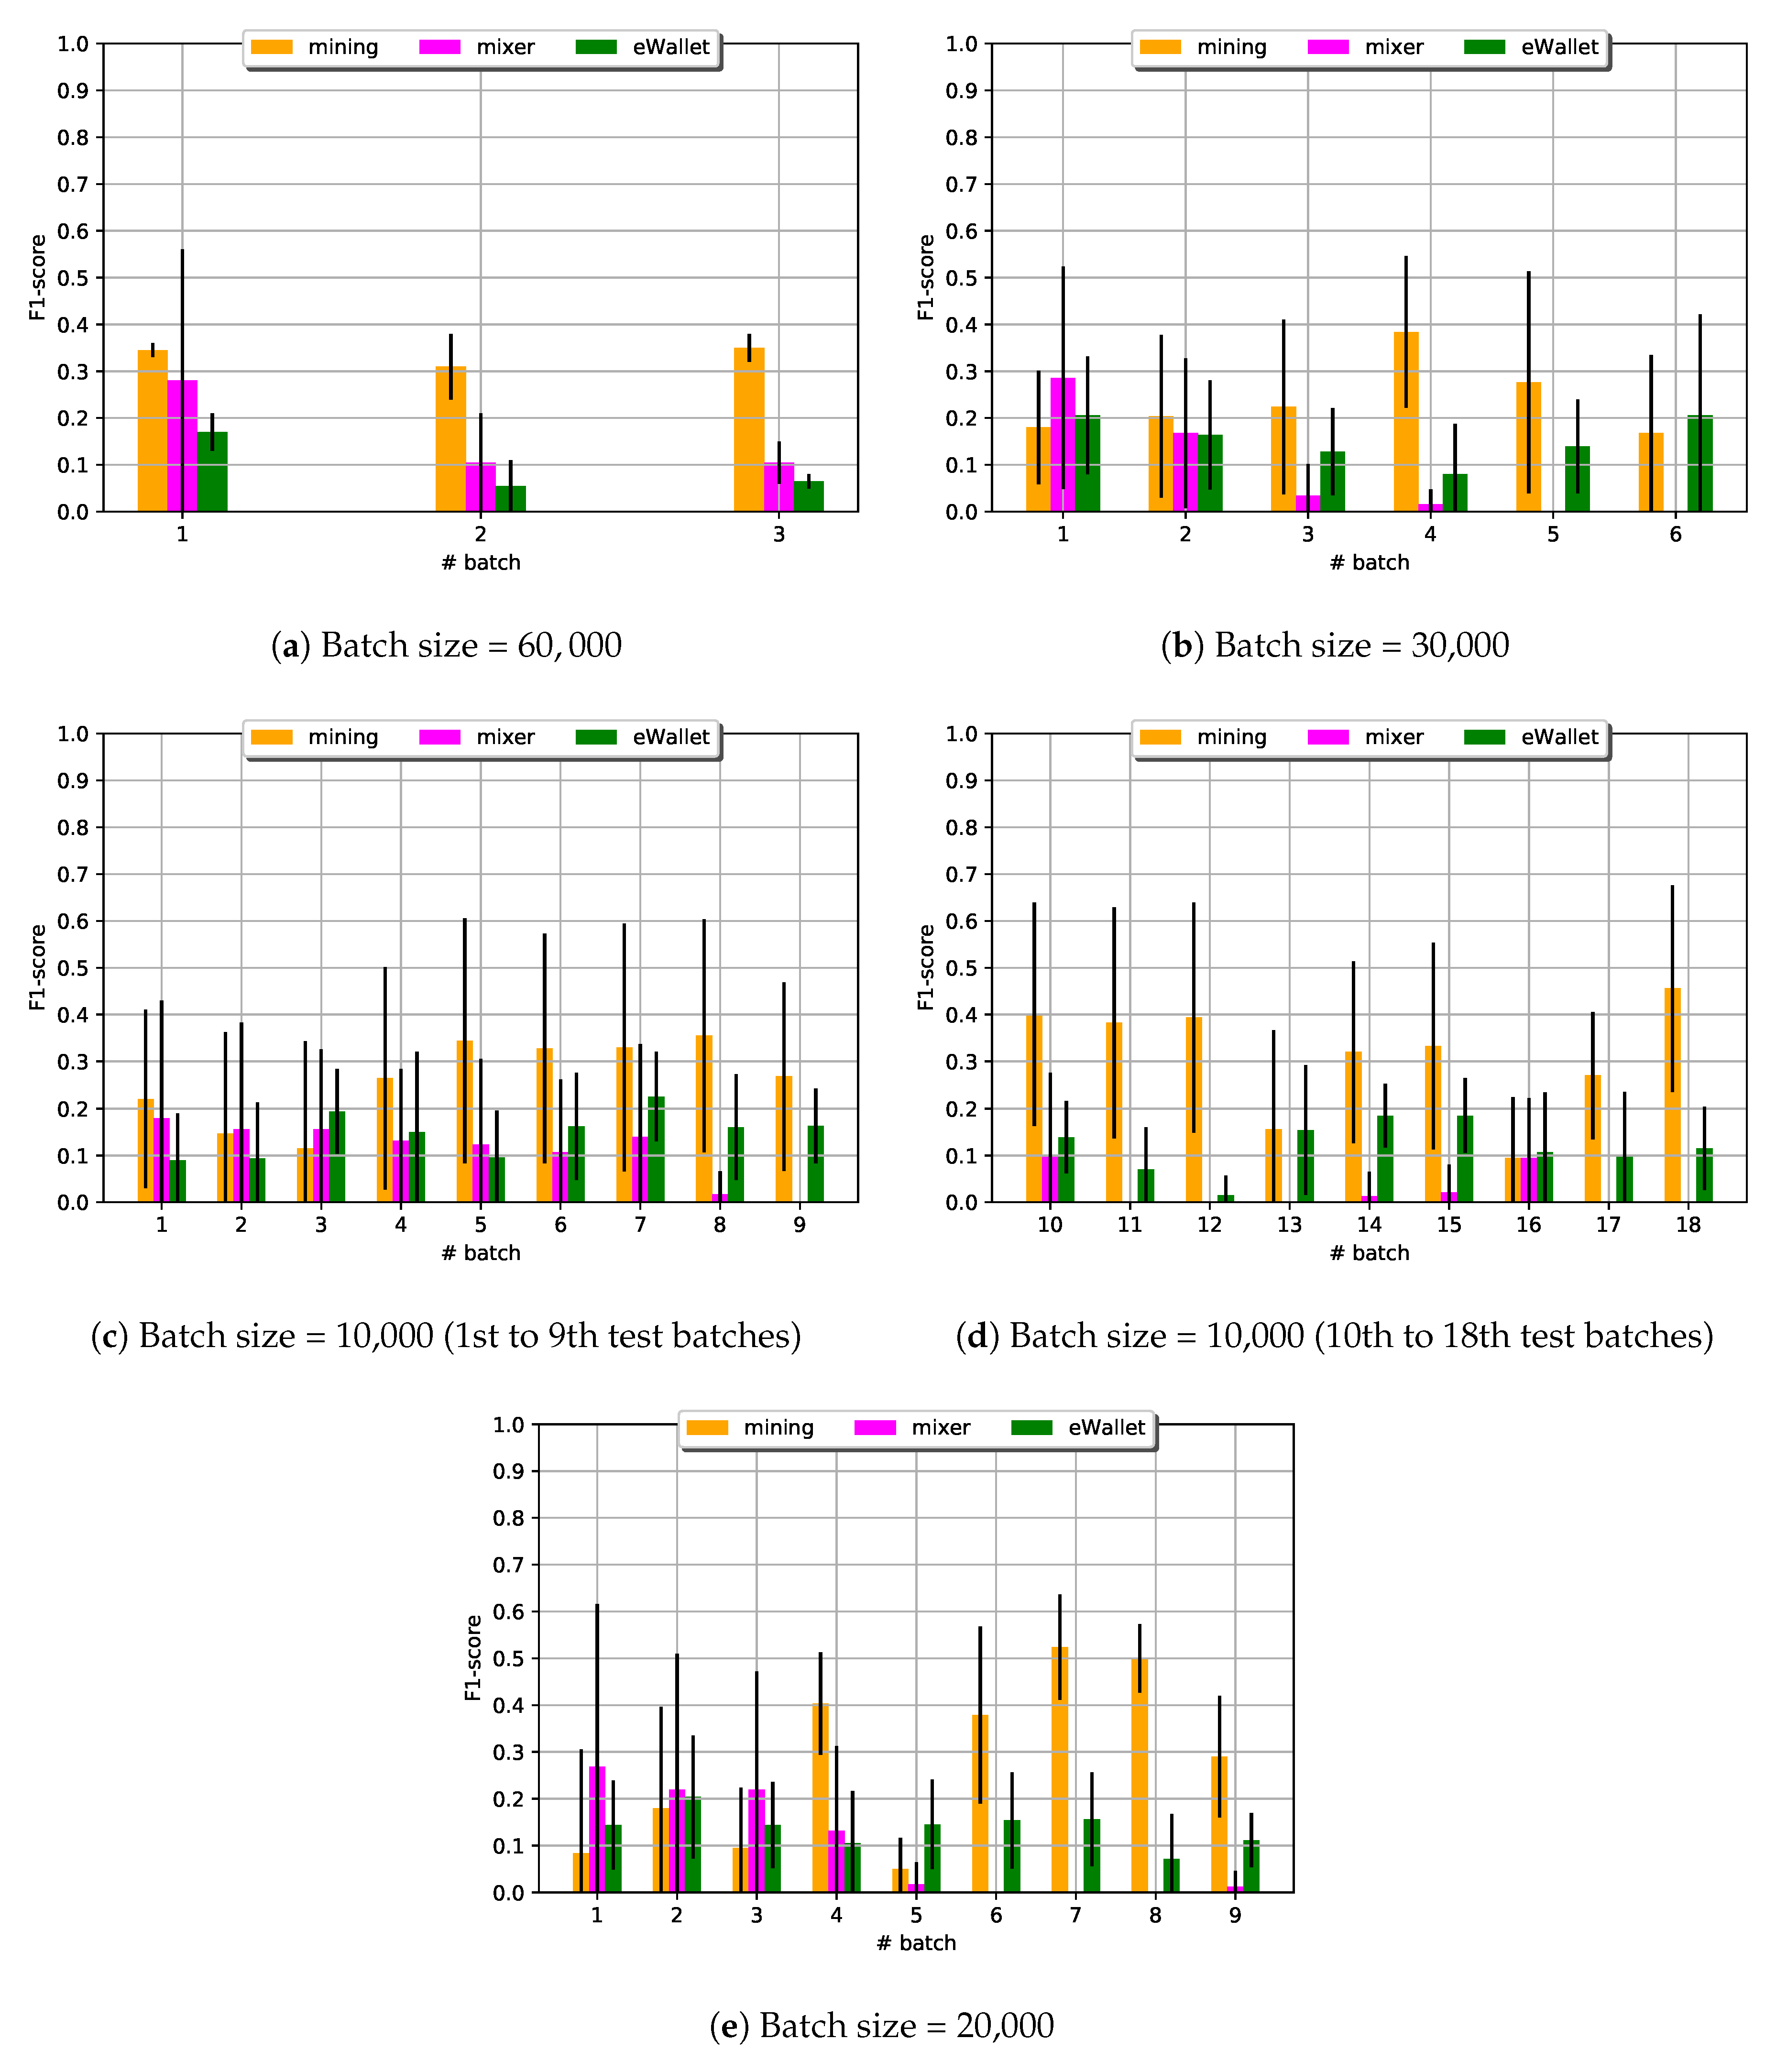
Figure 5 and
Figure 6 show the F1-score calculated in each experiment separated per class. In particular, in each graph, the
x-axis represents the number of batch used to train the models and the
y-value represents the F1-score computed using “k-fold cross-testing” (
Section 4.5). The F1-score values are shown with their own standard deviation.
The graphs in
Figure 5 and
Figure 6 indicate that Exchange, Gambling, and eWallet behavior are only slightly affected by the chosen batch size. In fact, decreasing the batch size, the average F1-score over samples belonging to these three classes is weakly increased. At the same time, smaller batch size penalizes the ability of the models to discover Mixer and Market elements and generates strong changes in the detection of the Mining Pool class. Behavioral changes of those Mining Pools become visible when decreasing the batch size to
blocks, for example.
These trends are confirmed in
Table 3, where the overall average F1-score and standard deviation are reported for each experiment. One can observe that reducing the batch size slightly increases the detection of Exchange and Gambling elements. In particular, considering data from 10,000 blocks (fourth experiment), F1-score values of
and
, respectively, were reached. However, the batch size reduction also increases the variability of the classification, generating high standard deviation values for four of the six considered classes. The highest values of standard deviation are obtained for classifying Mining Pool and Market elements. These two classes generate a standard deviation of
for a F1-score value of
, and
for a F1-score value of
, respectively.
The results shown in
Figure 6 and
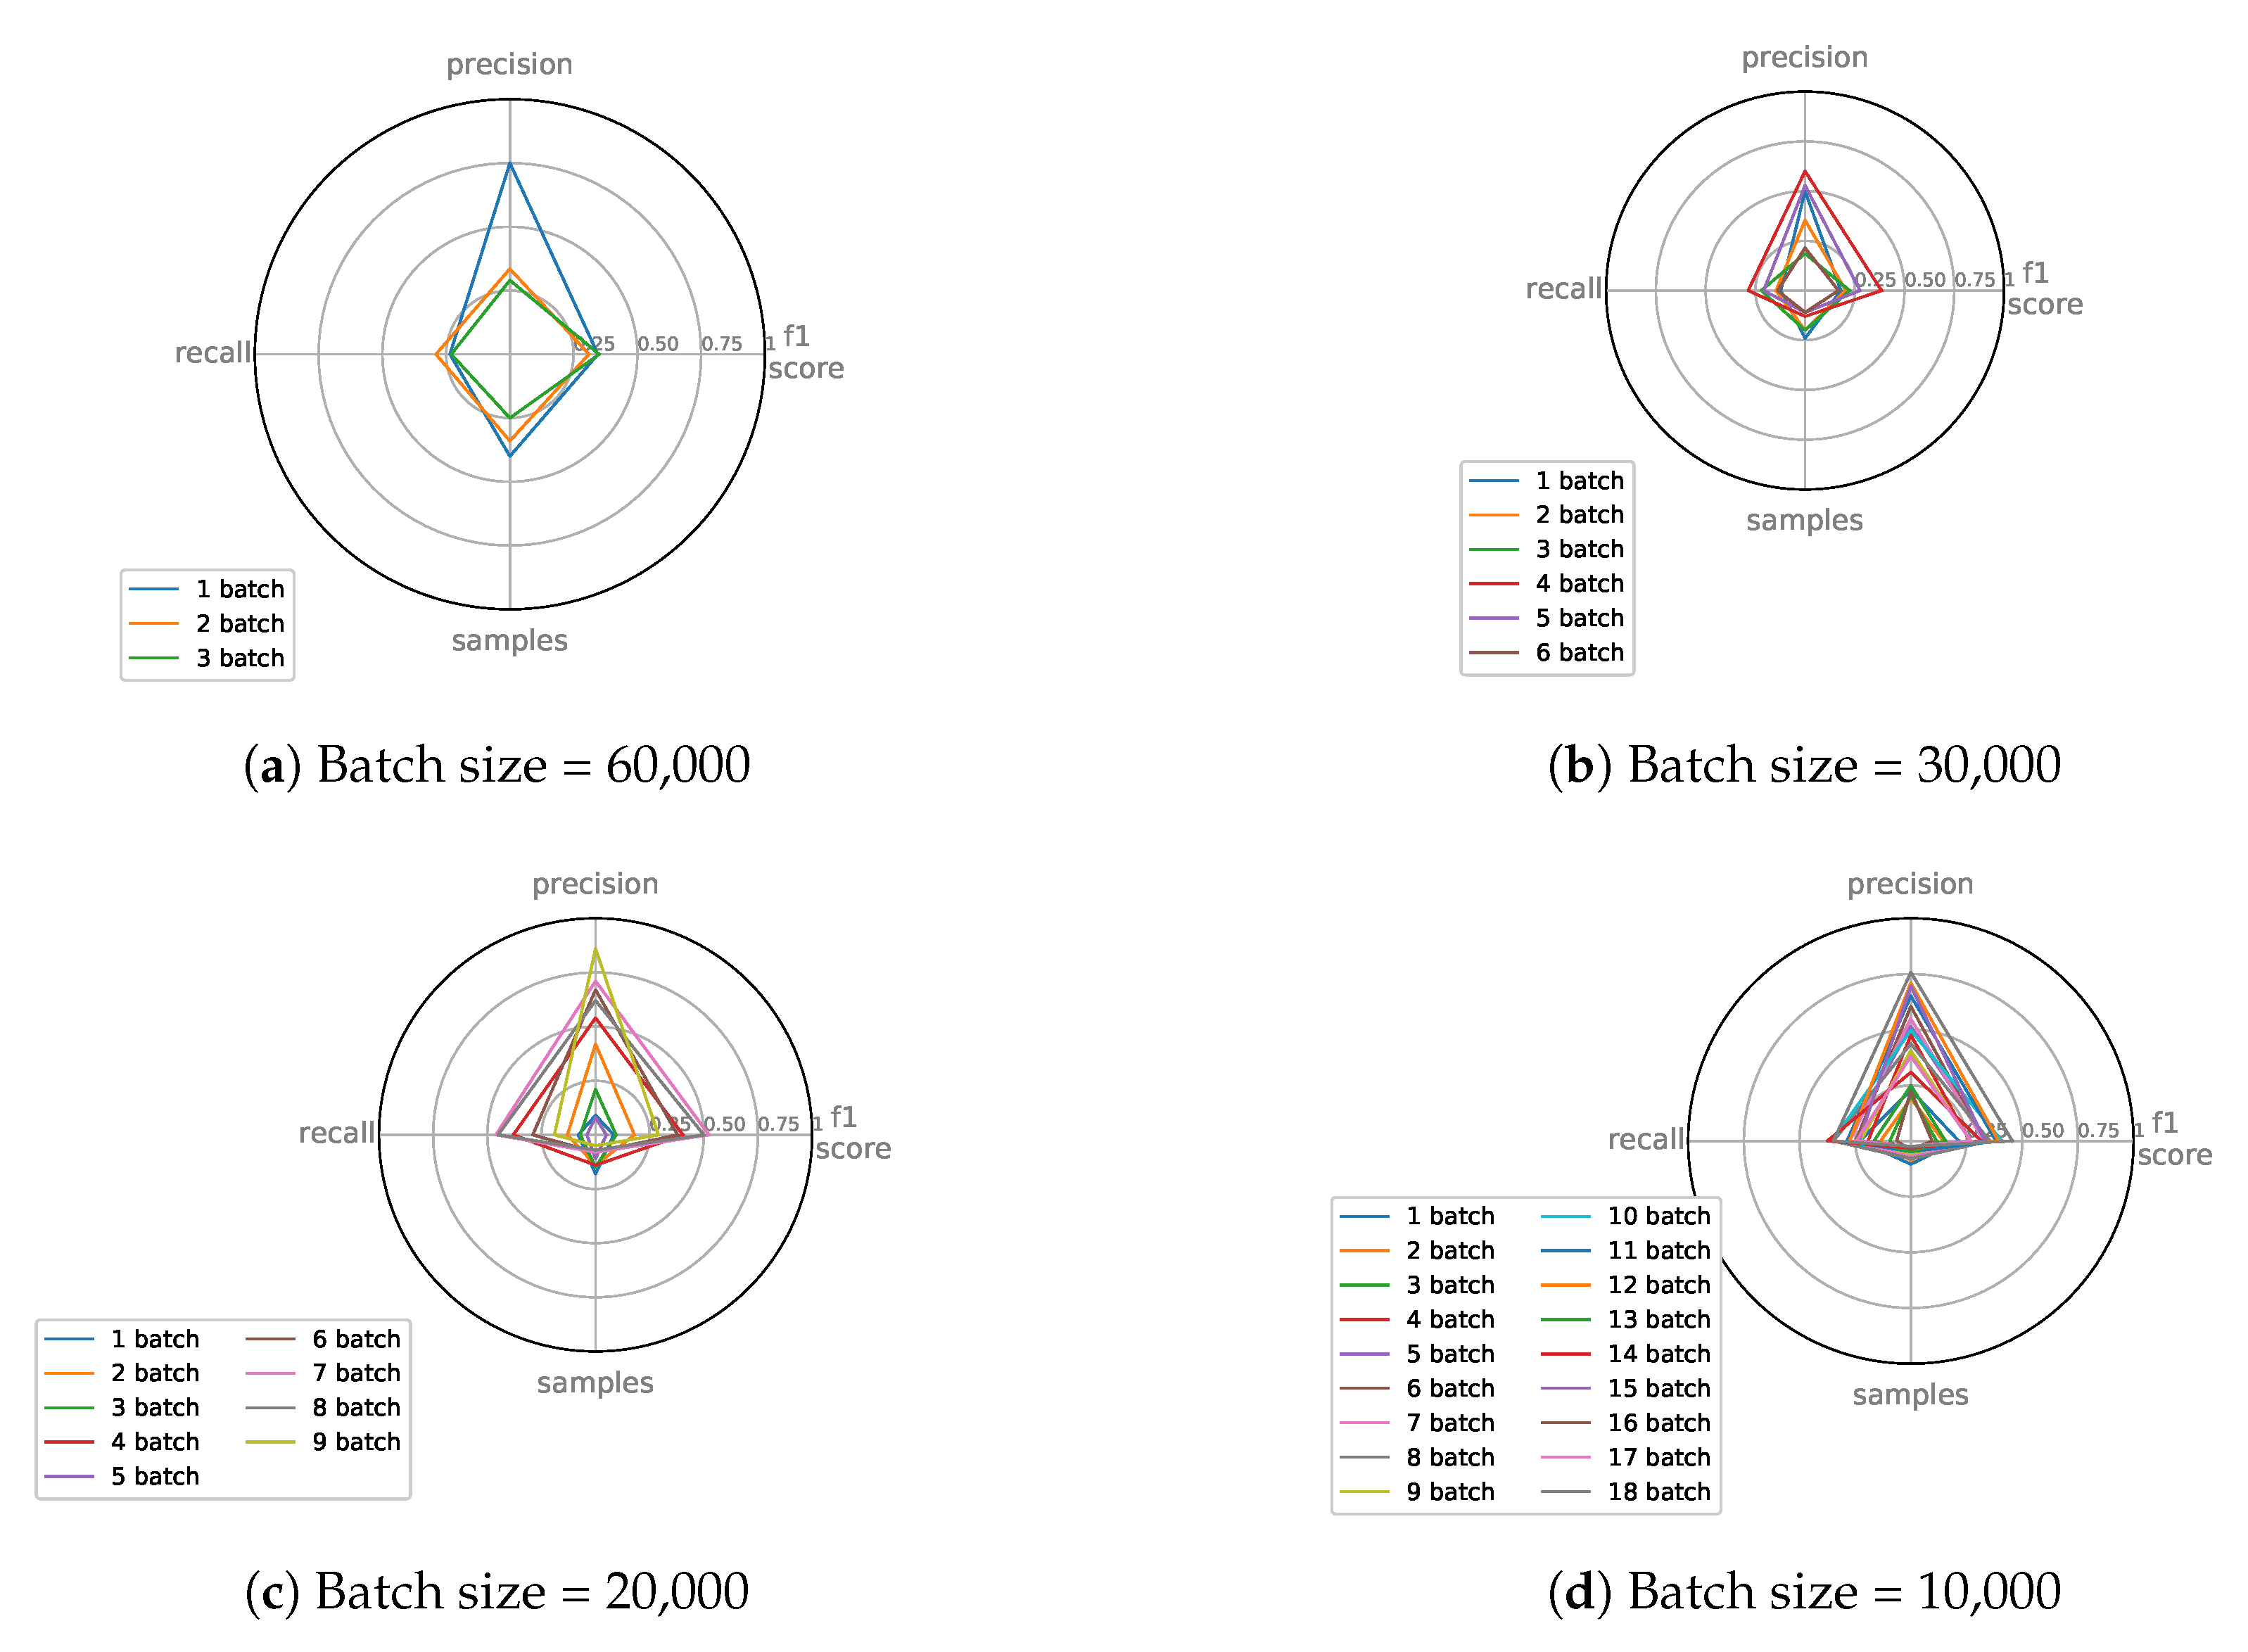
Table 3 motivated us to analyze more in-depth the strong changes that could be observed in the Mining Pool class detection, which, following our initial idea, relate to changes in behavioral patterns that only become visible when reducing the batch size. For batch size
, for example, Mining Pool behavior trained with temporal batch 7 yielded on average much better classification results than the model trained on other batches. This shows that the Mining Pool behavior captured in batch 7 is more representative than the behavior defined in all other batches.
Figure 7 shows detailed associations among F1-score, recall, precision, and normalized number of samples for the Mining Pool behavior for each batch and batch size as Radar graphs. In particular, the highest values of recall and F1-score were obtained with batch size set to 20,000 blocks training the models with batch number 7 (
and
, respectively), while the highest values of precision is obtained by training the models with batch number 9 (
), as shown in
Figure 7c. Decreasing the batch size down to 10,000 generates a linear variance in precision between
and
, keeping the F1-score in range
–
(
Figure 7d).
Figure 8 provides another interesting picture of the Mining Pool behavior. These graphs represent confusion matrices where the values of shown F1-scores were not averaged but represent the actual values computed for each test run. Each cell-value represents the F1-score of the models trained with the i-th batch and tested with the j-th batch. In case of
, the value was not computed setting the cell to
(due to this, they are shown in black).
Using heatmaps [
48], it becomes clear that decreasing the batch size generates an improvement in terms of F1-score in the detection of Mining Pool behavioral patterns (
Figure 8a–d). In the first experiment, there were 0 elements with F1-score above
(a threshold that we chose to indicate a good classification). In fact, the highest value was
. In the second experiment, there was just one test with F1-score above the chosen threshold reaching the value of
. In the third experiment, no values above the threshold were achieved; however, the highest value of
was reached in three different cases. In the fourth experiment (smallest batch size of
), 14 tests presented values above the threshold reaching a maximum value of
. Interestingly,
Figure 8c (batch size
) clearly shows how “early” models (trained on temporally earlier blocks) up to batch number 6 do not yield good classification performance in neither previous nor following batches. Models trained on batches 6–8, though, achieved good performance in the first batches highlighting that generally it was more difficult to “predict the future” (earlier models perform poorly for future batches). Moreover, Mining Pool behavior in batch 7, for example, seems to represent a “typical” behavioral pattern that is recurrent over time across several batches.
6. Discussion
The general aim of this paper was to address problems that are associated with using the entire blockchain for entity classification in machine learning forensics—which are higher complexity (requiring larger computational efforts) and the inherent problem of hiding network micro-dynamics potentially important for detecting short-term changes in entity behavior. We therefore considered Bitcoin blockchain data as time-series and divided it into temporal batches of varying size.
Our study showed that considering the blockchain as a time-series (i.e., dividing Bitcoin data into temporal batches) yields interesting insights into behavioral changes of network entities over time, which may be a starting point for future studies focusing on the investigation of network micro-dynamics.
The key idea behind our approach was that a model trained on a batch of a certain time-interval should achieve good classification performance when testing it on another temporal batch, in case entity behavioral patterns (described by the chosen, extracted features) within those batches is similar. Thus, each temporal batch was used to define and extract entity behavior, which allowed us to analyze how the chosen interval and batch size affects classification performance. Classification methods were based on cascading machine learning principles and “k-fold cross-testing”, which implies training models on one batch and testing it on all other batches until all batches have been used for training.
From
Section 5, and in particular from
Figure 5 and
Figure 6, we observed that the choice of batch size did affect all considered classes. Exchange, Gambling, and eWallet classifications were only slightly affected and yielded a weakly increasing trend in F1-score with decreasing batch size. In particular, reducing the batch size (thus considering micro-dynamics within the Bitcoin network) did not show great changes in the final classification of these classes. Moreover, for the Exchange class, this demonstrated that a smaller temporal batch size indeed seemed to be sufficient for Exchange classification—results suggest that it is not necessary to use the full blockchain data to obtain good classification rates.
Market and Mixer classification performance instead worsened when decreasing the batch size. This is reflected in
Figure 5e and
Figure 6e where F1-scores of these classes reached values close to or equal to 0. In this case, results probably depended on the small sample size of Market and Mixer entities prevalent in smaller batches.
However, the most interesting effect of batch size reduction occurred for the Mining Pool classification. In fact, Mining Pool classification performance changed dramatically when moving to smaller batch sizes, interestingly showing increasing standard deviations of averaged F1-scores for smaller batches, hinting at higher performance differences from batch to batch. These results led us to analyze Mining Pool behavior more in detail—especially as this class represents a sensitive target for cyber-attacks, as presented in [
4,
13].
Confusion matrices shown in
Figure 8a indicate that, for Mining Pool behavior, the best classification was obtained by training models with “recent” data in order to predict “past” behavior when moving to smaller batch sizes, as the majority of the highest F1-scores were below the main diagonal. This suggests that, generally, it was more difficult to “predict the future”. In fact, earlier models did not capture future behavior, but recent models did seem to contain behavioral elements that can be seen in the past as well as new elements belonging to more recent data. This could imply a certain development of network behavior over time, using old patterns of which certain features are kept but where new features evolve. Future work could investigate these findings more in detail in other networks as well.
Our findings further highlight that decreasing the batch size (to 10,000, i.e., two months of data, for example) provided a higher “temporal resolution” allowing us to detect behavioral changes that were not visible with larger batch sizes. In particular, results shown in
Figure 8d corresponding to the model trained with batch number 12, are interesting. It is possible to observe that the model achieved good classification scores for test batch numbers 1, 2, 3 and 5, but decreased its accuracy in batch 4. This situation could be a symptom of a suspicious activity (or cyber-attacks) of entities in the fourth test batch. In fact, the low score in batch 4 suggests a sudden change of behavior. These kinds of changes can only be appreciated focusing on a small time interval, as using the whole blockchain data most likely would hide these micro-effects. We believe that such findings for particular entities could be investigated more in detail in future work by cross-referencing them a posteriori with known attacks or malicious activities.
Our results, compared with results presented in [
10] (where the whole blockchain is considered), showed lower classification rates across all considered classes (from 30% to 90%). However, as mentioned in
Section 1, improving classification rates was not the aim of this study. Our idea was to introduce temporal batch division of blockchain data and aimed to analyze whether this approach may uncover micro-dynamics that determine changes in entity behavior. In fact, sudden, short-term behavioral changes of a fixed entity represented by changes of classification scores could be a symptom of suspicious behavior or an attack. Rather than looking to absolute classification scores, we therefore focused on changes or variability of scores from batch to batch.
Furthermore, it became apparent that batch size affects the detection of changes in entity behavior in different ways. A batch size that is too small seems to create difficulty in micro-dynamics detection in a small dataset (for example for Mixer, Market and Mining Pool), but entity behavior in general (Exchange, Gambling and eWallet) is enhanced.
To the best of our knowledge, this is the first study using temporal batch division of Bitcoin blockchain data, and hence we are unable to perform a comparison against similar approaches. To date, no other study has focused on detecting similarities between entity behavioral patterns in various time batches of Bitcoin blockchain data.
We acknowledge that our approach does not fully get rid of the “black-box model”, but we believe that our temporal dissection into “smaller black-boxes” has shown interesting changes in entity pattern behavior and consider it a first step towards investigating Bitcoin behavioral pattern evolution in much more detail.
One major drawback of our approach is the dependence on WalletExplorer data. This dataset allows us to only include well-known entities that were already detected, while special entities or individual users could not be included.
Furthermore, our work provides guidelines which could be used to model a “typical” Mining Pool and, in particular, we plan to use this information to develop a model to detect abnormal or illicit behavior and behavioral changes posing possible security threats—for example, by exploiting results presented in [
49], where it is stated that a type of cyber-attack produces short-term effects in the Mining Pool itself.
Future development could also be aimed at providing customization of behavioral patterns and simulating them in a controlled environment. This would allow researchers to replicate “typical” entity behavior or specific types of attacks or illicit activities related to certain entities. Furthermore, the controlled environment, for example the one presented in [
50], could be used to detect limitations of the protocol, creating specific scenarios or defining new entity behavior not yet discovered in the mainnet.

 ,
, 


