Rapid, Affordable and Efficient Screening of Multiple Blood Abnormalities Made Possible Using an Automated Tool for MALDI-ToF Spectrometry Analysis

 ,
,
Abstract
:Featured Application
Abstract
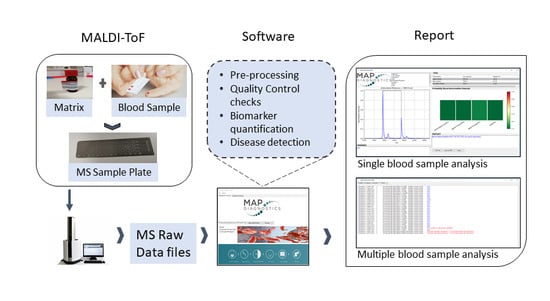
1. Introduction
2. Materials and Methods
2.1. Blood Samples
2.2. Sample Preparation
2.3. Mass Spectrometry
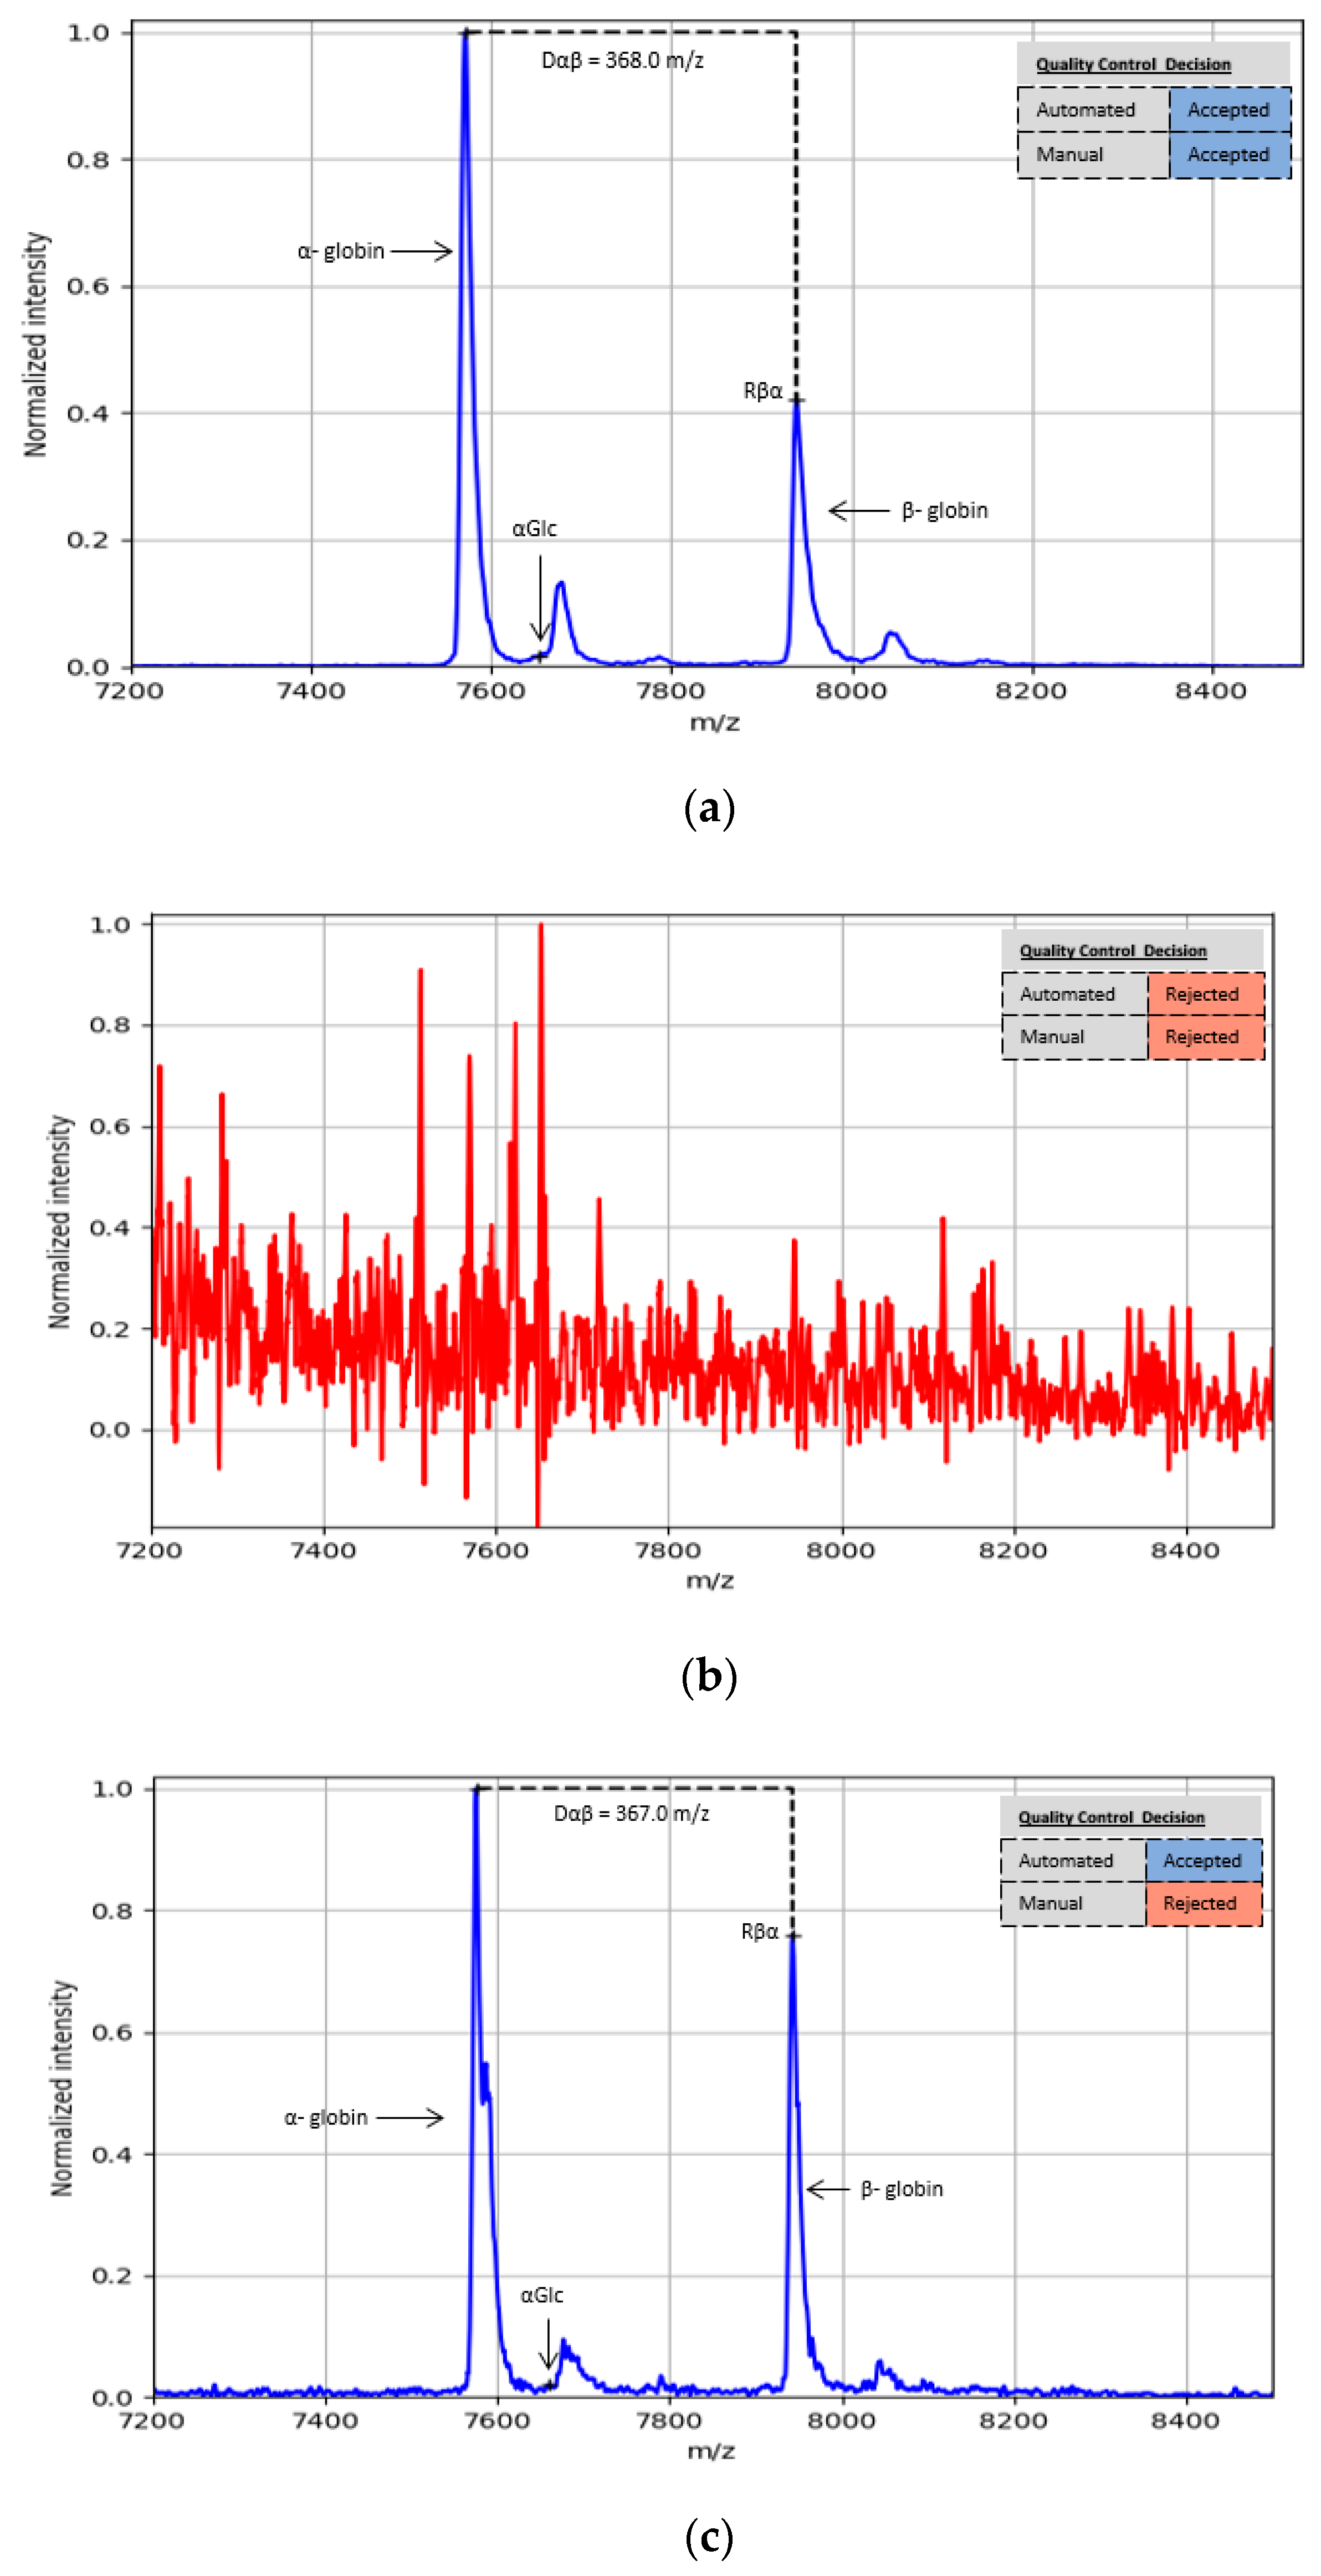
2.4. Quality Control
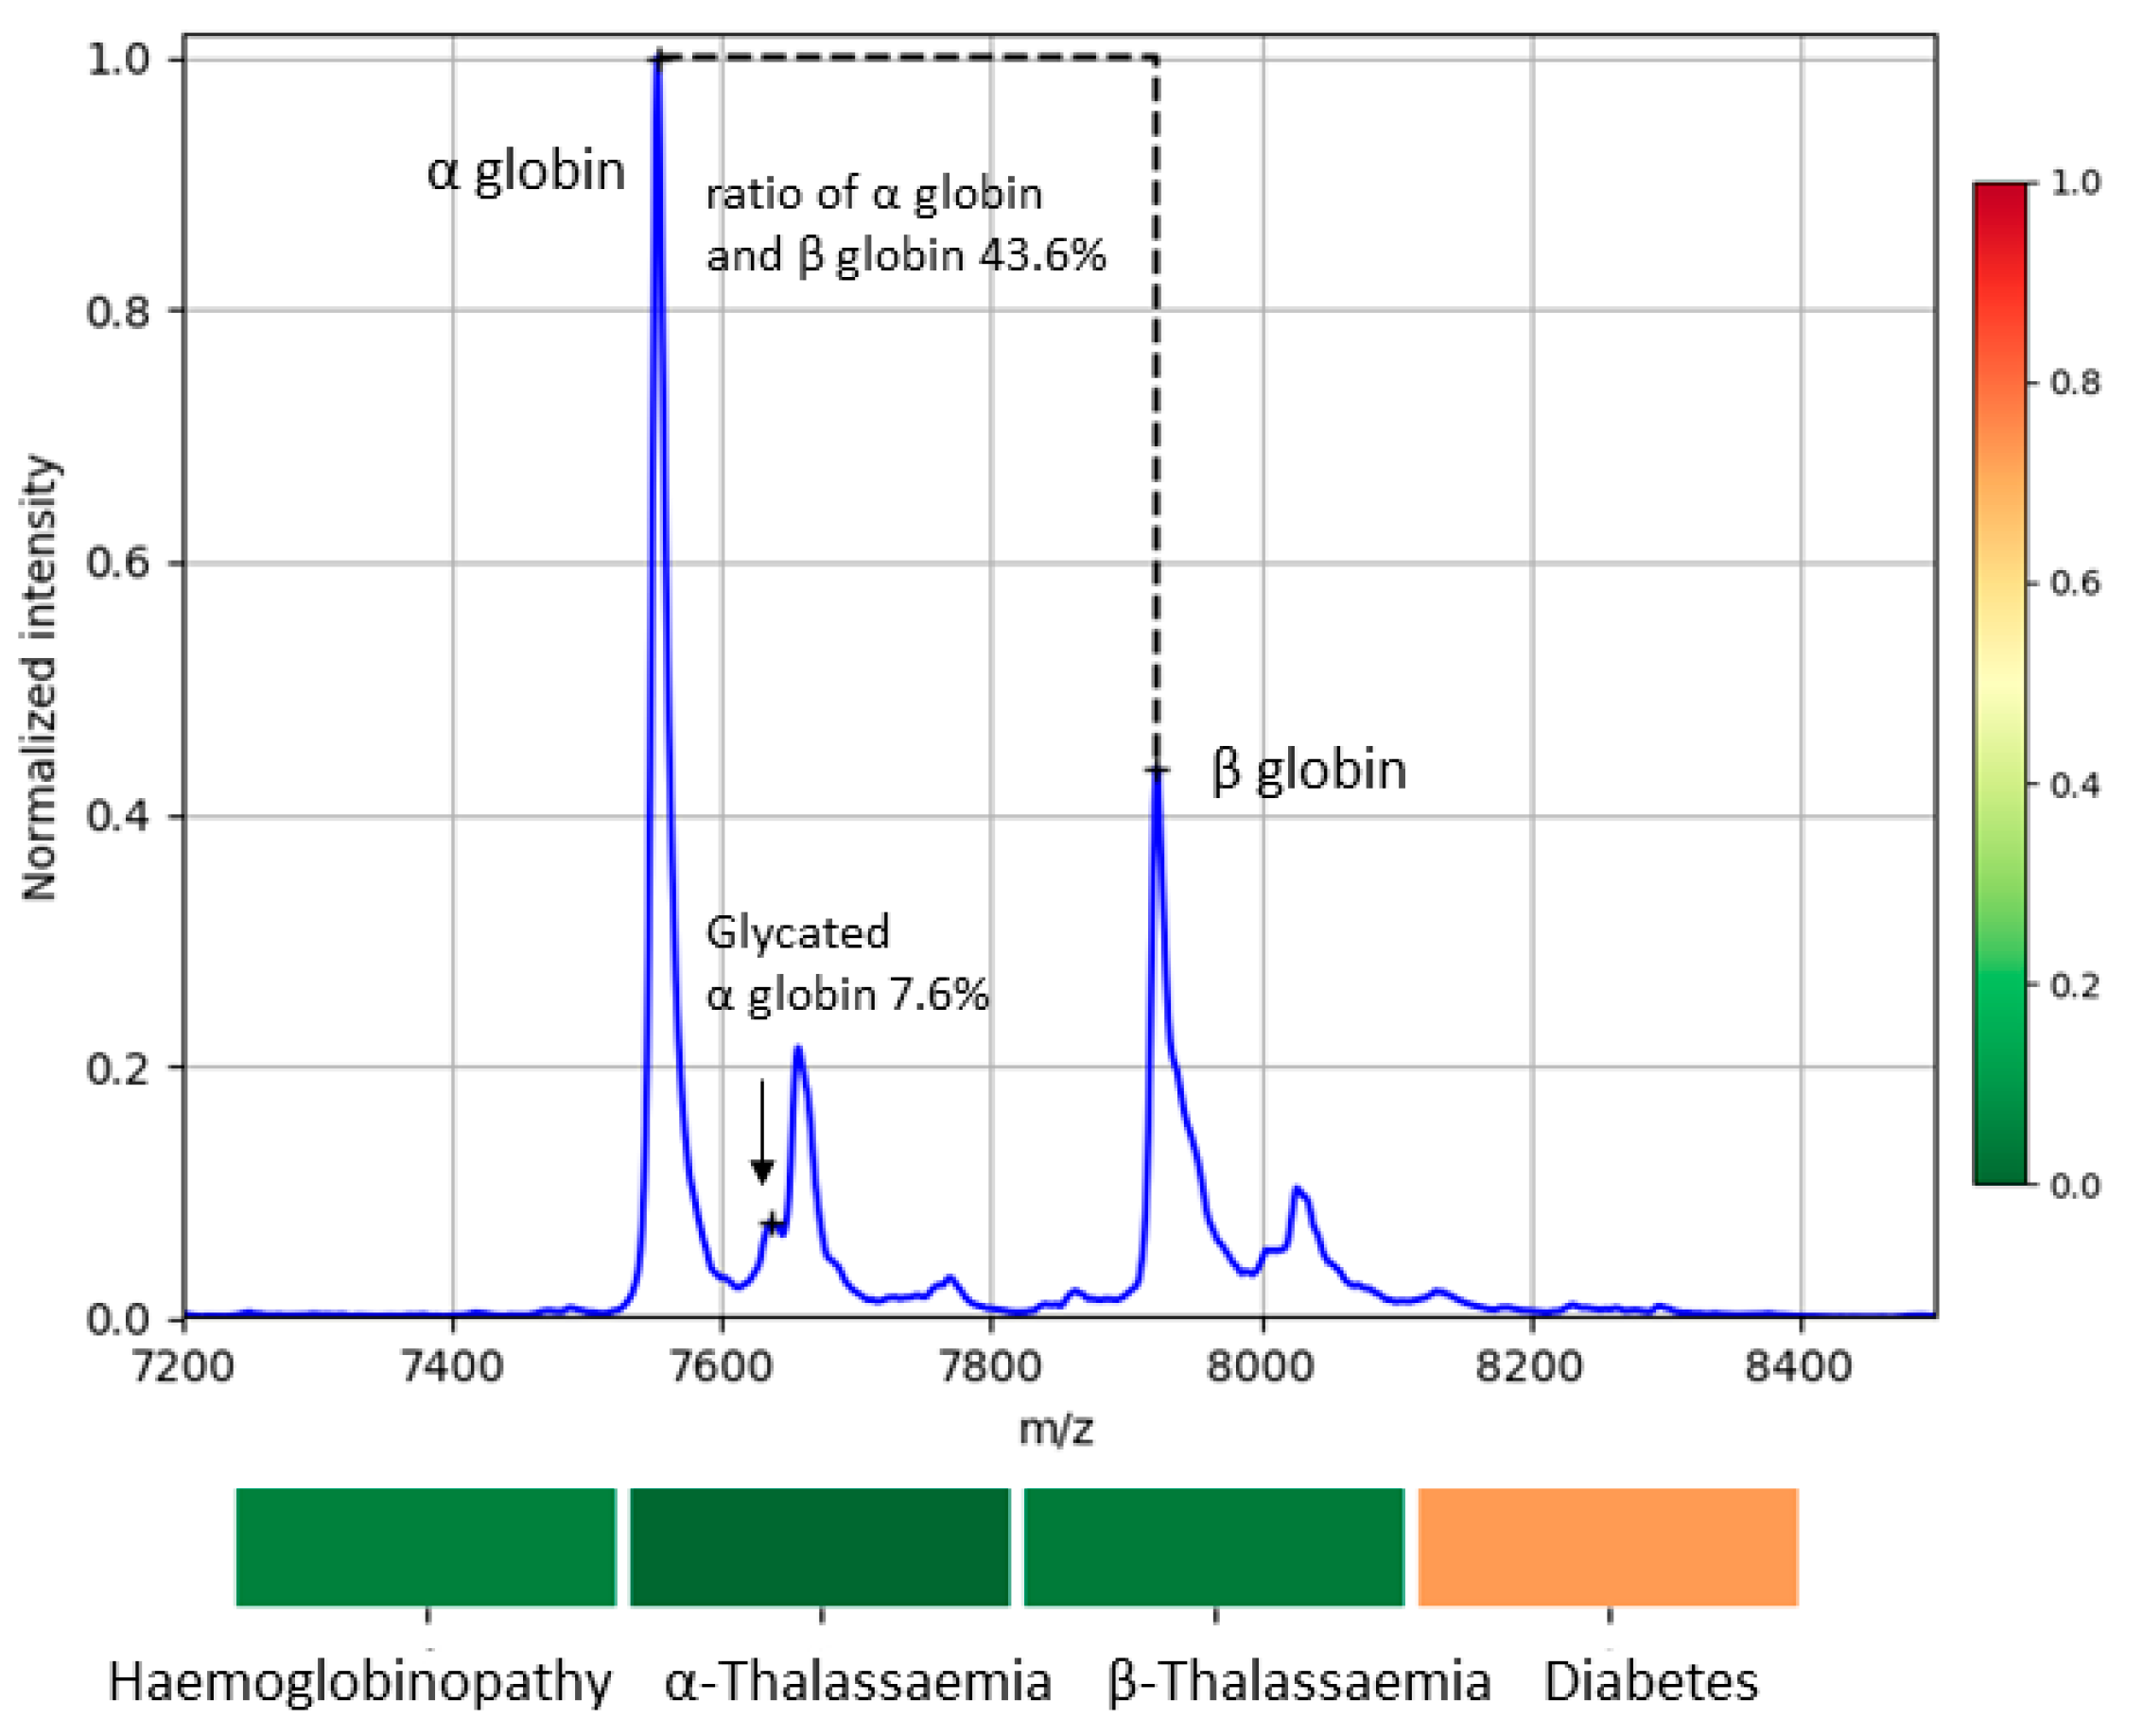
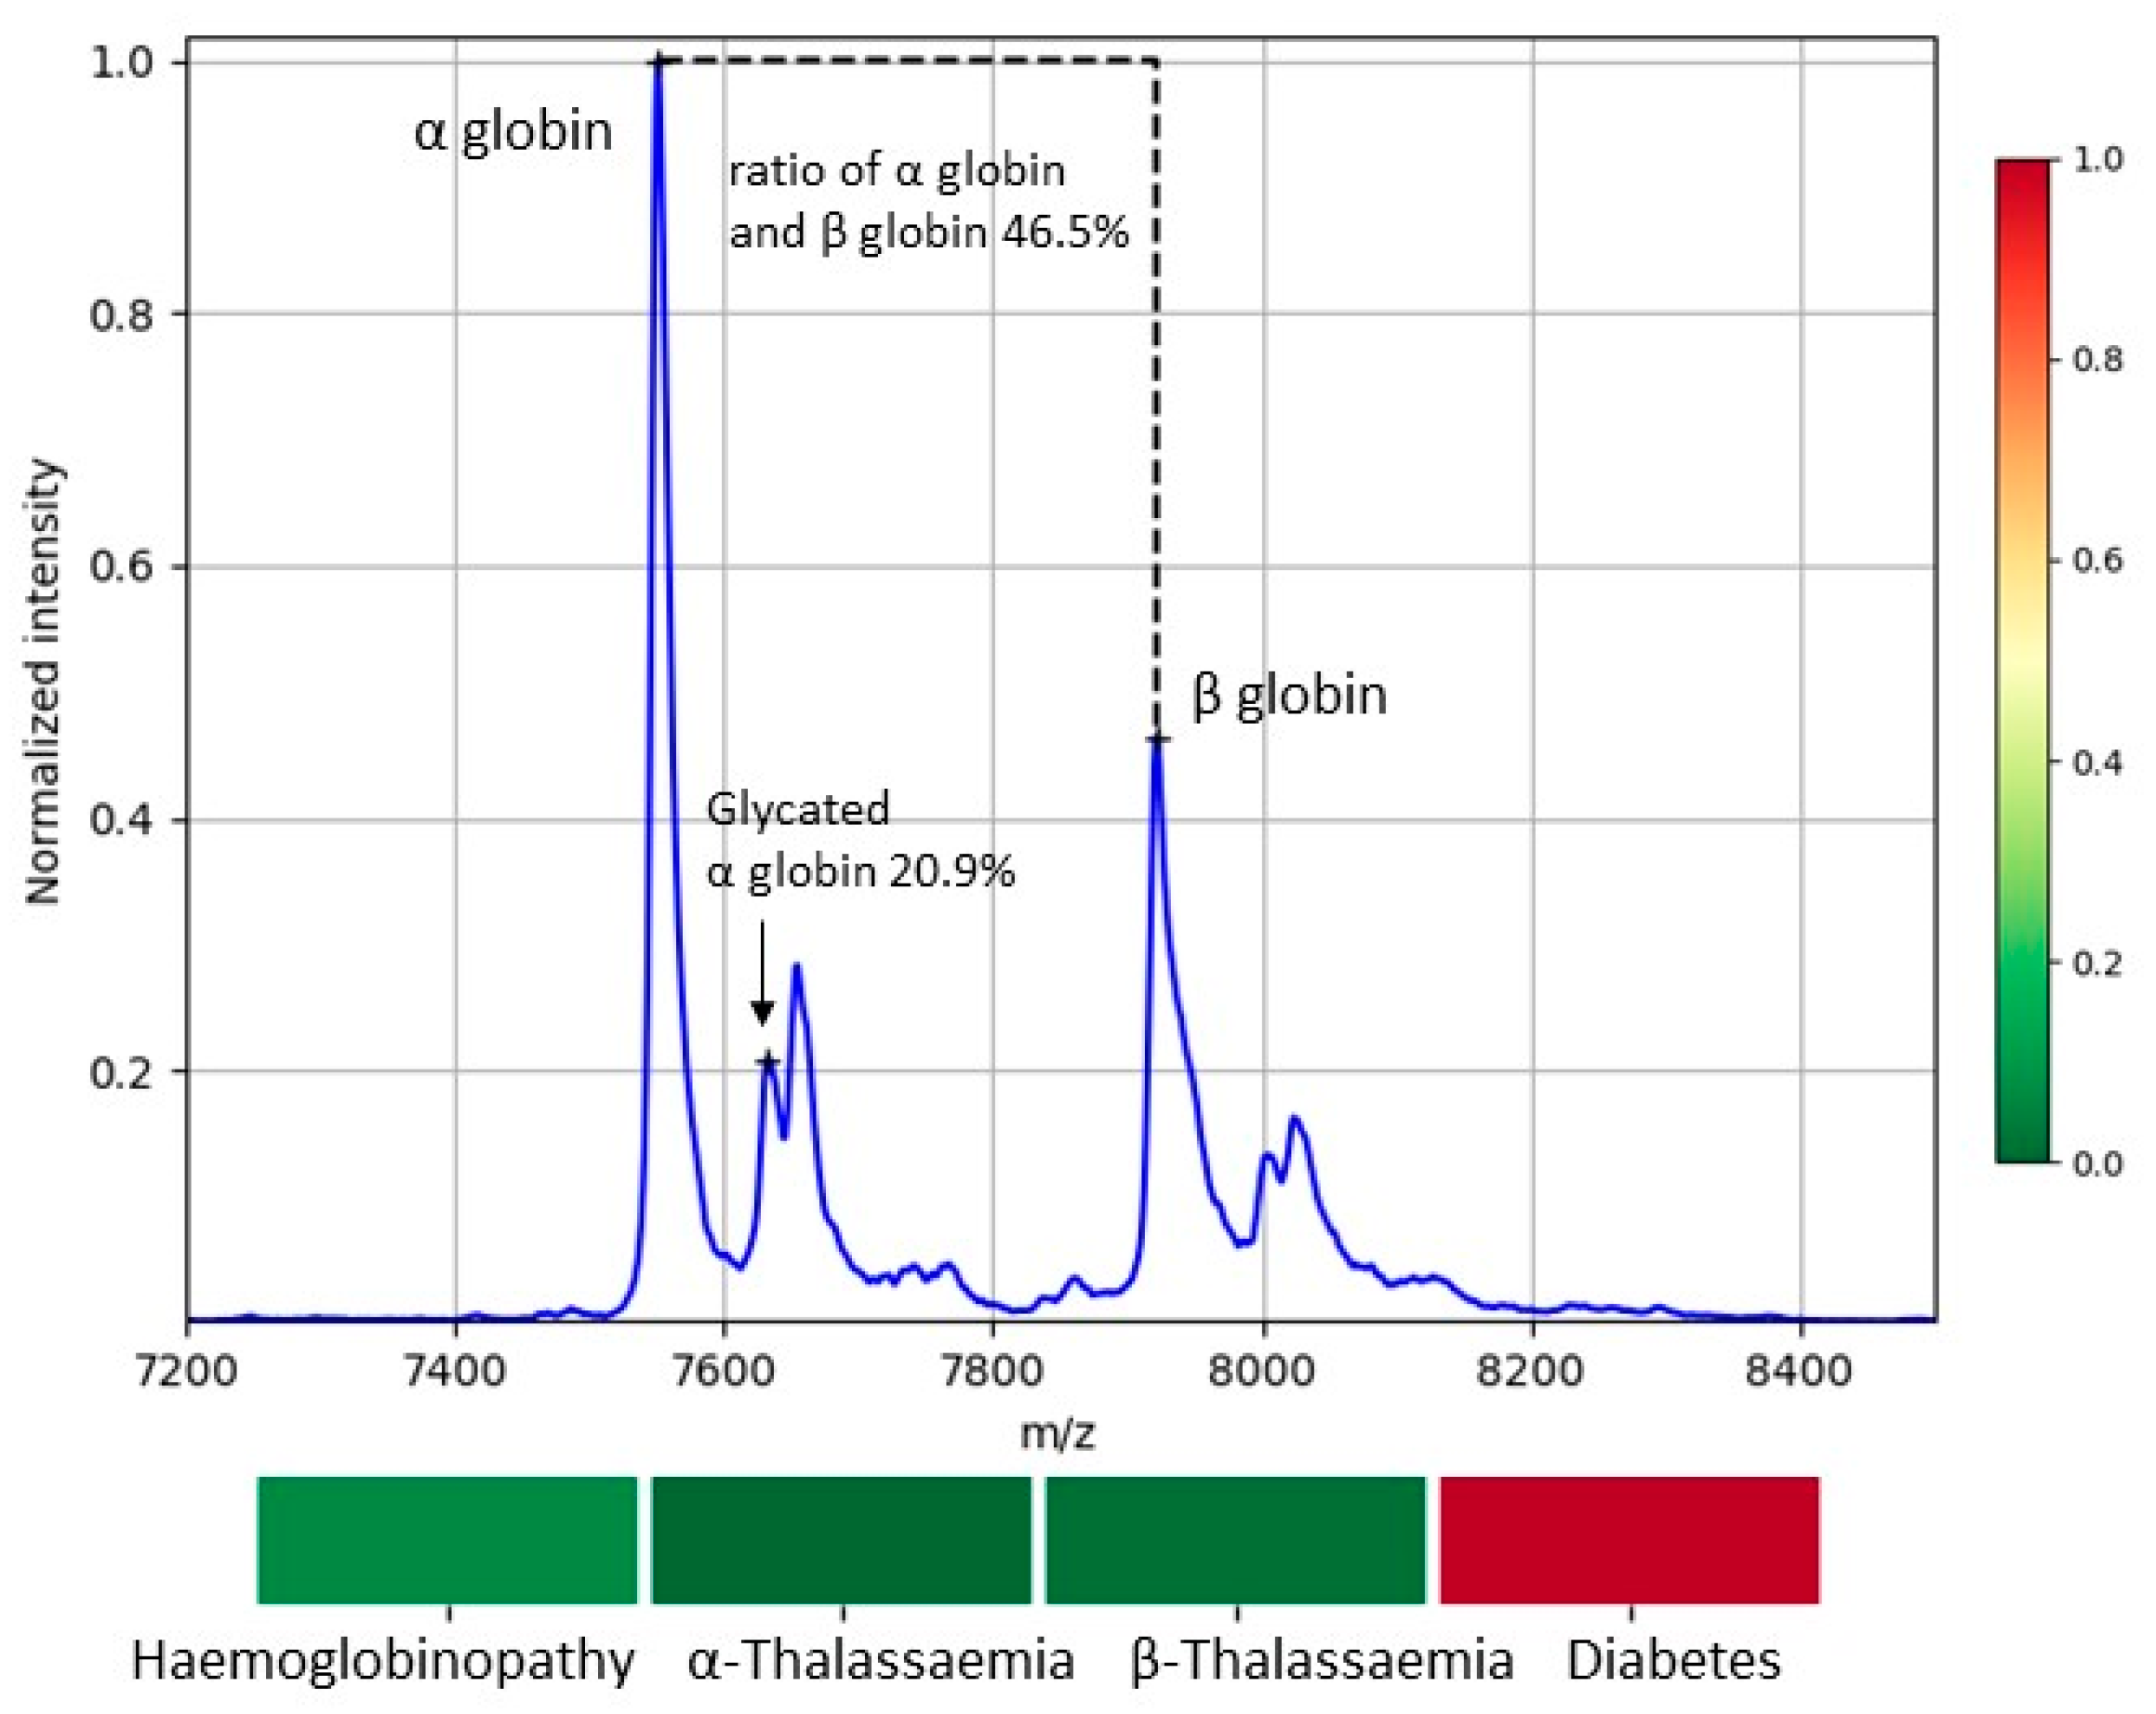
2.5. MS Biomarkers for Blood Abnormalities
2.6. Scoring the Detection of Blood Abnormalities
2.7. Manual Data Analysis
2.8. Automated Data Analysis
3. Results
3.1. Efficiency of Automated Approach vs. Manual
3.2. Variability of Biomarkers
3.3. Detected Cases of Blood Abnormalities
4. Discussion
5. Conclusions
6. Patents
Supplementary Materials
Author Contributions
Funding
Acknowledgments
Conflicts of Interest
References
- De Benoist, B.; McLean, E.; Egli, I.; Cogswell, M. Worldwide prevalence of anaemia 1993-2005: WHO Global Database on Anaemia. WHO Glob. Database Anaemia 2008, 1, 1–51. [Google Scholar]
- Secretariat Sickle-Cell Anaemia; Report by the Secretariat Prevalence of Sickle-Cell Anaemia; World Health Organization: Geneva, Switzerland, 2006; pp. 1–5.
- Basran, R.K.; Patterson, M.; Walker, L.; Nakamura, L.M.; Eng, B.; Chui, D.H.; Waye, J.S. Prenatal Diagnosis of Hemoglobinopathies in Ontario, Canada. Ann. N. Y. Acad. Sci. 2005, 1054, 507–510. [Google Scholar] [CrossRef] [PubMed]
- AlSwaidi, F.M.; O’Brien, S.J. Premarital screening programmes for haemoglobinopathies, HIV and hepatitis viruses: Review and factors affecting their success. J. Med. Screen. 2009, 16, 22–28. [Google Scholar] [CrossRef] [PubMed]
- Ford, J.C.; Chitayat, D.; Désilets, V.A.; Farrell, S.A.; Geraghty, M.; Nelson, T.; Nikkel, S.M.; Shugar, A.; Skidmore, D.; Allen, V.M.; et al. Carrier screening for thalassemia and hemoglobinopathies in Canada. J. Obstet. Gynaecol. Can. 2008, 30, 950–959. [Google Scholar]
- Bertram, M.Y.; Vos, T. Quantifying the duration of pre-diabetes. Aust. N. Z. J. Public Health 2010, 34, 311–314. [Google Scholar] [CrossRef]
- Choi, S.B.; Kim, W.J.; Yoo, T.K.; Park, J.S.; Chung, J.W.; Lee, Y.-H.; Kang, E.S.; Kim, D.W. Screening for Prediabetes Using Machine Learning Models. Comput. Math. Methods Med. 2014, 2014, 618976. [Google Scholar] [CrossRef]
- Cefalu, W.T. “Prediabetes”: Are There Problems with This Label? No, We Need Heightened Awareness of This Condition! Diabetes Care 2016, 39, 1472–1477. [Google Scholar] [CrossRef]
- Goonasekera, H.; Paththinige, C.; Dissanayake, V. Population Screening for Hemoglobinopathies. Annu. Rev. Genom. Hum. Genet. 2018, 19, 355–380. [Google Scholar] [CrossRef]
- Angeletti, S. Matrix assisted laser desorption time of flight mass spectrometry (MALDI-TOF MS) in clinical microbiology. J. Microbiol. Methods 2017, 138, 20–29. [Google Scholar] [CrossRef]
- Seng, P.; Drancourt, M.; Gouriet, F.; La Scola, B.; Fournier, P.; Rolain, J.M.; Raoult, D. Ongoing Revolution in Bacteriology: Routine Identification of Bacteria by Matrix-Assisted Laser Desorption Ionization Time-of-Flight Mass Spectrometry. Clin. Infect. Dis. 2009, 49, 543–551. [Google Scholar] [CrossRef]
- Nomura, F. Proteome-based bacterial identification using matrix-assisted laser desorption ionization–time of flight mass spectrometry (MALDI-TOF MS): A revolutionary shift in clinical diagnostic microbiology. Biochim. et Biophys. Acta (BBA)-Proteins Proteom. 2015, 1854, 528–537. [Google Scholar] [CrossRef] [PubMed]
- Gaillot, O.; Blondiaux, N.; Loïez, C.; Wallet, F.; Lemaître, N.; Herwegh, S.; Courcol, R.J. Cost-Effectiveness of Switch to Matrix-Assisted Laser Desorption Ionization-Time of Flight Mass Spectrometry for Routine Bacterial Identification. J. Clin. Microbiol. 2011, 49, 4412. [Google Scholar] [CrossRef] [PubMed]
- Tan, K.E.; Ellis, B.C.; Lee, R.; Stamper, P.D.; Zhang, S.X.; Carroll, K.C. Prospective Evaluation of a Matrix-Assisted Laser Desorption Ionization-Time of Flight Mass Spectrometry System in a Hospital Clinical Microbiology Laboratory for Identification of Bacteria and Yeasts: A Bench-by-Bench Study for Assessing the Impact on Time to Identification and Cost-Effectiveness. J. Clin. Microbiol. 2012, 50, 3301–3308. [Google Scholar] [PubMed]
- Duncan, M.W.; Nedelkov, D.; Walsh, R.; Hattan, S.J. Applications of MALDI Mass Spectrometry in Clinical Chemistry. Clin. Chem. 2015, 62, 134–143. [Google Scholar] [CrossRef]
- Iles, R.K.; Cole, L.A.; Butler, S.A. Direct Analysis of hCGβcf Glycosylation in Normal and Aberrant Pregnancy by Matrix-Assisted Laser Desorption/Ionization Time-of-Flight Mass Spectrometry. Int. J. Mol. Sci. 2014, 15, 10067–10082. [Google Scholar] [CrossRef]
- Biroccio, A.; Urbani, A.; Massoud, R.; Di Ilio, C.; Sacchetta, P.; Bernardini, S.; Cortese, C.; Federici, G. A quantitative method for the analysis of glycated and glutathionylated hemoglobin by matrix-assisted laser desorption ionization-time of flight mass spectrometry. Anal. Biochem. 2005, 336, 279–288. [Google Scholar] [CrossRef]
- Iles, R.; Mahmoud, N. Future Laboratory Medicine: Rapid, Efficient and Affordable Screen-ing for Haemoglobinopathies by MALDI-ToF Mass Spectrometry. Adv. Biochem. Biotehcnol. 2018, 2017, 1–5. [Google Scholar]
- Butler, S.A.; Luttoo, J.; Freire, M.O.T.; Abban, T.K.; Borrelli, P.T.A.; Iles, R.K. Human chorionic gonadotropin (hCG) in the secretome of cultured embryos: Hyperglycosylated hCG and hCG-free beta subunit are potential markers for infertility management and treatment. Reprod. Sci. 2013, 20, 1038–1045. [Google Scholar] [CrossRef]
- Haslam, C.; Hellicar, J.; Dunn, A.; Fuetterer, A.; Hardy, N.; Marshall, P.; Paape, R.; Pemberton, M.; Resemannand, A.; Leveridge, M. The Evolution of MALDI-TOF Mass Spectrometry toward Ultra-High-Throughput Screening: 1536-Well Format and Beyond. J. Biomol. Screen. 2016, 21, 176–186. [Google Scholar] [CrossRef]
- Pan, S.; Zhang, H.; Rush, J.; Eng, J.; Zhang, N.; Patterson, D.; Comb, M.J.; Aebersold, R. High Throughput Proteome Screening for Biomarker Detection. Mol. Cell. Proteom. 2005, 4, 182–190. [Google Scholar] [CrossRef]
- Pais, R.J.; Zmuidinaite, R.; Butler, S.; Iles, R. An automated workflow for MALDI-ToF mass spectra pattern identification on large data sets: An application to detect aneuploidies from pregnancy urine. Inform. Med. Unlocked 2019, 16, 100194. [Google Scholar] [CrossRef]
- Iles, R.K.; Iles, J.K.; Abban, T.; Docherty, S.M.; Nasse, M. Method for Detecting Abnormalities in Hemoglobin. WO Patent 2016/030688, July 2019. [Google Scholar]
- Consultation, W. Use of Glycated Haemoglobin (HbA1c) in the Diagnosis of Diabetes Mellitus; World Health Organization: Geneva, Switzerland, 2011. [Google Scholar]
- Punthakee, Z.; Goldenberg, R.; Katz, P. Definition, Classification and Diagnosis of Diabetes, Prediabetes and Metabolic Syndrome. Can. J. Diabetes 2018, 42, S10–S15. [Google Scholar] [CrossRef] [PubMed]
- Strohalm, M.; Hassman, M.; Kosata, B.; Kodíček, M. mMass data miner: An open source alternative for mass spectrometric data analysis. Rapid Commun. Mass Spectrom. 2008, 22, 905–908. [Google Scholar] [CrossRef]
- Strohalm, M.; Kavan, D.; Novák, P.; Volný, M.; Havlíček, V. mMass3: A Cross-Platform Software Environment for Precise Analysis of Mass Spectrometric Data. Anal. Chem. 2010, 82, 4648–4651. [Google Scholar] [CrossRef]
- Swan, A.L.; Mobasheri, A.; Allaway, D.; Liddell, S.; Bacardit, J. Application of machine learning to proteomics data: Classification and biomarker identification in postgenomics biology. OMICS J. Integr. Boil. 2013, 17, 595–610. [Google Scholar] [CrossRef] [PubMed]
- Greene, D.N.; Vaugn, C.P.; Crews, B.O.; Agarwal, A.M. Advances in detection of hemoglobinopathies. Clin. Chim. Acta 2014, 439, 50–57. [Google Scholar] [CrossRef] [PubMed]


| Disease Detection | Biomarker | µ Value | Ref. | δ Value | Ref. |
|---|---|---|---|---|---|
| Haemoglobinopathies | Dαβ | 368.2 m/z | [18,23] 1 | 6 m/z | MS data 2 |
| α Thalassemia | Rβα | 90% | [23] 1 | 15% | MS data 2 |
| β Thalassemia | Rβα | 51% | [23] 1 | 25% | MS data 2 |
| Diabetes | αGlc | 10% | [24,25] 1 | 3% | [24,25] 1 |
| Automated | Manual | Dilution 1:500 | Dilution 1:1000 | Dilution 1:2000 |
|---|---|---|---|---|
| Accepted | Accepted | 94.7% (54 cases) | 82.5% (47 cases) | 66.7% (36 cases) |
| Rejected | Rejected | 3.5% (2 cases) | 10.5% (6 cases) | 11.1% (6 cases) |
| Accepted | Rejected | 1.8% (1 case) | 7.0% (4 cases) | 22.2% (12 cases) |
| Rejected | Accepted | 0.0% (0 cases) | 0.0% (0 cases) | 0.0% (0 cases) |
© 2019 by the authors. Licensee MDPI, Basel, Switzerland. This article is an open access article distributed under the terms and conditions of the Creative Commons Attribution (CC BY) license (http://creativecommons.org/licenses/by/4.0/).
Share and Cite
Pais, R.J.; Jardine, C.; Zmuidinaite, R.; Lacey, J.; Butler, S.; Iles, R. Rapid, Affordable and Efficient Screening of Multiple Blood Abnormalities Made Possible Using an Automated Tool for MALDI-ToF Spectrometry Analysis. Appl. Sci. 2019, 9, 4999. https://doi.org/10.3390/app9234999
Pais RJ, Jardine C, Zmuidinaite R, Lacey J, Butler S, Iles R. Rapid, Affordable and Efficient Screening of Multiple Blood Abnormalities Made Possible Using an Automated Tool for MALDI-ToF Spectrometry Analysis. Applied Sciences. 2019; 9(23):4999. https://doi.org/10.3390/app9234999
Chicago/Turabian StylePais, Ricardo J., Christian Jardine, Raminta Zmuidinaite, Jonathan Lacey, Steve Butler, and Ray Iles. 2019. "Rapid, Affordable and Efficient Screening of Multiple Blood Abnormalities Made Possible Using an Automated Tool for MALDI-ToF Spectrometry Analysis" Applied Sciences 9, no. 23: 4999. https://doi.org/10.3390/app9234999
APA StylePais, R. J., Jardine, C., Zmuidinaite, R., Lacey, J., Butler, S., & Iles, R. (2019). Rapid, Affordable and Efficient Screening of Multiple Blood Abnormalities Made Possible Using an Automated Tool for MALDI-ToF Spectrometry Analysis. Applied Sciences, 9(23), 4999. https://doi.org/10.3390/app9234999