Article

A Practical Positioning Method in End-Plate Surface Distance Measurement with Nano-Meter Precision

1
School of Instrumentation and Optoelectronic Engineering, Beihang University, Beijing 100191, China
2
Division of Metrology in Length and Precision Engineering, National Institute of Metrology, Beijing 100013, China
3
School of Mechatronics Engineering, Henan University of Science and Technology, Luoyang 471003, China
*
Author to whom correspondence should be addressed.
Appl. Sci. 2019, 9(22), 4970; https://doi.org/10.3390/app9224970
Submission received: 15 October 2019 / Revised: 15 November 2019 / Accepted: 15 November 2019 / Published: 19 November 2019
(This article belongs to the Special Issue Manufacturing Metrology)

Abstract

:
End-plate surface distance is important for length value dissemination in the field of metrology. For the measurement of distance of two surfaces, the positioning method is the key for realizing high precision. A practical method with nanometer positioning precision is introduced in consideration of the complexity of positioning laser sources of the traditional methods and new methods. The surface positioning is realized by the combination of laser interference and white light interference. In order to verify the method, a 0.1 mm height step is made, and an experiment system based on the method is established. The principle and the basic theory of the method are analyzed, and the measures to enhance the repeatability from optical and mechanical factors and signal processing methods are presented. The experimental result shows that the surface positioning repeatability is in the order of 10 nm. The measurement uncertainty evaluation shows that the standard uncertainty is 21 nm for a 0.1 mm step. It is concluded that the method is suitable to be applied to the length measurement standard of the lab.

1. Introduction

End-plate surface distance is one of the important geometric parameters that are widely used in industry and science. The end-plate surface distance objective standards such as gauge block, step master or step height gauge, and step gauge are extensively applied to the calibration of length instruments. Besides, the end-plate surface distance such as the length of glass cavity is one of important parameters for the frequency stabilization of the laser and the performance of the F–P interferometer, so accurately measuring the end-plate surface distance measurement is needed. The end-plate surface distance of objective length standards is in the range from a few tens of nanometers to one meter. Different sizes of objective length standards have respective calibration applications. For example, the step gauge with nanometer size is generally used for calibration of relevant measurement instruments such as AFM(Atomic Force Microscope) and SPM(Scanning Probe Microscope) [1,2,3]. The step master with micrometer size is generally used for the z-axis (vertical direction) calibration of optical instruments. No matter what size of gauge block it is, the positioning of surface is the key to realizing high precision. Generally, interference methods are used for the measurement of end-plate surface distance with high precision. The traditional interference method is the excess fraction method [4], known from the CMCs(Calibration and Measurement Capabilities) published at the website of BIPM (International Bureau of Weights and Measures Metre Convention signatories); this method has about 20 nm positioning expansion uncertainty for end surface distance measurement of the gauge block. Although the positioning precision is very high for the excess fraction method, it needs at least two kinds of frequency stabilized lasers with different wavelength. Nowadays new methods using a femtosecond mode-locked pulse laser have appeared with the development of laser technology; researchers in [5] gave a description of this method and showed a measurement repeatability of 19 nm. Due to use of the femtosecond mode-locked pulse laser, the system is very complex. The common shortfall of both methods is that they are not easy to popularize because of their high cost and the complexity. For these reasons, a practical method realized by the combination of white light interference and laser interference is presented in this paper. The feature of this method is that it takes advantage of the positioning function of white light interference and good coherence of the laser. An experimental system was created to verify this method, by optimizing the different parts of the system such as the signal processing part, and by using dynamic measurement, 10 nm measurement repeatability was obtained in ordinary laboratory conditions. The measurement repeatability should be better if using this method to the standard device.

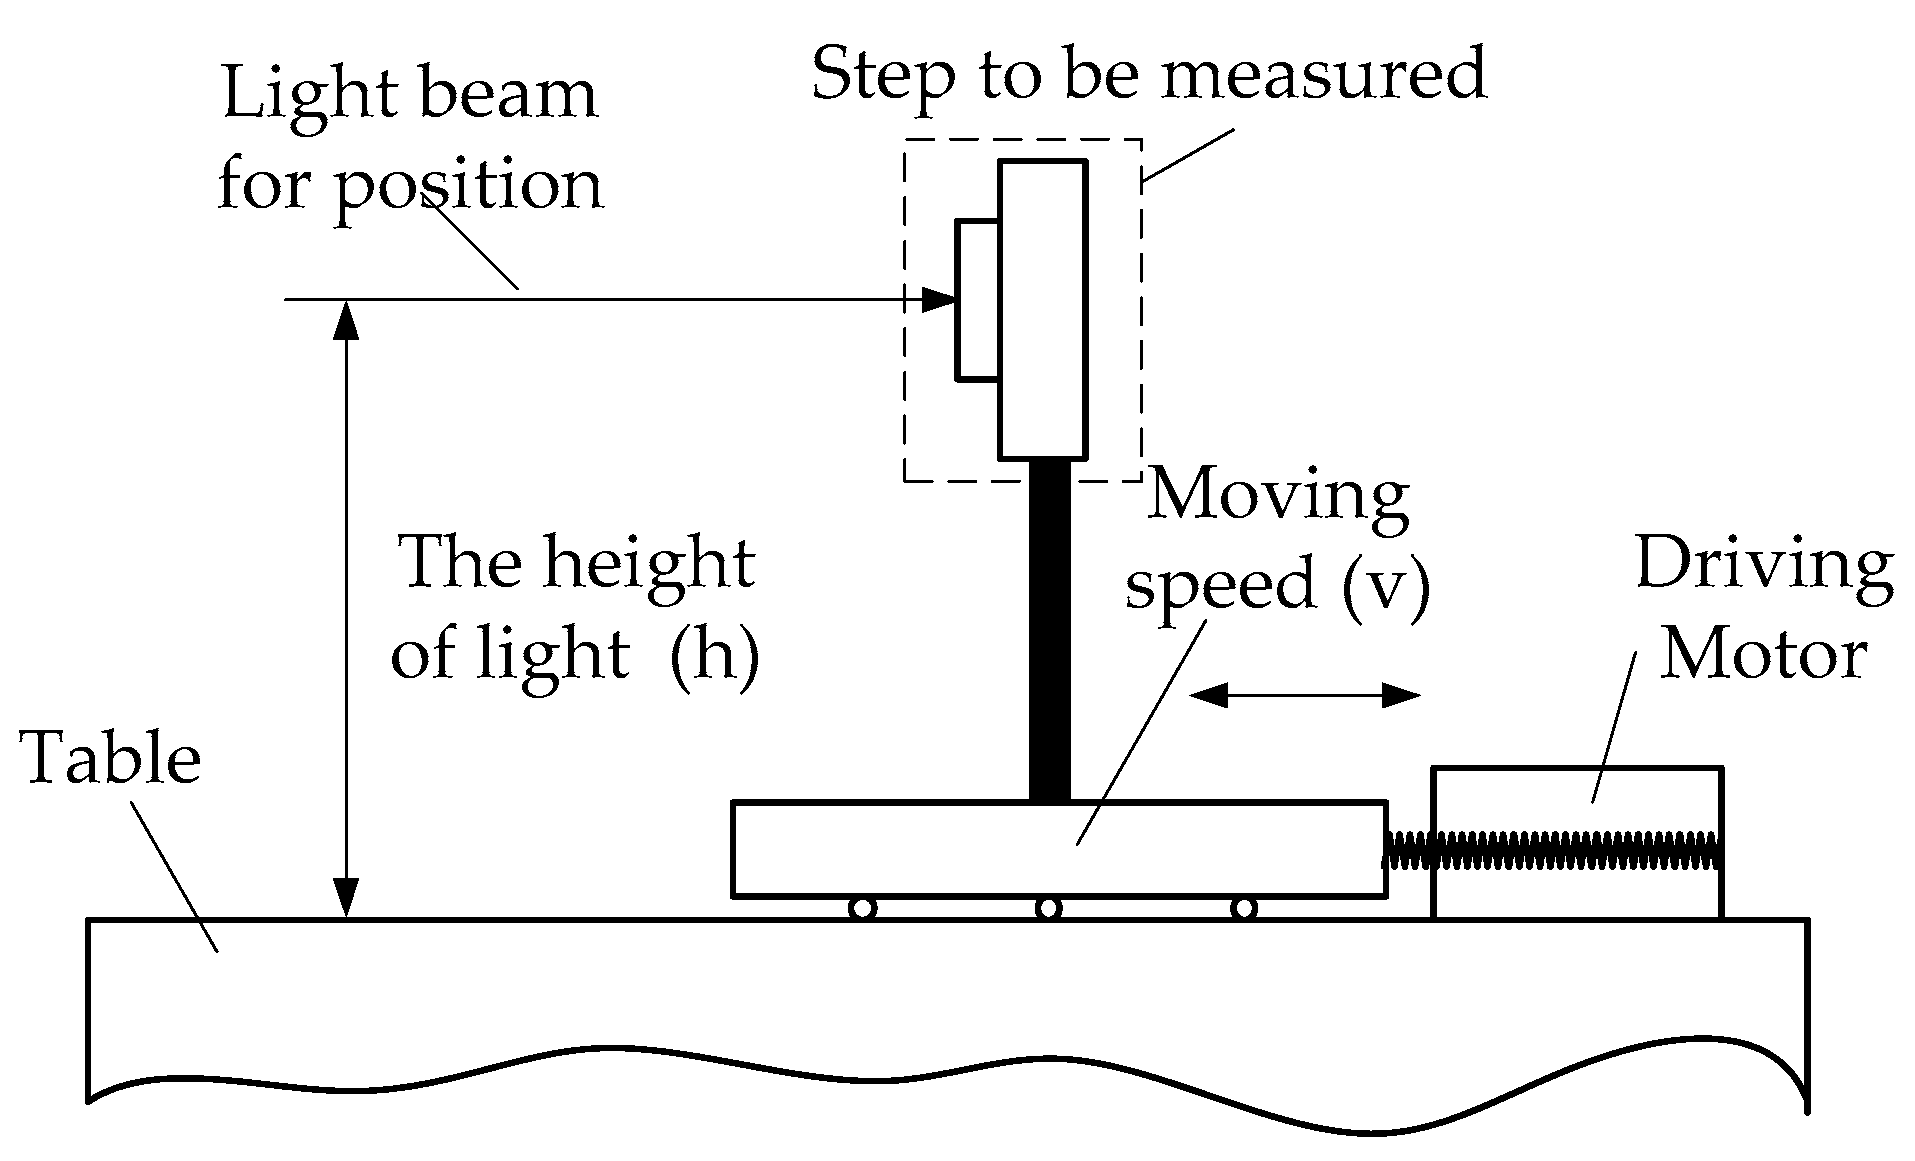
2. System Description

The system block diagram is shown in Figure 1. The system is mainly composed of two parts that realize positioning and measuring function. The positioning part is the key of the system. The measured 0.1 mm step is made first, as shown in Figure 1, where A, B, and C are the standard gauge blocks. The optical path of positioning interference is the simple Michelson type. The laser beam and white light beam are polarized first by polarizer and then separated by PBS and NPBS (PBS is polarizing beam splitter, NPBS is non-polarizing beam splitter) to transmit to each receiver. Three photoelectric receivers are used for receiving three interference signals, i.e., the positioning signals of white light interference and laser interference as well as laser interference signal. The positioning laser and displacement measurement laser use the same laser source of semiconductor laser. The positioning laser and displacement measurement laser are separated by a splitter and transmitted into each optical path. The light beam collimating and expanding unit is used for reducing the error caused by the diffraction of the Gaussian laser beam. The signal processing system can simultaneously sample and record the position interference signal and laser interference displacement signal, and then process these signals to get the value of the height of the step. There are two design features. The first feature is the position optical path, which is designed to be suitable for the cooperation of laser and white light interference, and the other feature is the signal processing system designed for dynamic measurement.

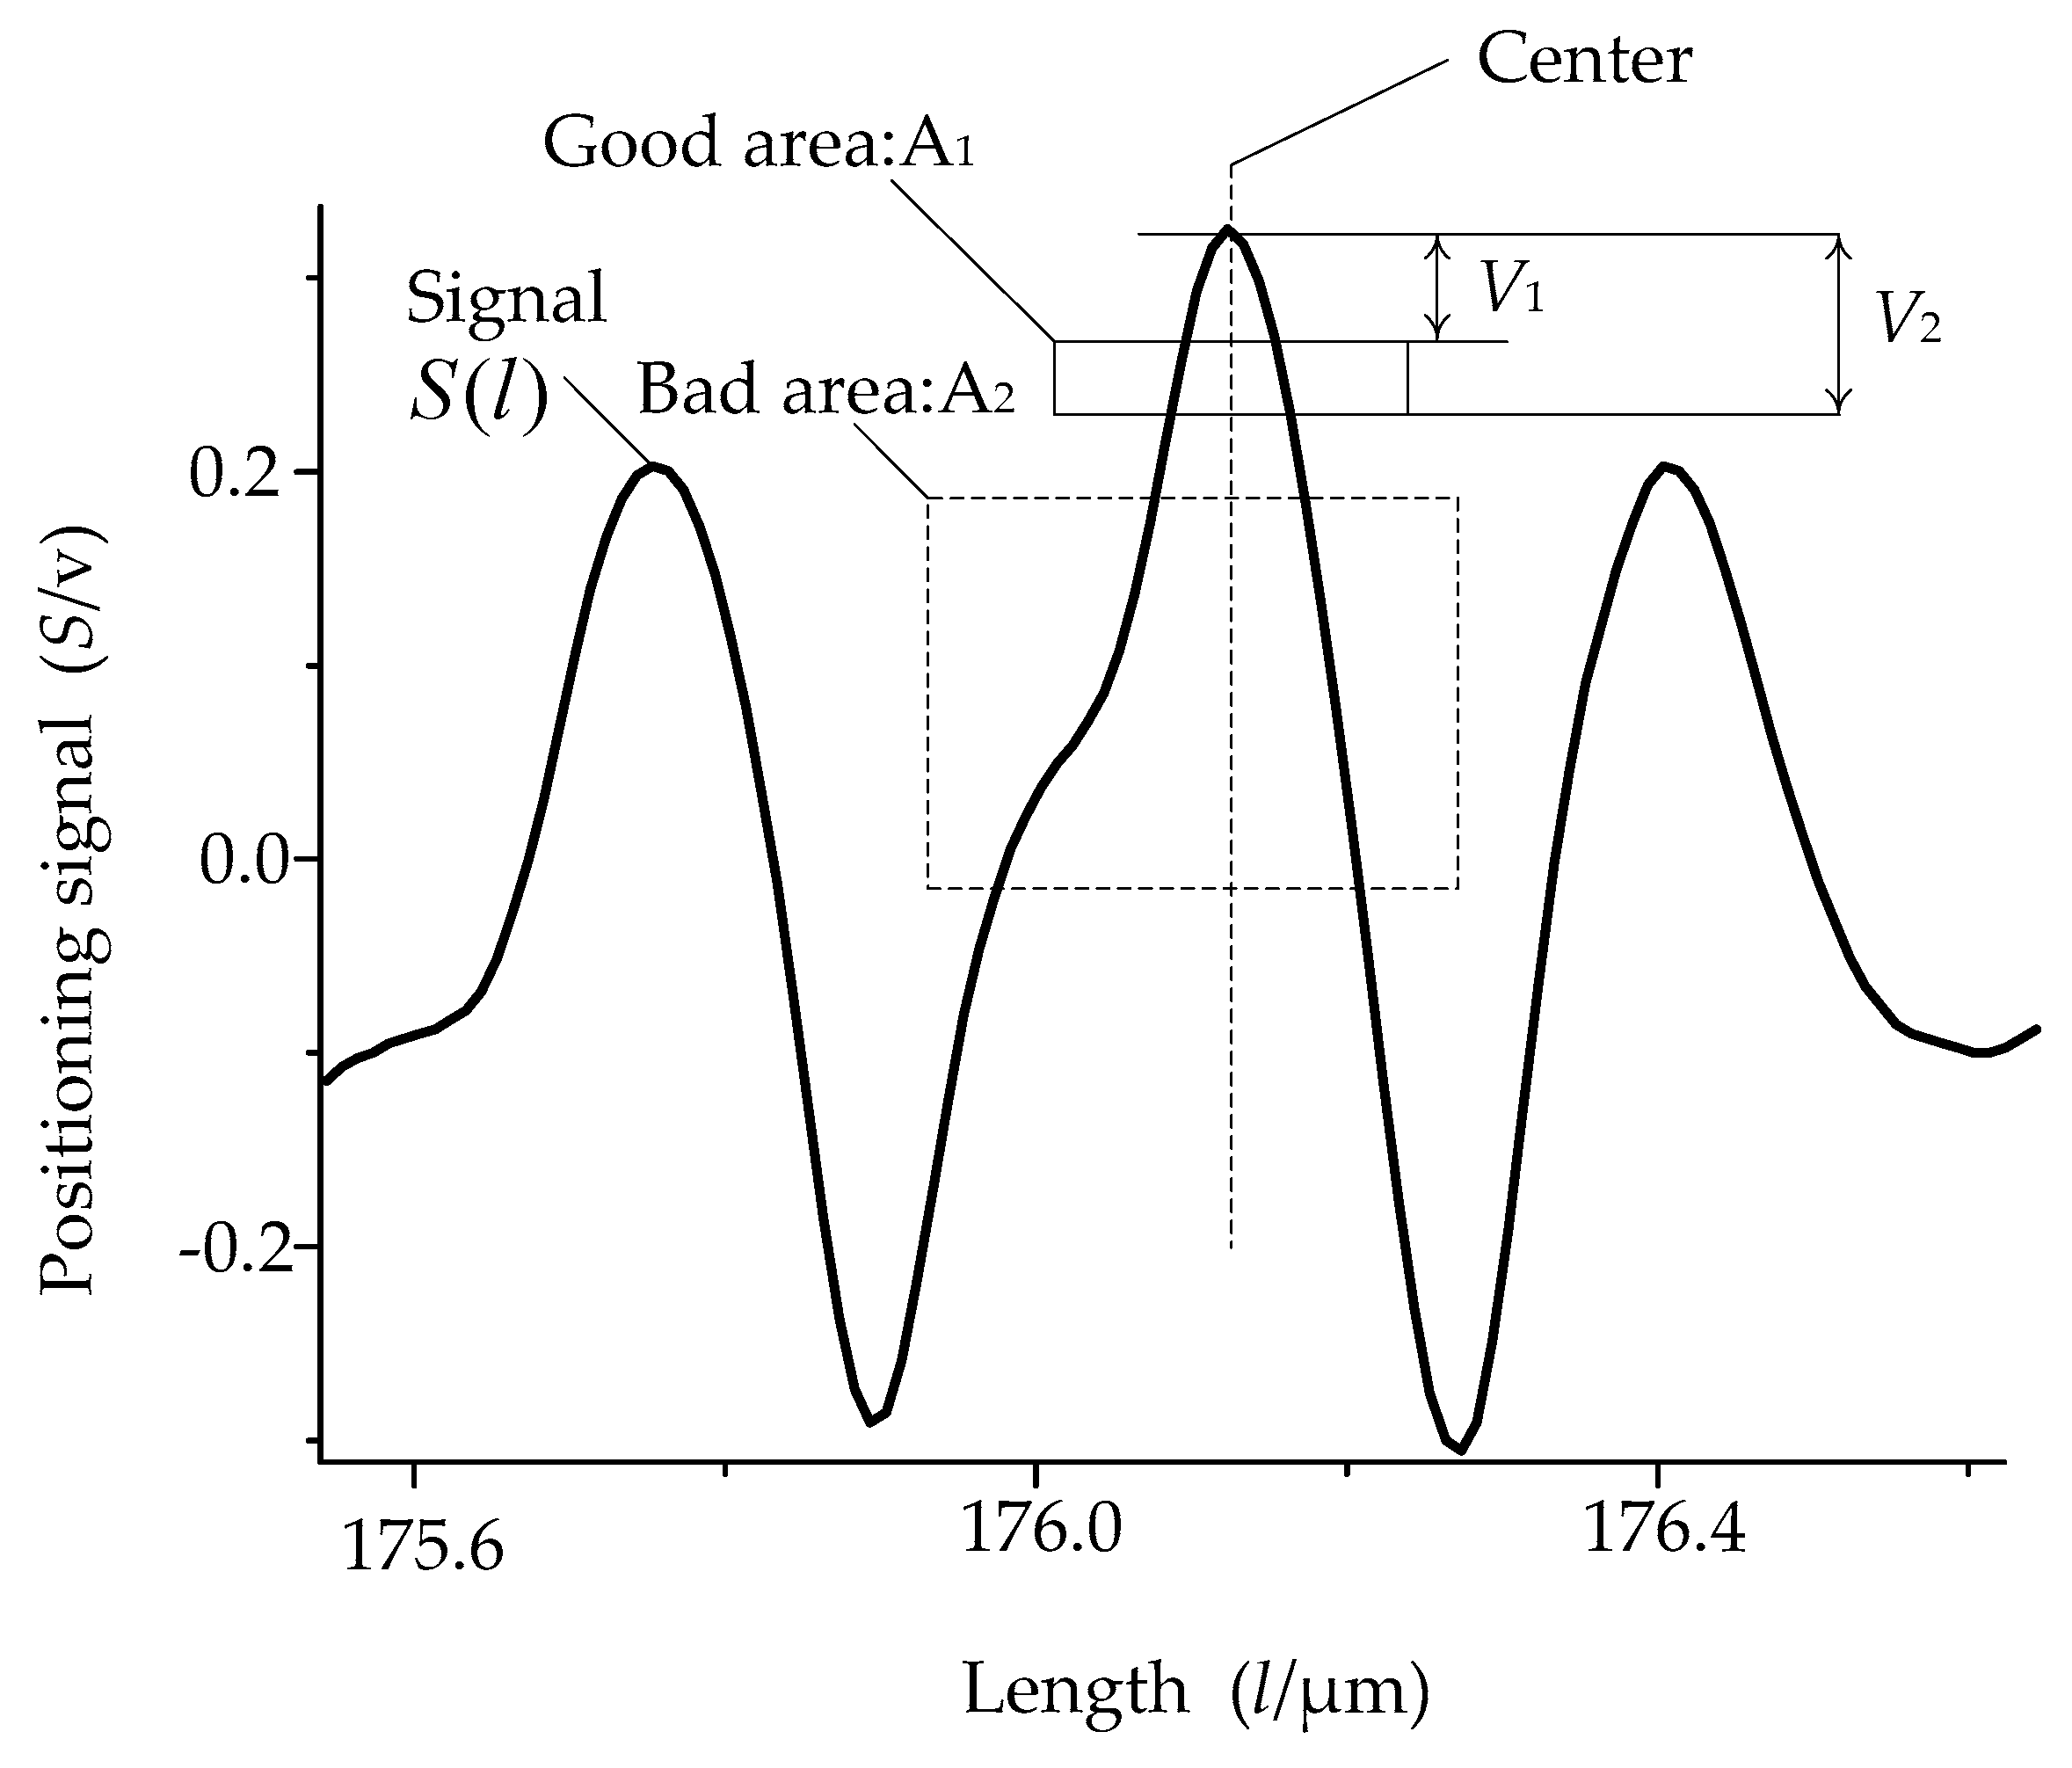
3. Positioning Principle

White light interferometry is used to position the surface. In order to describe the process clearly, it is necessary to give a theoretical introduction about white interference. For single wavelength interference, the interference pattern can be expressed as Equation (1), where γ is the contrast ratio of the interference pattern, I 0 is the background intensity of light, and d is the difference between the measurement surface and the reference surface in the interferometer.
I λ ( d ) = I 0 ( 1 + γ cos 2 π d λ )
The interference pattern of white light is considered as the incoherent superposition of three colors of lights. Assuming that γ and I 0 are the same, the RGB light interference pattern can then be expressed as Equation (2).
{ I λ r ( d ) = I 0 ( 1 + γ cos 2 π d λ r ) I λ g ( d ) = I 0 ( 1 + γ cos 2 π d λ g ) I λ b ( d ) = I 0 ( 1 + γ cos 2 π d λ b )
I ( d ) = I m { 1 + sin c [ 2 ( d d 0 ) λ 2 / Δ λ ) ] cos [ 2 π ( d d 0 ) / λ 0 + ϕ 0 ] }
where I ( d ) is the intensity of white light interference; Im is the maximum intensity of the interference signal; d0 is the position of maximum intensity of interference signal; d is the position of the surface of measured; λ0 is the average wavelength of white light; ϕ0 is the initial phase; and Δ λ is the wavelength range above half intensity of light.
The intensity of white light interference is expressed with Equation (3), which can be derived from Equation (2). From Equations (2) and (3), the interference patterns of three colors of lights and white light are shown in Figure 2, and the white light interference intensity signal is shown in Figure 3. As seen from the curve of Figure 3, a maximum point represents the surface position, i.e., the zero optical path difference position. Then by scanning to find the zero order interference fringe of white light, the position of the surface can be assured rapidly. Figure 3 shows two positioning signals of the 0.1 mm step surface obtained by the white light interference.
In fact, the noise and error are inevitable, and actual white interference signal is shown in Figure 4; the noises and shape defection is obvious by comparison with the theoretical signal shown in Figure 5. The noise and shape defection are the main factors that reduce the positioning repeatability of measurement. How to reduce the error caused by the noise and the defection is to be studied. The basic measure is to enhance the signal to noise ratio of the interference signal by optimizing the system and filtering the signal. For this purpose, the surface is positioned by the combination of laser interference and white light interference, the rough position is obtained by the white light interference signal, and the accurate position is obtained from the laser interference positioning signal.

4. Accuracy Enhancing Methods

Known from experience of the length measurement, as for a small space of 0.1 mm of length, the measurement repeatability component is the main part of measurement uncertainty. Thus, the measurement to improve the measurement repeatability is important. The two aspects of optical and mechanical factors and electronic factors to improve measurement repeatability are mainly studied in this paper.

4.1. Optical and Mechanical Aspects

The relevant errors generated from optical and mechanical parts of the experiment system include the mechanical vibration and the stability of moving table, the quality of optics, and the laser wavelength stability.

4.1.1. Vibration

Among the mechanical error sources, the vibration is a leading factor that affects the repeatability. The vibration isolation is a necessary step that is relatively easy to do. Generally, it is effective to eliminate the vibration coming from outside the system when the measurement system is mounted in a whole on the isolation platform. For the vibration generated from inside the system, it is not easy to eliminate vibration by isolating only. The vibration elimination in this case is studied. Figure 6 is the layout of experiment system.
A kinetic characteristic of the system is expressed by Equation (4).
M φ ¨ + C φ ˙ + K φ = Q
where C is the system damping matrix; K is the system stiffness matrix; Q is the systematic general force matrix; M is the mass matrix; ϕ is the modal coordinates describing the flexible deformation of the system; and ϕ is the first derivative and second derivative of ϕ .
Based on Equation (4), the equation for solving the natural frequency of the system can be obtained as Equation (5).
det ( p 2 I M 1 K ) = 0
where p is the natural frequency of the system and I is the unit matrix.
As seen from Equation (5), the natural frequency of the system is determined by the mass matrix M and the stiffness matrix K. M and K are related to the structural and motion parameters of the system, respectively. For structural parameters, if the height of the light beam (the height of step mounting) is decreased, the stiffness of the system will increase, and the same goes for natural frequency of the corresponding system. The repeatability experimental results confirmed that when the height of step mounting was decreased from 50 mm to 30 mm, the repeatability was better than 20 nm. For motion parameters, the moving speed V is one of the adjustable parameters to obtain the better signal. The experiment result showed that when the moving speed V was 50 μm/s, the best signal was obtained. The positioning signal at different moving speeds is presented in Figure 7, Figure 8 and Figure 9. In the case of a relative lower speed at 30 μm/s, it was easy to be affected by different frequencies of vibration. In case of a relative higher speed at 80 μm/s, although the signal SNR was good, the symmetrical characteristics of the signal were poor, which also affected the signal to reduce the positioning repeatability.
The moving stability of table is another factor to affect repeatability. Figure 10 shows the length interference signals of different motion tables. Automatic interference comparator (AIC) is a specialized length measurement with a high precision. The uniformity and smoothness of the interference signal are very good because the motion slide is driven by hydraulics [6,7]. The vibration from the driven unit is negligible. The motion driven part used in this paper is a step motor, and the vibration from the motor is inevitable. Then, if the driven mode changes, the uniformity and smoothness of the motion will be improved. Estimating from the measurement experience of AIC, at least 5 nm of repeatability will be reduced.

4.1.2. Laser Wavelength

The laser wavelength is an important parameter for length measurement with a high precision. In order to ensure the length measurement accuracy, the length measurement system should use the frequency stabilized laser. Furthermore, the interference system should be placed in vacuum environment for length measurement with nanometer precision [8,9,10,11]. The experiment measurement repeatability was affected by laser wavelength stability. Both an ordinary semiconductor laser and HP5517 frequency stabilized laser as input light sources were experienced, respectively. The results show that the measurement repeatability was better than 5 nm when using the HP5517 frequency stabilized laser. The wavelength of the semiconductor laser was monitored by the laser wavelength meter with a precision of 2 × 10‒8. The result is shown in Figure 11 that there was about a maximum of 0.06 nm variation for about 40 min of continuously monitoring. It was indicated that for the average wavelength of 634.286 nm, the correspondent relative variation was 9 × 10‒5, and for about 15 min of repeatability measurement, the relative variation of the wavelength was 4 × 10‒5. For the length of 0.1 mm, the correspondent variation was about 4 nm. Analytical results are consistent with the experiment results.

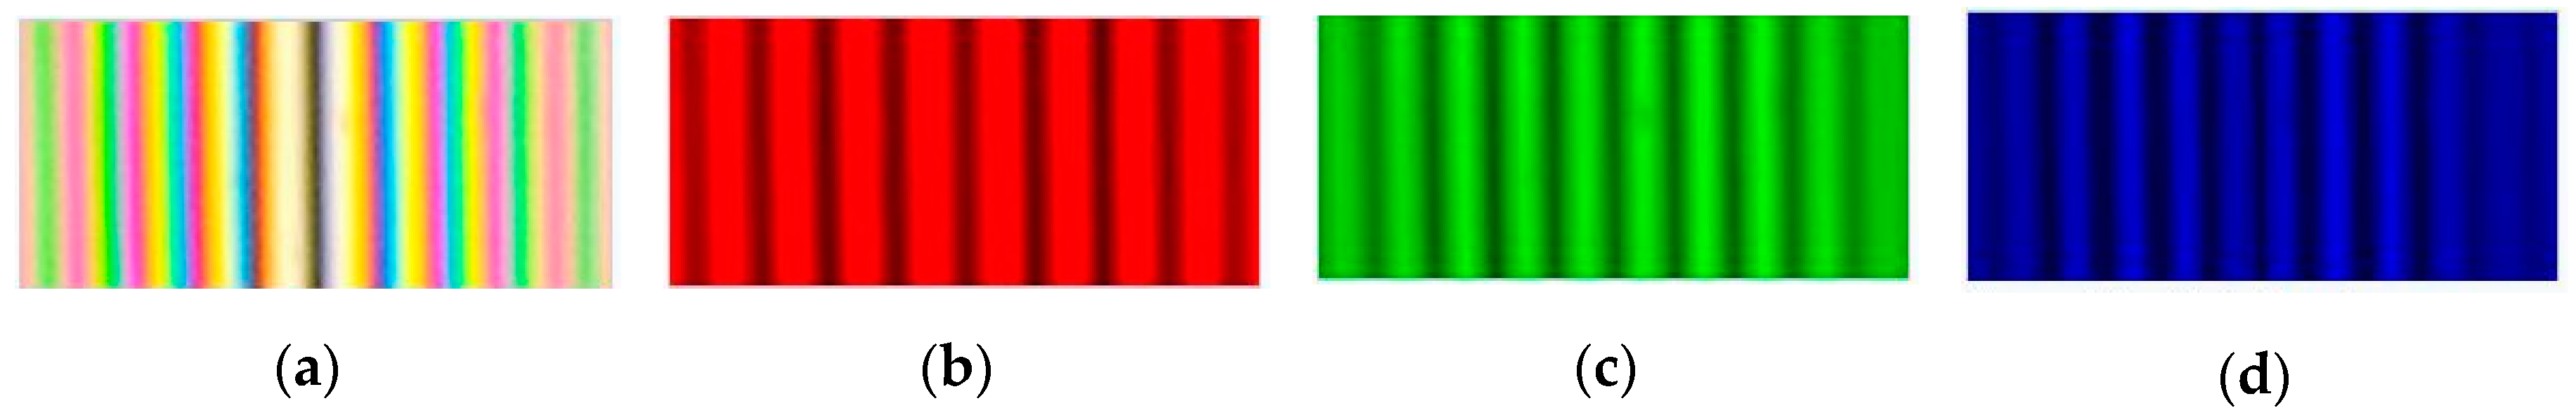
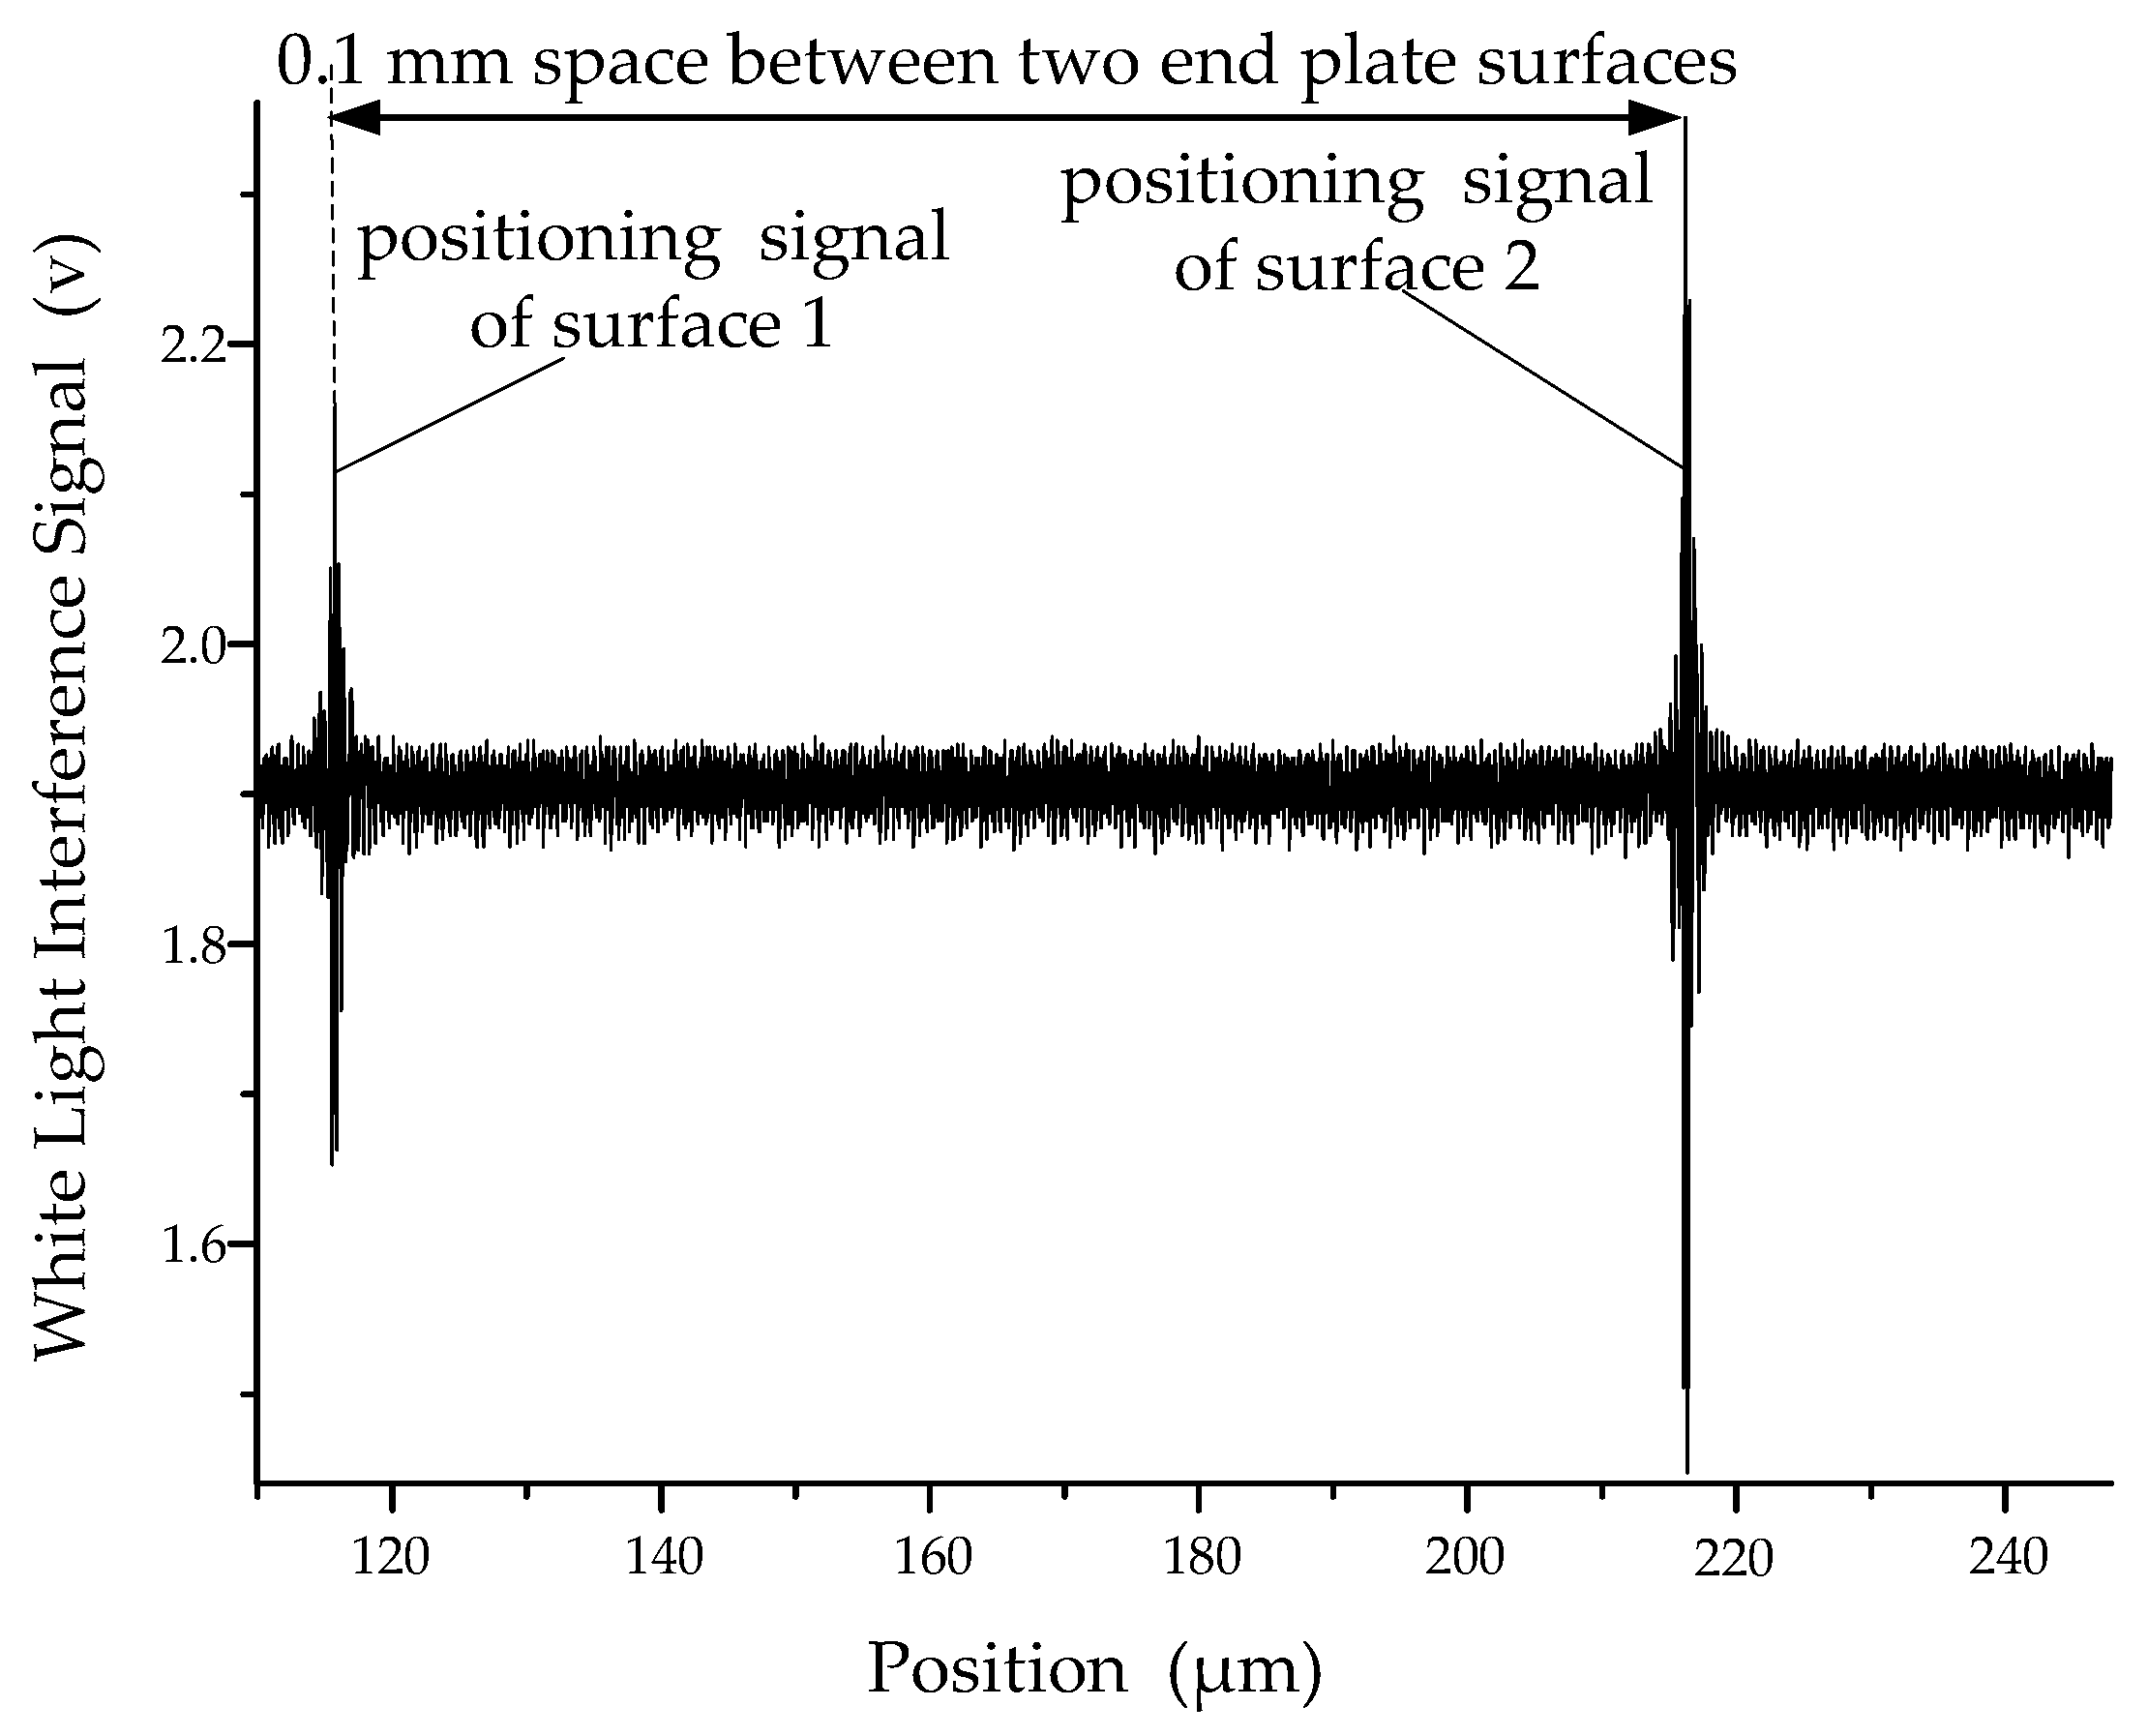
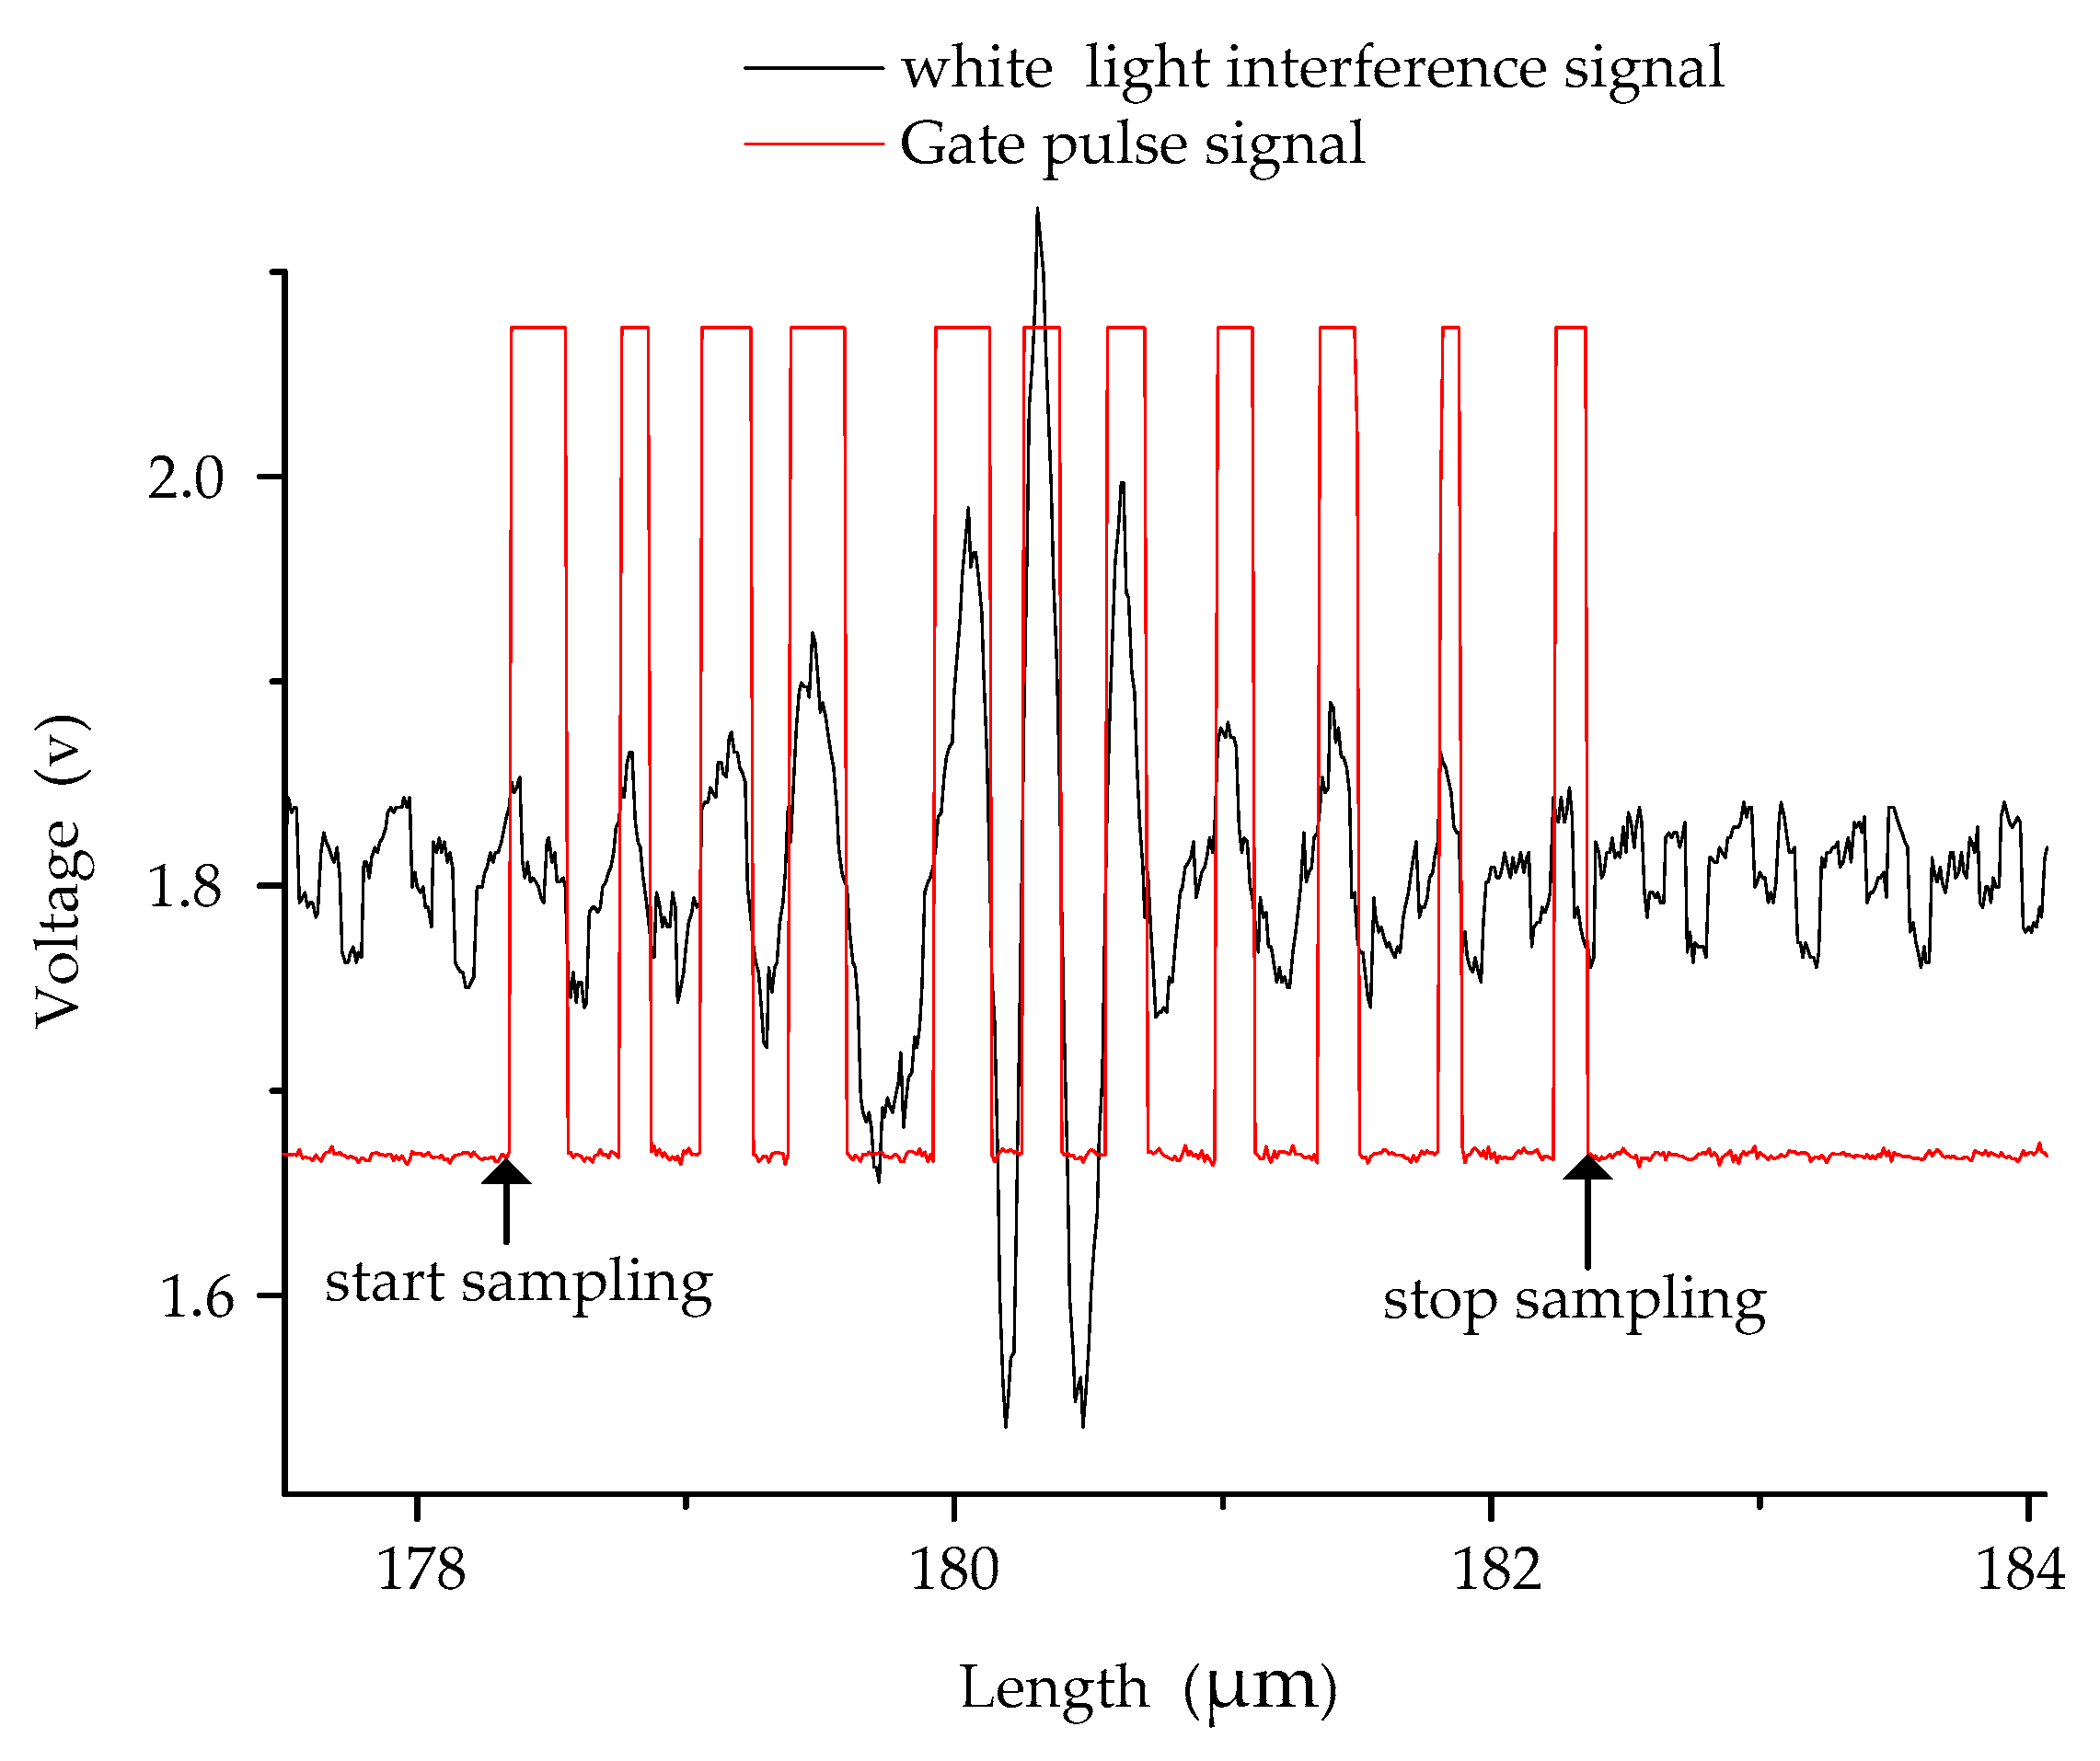
4.1.3. Combination of Laser Interference and White Light Interference

As described in Section 3, the laser interference and white light interference have respective advantages. The white light interference has surface positioning advantages for its incoherence and the laser interference has a good interference fringe because of its good coherence. The combination of two ways of interference has advantages for improving measurement results. The signal obtained by the combination of two ways of interference is shown in Figure 12.
The signal center of zero-order interference fringes of white light represents the position of surface. It is easy to ensure the rough position by processing the white light interference signal first. Then according to the rough position obtained from white light interference signal, accurate position is further calculated from the laser interference signal. The processing method for signal is critical to obtaining good repeatability. The methods include center strategy, the signal filtering, etc., which will be described in the following section.

4.2. Signal Processing System

Signal processing system is also import for measurement repeatability. As seem in Figure 13, the feature of the system has both manual and automatic signal processing functions in the soft layer of the system. Every unit realizes its corresponding function. Among them, signal shaping is the basic function causing the trigging signal for synchronous sampling. Its working principle is shown in Figure 14. The white light interference fringes generate a group of pulse outputs. The rising edge of first pulse is used to start signal sampling, and the falling edge of the last pulse is used to stop signal sampling. The signal processing methods are also critical to obtain good measurement repeatability. The signal processing methods include signal smooth filtering, the positioning strategy, bidirectional measurement, and averaging the multiple measurement results, etc.

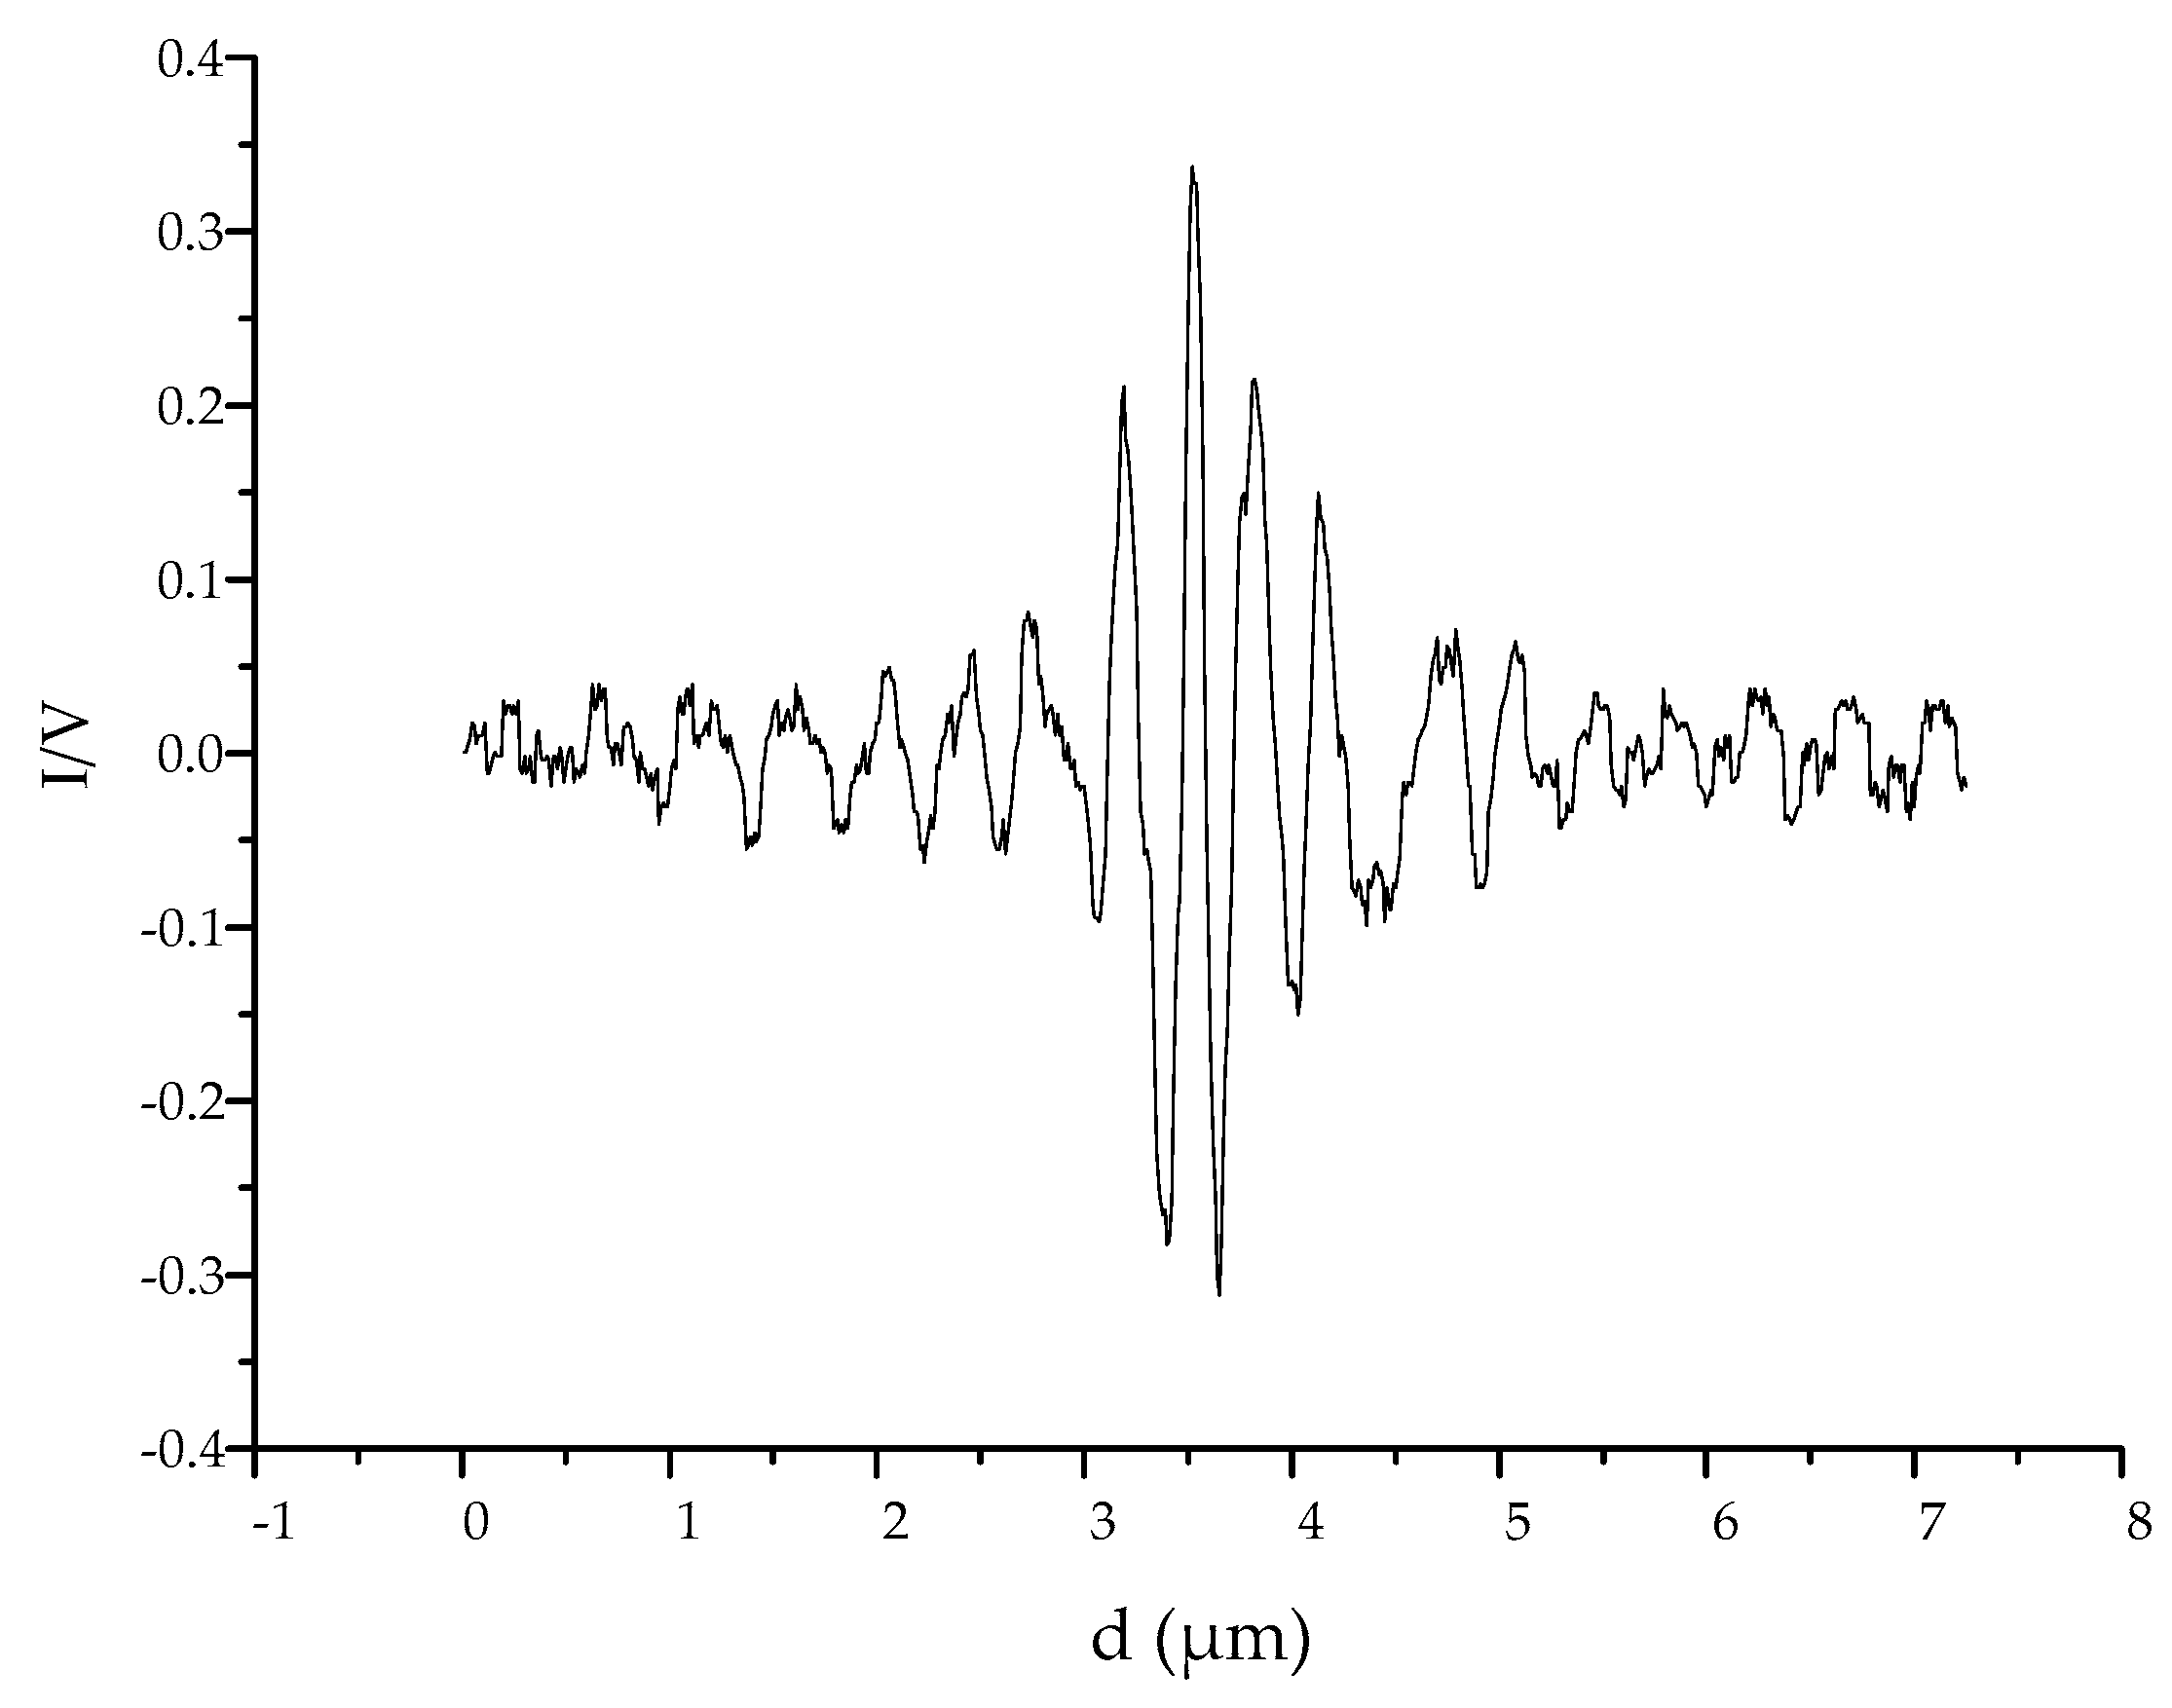
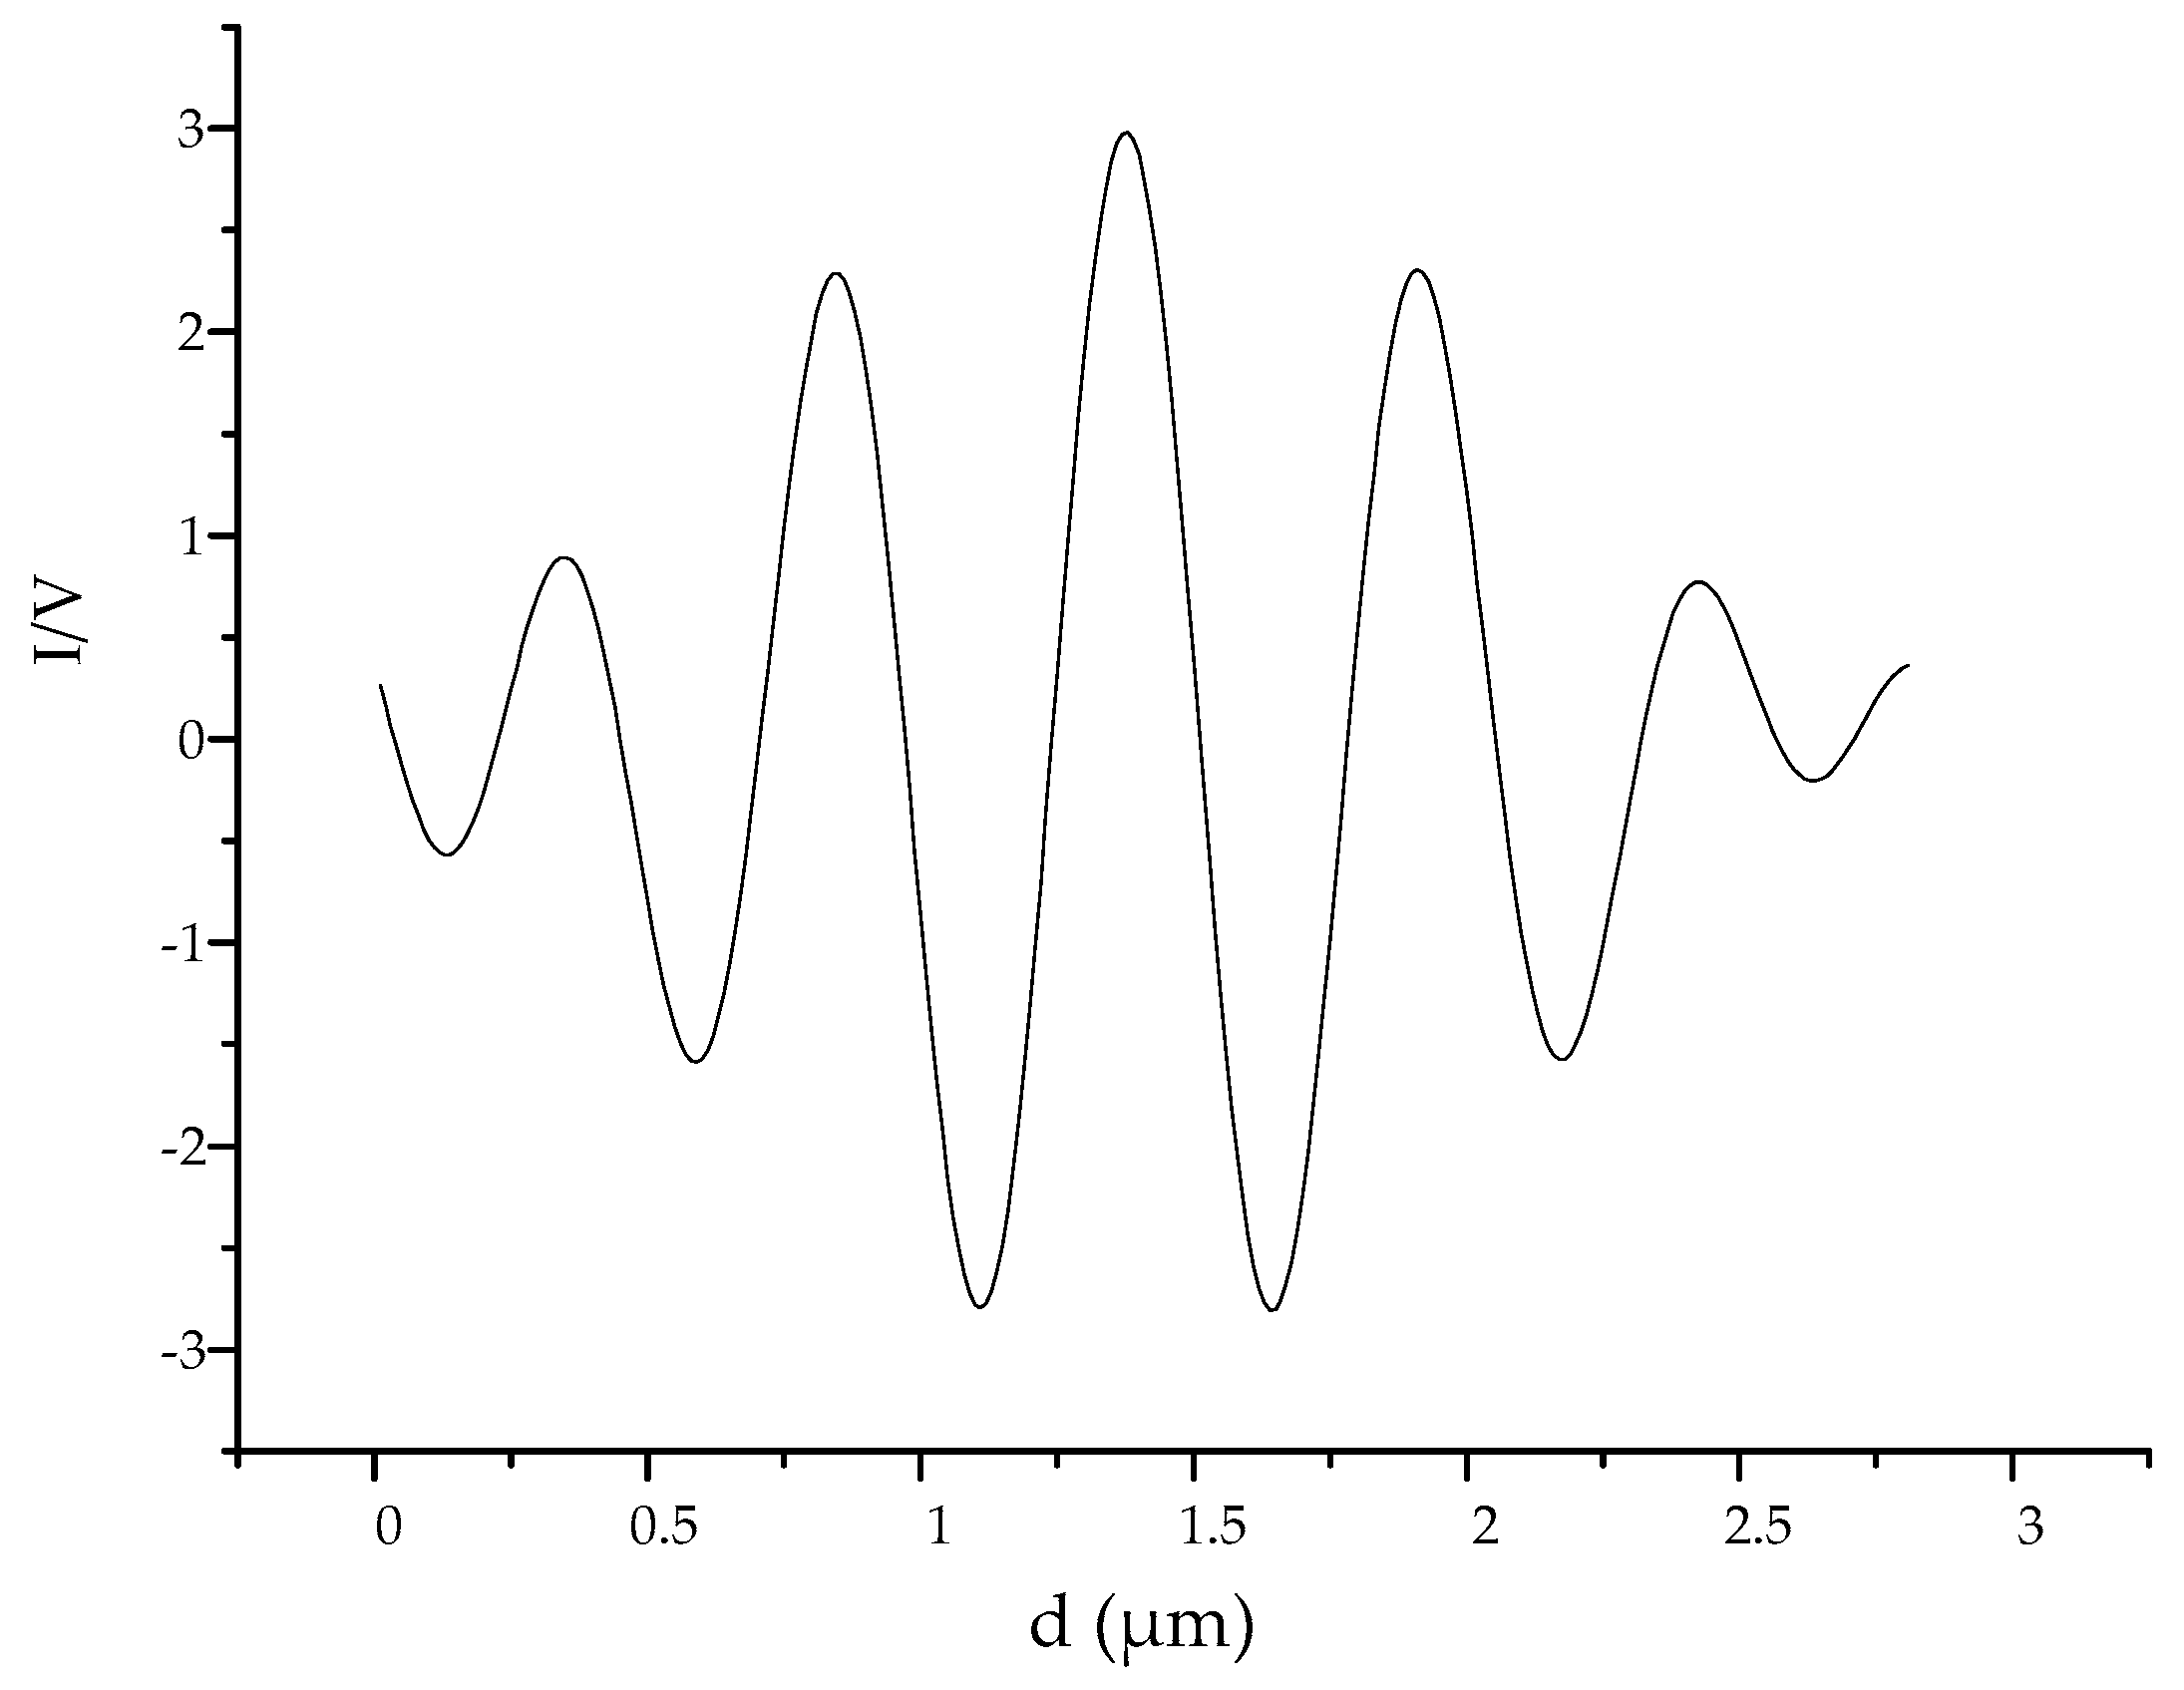
4.2.1. Signal Processing Methods
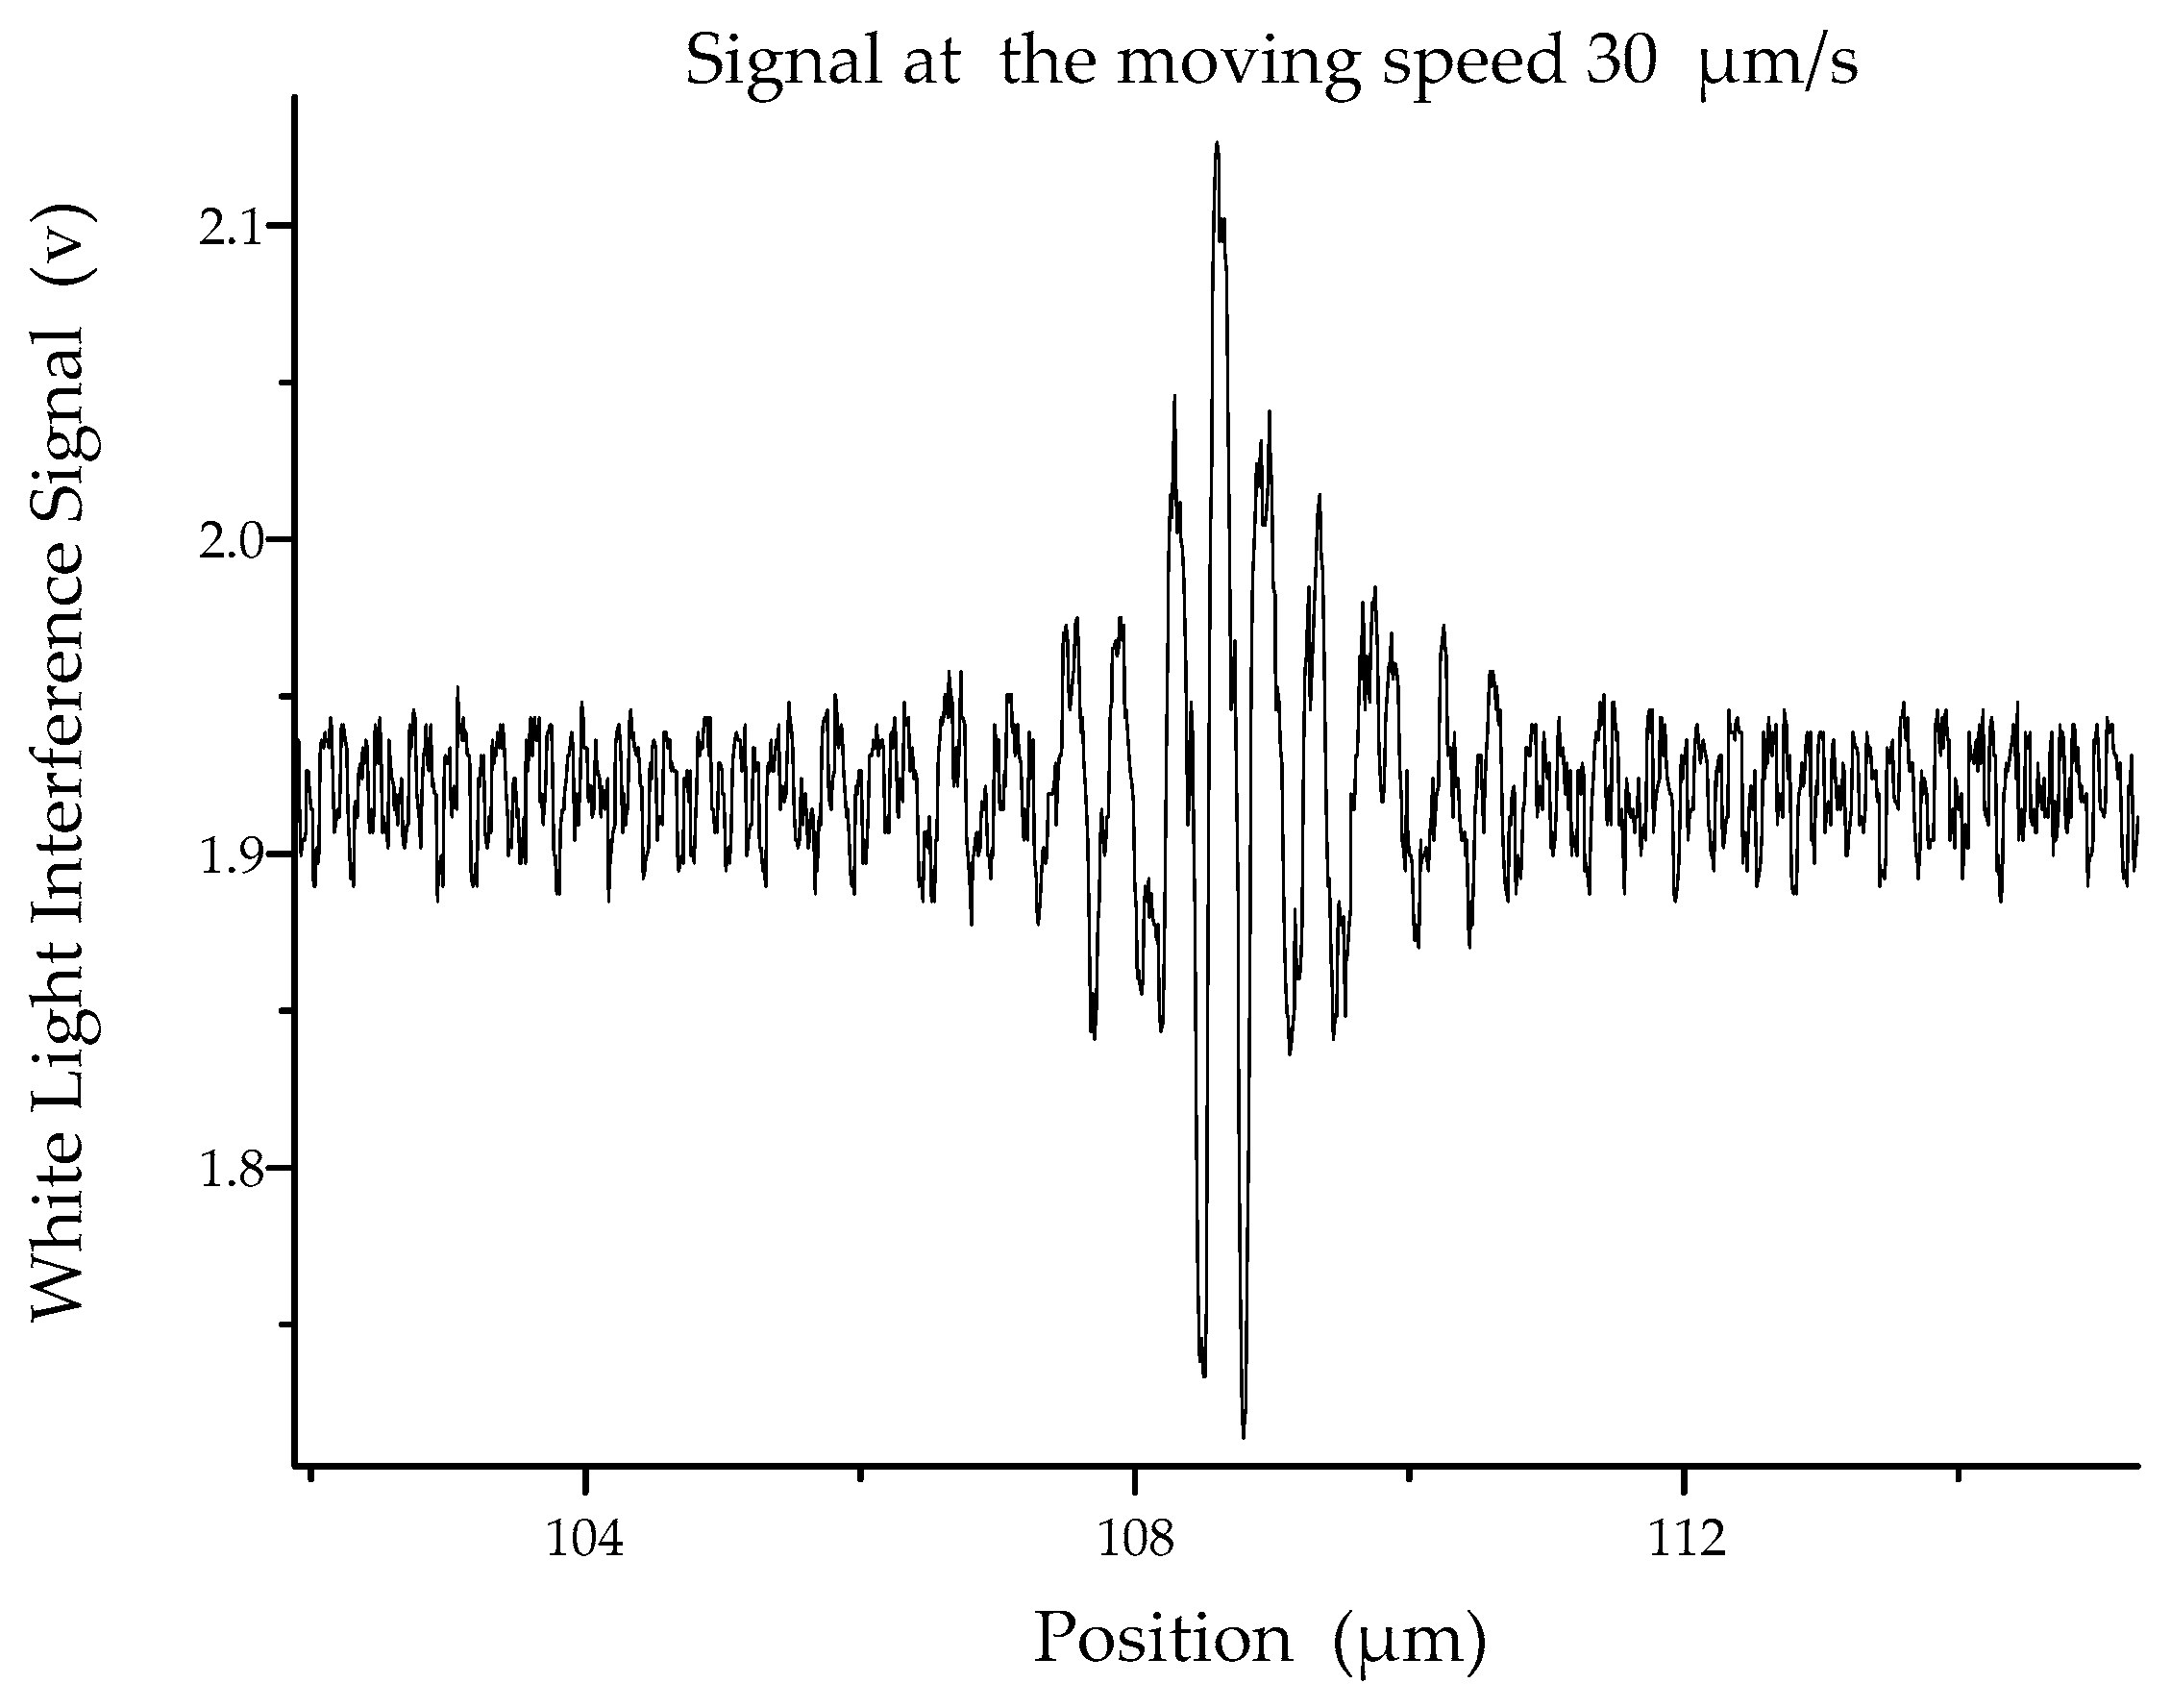
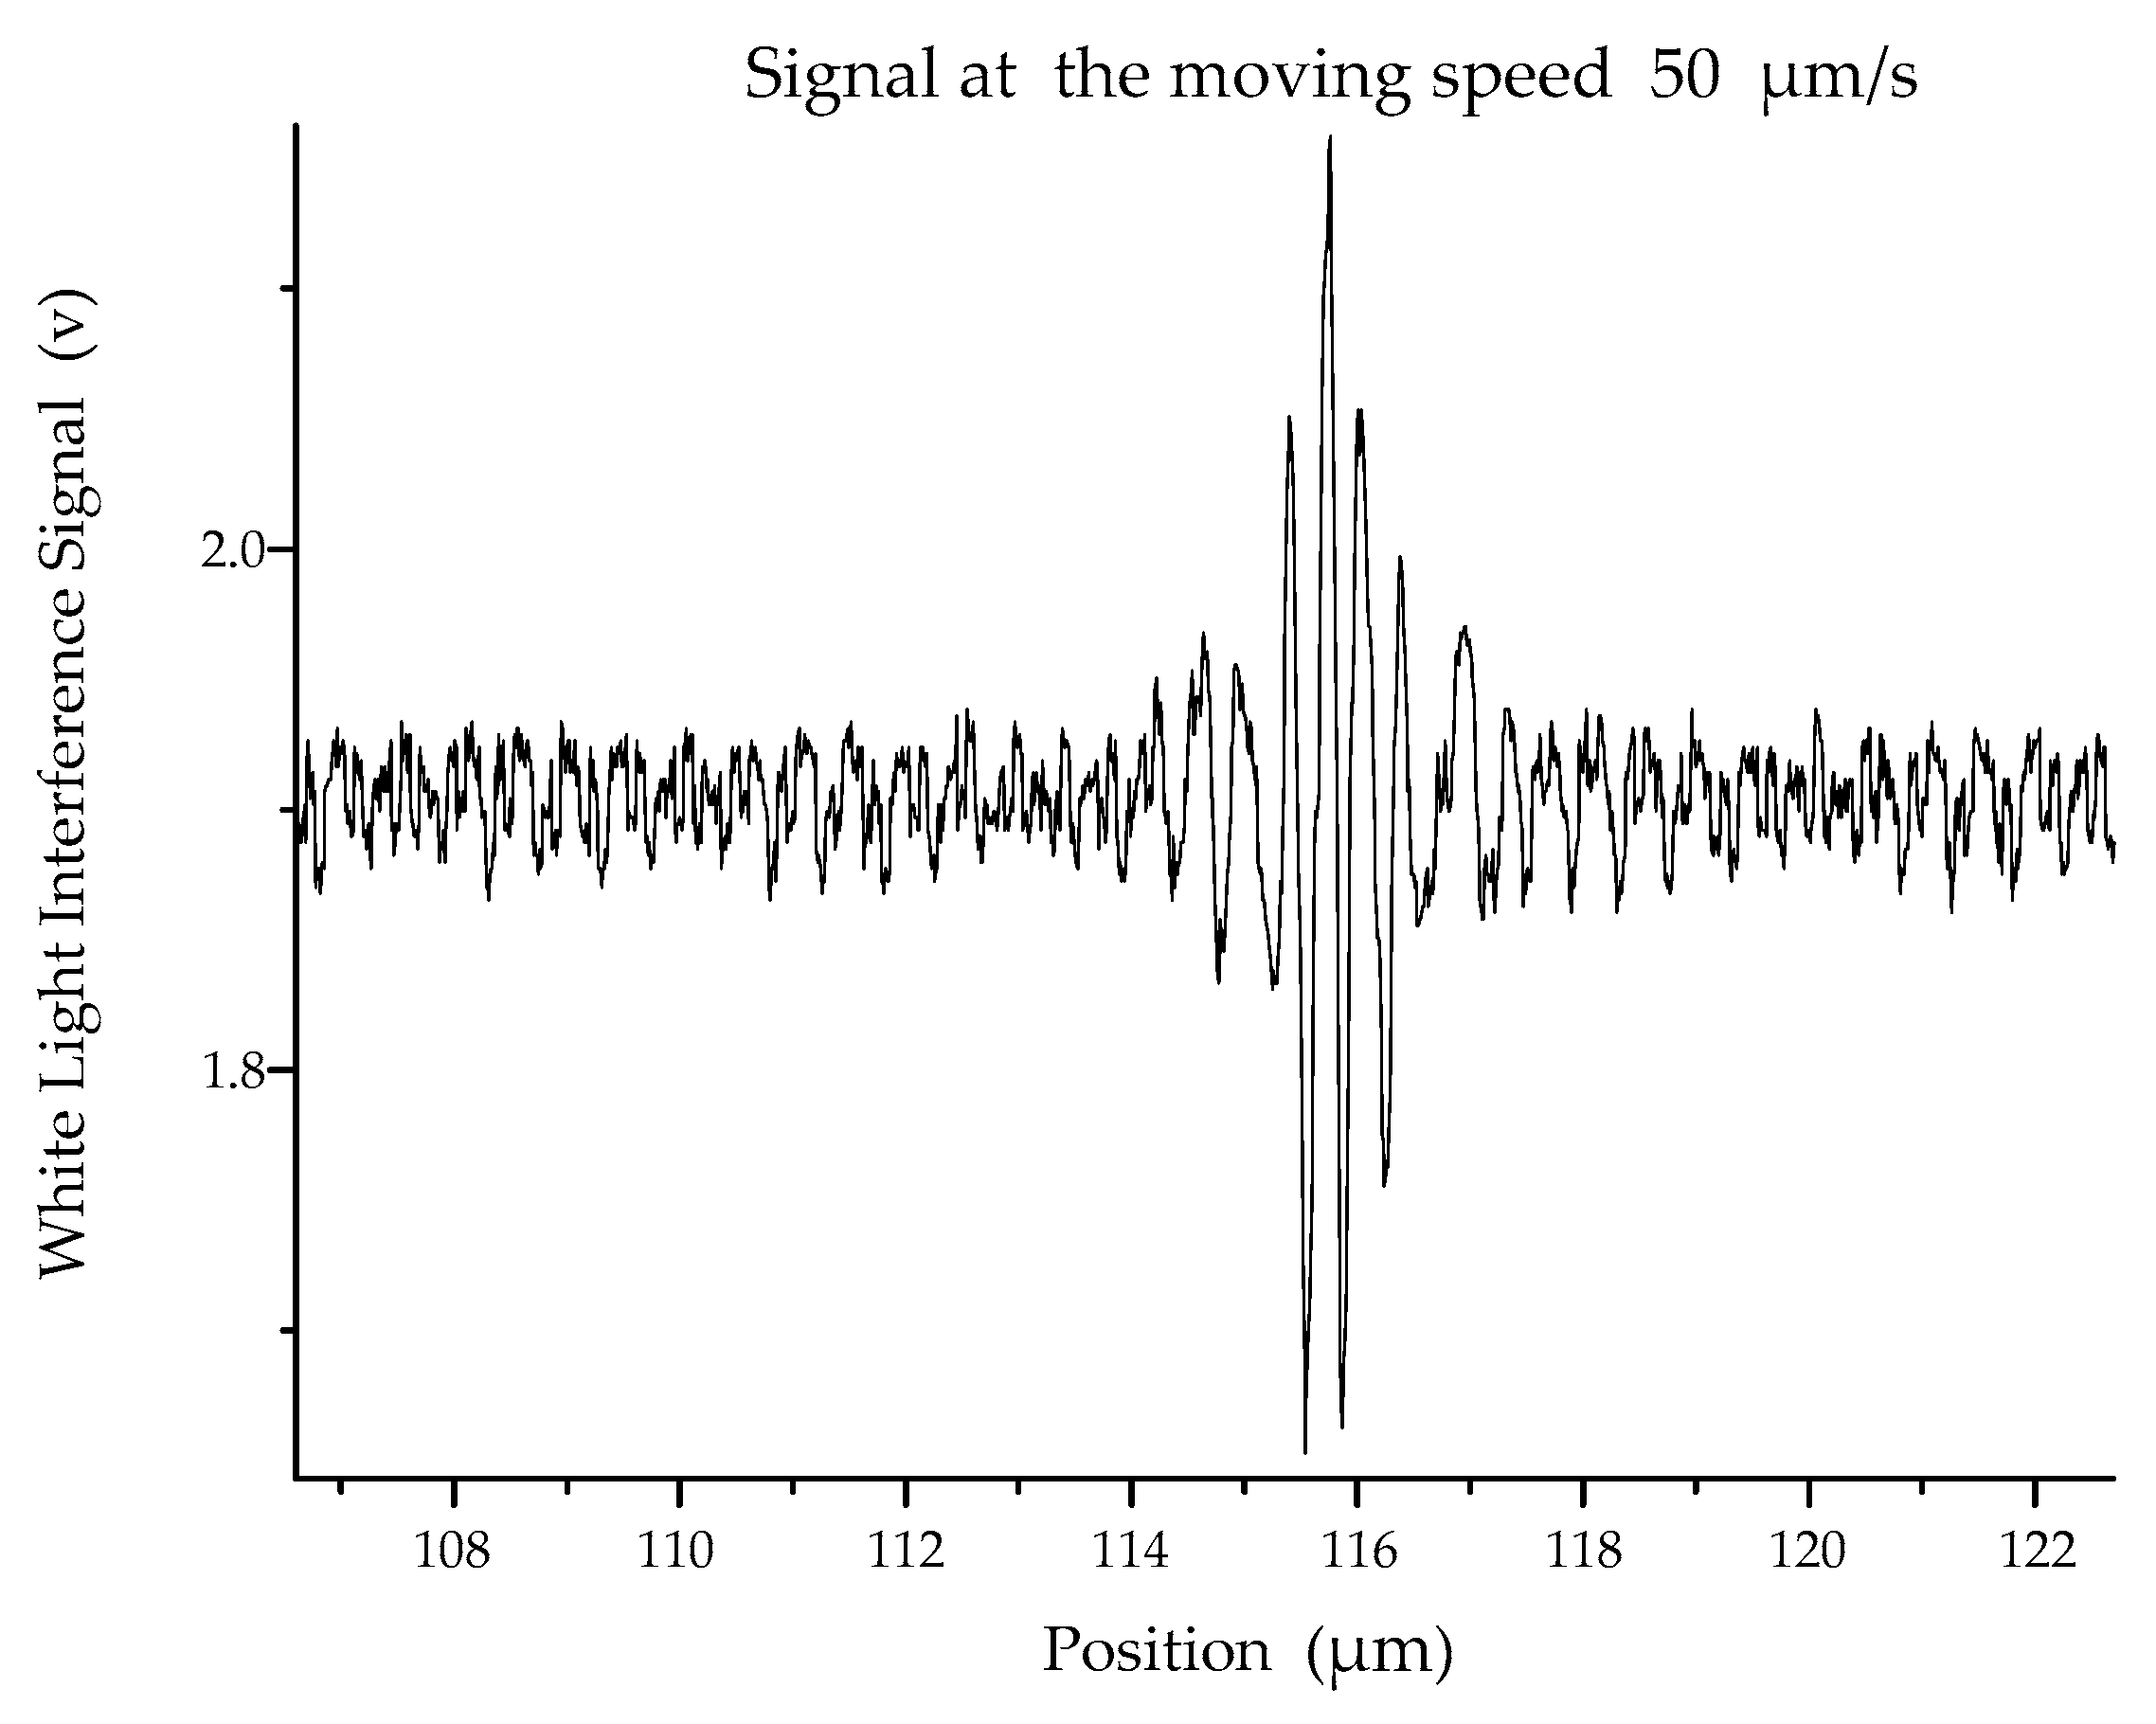
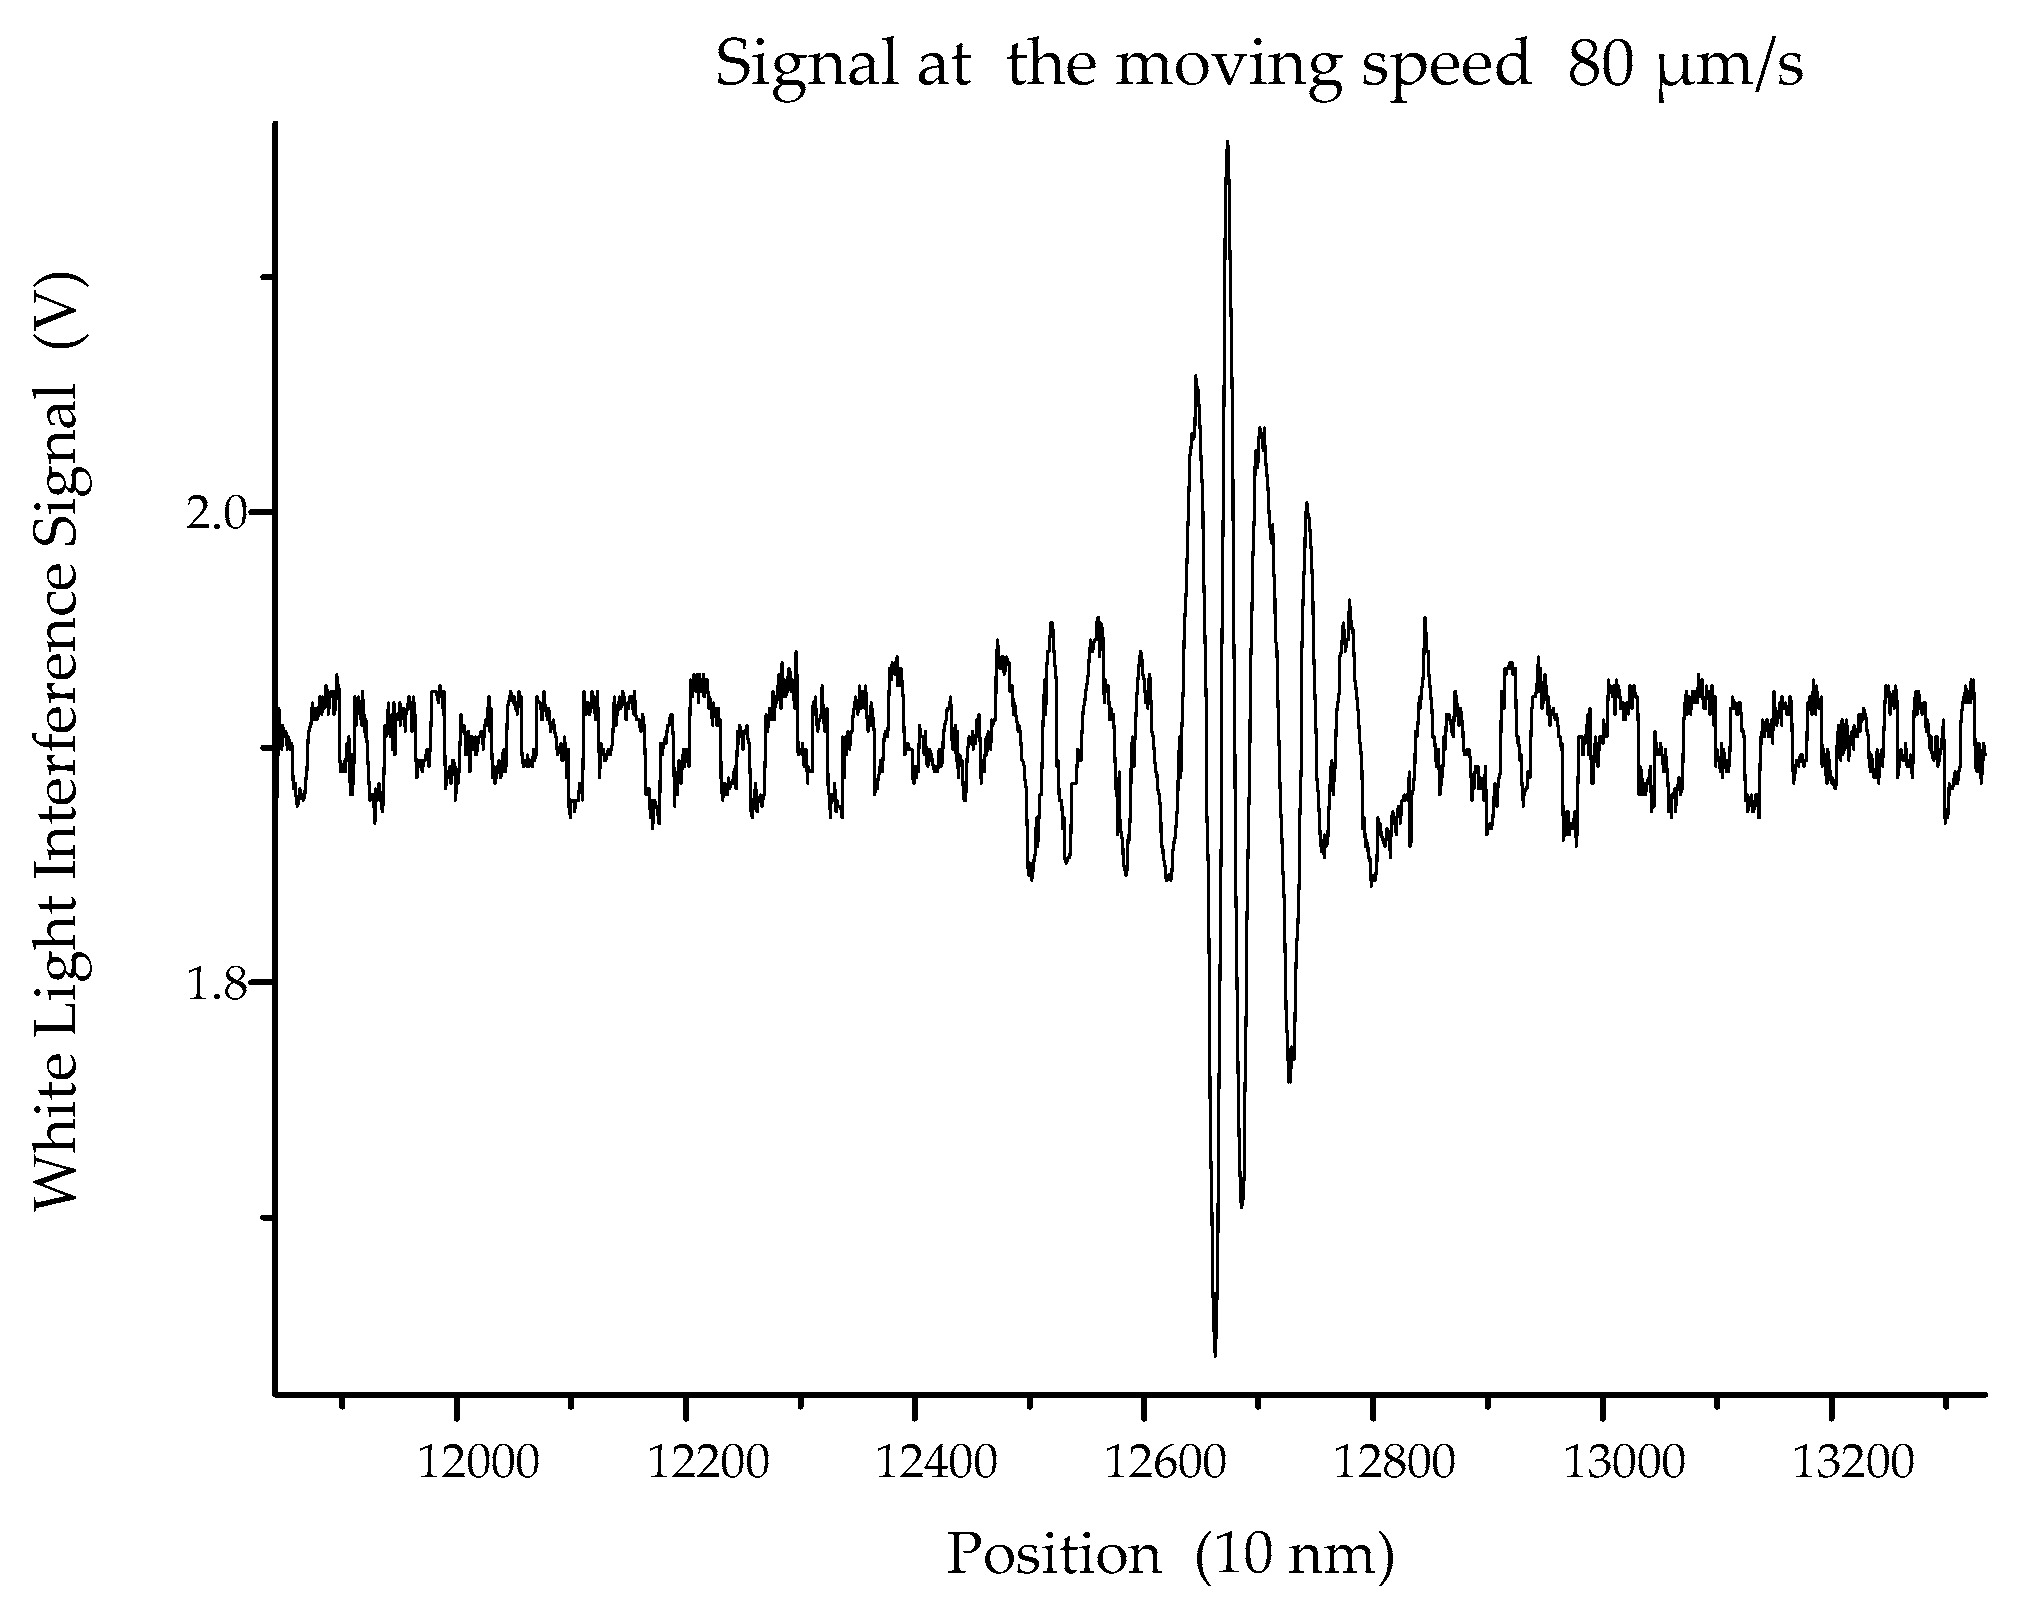
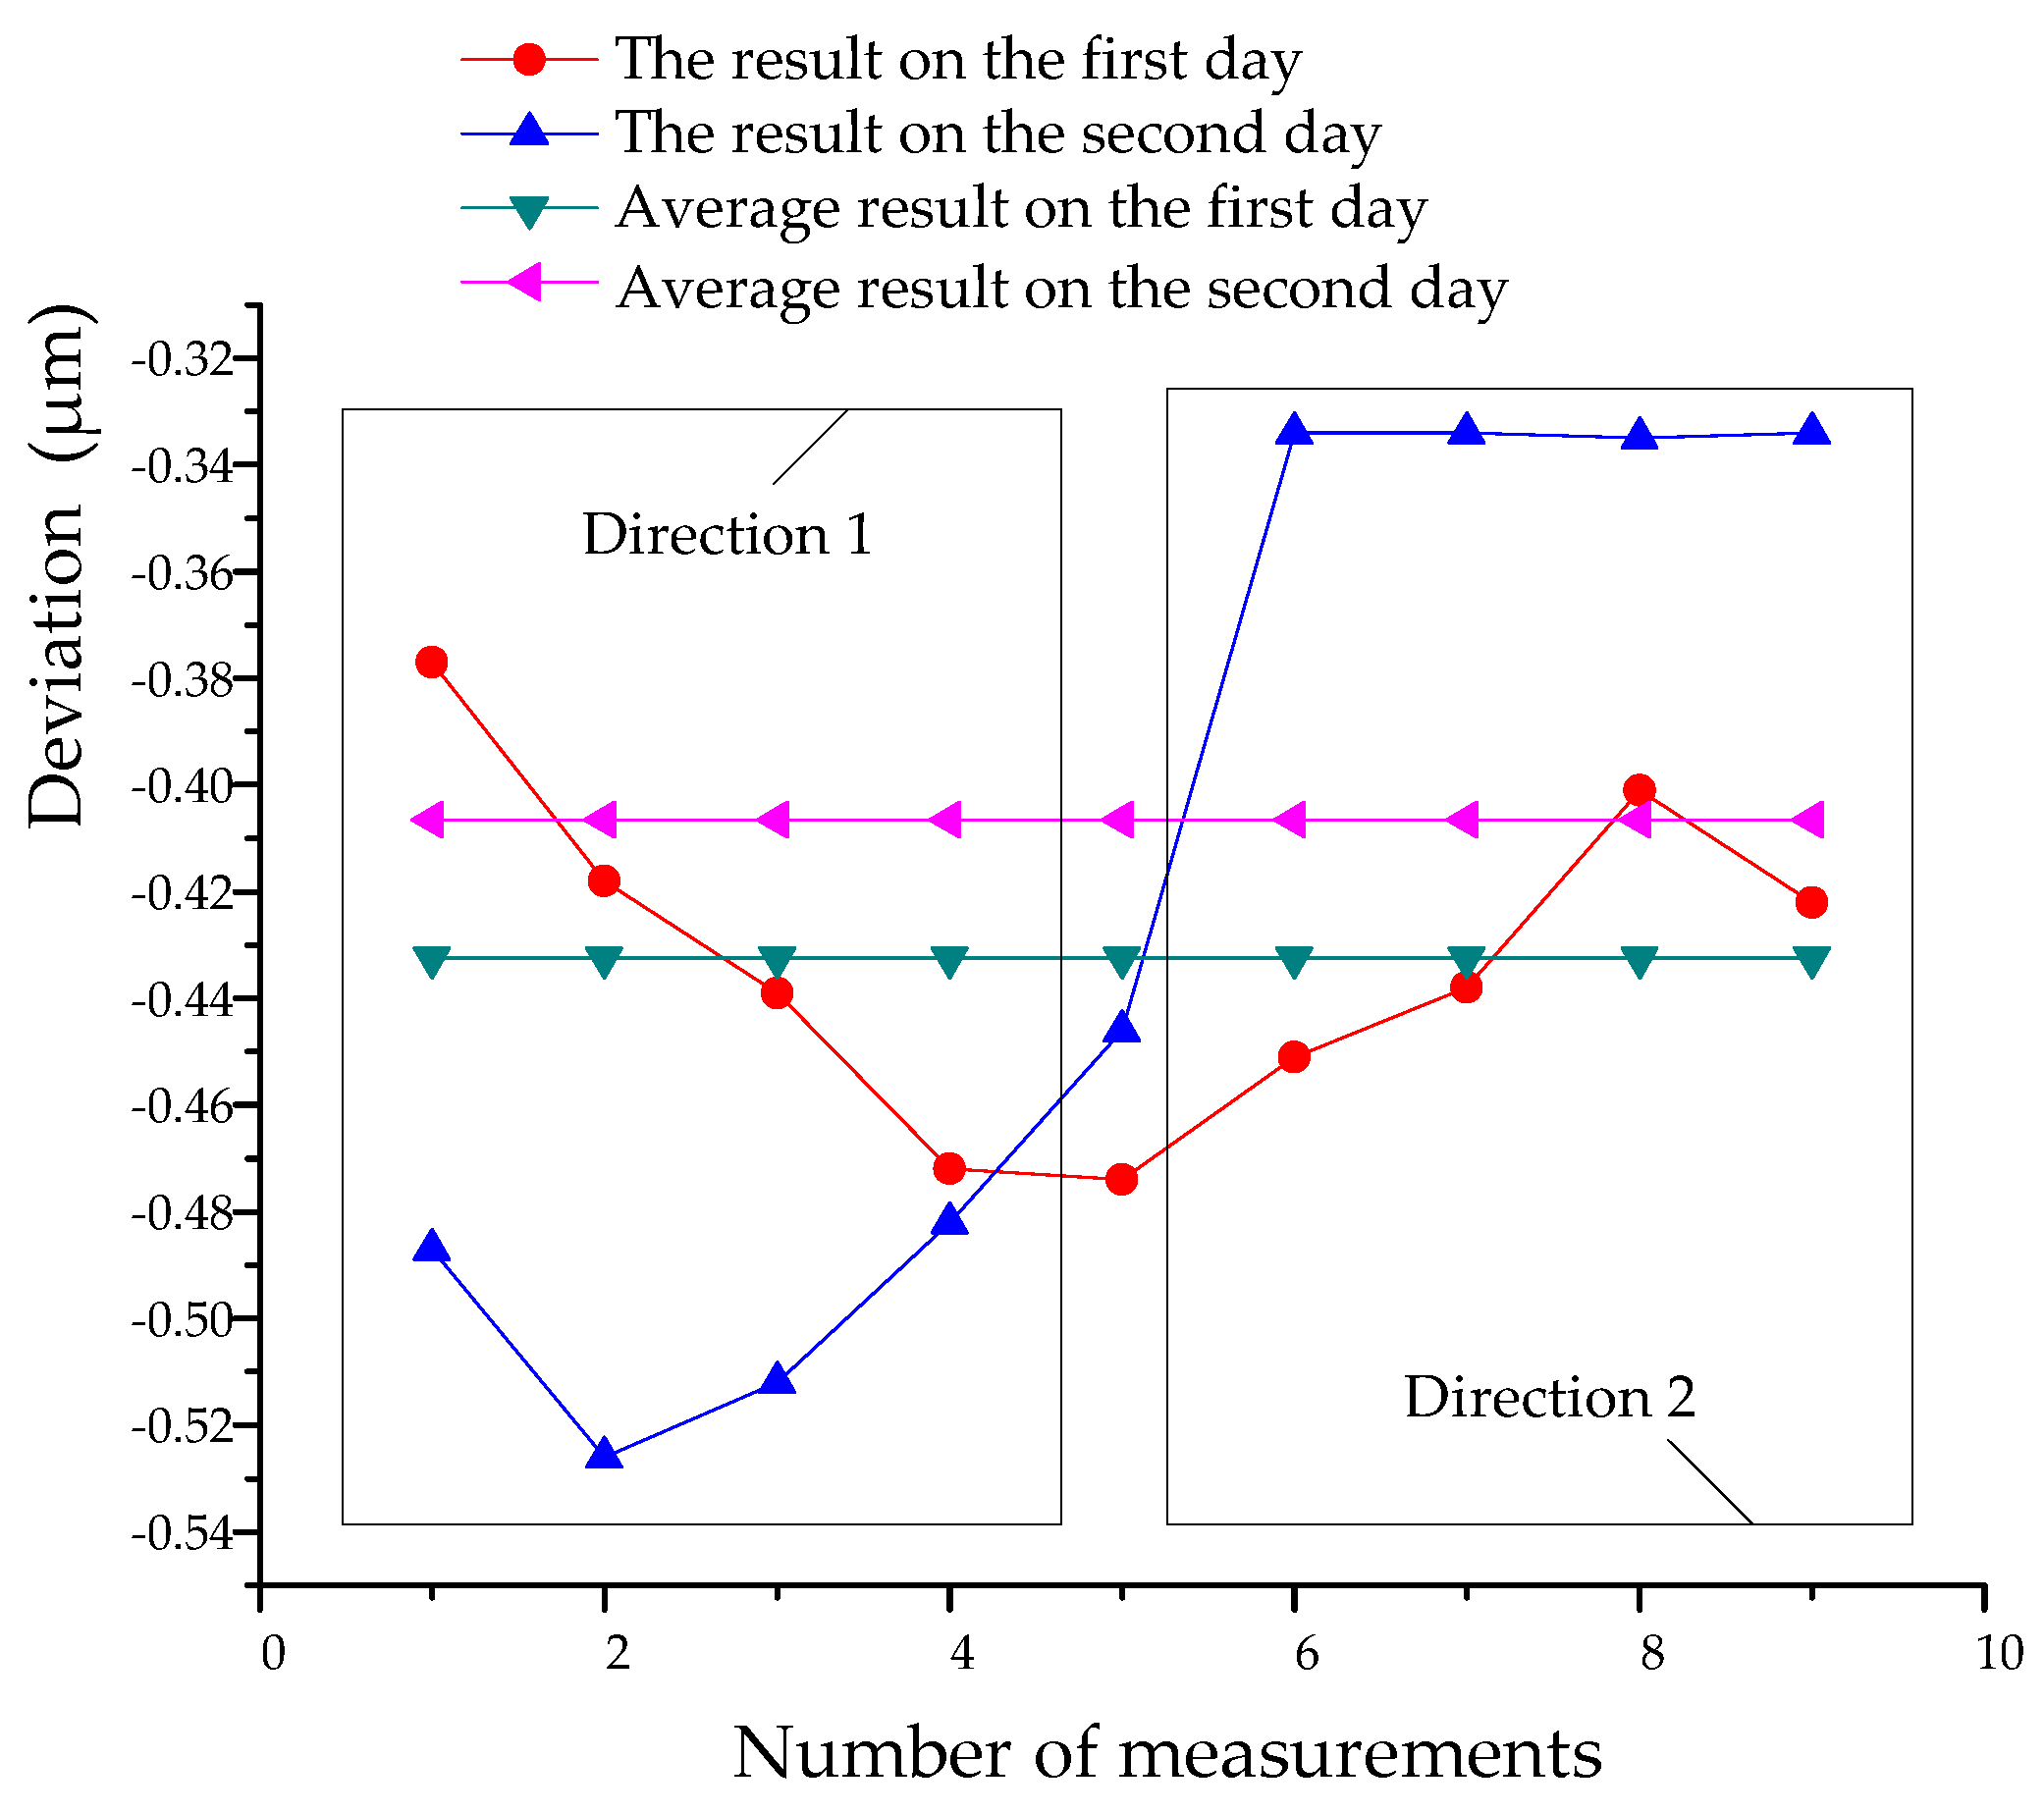
The center of the zero-order fringe in white light interference means the position of the surface. The methods to obtain the center from the positioning signal are studied. There are many kinds of methods for line scale signal processing. Generally, they are classified as two classes. One is determined by a few points to the left and right edges of the signal [12], and the other is determined by multiple points to the left and right edges of the line scale signal [13]. Since the positioning signal of the surface is familiar to the positioning signal of the line scale, the signal processing method used for line scale is suitable for surface positioning. Due to the advantage of reliability, the multiple point method was adopted in this paper. For the multiple point method, one important step is to ensure the section of signal for processing in an appropriate section, beneficial to enhance the positioning accuracy Figure 15 and Figure 16 show the positioning signal of the first and second surface of the step tested, respectively. The section of signal to be processed was the rectangular area below the peak of signal, determined by the value V1 and V2. As showed in Figure 16, when V1 and V2 were appropriate, the area A1 was a good area, and when V1 and V2 were not appropriate, the area was the bad area A2. In the case of A1, the computed result was accurate to the center, while in the case of A2, the computed result was left to the center, causing the positioning error. In fact, there are many cases that were worse than the case of A2, so the parameters V1 and V2 should be automatically adjusted to fit different poor positioning signals. Furthermore, for more complex cases, when it is difficult to select automatically, the processing section should be decided by the system operator. After confirming the processing section of signal, the result is automatically computed as Equation (6).
C ( l ) = l 1 l 2 s ( l ) l d l l 1 l 2 s ( l ) d l
where l is the length; C(l) is the center computed; l1 is the length l when s(l) is V1; and l12 is the length l when s(l) is V2.
Considering the importance of the values V1 and V2, the measurement repeatability affected with value V1 and V2 were also done. The experiment result was that if the signal was good in uniformity, the optimal values of V1 and V2 were 20% and 40% of the peak-to-peak value, respectively. However, if the signal was bad in uniformity, the suitable value of V1 and V2 were those as close as possible to the peak value of the signals.

4.2.2. Measurements

Besides the signal processing methods, the bidirectional measurement and averaging multiple measurement were adopted. The measurement experiment for the same step in two measurement directions was done in two days. In Figure 17, it is obvious that when the measurement direction was different, the result was relatively changed. On the first day, the measurement results were unsymmetrical to the direction in an approximate stair shape. On the second day, the measurement result was symmetrical to the direction in an approximate triangle shape. A system error was coupled into the measurement result, and it was changed with the time and the measurement direction. If there was no averaging, the measurement result difference was divergent and the maximum different was more than 0.7 μm. If averaging, the final result was convergent, and the difference was less than 0.03 μm.

5. Measurement Uncertainty Evaluation

Acquiring optimal measurement uncertainty is the target of a measurement system. In this paper, the methods to decrease every possible error were the emphasis. Limited by the experiment condition and hardware of the system, the measurement uncertainty was a few tens of nanometers, obtained by estimation. The analysis on measurement uncertainty of the system is given in this section.
Firstly, the mathematical model is given in Equation (7):
l = N λ 0 2 n ( p , t a i r , f ) + α L ( 20 t s ) + δ l d i f + δ l A b b e + δ h + δ l cos
where λ0 is vacuum wavelength of laser, n(p, tair, f) is air refractive index obtained by Edlen’s formula (1998 Version), p is air pressure, f is air humidity, tair is air temperature, a is the linear thermal expansion coefficient, ts is the material temperature, δldif is the correction for the laser beam diffraction, δlAbbe is the correction for the Abbe error, δh is the correction for the flatness derivative of the step, and δlcos is the correction for the cosine error.
In Equation (7), δldif is expressed as follows:
δ l d i f = λ 2 4 π 2 ω 0 2 L
where, L is the measured length, λ is laser wavelength, and ω0 is the radius of waist of laser beam.
Since the laser source used for length measurement was a semiconductor laser and the laser beam directly output without any collimation, the beam waist radius of the laser is estimated to be 0.1 mm, δldif 0.1 nm for L 0.1 mm was obtained by Equation (8).
Table 1 gives the information used for the measurement uncertainty evaluation. As a whole, error sources can be classified into two types: random errors and system errors. For random errors, the Type A evaluation method based on statistics is used. For example, the measurement uncertainty component caused by the repeatability is obtained by Type A method. For system errors, the Type B evaluation method is used [14,15,16]. The detailed evaluation information and combined standard uncertainty are also given in Table 1. Since the length value was 0.1 mm, the length-dependent components were so small to be negligible, so the length-independent components were the main contributions to total measurement uncertainty. These components included repeatability, resolution, Abbe error, and the surface flatness of the step measured.

6. Conclusions

The length value disseminated in the way of end-plate surface distance is widely used in industry and science. Surface positioning is an important step for end-plate surface distance measurement. In this paper, a practical method is introduced for realizing the surface positioning with nano-meter precision. The method was used experimentally by making 0.1 mm step sizes in the measurement system. The measurement uncertainty analysis shows that the measurement uncertainty is 21 nm. Since the 0.1 mm length is relatively small, the main contribution of measurement uncertainty is the repeatability, and the measures to enhance repeatability are studied as the emphasis of the paper. The measures include the optimization of optical and mechanical parts of the system, using appropriate signal processing methods, and the appropriate measurement methods, etc. In conclusion, the combination of laser interference and white light interference for positioning of the surface is the effective measure to obtain good measurement repeatability. The method is verified to be effective. It will be applied to the length measurement primary standard (AIC) of NIM(National Institute of Metrology of China) in future studies.

Author Contributions

Conceived the Methods and Wrote the Paper, H.G. and Y.C.; Data curation, Y.L.; Performed some Confirmatory Experiments, S.S. and Z.S.; Resources, Z.W.; Edited the Manuscript, Y.C.

Funding

This research was supported by the Plan of Enhancing the Ability of National Standard Devices of General Administration of Quality Supervision, Inspection and Quarantine of China, Grant Number 24-ANL1804; Special Scientific Research on Civil Aircraft of Ministry of Industry and Information Technology of China, Grant Number MJ-2018-J-70; Sichuan Province Key Research and Development Plan of China, Grant Number 2019YFSY0039; National Key Research and Development Plan of China, Grant Number 2016YFF0203801.

Conflicts of Interest

The authors declare no conflict of interest.

References

  1. Li, C.S.; Yang, S.M.; Wang, Y.M.; Wang, C.Y.; Ren, W.; Jiang, Z.D. Measurement and characterization of a nano-scale multiple-step sample using a stylus profiler. Appl. Surf. Sci. 2016, 387, 732–735. [Google Scholar] [CrossRef]
  2. Orji, N.G.; Dixson, R.G.; Fu, J.; Vorburger, T.V. Traceable pico-meter level step height metrology. Wear 2004, 257, 1264–1269. [Google Scholar] [CrossRef]
  3. Vorburger, T.V.; Hilton, A.M.; Dixson, R.G.; Orji, N.G.; Powell, J.A.; Trunek, A.J. Calibration of 1 nm sic step height standards. In Proceedings of the SPIE Advanced Lithography Conference, San Jose, CA, USA, 22–26 February 2010; Volume 7638. [Google Scholar]
  4. Agurok, I.P. Rigorous decision of the excess fraction method in absolute distance interferometry. In Proceedings of the SPIE 3134, Optical Manufacturing and Testing II, San Diego, CA, USA, 1 November 1997; pp. 502–511. [Google Scholar]
  5. Chanthawong, N.; Takahashi, S.; Takamasu, K.; Matsumoto, H. A new method for high-accuracy gauge block measurement using 2 GHz repetition mode of a mode-locked fiber laser. Meas. Sci. Technol. 2012, 23, 054003. [Google Scholar] [CrossRef]
  6. Ye, X.Y.; Gao, H.T.; Sun, S.H.; Zou, L.D.; Shen, X.P.; Gan, X.C.; Chang, H.T.; Zhang, X. The Establishment of 2m length Measurement Primary Standard. Acta Metrol. Sin. 2012, 33, 193–197. [Google Scholar]
  7. Sun, S.H.; Ye, X.Y.; Gao, H.T. Slide Motion Control System of 2 m Automatic Interference Length Comparator. Acta Metrol. Sin. 2008, 29, 123–126. [Google Scholar]
  8. Bosse, H.; Bodermann, B.; Dai, G.; Flügge, J.; Frase, C.G.; Grob, H. Challenges in nanometrology: High precision measurement of position and size. Tm-Tech. Mess. 2015, 82, 346–358. [Google Scholar] [CrossRef]
  9. Tiemann, I.; Spaeth, C.; Wallner, G.; Metz, G.; Israel, W.; Yamaryo, Y. An international length comparison using vacuum comparators and a photoelectric incremental encoder as transfer standard. Precis. Eng. 2008, 32, 1–6. [Google Scholar] [CrossRef]
  10. Takahashi, A. Long-term dimensional stability of a line scale made of low thermal expansion ceramic nexcera. Meas. Sci. Technol. 2012, 23, 035001. [Google Scholar] [CrossRef]
  11. Key Comparison: Calibration of Line Scales, Euromet.L-K7; Metrology Institute of the Republic of Slovenia: Maribor, Slovenia, 2006; pp. 123–125.
  12. Wgdm-7: Preliminary Comparison on Nanometrology, Nano 3: Line Scale Standards, Final Report, Annex C: Description of the Measurement Methods and Instruments of the Participants; Physikalisch-Technische Bundesanstalt: Braunschweig, Germany, 2003; pp. 2–10.
  13. Gao, H.T.; Ye, X.Y.; Zou, L.D. Study of automatic measurement system for line space measurement with nanometer accuracy in 2 m length comparator. Acta Metrol. Sin. 2012, 33, 98–103. [Google Scholar]
  14. Gao, H.T.; Wang, Z.Y.; Wang, H. A scanning measurement method of the pitch of grating based on photoelectric microscope. In Proceedings of the SPIE AOPC 2015: Advances in Laser Technology and Applications, Beijing, China, 15 October 2015; Volume 9671. [Google Scholar]
  15. Cheng, Y.B.; Wang, Z.Y.; Chen, X.H.; Li, Y.R.; Li, H.Y.; Li, H.L.; Wang, H.B. Evaluation and Optimization of Task-oriented Measurement Uncertainty for Coordinate Measuring Machines Based on Geometrical Product Specififications. Appl. Sci. 2019, 9, 6. [Google Scholar] [CrossRef]
  16. Bich, W. Revision of the ‘Guide to the Expression of Uncertainty in Measurement’. Why and how. Metrologia 2014, 51, S155–S158. [Google Scholar] [CrossRef]
Figure 1. Block diagram of the system.
Applsci 09 04970 g001
Figure 2. The interference pattern of white light and RGB light interference components. (a) White light interference pattern; (b) red light interference pattern; (c) green light interference pattern; (d) blue light interference pattern.
Applsci 09 04970 g002
Figure 3. Positioning signal of 0.1 mm step surface.
Applsci 09 04970 g003
Figure 4. Actual white light positioning signal for surface.
Applsci 09 04970 g004
Figure 5. Theoretical white light interference signal.
Applsci 09 04970 g005
Figure 6. The layout of positioning unit.
Applsci 09 04970 g006
Figure 7. Positioning signal at moving speed of 30 μm/s.
Applsci 09 04970 g007
Figure 8. Positioning signal at moving speed of 50 μm/s.
Applsci 09 04970 g008
Figure 9. Positioning signal at moving speed of 80 μm/s.
Applsci 09 04970 g009
Figure 10. Signal difference in different driving modes. AIC is automatic interference comparator.
Applsci 09 04970 g010
Figure 11. The semiconductor laser wavelength stability monitoring.
Applsci 09 04970 g011
Figure 12. The signal of the combination of laser interference and white light interference.
Applsci 09 04970 g012
Figure 13. Block diagram of signal processing system.
Applsci 09 04970 g013
Figure 14. The shaping of white light interference signal.
Applsci 09 04970 g014
Figure 15. Positioning signal of first surface.
Applsci 09 04970 g015
Figure 16. Positioning signal of second surface.
Applsci 09 04970 g016
Figure 17. Bidirectional measurement results and the convergence of average result.
Applsci 09 04970 g017
Table 1. Measurement uncertainty evaluation.
Error Sources x i u ( x i ) Prob. c i = δ l / δ x i Unit u i ( l )
RepeatabilityS10.0 nmN1.0 10.0 nm
ResolutionN0.58 nmR10 5.8 nm
Laser wavelength λ 0 2.3 × 10‒5 × λ 0 R L / λ 0 (2.3 × 10‒5) × L
Diffraction of laser δ l d i f 0.1 nmR1.0 × 10‒6L/nm(1.0 × 10‒7) × L
Edlen formula n 1.0 × 10‒8R1.0L(1.0 × 10‒8) × L
Air pressure p 10 Pa 2.70 × 10‒9L/Pa(2.7 × 10‒9) × L
Air temperature t a i r 0.5 ℃R0.923 × 10‒6L/°C(0.5 ×10‒6) × L
Air humidity f 30 PaR0.367 × 10‒9L/Pa(11 × 10‒9) × L
Thermal linear expansion coefficient α 2.0 × 10‒6R0.5L/°C(1.0 × 10‒6) × L
Material temperature t s 0.5 ℃R11.5 × 10‒6L/°C(5.8 × 10‒6) × L
Abbe error δ l A b b e 17.3 nmR1.0 17.3
Flatness of surface δ h 5 nmR1.0 5
Cosine error δ l cos 29 × 10‒6 radR50 × 10‒6L/rad(1.45 × 10‒9) × L
Standard uncertainty (when L is 0.1 mm)21

