Article

IVUS Image Segmentation Using Superpixel-Wise Fuzzy Clustering and Level Set Evolution

1
Department of Electronic Engineering, Fudan University, Shanghai 200433, China
2
Key Laboratory of Medical Imaging Computing and Computer Assisted Intervention of Shanghai, Fudan University, Shanghai 200433, China
*
Author to whom correspondence should be addressed.
Appl. Sci. 2019, 9(22), 4967; https://doi.org/10.3390/app9224967
Submission received: 11 October 2019 / Revised: 5 November 2019 / Accepted: 11 November 2019 / Published: 18 November 2019
(This article belongs to the Special Issue Image Processing Techniques for Biomedical Applications)

Abstract

:
Reliable detection of the media-adventitia border (MAB) and the lumen-intima border (LIB) in intravascular ultrasound (IVUS) images remains a challenging task that is of high clinical interest. In this paper, we propose a superpixel-wise fuzzy clustering technique modified by edges, followed by level set evolution (SFCME-LSE), for automatic border extraction in 40 MHz IVUS images. The contributions are three-fold. First, the usage of superpixels suppresses the influence of speckle noise in ultrasound images on the clustering results. Second, we propose a region of interest (ROI) assignment scheme to prevent the segmentation from being distracted by pathological structures and artifacts. Finally, the contour is converged towards the target boundary through LSE with an appropriately improved edge indicator. Quantitative evaluations on two IVUS datasets by the Jaccard measure (JM), the percentage of area difference (PAD), and the Hausdorff distance (HD) demonstrate the effectiveness of the proposed SFCME-LSE method. SFCME-LSE achieves the minimal HD of 1.20 ± 0.66 mm and 1.18 ± 0.70 mm for the MAB and LIB, respectively, among several state-of-the-art methods on a publicly available dataset.

1. Introduction

Atherosclerosis involves pathological structures (stenosis, vulnerable plaque, etc.) within the arterial wall, leading to a significant reduction in blood flow. Atherosclerotic plaque can become fragile, potentially leading to cardiovascular diseases, such as angina, myocardial infarction, stroke, and sudden cardiac death [1]. Intravascular ultrasound (IVUS) is an in-vivo medical imaging technique capable of providing tomographic grayscale images of the vessel in real-time [2]. IVUS is commonly used in the diagnosis of atherosclerosis. Two types of borders in IVUS images, the lumen-intima border (LIB) and the media-adventitia border (MAB), are of substantial clinical interest. Automatic identification of these two borders is crucial for assessing the plaque burden and mechanical properties of the coronary artery [2].
Reliable border detection is obstructed by complicated intravascular structures, various forms of impediments, and intrinsic artifacts. Many methodologies have been proposed for IVUS image segmentation. We briefly summarize some of the published algorithms next.
Pixel classification followed by deformable models is the most common strategy for IVUS image segmentation. The classification took the morphological, textural, and grayscale features into consideration and was achieved by the extreme learning machine [3], dictionary learning in the sparse representation framework [4], support vector machines [5,6,7], or artificial neural networks [8]. An assessment of the capability of different features for segmenting IVUS images was given by Lo Vercio et al. [7]. In other deformable model-based methods, a global intensity term and an oriented smooth gradient were developed for the initial border extraction [9]. The detected border of the previous frame was utilized as an initial estimation of the border of the current frame in an IVUS sequence [10]. A 3D helical contour initialized as a centered helix model with a fixed radius was deformed to complete the segmentation [11,12]. Among these methods, feature-based classification automatically gives a relatively accurate initial border, but the extraction of textural features and the training of classifiers are time consuming.
The fast marching method achieves segmentation by propagating an interface to the boundary under a speed function. Fast marching methods for IVUS sequences generally model the gray-level distribution of vessel anatomical structures as a mixture of probability density functions (PDFs). Rayleigh PDFs [13,14], gamma PDFs [15], and the intensity gradient [14,15,16] were introduced to construct the velocity function of the propagating interface. However, these algorithms assume that regions in the image have a statistically distinctive distribution, which is not always accurate, as IVUS images contain various forms of diseased structures. Among other categories of methods, the graph-based approach [17,18], the Grow-Cut algorithm [19], the nonparametric statistical approach [20], and the deep learning architecture [21,22] were introduced to IVUS image segmentation. The main limitation of deep learning for IVUS image segmentation lies in the lack of enough labeled data, which must be provided by IVUS experts.
Despite the considerable attempts that have been devoted to IVUS image segmentation, no approved universal method exists that guarantees a successful segmentation. In this paper, we propose a three-fold automatic border detection strategy. First, we conduct superpixel-wise fuzzy clustering modified by edges (SFCME). Then, the clustering maps are fed into a framework that assigns regions of interest (ROIs) to different vascular tissues. The initial border is extracted according to the assignment and finally converged by edge-based level set evolution (LSE). The proposed SFCME-LSE method has a simple and fast implementation without the need for labeled training data. It takes advantage of the useful information in images while reducing interferences. Specifically, the superpixel-wise clustering method is based on the regional gray information, suppressing the influence of speckle noise in the ultrasound images on the results. ROIs are assigned according to the anatomical and morphological descriptors in the IVUS images. The deformation of contours in LSE mainly relies on edge information.
The rest of the paper proceeds as follows. In Section 2, we present the motivation and correlated theory of our method. Section 3 details the algorithm. The effectiveness of the proposed method is validated by statistical results in Section 4. Section 5 gives the extended discussion, and Section 6 concludes the paper.

2. Motivation

As multiple pathological structures and artifacts exist in IVUS images, it is difficult for a single segmentation method to detect the MAB and LIB accurately. We use a separation/aggregation strategy to prevent the extraction of borders from being distracted by those impediments. A clustering technique followed by ROI assignment roughly identifies important vascular components, contributing to the localization of the initial boundary.

2.1. Separation of Vascular Components

Clustering methods have been widely used in image segmentation. Employing a fuzzy c-means (FCM) technique can determine approximate ROIs in medical images. The algorithm is related to the minimization of an objective function [23]:
J = i = 1 N i c = 1 N c u c i m I i v c 2 ,   subject   to   c = 1 N c u c i = 1 ,   0 u c i 1 ,
where i and c are the pixel index and the cluster index, respectively. N i is the number of pixels in the image. N c denotes the number of clusters. u c i indicates the membership between the ith pixel and the cth cluster, and v c is the centroid of the cth cluster. I represents the attribute (intensity, color, etc.) of an image, and in this paper, I i is set to the gray value of pixel i . m is the weighting exponent that controls the fuzziness of the clustering and is set to 2 in most segmentation tasks.
J is optimized to its local minimum by updating v c and u c i iteratively [23]:
v c = i = 1 N i u c i m I i i = 1 N i u c i m
u c i = I i v c 2 / m 1 k = 1 N c I i v k 2 / m 1
Many methods based on the FCM provide ways to obtain better segmentation results by absorbing the spatial information. The intensities of pixels in a window around a pixel i were used as the spatial constraint for i [24,25]. The spatial information was incorporated into the fuzzy membership function u c i [26]. A fuzzy factor was proposed to flexibly change the influence of pixels within the local window around pixel i , according to their Euclidean distance from i [27]. The image segmentation effect was improved by incorporating the adaptive local spatial information into the objective function [28]. Through morphological gradient reconstruction, superpixels were obtained to provide adaptive and irregular local spatial neighborhoods for color image segmentation [29].
Simple linear iterative clustering (SLIC) can efficiently generate superpixels [30]. In this paper, we integrate SLIC into the clustering process to provide adaptive spatial information and reduce the amount of processing elements in the fuzzy clustering procedure.

2.2. Assignment of Vascular Components

Despite the extreme difference in the appearance of IVUS images, a coronary cross-section is generally composed of a lumen and a coronary vessel wall composed of three layers: The intima, the media, and the adventitia. Additionally, several types of structures (calcification, soft plaque) and artifacts (ring-down artifacts, guidewire artifacts, shadow artifacts) are included in IVUS images. In this paper, calcification refers to the calcified plaque, and soft plaque includes fibrotic plaque. An example image with different components labeled is shown in Figure 1.
The adventitia, plaque, and calcification regions are highly echo-reflective and appear as bright tissues in the image, while the lumen appears darker. Calcifications usually produce signal attenuation behind them, resulting in shadow artifacts. The intima and the media are very thin and not always visual in IVUS images. Ring-down artifacts are characterized by a bright halo around the black catheter area in the center of the image.
In this paper, we consider that the catheter zone R c consists of pixels whose distance from the image center i c is less than the catheter radius D c :
R c = i ,   d i , i c D c ,
where d i , i c is the Euclidean distance between pixels i and i c . The background zone R b is the region outside the inscribed circle of the image:
R b = i ,   d i , i c D b ,
where D b is the radius of the inscribed circle.
Inspired by the grayscale differences in these image components, as well as their anatomical and spatial features, we propose a ROI assignment algorithm, which is detailed in Section 3.3.

2.3. Convergence of Contours

The level set method remains a widely used technique for aligning the initial contour to the target boundary. It models a closed curve S as the zero level set of a Lipschitz function ϕ . The convergence of S involves minimizing an energy function E ϕ with respect to the level set function [31]:
S t = x , y , t | ϕ x , y , t = 0 ,
ϕ t = E ϕ ϕ ,
where t represents the evolution time, and x , y are the Cartesian coordinates of a pixel in the image.
Existing LSE models can be generally grouped into region-based and edge-based models. The distance regularized LSE (DRLSE) method slows down the shrinkage or expansion of S at image edges [32]. The region-based Chan–Vese model deforms S according to the gray difference between regions inside and outside the contour [33]. A kernel function was integrated into the Chan–Vese model for better effectiveness in inhomogeneous images [34]. A combined data fidelity term was integrated into the energy function for efficiently handling images with additive and multiplicative noise [35].
Level set techniques often require initialization and do not guarantee a global minimum. After obtaining the initial contour from superpixel-based clustering results, we choose edge-based LSE with a new edge indicator to refine the contour.

3. Method

The proposed method is three-fold, and its workflow is depicted in Figure 2. Each frame is pre-processed, and clustering is executed first to separate vascular components of interest into different ROIs. Then, the obtained ROIs are assigned into five vessel tissues through a framework controlled by the thresholds of three indicators. At the same time, the border is updated along with the ROI assignment. Finally, edge-based LSE drives the initial border towards the target.

3.1. Pre-Processing

Image intensities are normalized to the interval 0 ,   1 . Calibration squares with an intensity equal to 1 are replaced by the average intensity of 24 connected pixel neighbors. The catheter zone R c is blackened to remove ring-down artifacts. The image after those treatments is denoted by I o . Then, contrast-limited adaptive histogram equalization [36] is applied to I o , generating the edge-sharpened image I .

3.2. Superpixel-Wise Fuzzy Clustering Modified by Edges

We adopt SLIC [30] to obtain preliminary over-segmentation that provides the FCM technique with adaptive and irregular local spatial neighborhoods. Moreover, superpixel-wise clustering is able to achieve low computational complexity by reducing the number of processing elements. With the number of iterations, the desired number of superpixels, and compactness set to 20, 333, and 13, respectively, with SLIC, we can obtain an accurate over-segmentation for post-processing. Finally, the catheter zone R c and the background zone R b are both considered superpixels.
The obtained local spatial information is incorporated into the objective function of the FCM algorithm, defined by:
J = s = 1 N s c = 1 N c P s u c s m q s v c 2 ,   subject   to   c = 1 N c u c s = 1 ,   0 u c s 1 ,
where s is the superpixel index and N s is the number of superpixels. P s is the number of pixels in the sth superpixel R s . The mean intensity q s in R s is calculated as:
q s = 1 P s i R s I i
Similar to Equations (2) and (3), the membership function u c s and cluster center v c are updated according to:
v c = s = 1 N s u c s m P s q s s = 1 N s u c s m P s
u c s = q s v c 2 / m 1 k = 1 N c q s v k 2 / m 1
Each superpixel belongs to the cluster that has the most of membership belonging. N c takes the value of 3, and three clustering maps are obtained. The cluster denoted by B 1 o , which has the smallest white areas, consists of ROIs located inside the adventitia, calcification, and soft plaque areas. The cluster denoted by B 2 o whose center is white contains ROIs belonging to shadow artifacts and soft plaque, as shown in Figure 2.
After clustering, ROIs belonging to different tissues may still have weak connections in B 1 o . To fully cut these connections, B 1 o minus an edge map B e and is processed morphologically. The resulting map is denoted by B 1 .
B 1 = B 1 o B e b d i s c b d i s c ,
where b d i s c is a disc-shaped structuring element. and denote morphological erosion and the dilation operation, respectively.
Edges are actually high-frequency areas in an image. If lower-frequency information is rejected by some sort of filter, higher frequencies will remain, which are edges [37]. B e is computed according to the maximum magnitude response of a bank of 2D Morlet wavelet kernels with dimensions equal to 1 / 32 the size of the image, as shown in Figure 3.

3.3. ROI Assignment Algorithm

As detailed in Section 2.2, tissues in IVUS images usually have an obvious relative position distribution, and they have roughly different gray levels. Inspired by these observations, we propose an automatic algorithm that assigns ROIs in B 1 and B 2 o to five categories: Calcification, adventitia, soft plaque, lumen, and shadow. Additionally, an iterative boundary updating method works with the ROI assignment algorithm. The two processes regulate and promote each other. Specifically, ROIs are processed from largest to smallest by area. The ROI being processed is denoted by R o n .
We define a grayscale indicator D g , an anatomical indicator D a , and a spatial indicator D s to control the assignment. D g is the mean intensity of pixels in R o n divided by the mean intensity of pixels in all ROIs in B 1 :
D g = 1 P o n i R o n I o i 1 P B i B 1 I o i ,
where P o n and P B are the number of pixels in R o n and B 1 , respectively. Generally, the order from largest to smallest in terms of D g is calcification, adventitia, soft plaque, lumen, and shadow.
Calcific regions usually produce signal attenuation behind them, appearing in the image as a shadow outside the calcification. The ratio of the mean intensity of an ROI to the mean intensity of regions outside the ROI is presented to detect calcifications [38]. However, some calcifications may leave a small shadow, and not all areas outside bright calcifications belong to the shadow. In this paper, we assume a calcification leaves a shadow with a thickness L o u t outside it. D a is defined as:
D a = 100 · 1 D g · 1 P o u t i R o u t I o i 1 P o n i R o n I o i 2 ,
where R o u t is the region outside R o n with a thickness L o u t , as depicted in Figure 4. P o u t is the number of pixels in R o u t . Usually, the order from largest to smallest in terms of D a is lumen, soft plaque, adventitia, and calcification.
D s quantifies the proximity of R o n to the border, defined as the minimum distance between R o n and the current MAB.
D s R o n , M A B = ± min i a R o n min i b M A B d i a , i b ,
where i a and i b are two points in R o n and the MAB, respectively. D s R o n , M A B is positive if R o n is outside the MAB, and vice versa.
The workflow of the assignment algorithm is illustrated in Table 1 with a graphical example in Figure 5. Additional explanations are described below. The parameters involved in the method are listed in Table 2.

3.3.1. Processing for Guidewire Artifacts

If the minimal distance between R o n and the catheter region R c is smaller than a specific threshold T d , we consider that R o n contains guidewire artifacts. Pixels touching R c as well as their radial outside pixels belong to the guidewire artifact and are excluded from R o n before the assignment, as documented in Figure 5e–g.

3.3.2. MAB Update

IVUS images can be viewed as 360-degree cross-sections of the vessel wall. Starting from the vessel center, the first adventitia pixel in the radial direction at each angle is sought. If no adventitia pixel is found, the L o u t pixel outside the last calcification pixel is selected. The MAB is then obtained according to the radial linear interpolation of the selected pixels, as shown in Figure 5g. Finally, topological constraints are imposed, i.e., the MAB is outside the soft plaque, calcification, and lumen.
The update of the MAB runs once an ROI is assigned, and is terminated when the angle θ a d v e n of the arc composed of adventitia pixels exceeds a threshold T θ or all ROIs larger than the threshold T a r e a have been assigned.

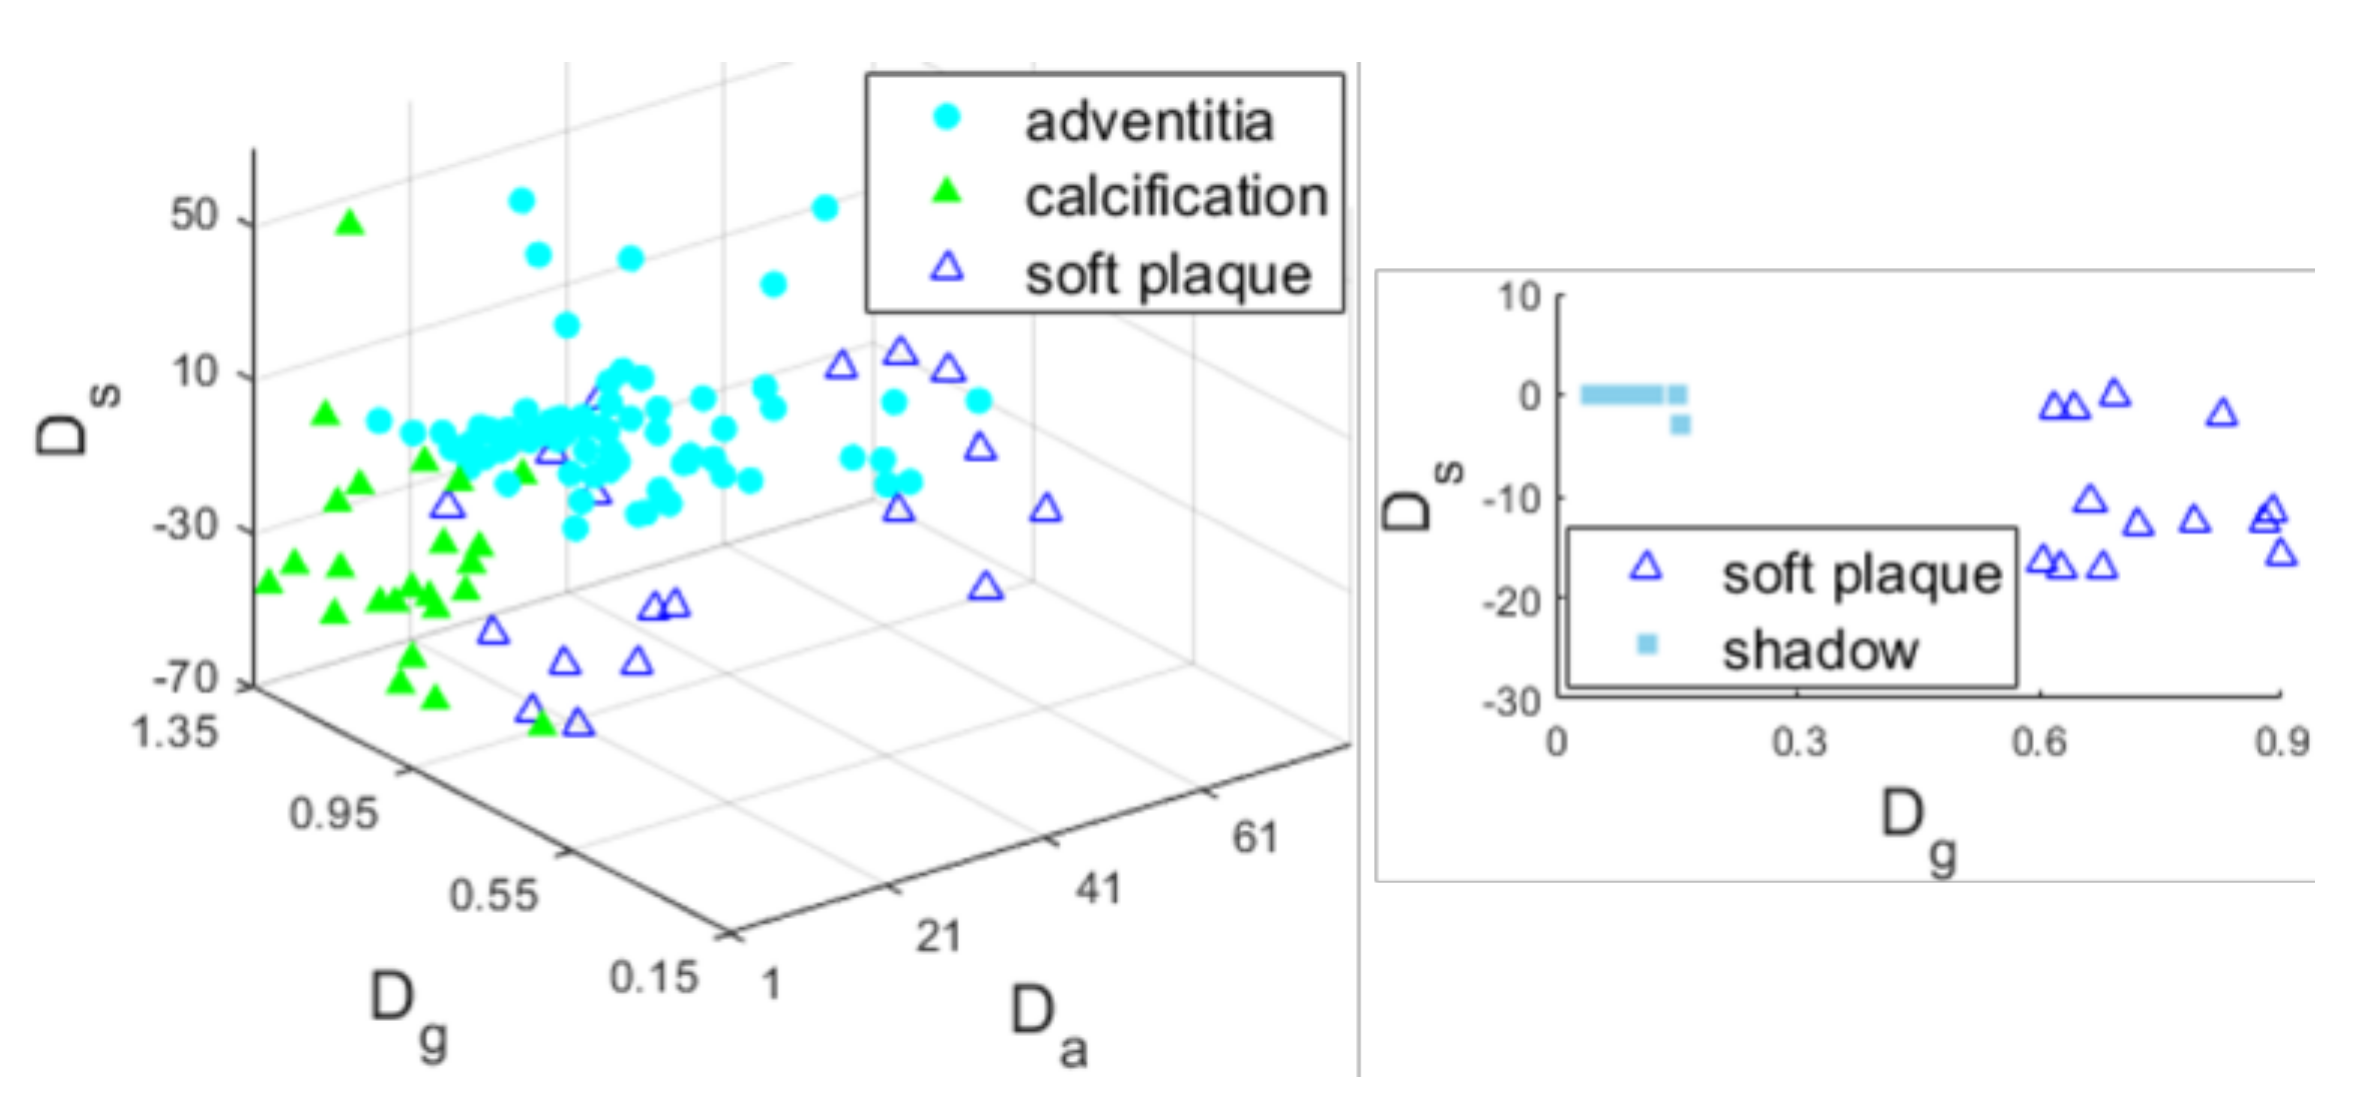
3.3.3. Tissue Recognition

ROIs belonging to different tissues are scattered in the metric space formed by three indicators. The graphical description will be given in Section 5. We use five judgments of the priority (from high to low) to complete the recognition: ① if ( D s < 0 and D a < T a 1 ) or ( D a < T a 2 ), R o n belongs to a calcification; ② if ( D s > 0 ) or ( D s = 0 and T a 3 D a < T a 4 ), R o n belongs to the adventitia; ③ if ( D s 0 and D g > T g 1 ) or ( T s < D s 0 and D g > T g 2 ), R o n belongs to soft plaque; ④ if ( T s < D s 0 and D g > T g 3 ), R o n belongs to lumen; ⑤ if ( D g < T g 4 ), R o n belongs to a shadow.

3.3.4. LIB Extraction

After all the ROIs have been assigned, radial searching followed by linear interpolation is employed to locate the LIB inside the adventitia, calcification, soft plaque, and shadow, and outside the lumen, as shown in Figure 5j.

3.4. Level Set Evolution

As the above operations are generally based on regional information and the initial border is close to the target, we adopt edge-based DRLSE for further contour convergence, formulated as [32]:
E ϕ = μ 1 2 Ω ϕ 1 2 d x d y + β Ω g δ ϕ ϕ d x d y + ν Ω g H ϕ d x d y
The energy function is minimized through:
ϕ t = μ · 2 ϕ d i v ϕ ϕ + β · δ ϕ d i v g ϕ ϕ ν · g δ ϕ ,
where the first term is a distance regularization term maintaining the regularity of the level set function ϕ , the second term and the third term are for minimizing the weighted length of the contour S and the weighted area inside S , respectively. The factors μ , β , and ν are weights regulating the contribution of each term. Ω is the image domain. , 2 , and d i v denote the gradient, Laplacian, and divergence operators, respectively. δ ϕ is the Dirac delta function, which is the derivative of the Heaviside function H ϕ [32]. g is the edge indicator that slows down the shrinkage or expansion of S when it arrives at edges [32].
g = 1 1 + G σ I 2
Edges are not clear in ultrasound images. Due to noise, a large image gradient may appear at pixels not located on desired boundaries, interfering with the deformation of the contour. We propose a new edge indicator that highlights the main edge information for better contour convergence.
g n e w = max g ¯ , 1 B e ¯ ,
where · ¯ denotes unit normalization.

4. Experiments and Results

4.1. Materials and Evaluation Measures

The experimental evaluation of the proposed SFCME-LSE method is carried out on two IVUS datasets. Dataset I contains 326 frames from eight pullbacks acquired from four patients at the Department of Cardiology, Zhongshan Hospital of Fudan University, Shanghai, China. These images do not disclose patient information, and informed consent to use these images has been obtained from the patients and the hospital. One set of manual labeling is provided as the ground truth. The imaging system used for the acquisition is an iLab IVUS (Boston Scientific, Fremont, United States) equipped with a 40 MHz OptiCross catheter. Dataset II, which is publicly available, consists of 77 frames from 22 patients [39]. The imaging system for Dataset II is also an iLab IVUS, but with a different catheter, the 40 MHz Atlantis SR 40 Pro catheter. Dataset II has three sets of annotations from two clinical experts for intra- and inter-observer evaluations. Dataset I and Dataset II present a good diversity of artifacts, and some frames include multiple artifacts. Specifically, the number of frames containing plaque (or calcification), bifurcation, stents, side vessels, shadow artifacts, and guidewire artifacts are 69, 16, 22, 8, 42, and 36, respectively, in Dataset II.
The algorithm is implemented in MATLAB R2018a on a Dell Precision T7610 with Intel(R) Xeon(R) E5-2637 v2 3.5 GHz CPU.
Three performance measures are usually chosen for the quantitative analysis in IVUS segmentation [39]. The Jaccard measure (JM) weighs the similarity between the segmented area R s e g and the manually defined area R t r u t h and is expressed as:
J M = R s e g R t r u t h R s e g R t r u t h
The percentage of area difference (PAD) which computes the area difference between R s e g and R t r u t h is defined as:
P A D = A r e a R s e g A r e a R t r u t h A r e a R t r u t h ,
where A r e a · represents the area calculation. The Hausdorff distance (HD) quantifies the distance between the resulting contour S s e g and the manual annotation S t r u t h :
H D = max i a S s e g min i b S t r u t h d i a , i b ,
where i a and i b are two points in S s e g and S t r u t h , respectively. The higher the JM is, the smaller the PAD and HD, the better the performance of the segmentation method.

4.2. Self-Evaluation

Self-evaluation of the proposed method is carried out on Dataset I. The results of experiment 1 (the proposed method without LSE), experiment 2 (the proposed method with LSE based on the edge indicator g ), and experiment 3 (SFCME-LSE) are compared to understand the contributions of the individual components of the SFCME-LSE to the overall performance. Further, we add Gaussian noise to images to evaluate the anti-noise performance of the SFCME-LSE. Images from Dataset I already contain a high amount of noise. However, these original images are viewed noise-free and contaminated by additional noise with a specified signal-to-noise ratio (SNR). The real SNR of noisy images is lower than the specified value, as a result. The means and standard deviations of the numerical metrics for the MAB and LIB are summarized in Table 3.
From a clinical perspective, the quality of a method might be analyzed intuitively according to the percentage of frames lying below a progressive threshold of the PAD, as shown in Figure 6a.
The results obtained in experiment 1 demonstrate the effectiveness of the proposed border initialization technology. There are substantial improvements in the HD from experiment 1 to experiment 3, indicating the convergence of edge-based LSE on the contour. We achieved a modest improvement in the JM from 0.89 using the edge indicator g to 0.91 using g n e w in detecting the MAB, and from 0.80 to 0.81 in detecting the LIB. Additionally, high JMs, low HDs, and small PADs in experiment 3 illustrate to some extent the ability of SFCME-LSE for IVUS image segmentation. Further, the performance of SFCME-LSE is acceptable on images with SNR higher than 30 dB, as illustrated in Table 3 and Figure 6b.
In Figure 7, we present Bland–Altman plots and linear regression plots for A r e a R s e g and A r e a R t r u t h , visualizing the robustness of the algorithm to the size of the vessel cross-sections. Specifically, the linear regression analysis indicates correlation with R 2 = 0.95 ( p = 1.24 × 10 214 ) and R 2 = 0.85 ( p = 1.99 × 10 135 ) for MAB and LIB detection, respectively. Bland–Altman plots indicate a slight bias of 1.33 mm 2 and 0.60 mm 2 for MAB and LIB detection, respectively.

4.3. Comparative Evaluation

Comparative evaluation with other automatic methods is carried out on Dataset II, and the results are listed in Table 4. SFCME-LSE outperforms existing methods in terms of the HD, with 1.20 ± 0.66 mm and 1.18 ± 0.70 mm for MAB and LIB detection, respectively. Additionally, our method has a competitive result over those published methods in terms of the JM and PAD. Moreover, SFCME-LSE has an important advantage of a simple implementation without the time-consuming extraction of complex texture features.
Finally, a qualitative assessment is performed by comparing the segmentation and the ground truth on several exemplary frames extracted from Dataset I and Dataset II, as displayed in Figure 8.

5. Discussion

In this paper, we propose the SFCME-LSE method for the extraction of the MAB and LIB in IVUS images. Next, we analyze the method in detail from four aspects: The benefit of superpixel-wise fuzzy clustering for extracting ROIs, the reliability of the ROI assignment framework, the parameter selection, and the assessment of the strengths and weaknesses of the method.
In Figure 9, we present clustering results of SFCME and of FCM with spatial information [26]. Due to the intensity inhomogeneity and large amounts of speckle noise invariably existing in ultrasound images, the results of pixel-wise fuzzy clustering appear discontinuous. The integration of SLIC superpixels improves the ability of clustering to group pixels from the same tissue into one ROI, which simplifies the assignment of ROIs. Moreover, SFCME takes approximately 0.69 s per frame in our environment, while the other method takes 2.32 s.
Among different IVUS images, even the same tissue may present diverse gray levels. Some images are visually brighter, while others are darker. In our ROI assignment framework, we define indicators D g , D a , and D s according to the relative grayscale or spatial information of regions in a single image, which contributes to the thresholds’ adaptation on dark or bright images. The three indicators are all R o n -dependent, and D s is also MAB-dependent. With the indicators’ variation under the update of R o n and the MAB throughout the assignment procedure, some superior regional features are extracted in the image. To visually illustrate the effectiveness of these indicators, we recorded the D g , D a , and D s of the ROIs in 30 frames from Dataset I, as well as their classifications (calcification, adventitia, soft plaque, lumen, or shadow). The statistical results are displayed graphically in Figure 10. It is obvious that the components are distributed at different locations in the metric space formed by the three indicators. The thresholds controlling the assignment, T a 1 ~ T a 4 , T s , and T g 1 ~ T g 4 , are determined according to the statistical results. Furthermore, to reduce assignment error, two sets of conditions are considered for calcification, adventitia, and soft plaque. One decision is more rigorous in terms of the intensity ( D g , D a ), while the other is more rigorous in terms of the location ( D s ), as illustrated in Section 3.3.3 ① ② ③. Note that the discrimination error between calcification and soft plaque does not affect the extraction of the boundary.
Important parameters involved in SFCME-LSE are listed in Table 2. D c determines a circular catheter zone R c including the ring-down artifact and is usually 43 pixels in 40 MHz IVUS images. As guidewire artifacts touch R c , we believe that the maximum distance between them is T d . L o u t is set to 23 pixels, ensuring that pixels within this thickness belong to the shadow left by the calcification. T θ is set to stop the update of the MAB, and T a r e a is set to terminate the assignment of the ROIs. By changing values of weights μ , β , and ν , the contribution of each term in Equation (17) to the evolution of deformable contours will be altered. We carried out several tests and chose the values μ = 0.2 , β = 1 , and ν = ± 0.03 , yielding acceptable results for both borders.
The highlight of the SFCME-LSE method lies in its effective utilization of pathological structures and simple implementation. Impediments in IVUS image segmentation are utilized to provide topological constraints on the boundary. Compared to the time-consuming extraction of features and training of classifiers [3,4,5,6,7,8], unsupervised clustering with post-assignment is fast and requires no labeled data. The iterative update of indicators D g , D a , and D s can quickly mine valuable information in the image. Moreover, the results in Section 4 indicate the adaptability of the proposed framework to different datasets. Inevitably, there exist several limitations in the proposed method. The inaccuracy in the detection of the MAB derives from the loss of contour information in the shadow area. Segments obtained from radial linear interpolation may not coincide with the ground truth well, as shown in Figure 11 ①. Hypoechoic or echoless soft plaques may contain large amounts of lipids and necrotic tissue and appear in the IVUS image as areas of low intensity. Some soft plaques are significantly similar to the lumen, causing the segmentation error of the LIB, as depicted in Figure 11 ②. In the mentioned circumstances, the clustering and LSE techniques cannot accurately locate the boundary with indistinguishable intensities and textures on both sides. Future studies can be conducted to solve these problems by deep learning architectures or optical coherence tomography (OCT)-guided IVUS image segmentation, if there are enough annotated data.

6. Conclusions

In this paper, we propose the SFCME-LSE method for MAB and LIB detection in IVUS images. Superpixel-wise fuzzy clustering is robust to speckle noise in ultrasound images. A novel ROI assignment framework is proposed according to the anatomical and grayscale information of the image. The contour deforms towards the desired boundary through LSE with a new edge indicator. Experiments employed on two datasets demonstrate the effectiveness of the method on 40 MHz IVUS images. The statistical results of our method compared with other recently published methods on the publicly available dataset indicate the competitiveness of the SFCME-LSE method.

Author Contributions

M.X. and Y.W. conceived of the presented idea. M.X., W.Y., and Y.H. developed the theory and carried out the experiment. Y.G., G.Z., and Y.W. planned and supervised the work. All authors discussed the results and contributed to the writing of the manuscript.

Funding

This research is supported by the National Key Research and Development Program of China (No.2018YFC0116303).

Conflicts of Interest

The authors declare no conflict of interest.

Nomenclature

IVUSIntravascular ultrasound
LIBThe lumen-intima border
MABThe media-adventitia border
PDFProbability density function
SFCMESuperpixel-wise fuzzy clustering modified by edges
ROIRegion of interest
LSELevel set evolution
FCMFuzzy c-means
SLICSimple linear iterative clustering
DRLSEDistance regularized level set evolution
JMJaccard measure
PADPercentage of area difference
HDHausdorff distance
SNRSignal-to-noise ratio

References

  1. Frostegard, J. SLE, atherosclerosis and cardiovascular disease. J. Intern. Med. 2005, 257, 485–495. [Google Scholar] [CrossRef] [PubMed]
  2. Katouzian, A.; Angelini, E.D.; Carlier, S.G.; Suri, J.S.; Navab, N.; Laine, A.F. A state-of-the-art review on segmentation algorithms in intravascular ultrasound (IVUS) images. IEEE Trans. Inf. Technol. Biomed. 2012, 16, 823–834. [Google Scholar] [CrossRef] [PubMed]
  3. Wang, Y.; Peng, W.; Qiu, C.; Jiang, J.; Xia, S. Fractional-order Darwinian PSO-based feature selection for media-adventitia border detection in intravascular ultrasound images. Ultrasonics 2019, 92, 1–7. [Google Scholar] [CrossRef] [PubMed]
  4. Zakeri, F.S.; Setarehdan, S.K.; Norouzi, S. Automatic media-adventitia IVUS image segmentation based on sparse representation framework and dynamic directional active contour model. Comput. Biol. Med. 2017, 89, 561–572. [Google Scholar] [CrossRef] [PubMed]
  5. Chen, F.; Ma, R.; Liu, J.; Zhu, M.; Liao, H. Lumen and media-adventitia border detection in IVUS images using texture enhanced deformable model. Comput. Med. Imaging Graph. 2018, 66, 1–13. [Google Scholar] [CrossRef]
  6. Lo Vercio, L.; del Fresno, M.; Larrabide, I. Lumen-intima and media-adventitia segmentation in IVUS images using supervised classifications of arterial layers and morphological structures. Comput. Methods Programs Biomed. 2019, 177, 113–121. [Google Scholar] [CrossRef] [PubMed]
  7. Lo Vercio, L.; Orlando, J.I.; del Fresno, M.; Larrabide, I. Assessment of image features for vessel wall segmentation in intravascular ultrasound images. Int. J. Comput. Assist. Radiol. Surg. 2016, 11, 1397–1407. [Google Scholar] [CrossRef] [PubMed]
  8. Su, S.; Hu, Z.; Lin, Q.; Hau, W.K.; Gao, Z.; Zhang, H. An artificial neural network method for lumen and media-adventitia border detection in IVUS. Comput. Med. Imaging Graph. 2017, 57, 29–39. [Google Scholar] [CrossRef]
  9. Unal, G.; Bucher, S.; Carlier, S.; Slabaugh, G.; Fang, T.; Tanaka, K. Shape-driven segmentation of the arterial wall in intravascular ultrasound images. IEEE Trans. Inf. Technol. Biomed. 2008, 12, 335–347. [Google Scholar] [CrossRef]
  10. Plissiti, M.E.; Fotiadis, D.I.; Michalis, L.K.; Bozios, G.E. An automated method for lumen and media-adventitia border detection in a sequence of IVUS frames. IEEE Trans. Inf. Technol. Biomed. 2004, 8, 131–141. [Google Scholar] [CrossRef]
  11. Hammouche, A.; Cloutier, G.; Tardif, J.C.; Meunier, J. Space curve approach for IVUS image segmentation. In Proceedings of the IEEE Life Sciences Conference, Montreal, QC, Canada, 28–30 October 2018; pp. 37–40. [Google Scholar]
  12. Hammouche, A.; Cloutier, G.; Tardif, J.C.; Hammouche, K.; Meunier, J. Automatic IVUS lumen segmentation using a 3D adaptive helix model. Comput. Biol. Med. 2019, 107, 58–72. [Google Scholar] [CrossRef] [PubMed]
  13. Cardinal, M.H.R.; Meunier, J.; Soulez, G.; Maurice, R.L.; Therasse, É.; Cloutier, G.; Soulez, G.; Cloutier, G. Intravascular ultrasound image segmentation: A three-dimensional fast-marching method based on gray level distributions. IEEE Trans. Med. Imaging 2006, 25, 590–601. [Google Scholar] [CrossRef] [PubMed]
  14. Cardinal, M.H.R.; Soulez, G.; Tardif, J.C.; Meunier, J.; Cloutier, G. Fast-marching segmentation of three-dimensional intravascular ultrasound images: A pre- and post-intervention study. Med. Phys. 2010, 37, 3633–3647. [Google Scholar] [CrossRef] [PubMed]
  15. Destrempes, F.; Cardinal, M.H.R.; Allard, L.; Tardif, J.C.; Cloutier, G. Segmentation method of intravascular ultrasound images of human coronary arteries. Comput. Med. Imaging Graph. 2014, 38, 91–103. [Google Scholar] [CrossRef]
  16. Yan, J.; Lv, D.; Cui, Y. A novel segmentation approach for intravascular ultrasound images. J. Med. Biol. Eng. 2017, 37, 386–394. [Google Scholar] [CrossRef]
  17. Sun, S.; Sonka, M.; Beichel, R.R. Graph-based IVUS segmentation with efficient computer-aided refinement. IEEE Trans. Med. Imaging 2013, 32, 1536–1549. [Google Scholar]
  18. Essa, E.; Xie, X. Automatic segmentation of cross-sectional coronary arterial images. Comput. Vis. Image Underst. 2017, 165, 97–110. [Google Scholar] [CrossRef]
  19. Balocco, S.; Gatta, C.; Ciompi, F.; Pujol, O.; Carrillo, X.; Mauri, J.; Radeva, P. Combining growcut and temporal correlation for IVUS lumen segmentation. Lect. Notes Comput. Sci. 2011, 556–563. [Google Scholar] [CrossRef]
  20. Kermani, A.; Ayatollahi, A. A new nonparametric statistical approach to detect lumen and media-adventitia borders in intravascular ultrasound frames. Comput. Biol. Med. 2019, 104, 10–28. [Google Scholar] [CrossRef] [PubMed]
  21. Yang, J.; Tong, L.; Faraji, M.; Basu, A. IVUS-Net: An intravascular ultrasound segmentation network. Int. Conf. Smart Multimed. 2018, 367–377. [Google Scholar] [CrossRef]
  22. Yang, J.; Faraji, M.; Basu, A. Robust segmentation of arterial walls in intravascular ultrasound images using dual path U-Net. Ultrasonics 2019, 96, 24–33. [Google Scholar] [CrossRef] [PubMed]
  23. Bezdek, J.C. Pattern Recognition with Fuzzy Objective Function Algorithms; Plenum: New York, NY, USA, 1981. [Google Scholar]
  24. Ahmed, M.N.; Yamany, S.M.; Mohamed, N.; Farag, A.A.; Moriarty, T. A modified fuzzy c-means algorithm for MRI bias field estimation and adaptive segmentation. IEEE Trans. Med. Imaging 2002, 21, 193–199. [Google Scholar] [CrossRef] [PubMed]
  25. Chen, S.; Zhang, D. Robust image segmentation using FCM with spatial constraints based on new kernel-induced distance measure. IEEE Trans. Syst. Man Cybern. 2004, 34, 1907–1916. [Google Scholar] [CrossRef]
  26. Chuang, K.S.; Tzeng, H.L.; Chen, S.; Wu, J.; Chen, T.J. Fuzzy c-means clustering with spatial information for image segmentation. Comput. Med. Imaging Graph. 2006, 30, 9–15. [Google Scholar] [CrossRef] [PubMed]
  27. Krinidis, S.; Chatzis, V. A robust fuzzy local information c-means clustering algorithm. IEEE Trans. Image Process. 2010, 19, 1328–1337. [Google Scholar] [CrossRef]
  28. Liu, G.; Zhang, Y.; Wang, A. Incorporating adaptive local information into fuzzy clustering for image segmentation. IEEE Trans. Image Process. 2015, 24, 3990–4000. [Google Scholar]
  29. Lei, T.; Jia, X.; Zhang, Y.; Liu, S.; Meng, H.; Nandi, A.K. Superpixel-based fast fuzzy c-means clustering for color image segmentation. IEEE Trans. Fuzzy Syst. 2019, 27, 1753–1766. [Google Scholar] [CrossRef]
  30. Achanta, R.; Shaji, A.; Smith, K.; Lucchi, A.; Fua, P.; Süsstrunk, S. SLIC superpixels compared to state-of-the-art superpixel methods. IEEE Trans. Pattern Anal. Mach. Intell. 2012, 34, 2274–2281. [Google Scholar] [CrossRef]
  31. Caselles, V.; Kimmel, R.; Sapiro, G. Geodesic active contours. Int. J. Comput. Vis. 1997, 22, 61–79. [Google Scholar] [CrossRef]
  32. Li, C.; Xu, C.; Gui, C.; Fox, M.D. Distance regularized level set evolution and its application to image segmentation. IEEE Trans. Image Process. 2010, 19, 3243–3254. [Google Scholar]
  33. Chan, T.F.; Vese, L.A. Active contours without edges. IEEE Trans. Image Process. 2001, 10, 266–277. [Google Scholar] [CrossRef] [PubMed]
  34. Li, C.; Kao, C.Y.; Gore, J.C.; Ding, Z. Minimization of region-scalable fitting energy for image segmentation. IEEE Trans. Image Process. 2008, 17, 1940–1949. [Google Scholar] [PubMed]
  35. Ali, H.; Rada, L.; Badshah, N. Image segmentation for intensity inhomogeneity in presence of high noise. IEEE Trans. Image Process. 2018, 27, 3729–3738. [Google Scholar] [CrossRef] [PubMed]
  36. Zuiderveld, K. Contrast limited adaptive histograph equalization. In Graphic Gems IV; Academic Press Professional: San Diego, CA, USA, 1994; pp. 474–485. [Google Scholar]
  37. Kumar, K.; Li, J.P.; Khan, S.A.; Mustafa, N.; Shaikh, R.A.; Khan, A. Image edge detection scheme using wavelet transform. In Proceedings of the International Computer Conference on Wavelet Actiev Media Technology and Information Processing, Chengdu, China, 19–21 December 2014; pp. 261–265. [Google Scholar]
  38. Zhang, Q.; Wang, Y.; Wang, W.; Ma, J.; Qian, J.; Ge, J. Automatic segmentation of calcifications in intravascular ultrasound images using snakes and the contourlet transform. Ultrasound Med. Biol. 2010, 36, 111–129. [Google Scholar] [CrossRef] [PubMed]
  39. Balocco, S.; Gatta, C.; Ciompi, F.; Wahle, A.; Radeva, P.; Carlier, S.; Unal, G.; Sanidas, E.; Mauri, J.; Carillo, X.; et al. Standardized evaluation methodology and reference database for evaluating IVUS image segmentation. Comput. Med. Imaging Graph. 2014, 38, 70–90. [Google Scholar] [CrossRef] [Green Version]
Figure 1. The example intravascular ultrasound (IVUS) image (left), and the same image with intravascular structures and artifacts labeled (right).
Applsci 09 04967 g001
Figure 2. The flowchart of the proposed segmentation algorithm.
Applsci 09 04967 g002
Figure 3. Filters for detecting edges. We use a bank of 2D Morlet wavelet kernels distributed in 36 orientations at 10° intervals.
Applsci 09 04967 g003
Figure 4. The definition of the region R o u t outside R o n L o u t is the thickness of R o u t .
Applsci 09 04967 g004
Figure 5. An example of the assignment flow on the regions of interest (ROIs), (a) media-adventitia border (MAB) initialization, (bg) assignment of ROIs in B_1 and update of MAB, (h) B_2, (i) assignment of ROIs in B_2, (j) lumen-intima border (LIB) extraction.
Applsci 09 04967 g005
Figure 6. (a) The cumulative distributions of the percentage of area differences (PADs) in the three experiments. (b) The performance of the superpixel-wise fuzzy clustering technique modified by edges, followed by level set evolution (SFCME-LSE) method on images with different signal-to-noise ratio (SNR).
Applsci 09 04967 g006
Figure 7. Bland–Altman plots (the first column) and the linear regression results (in the second column) for the comparison of areas inside the border detected by the proposed method and the ground truth.
Applsci 09 04967 g007
Figure 9. Comparison of the clustering results from SFCME (the second column) and pixel-wise fuzzy c-means with spatial information (the third column).
Applsci 09 04967 g009
Figure 10. Plots of the indicators and attributions of ROIs when θ a d v e n T θ (left) and θ a d v e n > T θ (right).
Applsci 09 04967 g010
Figure 11. The analysis of the inaccuracy in the extraction of the MAB (①) and LIB (②).
Applsci 09 04967 g011
Figure 8. Examples of the segmentation results on Dataset I (the first three rows) and Dataset II (the last two rows). The green dashed line, cyan dashed line, magenta solid line, and red solid line correspond to the manually annotated lumen-intima border (LIB), the manually annotated media-adventitia border (MAB), the auto-detected LIB, and the auto-detected MAB, respectively.
Applsci 09 04967 g008
Table 1. The workflow of the region of interest (ROI) assignment algorithm.
Step (1)MAB = rectangular bounding border of ROIs in B 1 ;
Vessel center = the image center (Figure 5a);
R o n = the largest ROI in B 1 ; B 1 R o n = 0 ;
Calcification recognition else R o n belongs to the adventitia;
MAB update (Figure 5b);
If θ a d v e n > T θ , go to Step (3); else, go to Step (2).
Step (2) R o n = the largest ROI in B 1 ; B 1 R o n = 0 ; Processing for guidewire artifact;
Execute calcification, adventitia, soft plaque, and lumen recognition sequentially;
MAB update (Figure 5c).
Step (3)A circle is fitted to the MAB;
Vessel center = the center of the fitted circle (Figure 5c);
MAB update (Figure 5d);
If θ a d v e n > T θ , go to Step (5); else, go to Step (4).
Step (4) R o n = the largest ROI in B 1 ; B 1 R o n = 0 ; A o n = Area R o n ; Processing for guidewire artifact;
If A o n < T a r e a , go to Step (7);
Else, execute adventitia, soft plaque, and lumen recognition sequentially;
MAB update (Figure 5e–g);
If θ a d v e n > T θ , go to Step (5); else, go to Step (4).
Step (5)ROIs outside MAB are deleted in B 1 .
Step (6) R o n = the largest ROI in B 1 ; B 1 R o n = 0 ; A o n = Area R o n ; Processing for guidewire artifact;
If A o n < T a r e a , go to Step (7);
Else, execute soft plaque and lumen recognition sequentially;
Go to Step (6).
Step (7)ROIs outside MAB and the ROI containing R c are deleted in B 2 o , the result is denoted by B 2 (Figure 5h).
Step (8) R o n = the largest ROI in B 2 ; B 2 R o n = 0 ; A o n = Area R o n ;
If A o n < T a r e a , go to Step (9);
Else, execute shadow and soft plaque recognition sequentially (Figure 5i);
Go to Step (8).
Step (9)LIB extraction (Figure 5j).
Table 2. Parameter selection in the proposed method.
SymbolDefinitionReferenceValue
Dataset IDataset II
D c The radius of the catheter zone R c Equation (4)43 pixels
L o u t The thickness of the shadow left by a calcificationFigure 423 pixels
T d The distance threshold for guidewire artifact processingSection 3.3.13 pixels
T θ The angle thresholdSection 3.3.2281°
T a r e a The area thresholdSection 3.3.2 100   pixels 2
T a 1 Thresholds for the anatomical indicator D a Section 3.3.312.418.8
T a 2 9.412.4
T a 3 11.517.8
T a 4 38
T s The threshold for the spatial indicator D s −20
T g 1 Thresholds for the grayscale indicator D g 0.730.81
T g 2 0.610.78
T g 3 0.55
T g 4 0.16
μ Parameters controlling level set evolutionEquation (17)0.2
β 1
ν −0.03 (MAB)/0.03 (LIB)
Table 3. The performance of the proposed method on Dataset I. The format is mean (standard deviation).
Experiment 1Experiment 2Experiment 3SFCME-LSE on Images with Different SNR
70 dB50 dB30 dB27 dB25 dB23 dB20 dB
MABJM0.87
(0.06)
0.89
(0.07)
0.91
(0.07)
0.87
(0.13)
0.87
(0.12)
0.87
(0.12)
0.87
(0.12)
0.84
(0.16)
0.79
(0.25)
0.66
(0.33)
HD0.90
(0.49)
0.65
(0.44)
0.65
(0.43)
0.89
(0.80)
0.88
(0.79)
0.87
(0.81)
0.89
(0.81)
1.02
(1.05)
1.17
(1.17)
0.62
(0.37)
PAD0.10
(0.09)
0.09
(0.10)
0.07
(0.09)
0.11
(0.17)
0.10
(0.14)
0.12
(0.21)
0.14
(0.26)
1.19
(1.41)
1.20
(1.29)
0.33
(0.35)
LIBJM0.73
(0.10)
0.80
(0.09)
0.81
(0.09)
0.80
(0.10)
0.80
(0.09)
0.80
(0.10)
0.78
(0.12)
0.77
(0.13)
0.75
(0.15)
0.67
(0.21)
HD1.41
(0.59)
0.88
(0.57)
0.86
(0.57)
0.95
(0.61)
0.97
(0.60)
0.96
(0.58)
1.06
(0.64)
1.07
(0.68)
1.11
(1.65)
1.33
(0.76)
PAD0.32
(0.23)
0.15
(0.15)
0.14
(0.13)
0.15
(0.13)
0.16
(0.14)
0.18
(0.19)
0.25
(0.47)
1.27
(1.52)
1.25
(1.23)
0.33
(0.26)
Table 4. Comparison of the proposed SFCME-LSE method with other published automatic methods. Empty cells mean that the researchers have not given the corresponding result.
MABLIBTime(s)/FrameHardware Used
JMHDPADJMHDPAD
SFCME-LSE0.83 (0.10)1.20 (0.66)0.12 (0.11)0.78 (0.10)1.18 (0.70)0.16 (0.15)11.09Xeon 3.5 GHz
Kermani et al. [20]0.75 (0.13)1.32 (0.99)0.12 (0.12)0.77 (0.13)1.46 (1.23)0.16 (0.15)------
Wang et al. [3]0.83 (0.09)1.27 (0.67)0.12 (0.13)---------272.92Core 4, 2.67 GHz
Essa et al. [18]0.84 (0.10)1.22 (0.72)0.13 (0.15)---------------
Balocco et al. [19]---------0.72 (0.12)1.70 (1.09)0.22 (0.14)13Core 2 Duo, 2.13 GHz
Intra-observer0.91 (0.07)0.85 (0.60)0.06 (0.07)0.92 (0.06)0.67 (0.52)0.05 (0.06)
Inter-observer0.87 (0.11)1.14 (1.00)0.11 (0.14)0.86 (0.10)1.04 (0.95)0.10 (0.10)

