1. Introduction
With the continuous development of offshore wind power, diverse foundations, such as gravity foundation, pile foundation, tripod foundation, jacket foundation, and even floating foundation, have been evaluated as the foundation of offshore wind turbines (OWTs) [
1,
2]. In recent years, bucket foundation has attracted much attention because of its easy construction, convenient transportation, reusability, and good soil applicability. Furthermore, the cost of piling operation can be saved and noise pollution during piling can be avoided. A single bucket with a large diameter or multi-bucket foundations combining several bucket foundations in a regular polygon shape are a potential alternative foundation to improve the bearing capacities of foundations for OWTs.
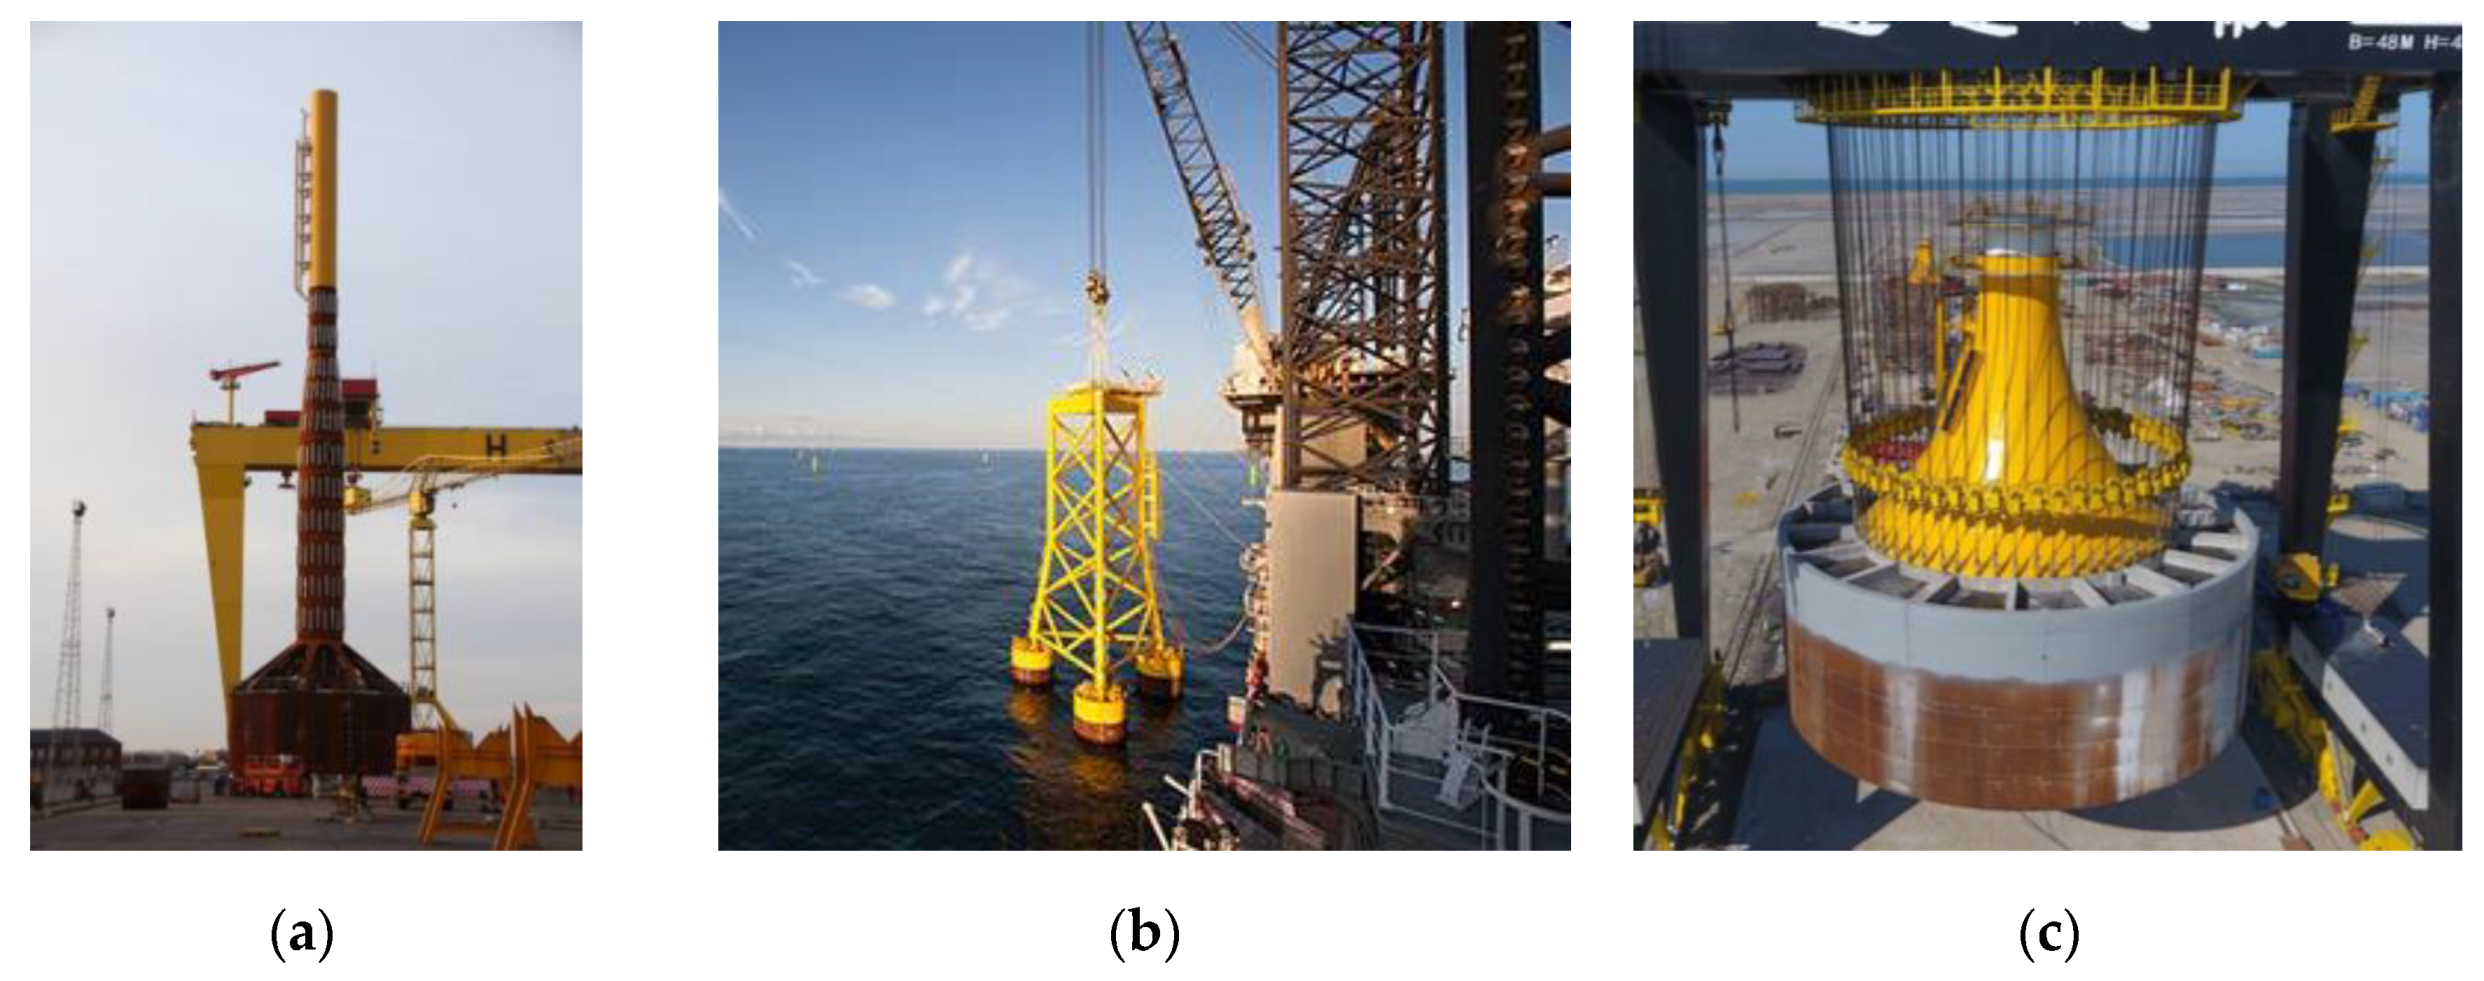
Figure 1 shows the three main types of bucket foundation applied to the engineering practices of OWTs [
3,
4,
5,
6,
7]. A mono bucket foundation (e.g., developed by the Universal Foundation) was applied to the Frederikshavn wind farm in Denmark in 2002; it was used as the foundation of meteorological mast at the Horns Rev2 in Denmark in March 2009 and the Dogger Bank in the UK in September 2012. A suction bucket jacket (SBJ) (developed by DONG Energy) was installed at the Borkum Riffgrund 1 offshore wind farm in Germany in October 2014. A mono bucket with multi compartments (jointly developed by Tianjin University and Daoda Company) was installed in Qidong city. Moreover, a composite bucket foundation (CBF) was used with one-step transportation and installation technology in Sanxia Xiangshui and Dafeng offshore wind farm in China.
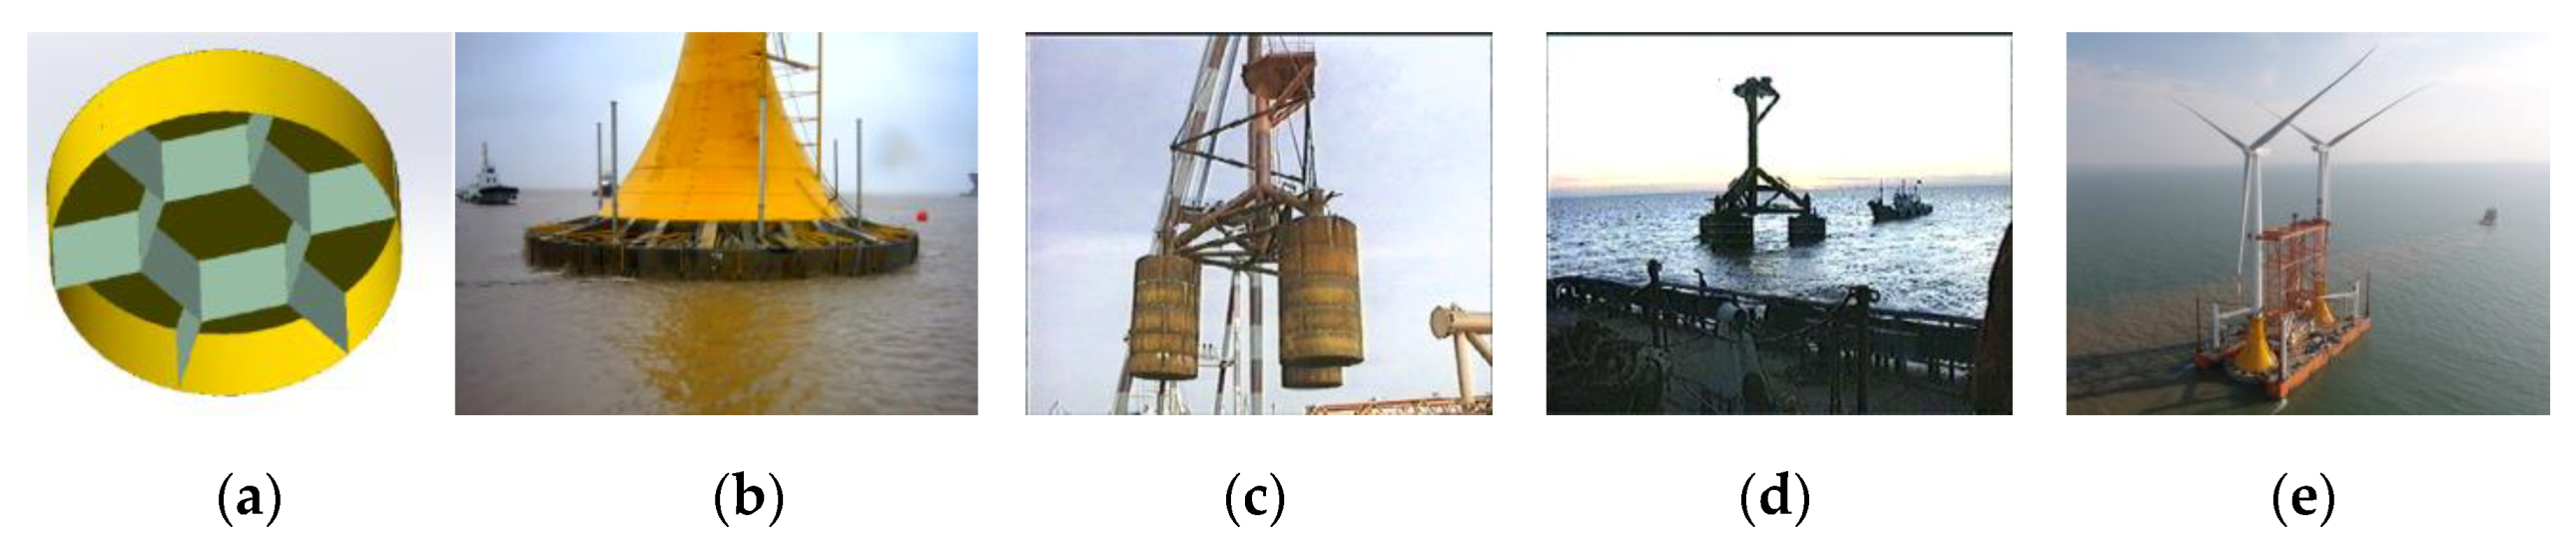
For the mono bucket foundation with several compartments or multi-bucket foundation, air floating technology can be used to transport the structure from the dock to the construction site. This is one of the key technologies for the cost-effective development of bucket foundation for OWTs, as shown in
Figure 2. The key scientific issues related air floating are the interactions between marine environment, construction loads, and structure. Because of open bottom and air compressibility, the air floating characteristics and mechanics of bucket foundation are different from those of conventional rigid bottom float. An ordinary floating body is equivalent to a structure with the foundation supported on a water spring. On the other hand, bucket foundation is equivalent to a structure with a flexible foundation supported on a series of springs coupled with compressible air spring and water spring [
8,
9,
10,
11,
12,
13,
14]. Therefore, to predict the air floating performance of bucket foundations accurately, it is incorrect to use the same parameters and calculation methods used in predicting the hydrodynamic performance and response of traditional rigid bottom platforms or ship structures.
In recent years, studies on air-cushion-supported structures mainly focused on the hydrostatic and hydrodynamic characteristics of structures. In the hydrostatic aspect, based on the perfect air law, Seidl introduced an air-pocket factor to describe the relationship between the compressibility of trapped air and the resulting hydrostatic stiffness of the system [
15]. By considering the air floating structure as a single freedom rigid body and spring system, Bie et al. developed an air floating reducing coefficient, accounting for the difference in the restoring force coefficient between the air floating structures and the conventional buoy. The basic mass in the motion equation should include both the mass of the structure and the mass of the water plug inside the buoy, where the added mass coefficient of heaving is 1.2 [
8]. Thiagarajan et al. showed that the introduction of an air cushion support into a concrete gravity structure (CGS) increases the pitch response, while slightly affecting the heaving motion [
12]. Chenu et al. experimentally evaluated the effect of water plug height and compartmentalization of an air cushion on the metacentric height, heave, and pitch natural frequency and the added mass of an air-cushion-supported box model. The air cushion reduced the stability of vessel and influenced both the natural frequency and added mass in heaving and pitching [
16]. Thiagarajan developed a correction formula for the metacentric height incorporating the net effect of an air cushion on the static stability of a compartmented structure [
17]. Kessel presented a non-dimensional parameter that considers the compressibility factor of an air cushion. The parameter can be used to correct the heave, roll, and pitch restoring coefficients [
18].
In the hydrodynamic aspect, using the three-dimensional diffraction–radiation theory, Pinkster et al. studied the motion of structures both partially and completely supported by air cushions in waves [
19,
20,
21]. The results are consistent with those of Tabeta’s model test [
22]. Malenica and Zalar extended Pinkster’s method and calculated and analyzed the hydrodynamic coefficients of the heaving motion of an air cushion support structure [
23]. Using the boundary integral equation method, Gueret and Hermans extended Malenica’s and Zalar’s work and analyzed the hydrodynamic coefficients and internal free surface changes of an air-cushion-supported structure at zero speed in regular waves [
24]. Using the three-dimensional potential flow theory and linearized adiabatic law, Kessel and Pinkster calculated the motion responses and wave loads of a rectangular barge with partial buoyancy provided by an air cushion in waves. The effects of different forms of subdivision on the motions and loads of structure were evaluated by comparing with the results of model tests [
25,
26]. Using a 1/20-scale physical model and hydrodynamic software MOSES, Le et al. experimentally evaluated the effect of towing speed, water depth, free-board height, and wave direction on the air floating towing behavior of a multibucket foundation platform [
27]. Using MOSES, Zhang et al. studied the hydrodynamic motion of self-floating towing for a large prestressed concrete bucket foundation (LPCBF) [
7]. The hydrodynamic response of large floater with an air cushion not only depends on the wave conditions but also on the mass of water column, the height of the air cushion, and air pressure distribution. Using MOSES and physical model experiments, Zhang et al. developed a one-step integrated transportation and installation technique to minimize the offshore operation and maximize the proportion of work carried out onshore with cost, quality, and safety benefits. The dynamic and kinematic characteristics for the transportation system with different drafts and air pressures in the bucket were obtained. A smaller draft and a larger air cushion contribute to safe transportation [
7].
In the design stage, OWTs with a large power rate should be installed at deeper water than 20 m and subjected to strong horizontal and moment loadings by the wind, wave, and current [
28]. Therefore, the large-diameter multi-bucket foundation (LDMBF) is well suited for OWTs at deeper water. The wave diffraction and hydrodynamic interactions between bucket foundations are more complex with increasing diameters of the bucket during air floating transportation. Although previous studies explained the draft, compartments, water depth, and wave effect on the motion of air-cushion-supported structures, the motion response of large-diameter tripod bucket foundations (LDTBFs) has been rarely studied. This study aimed to predict the hydrodynamic motion response of LDTBFs with an air cushion used to support each bucket foundation. The response amplitude operators (RAOs) of LDTBF with different sizes under given conditions were experimentally evaluated. The experimental results were compared with the simulation results obtained using MOSES to evaluate the motion characteristics of heave and pitch of LDTBF, mainly to analyze the effect of draught, water depth, and spacing between bucket foundations.
2. Theoretical Formulation
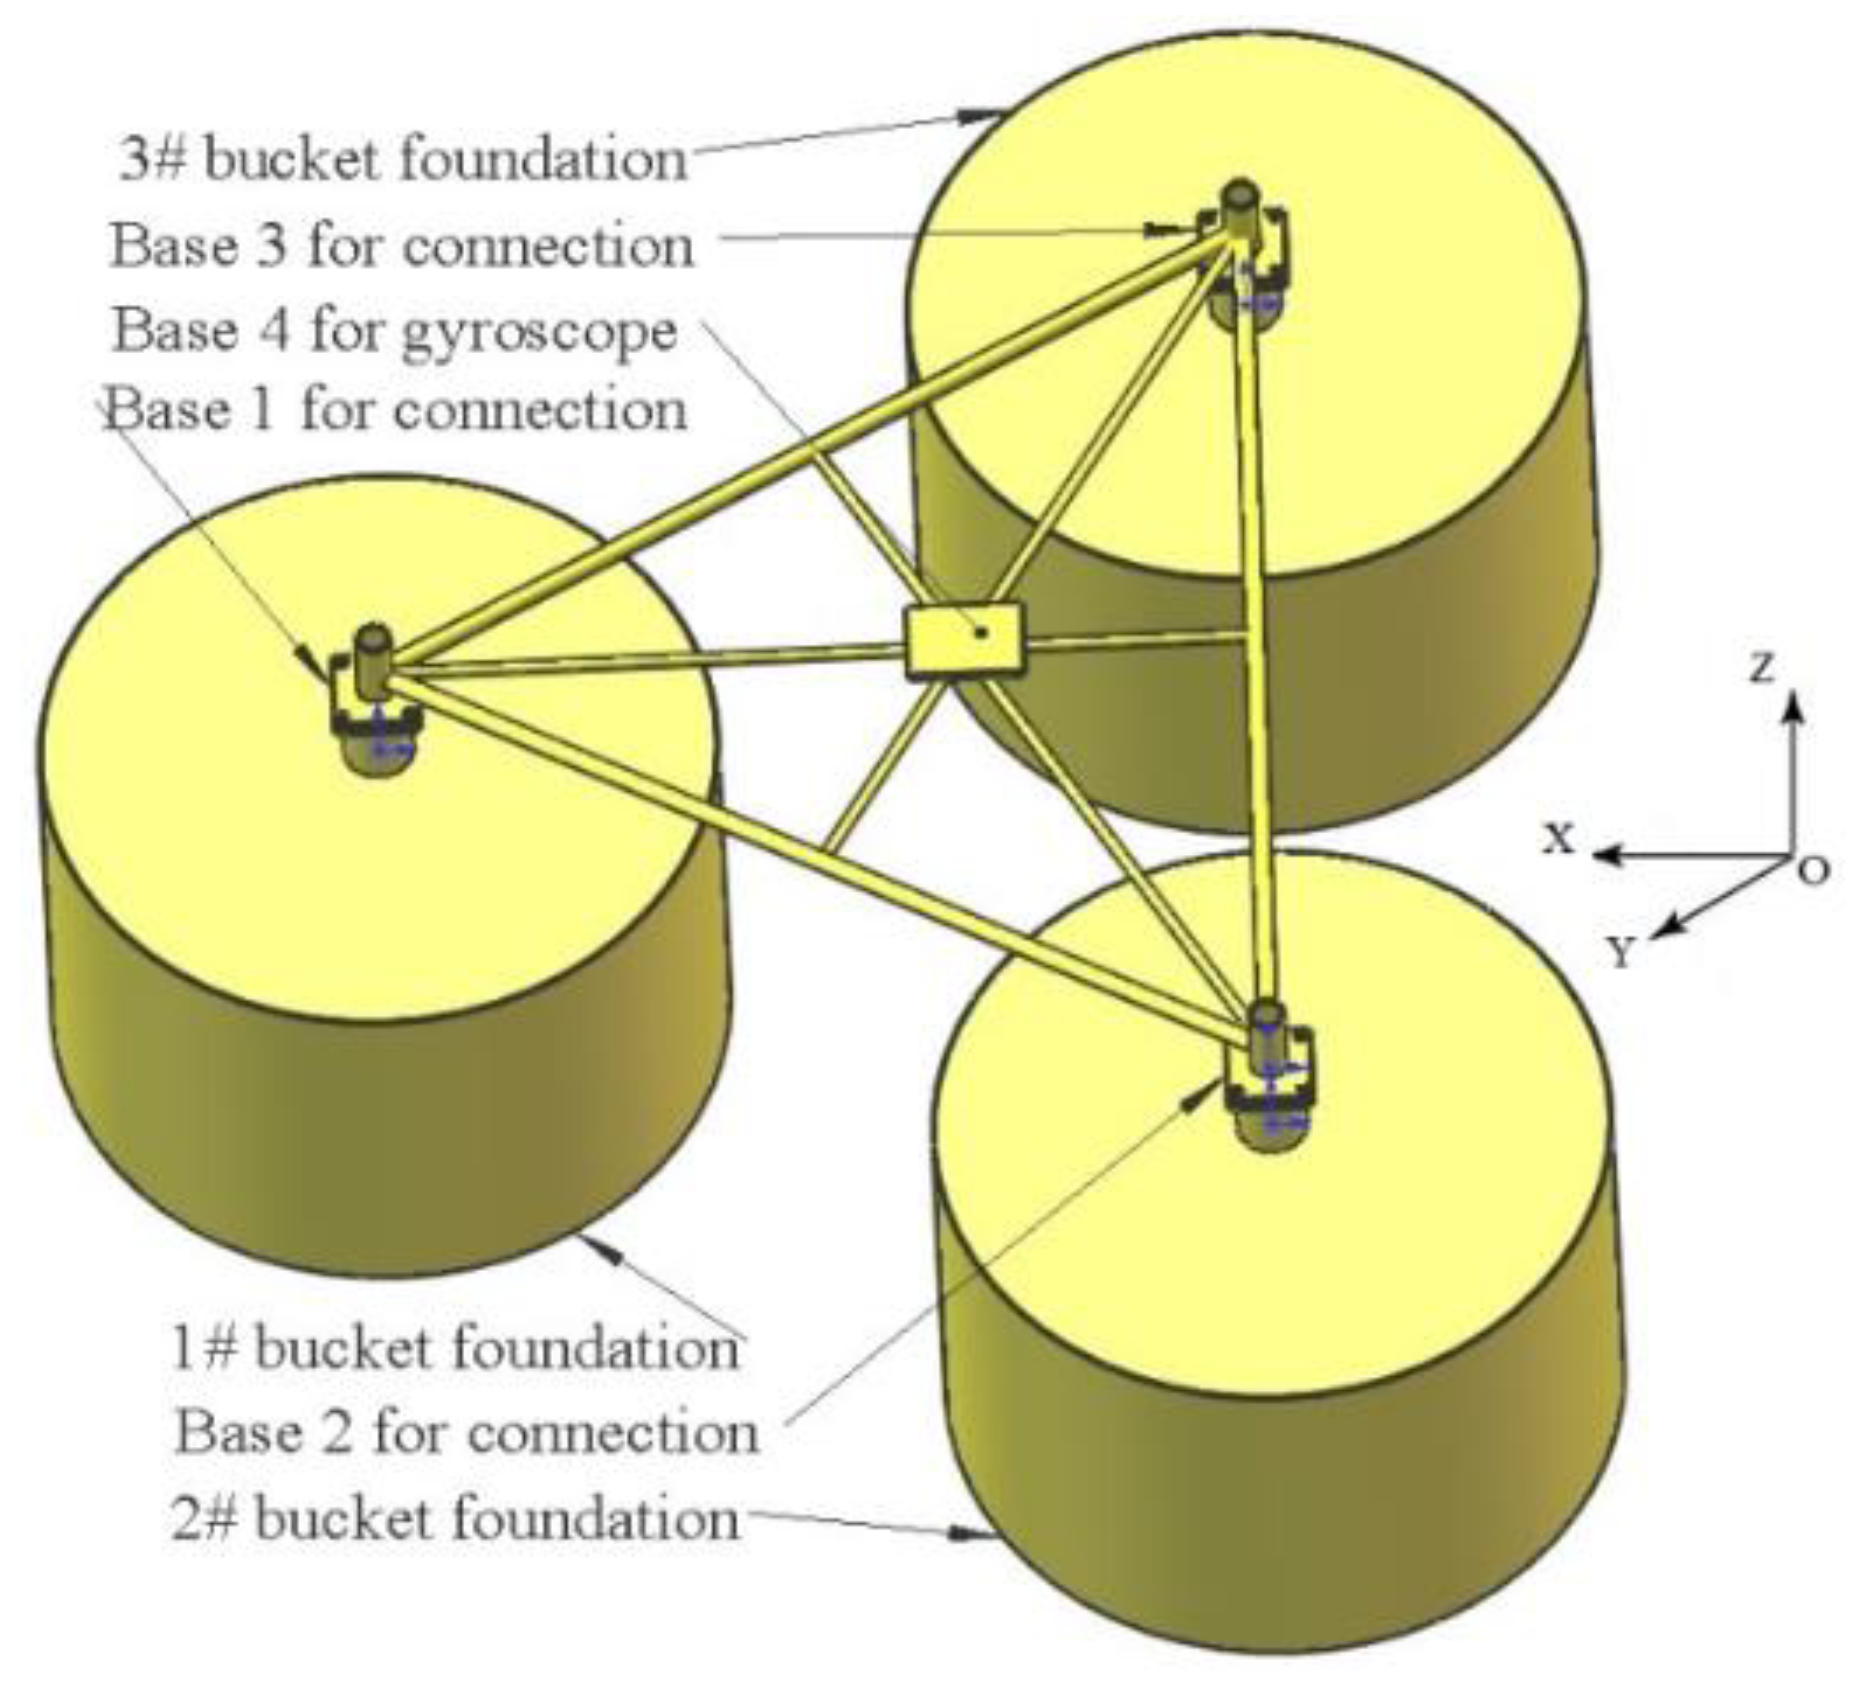
As shown in
Figure 3, the local coordinate system
was used. The origin of coordinate is located at the center of top of bucket. The positive directions of the
axis and the
axis are right and upward, respectively. The
axis is determined using the corkscrew rule. The diameter of bucket foundation is
D. Because the bucket foundation is a thin-walled structure, the effect of thickness on the characteristics of bucket foundation can be neglected. The cross-sectional area of foundation is
; the height is
; the draft is
; the height of freeboard is
; the structural mass is
. The difference of water head between the external and interior water surface is
; the height of the air column in the bucket is
. The atmospheric pressure outside the bucket is
. The weight
and pressure
at the internal air–water interface can be expressed as follows [
7,
16]:
where
is the density of water;
is the acceleration due to gravity;
is buoyancy with the coordinates of floating center at
.
5. Results and Discussion
In
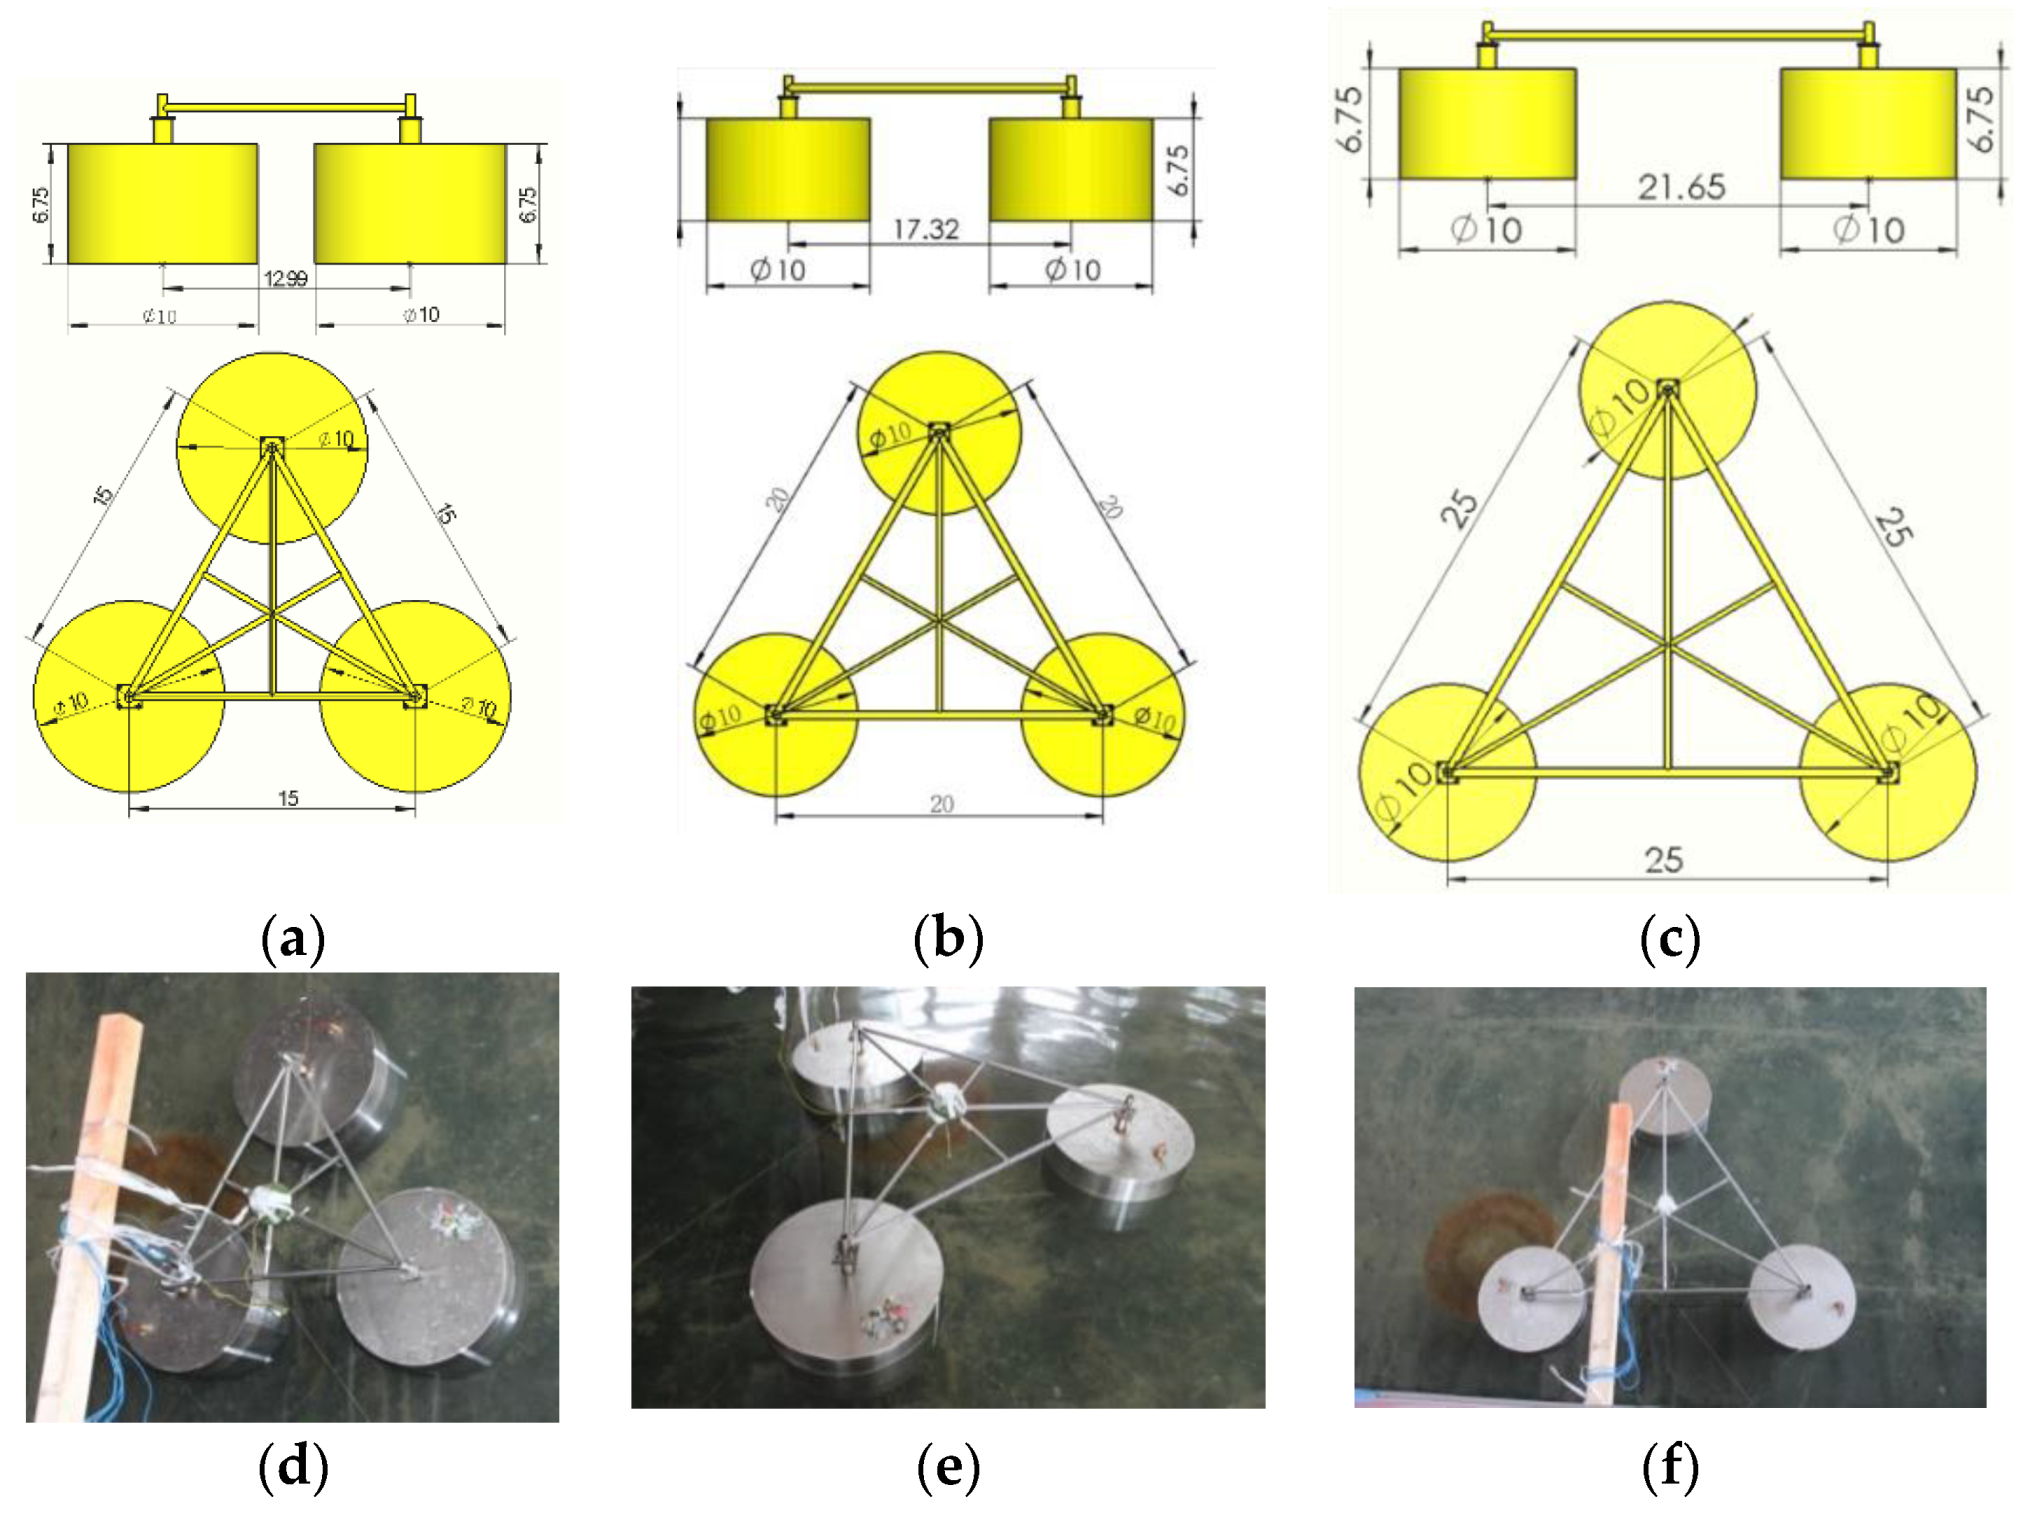
Section 3, the similarity scale for the models of the prototypes of LDTBF is based on geometric similarity and gravity similarity. The similarity ratio of translational accelerations in surge, sway, and heave motions and the rotational angles in roll, pitch, and yaw motions are all 1/1. Furthermore, LDTBF is usually transported to the installation site with 1# bucket in front, 2# and 3# buckets in rear in practical operation [
33]. The safer transportation and construction are guaranteed by the better motion response characteristics of heave and pitch under the coupled marine environmental loads. The maximum amplitudes of heave translation (M
heave) and pitch rotation (M
pitch) of LDTBF were obtained from the test data and the wave amplitudes (H
i) for each period were measured using the wave gauges. The heave and pitch RAOs are defined as M
heave/H
i and M
pitch/H
i, respectively. For comparison with MOSES results; all the graphs for RAOs are shown at the prototype scale.
The comparisons of RAOs for heave acceleration and pitch angle between the experimental tests and MOSES numerical simulations for Model 1, Model 2, and Model 3 at a 10.0 m water depth and 4.5 m draught conditions are shown in
Figure 9. The maximum amplitudes occurred in the vicinity of natural periods of heave and pitch motions. The experimental and simulated results in the heaving direction are consistent, while the results in the pitching direction agree very well irrespective of the trend or values, i.e., the air floating hydrodynamics characteristics of LDTBF in the waves can be treated as a three-dimensional scattering problem based on the linear potential theory. Further theoretical analysis for LDTBF can be strengthened in this aspect.
5.1. Effect of Draft
From the perspective of the structure’s own performance, as shown in
Table 1,
Table 2 and
Table 3, the bucket foundations used in laboratory tests have the same diameter and weight; no large difference is observed in the weights of connecting frames. Therefore, the masses of Model 1, Model 2, and Model 3 involved in the oscillating motions are basically identical under the same draught. However, the mass and moment of inertia increase with increasing draught in the case of the same model, and the moment of initial significantly increases with increasing spacing of bucket foundation under the same draught.
Table 4,
Table 5 and
Table 6 show that the pressure heads in each bucket, provided by the difference of heads between external heads outside the bucket and interior heads inside the bucket, supported the weight of LDTBF. The relationship between pressure head and weight of structure is positive. From the perspectives of wave-induced loads on structure, the forces and motion responses of LDTBF are inevitably affected with the increase in draft, the increase in the distance between the structure and the seabed and the surface area of the wave action and the reduction of the gravity center.
Figure 10,
Figure 11 and
Figure 12 show the motion performances of Model 1, Model 2, and Model 3 with different drafts.
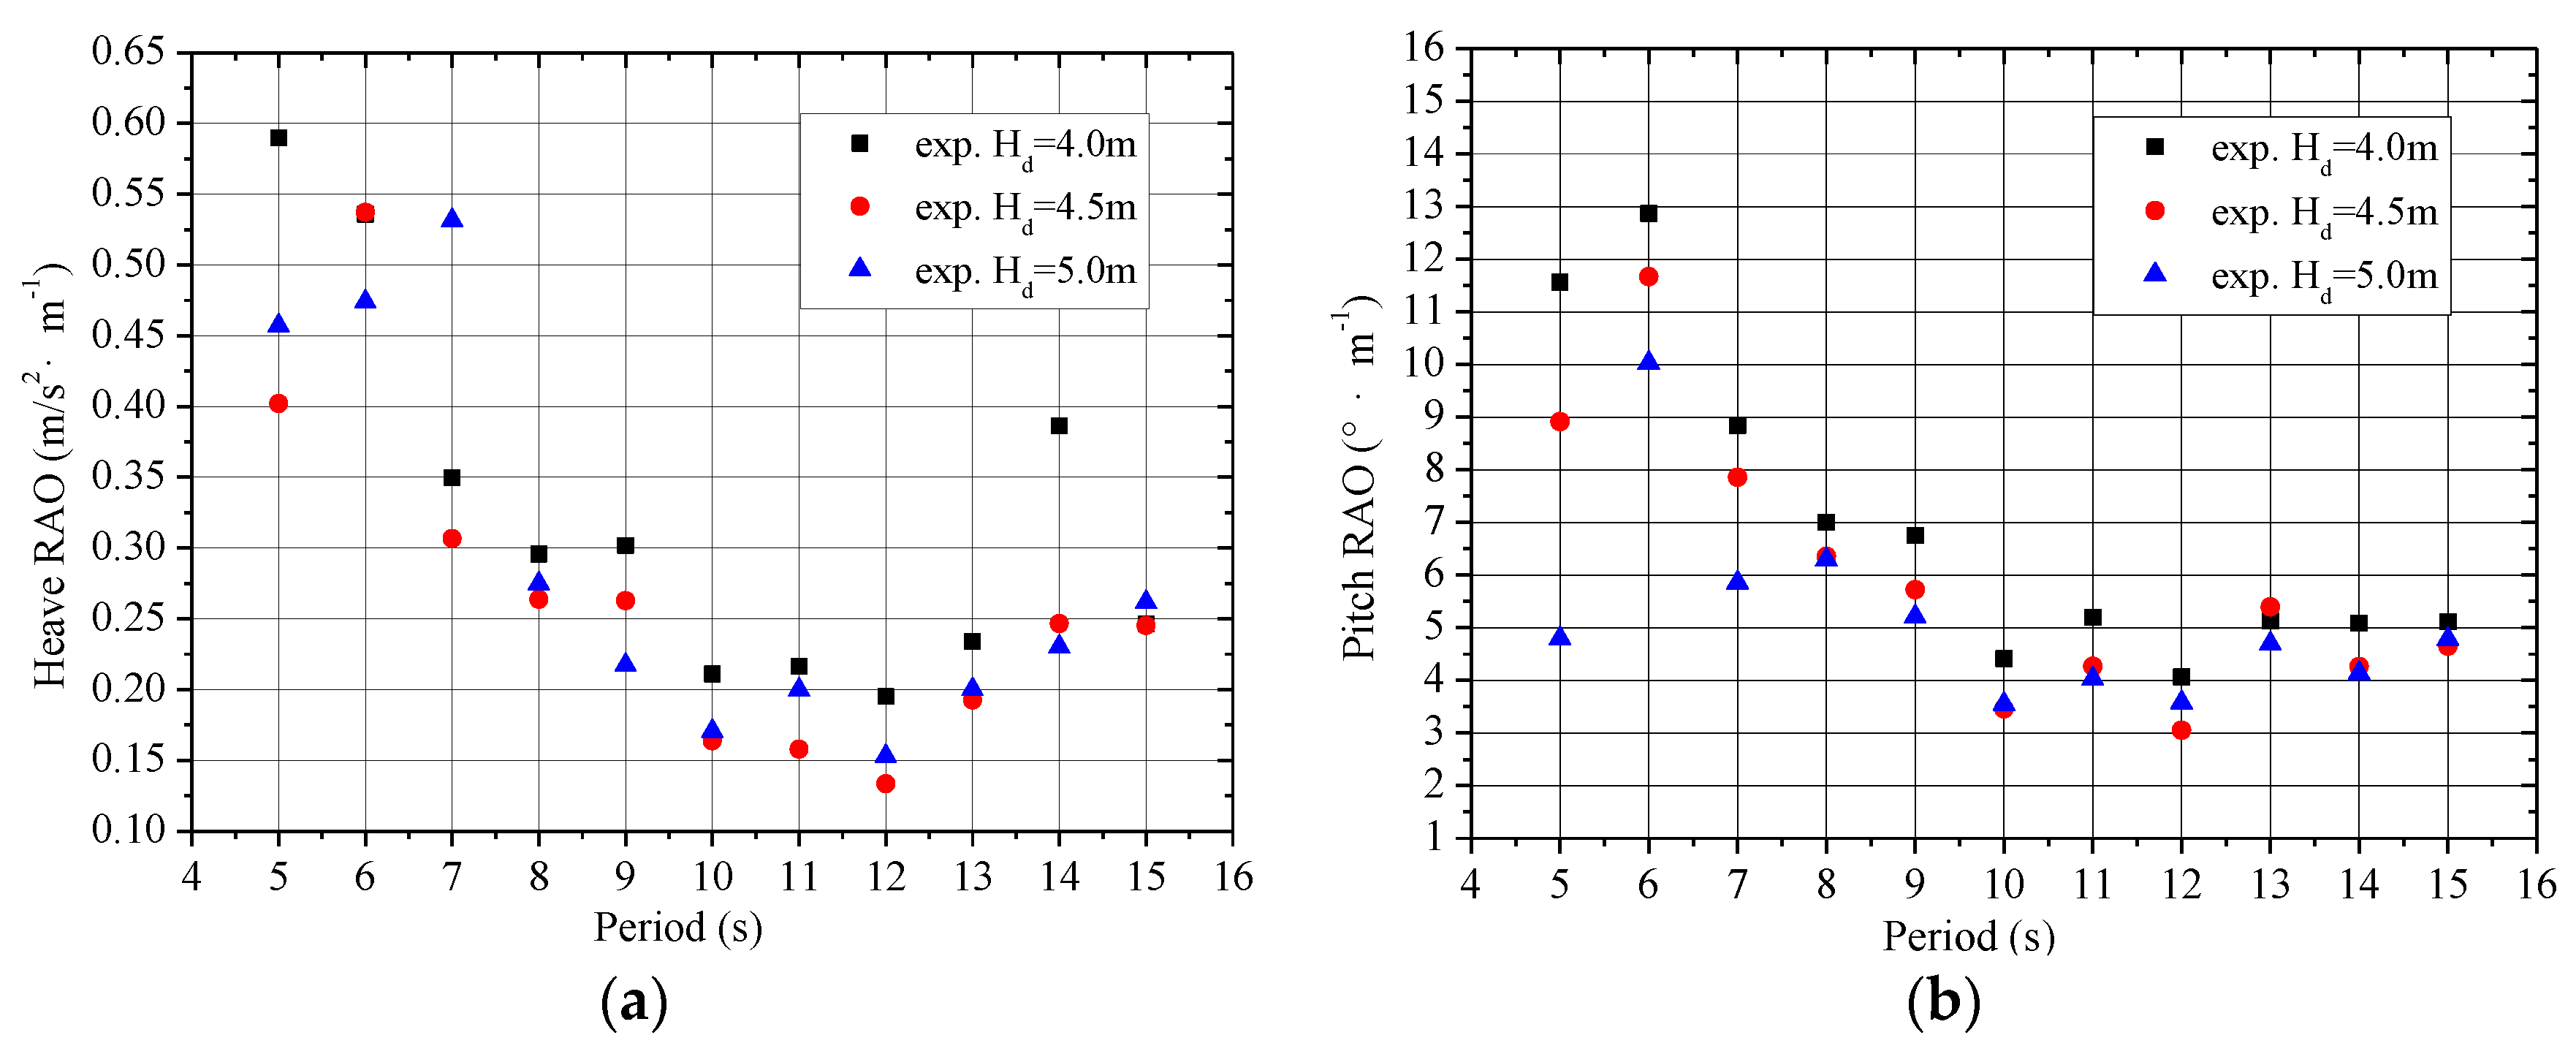
The RAOs of heave acceleration for Model 1 with different drafts at a constant 12.5 m water depth are shown in
Figure 10a. The maximum amplitudes of heave acceleration 0.59 m/s
2 at a 4.0 m draft, 0.54 m/s
2 at a 4.5 m draft, and 0.53 m/s
2 at a 5.0 m draft occurred near the period of 5 s, 6 s, and 7 s, respectively, i.e., the resonant periods of heaving motion increased with increasing draft, while the motion responses decreased with the increase in draft. When the period was longer than 7 s, the amplitudes of heave acceleration first decreased and then increased slightly with increasing draft. The larger the wave period, the more significant the trend. The heave acceleration at a 4.5 m draft is almost smaller in most periods.
The RAOs of pitch angle for Model 1 with different drafts at a constant 12.5 m water depth are shown in
Figure 10b. The maximum amplitudes of pitch angle appearing near the period of 6 s were 12.9° at a 4.0 m draft, 11.7° at a 4.5 m draft, and 10.0° at a 5.0 m draft. The pitch responses decreased with increasing draft and especially had a significant trend when the period was less than 9 s. When the period was longer than 9 s, the pitch angles varied from 4° to 5°.
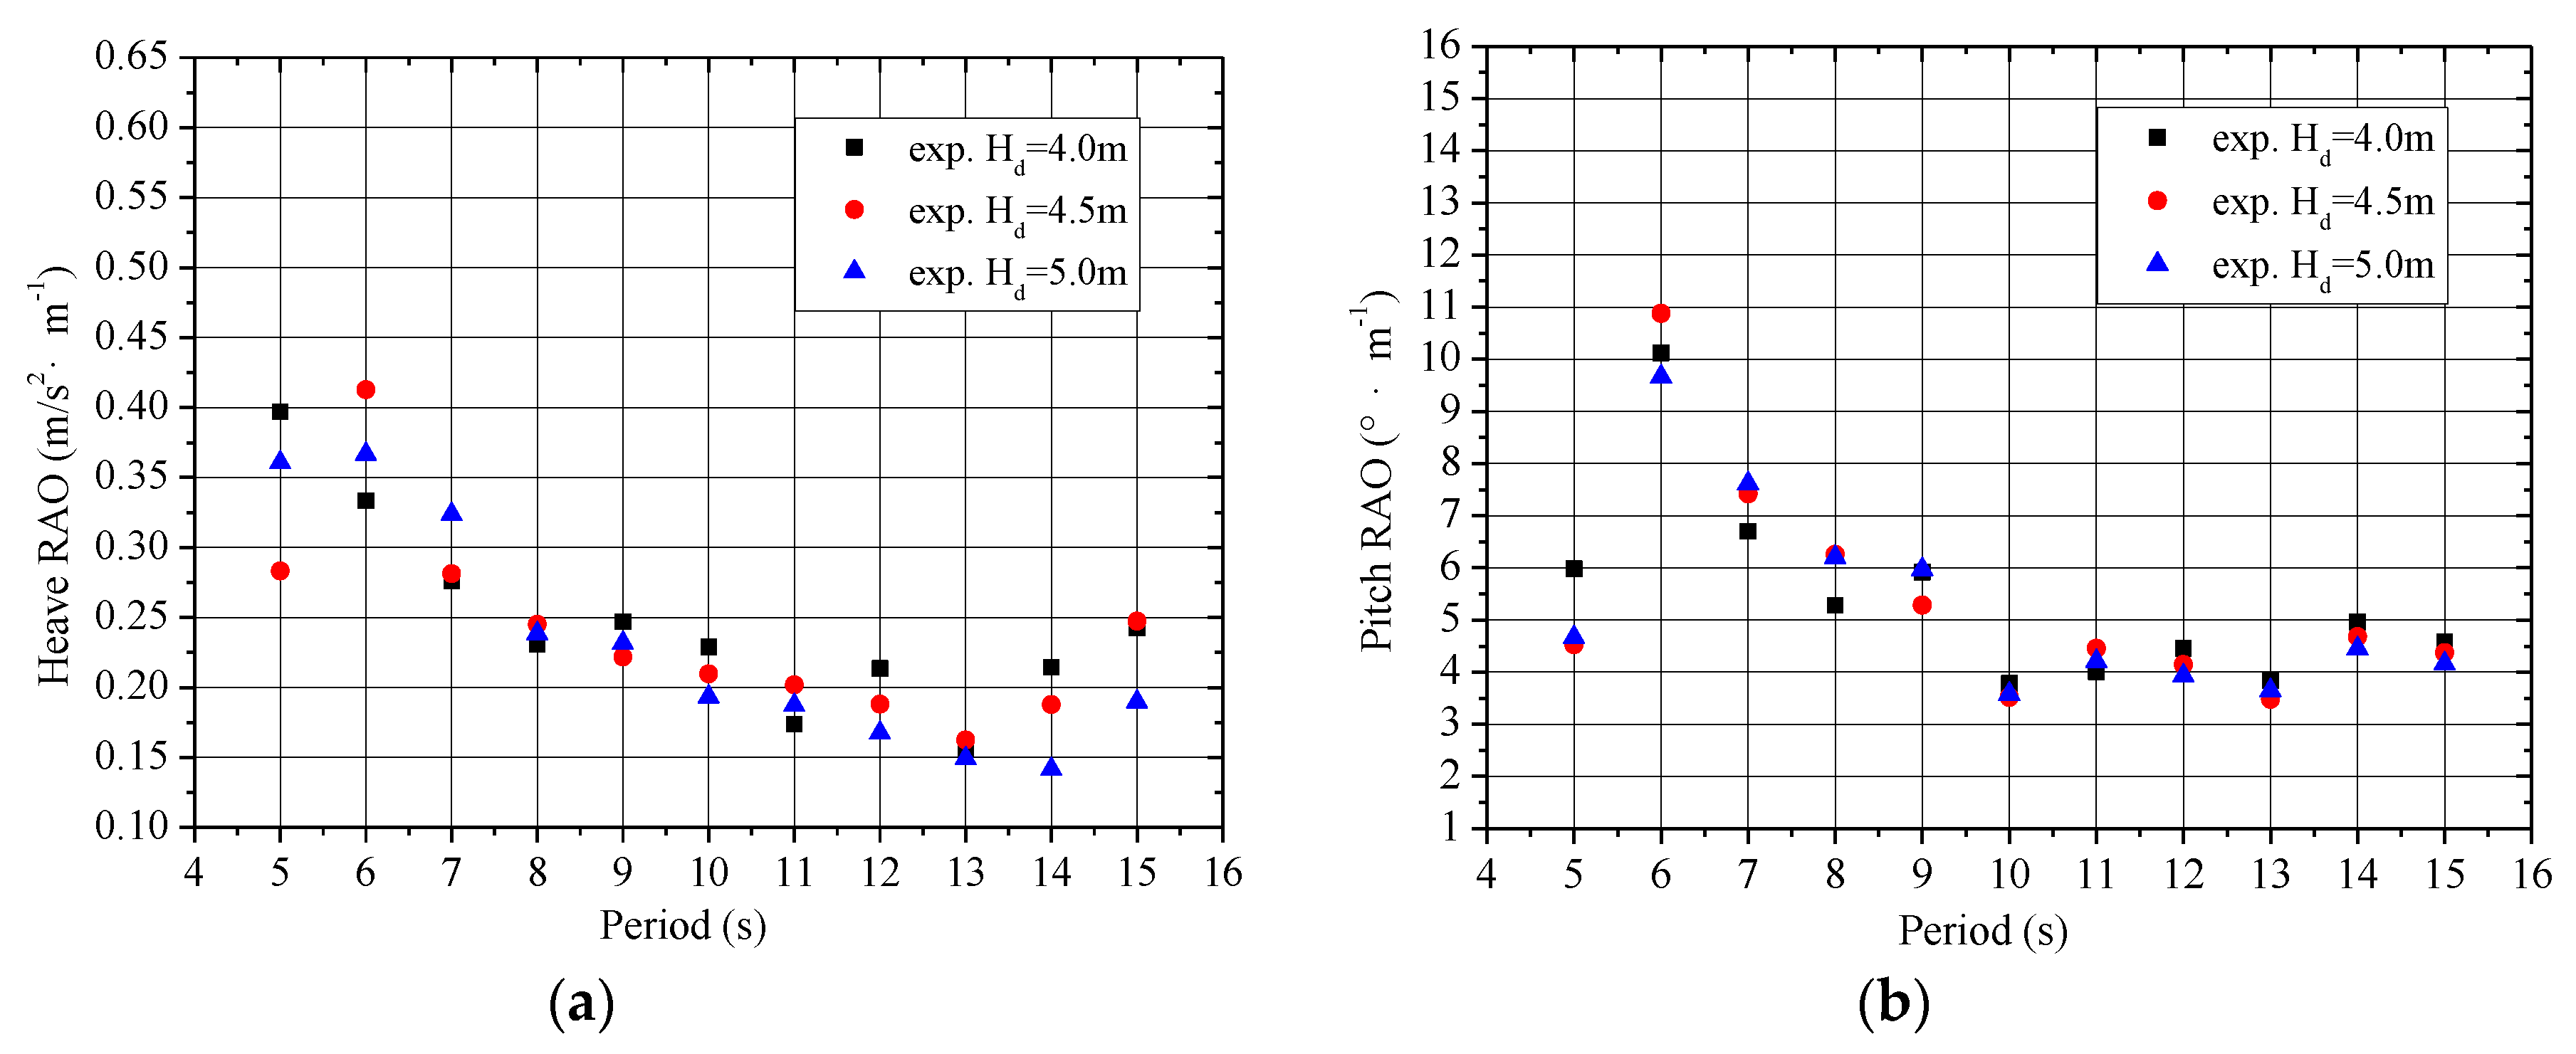
The RAOs of heave acceleration for Model 2 with different drafts at a constant 12.5 m water depth are shown in
Figure 11a. The maximum amplitudes of heave acceleration, 0.397 m/s
2 at a 4.0 m draft, 0.41 m/s
2 at a 4.5 m draft, and 0.36 m/s
2 at a 5.0 m draft, occurred near the period of 5 s, 6 s, and 6 s, respectively. The resonant periods of heaving motion increased with increasing draft, while the motion responses first increased and then decreased with the increase in draft. The amplitudes of heave acceleration decreased with increasing draft when the period was greater than 7 s. With a longer period, the heave RAOs were almost constant at 0.2 m/s
2.
The RAOs of pitch angle for Model 2 with different drafts at a constant 12.5 m water depth are shown in
Figure 11b. The maximum amplitudes of pitch angle appearing near the period of 6 s were 10.12° at a 4.0 m draft, 10.88° at a 4.5 m draft, and 9.66° at a 5.0 m draft, respectively. The pitch responses first increased and then decreased with the increase in draft. The amplitude change for pitch angles of 5–9 s around the resonant period is significantly larger than that of 9–15 s. With a longer period, the RAOs of pitch angles were almost constant at 4.0°.
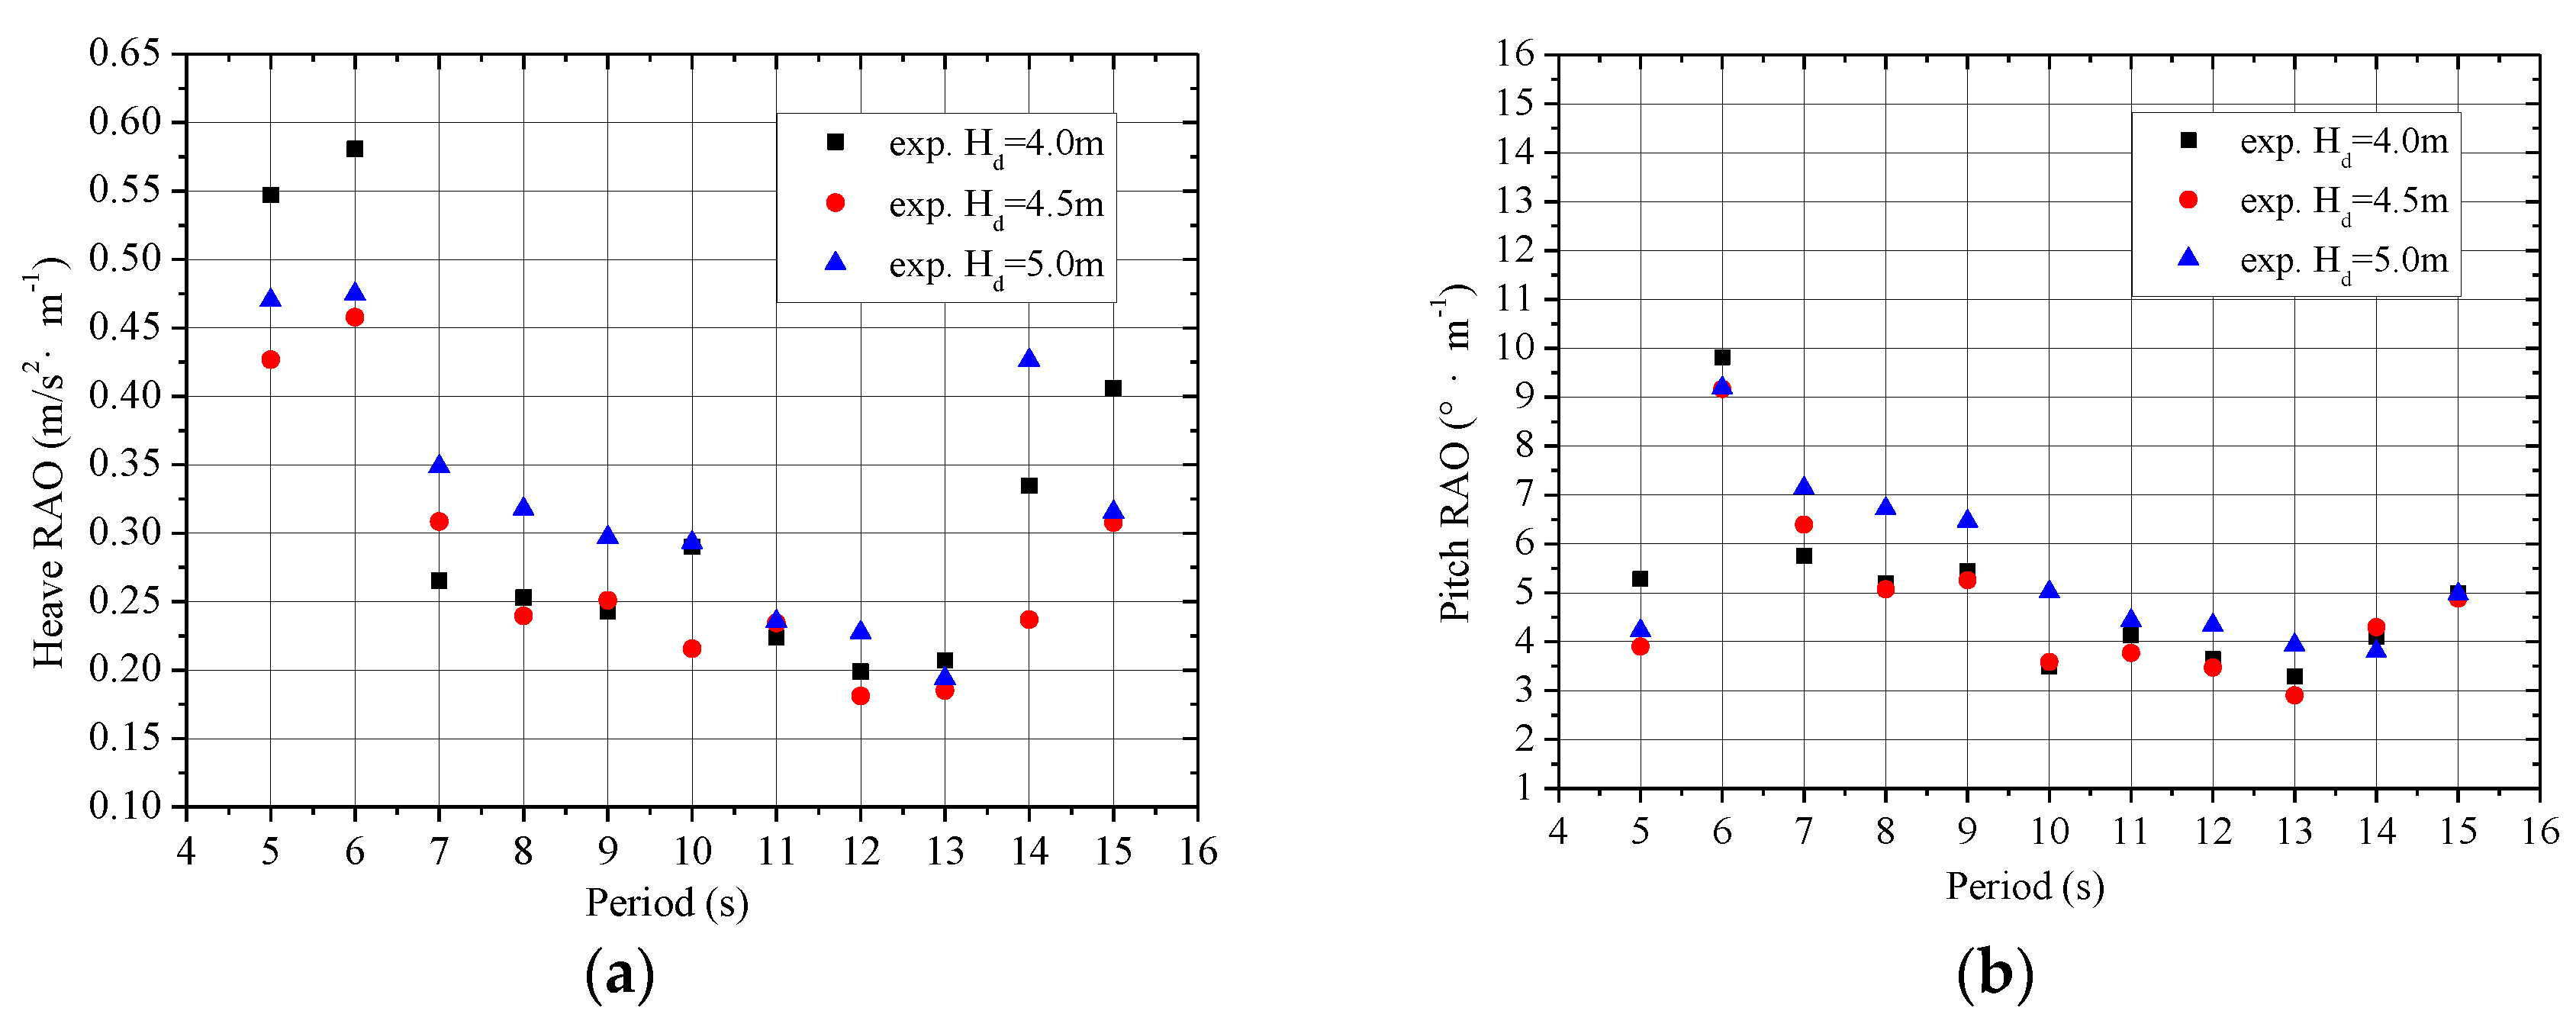
The RAOs of heave acceleration for Model 3 with different drafts at a constant 12.5 m water depth are shown in
Figure 12a. The maximum amplitudes of heave acceleration, 0.58 m/s
2 at a 4.0 m draft, 0.46 m/s
2 at a 4.5 m draft, and 0.47 m/s
2 at a 5.0 m draft, all occurred near the period of 6 s. The responses of heave acceleration first decreased and then increased with the increase in draft. Outside the range of the resonant period, the responses of heave acceleration with a draft of 5.0 m are significantly larger than those of 4.0 m and 4.5 m draft, whereas the responses of heave acceleration at 4.5m draft are almost the smallest in all periods.
The RAOs of pitch angle for Model 3 with different drafts at a constant 12.5 m water depth are shown in
Figure 12b. The period for amplitudes of pitch angle occurred at 6 s with different drafts. With increasing draft from 4.0 m to 4.5 m, the maximum value of pitch RAO decreased from 9.82° to 9.17°. However, the maximum value of pitch RAO only increased by 0.02° when the draft increased from 4.5 m to 5.0 m. The pitch angles at 4.5 m draft are almost smaller than those of other drafts in most periods.
5.2. Effect of Water Depth
In ship structures, the vertical planar motion (heave and pitch) of a structure is enhanced in shallow water [
12,
34,
35,
36]. The water depth from seabed to wave surface did not change in space and time during the transportation of LDTBF. During the towing of structures from deep water to shallow water, the wavelength becomes shorter, the wave velocity becomes slower, and the clearance between the bottoms of LDTBF to the seabed becomes smaller. The gravity center sinks due to the blocking effect of ocean fluid, equivalent to adding an increment to the draft of structure. During the towing of structure from shallow water to deep water, the wave exciting forces acting on the structure also change with a larger wavelength and a faster wave velocity.
Figure 13,
Figure 14 and
Figure 15 show the motion performances of Model 1, Model 2, and Model 3 with different water depths.
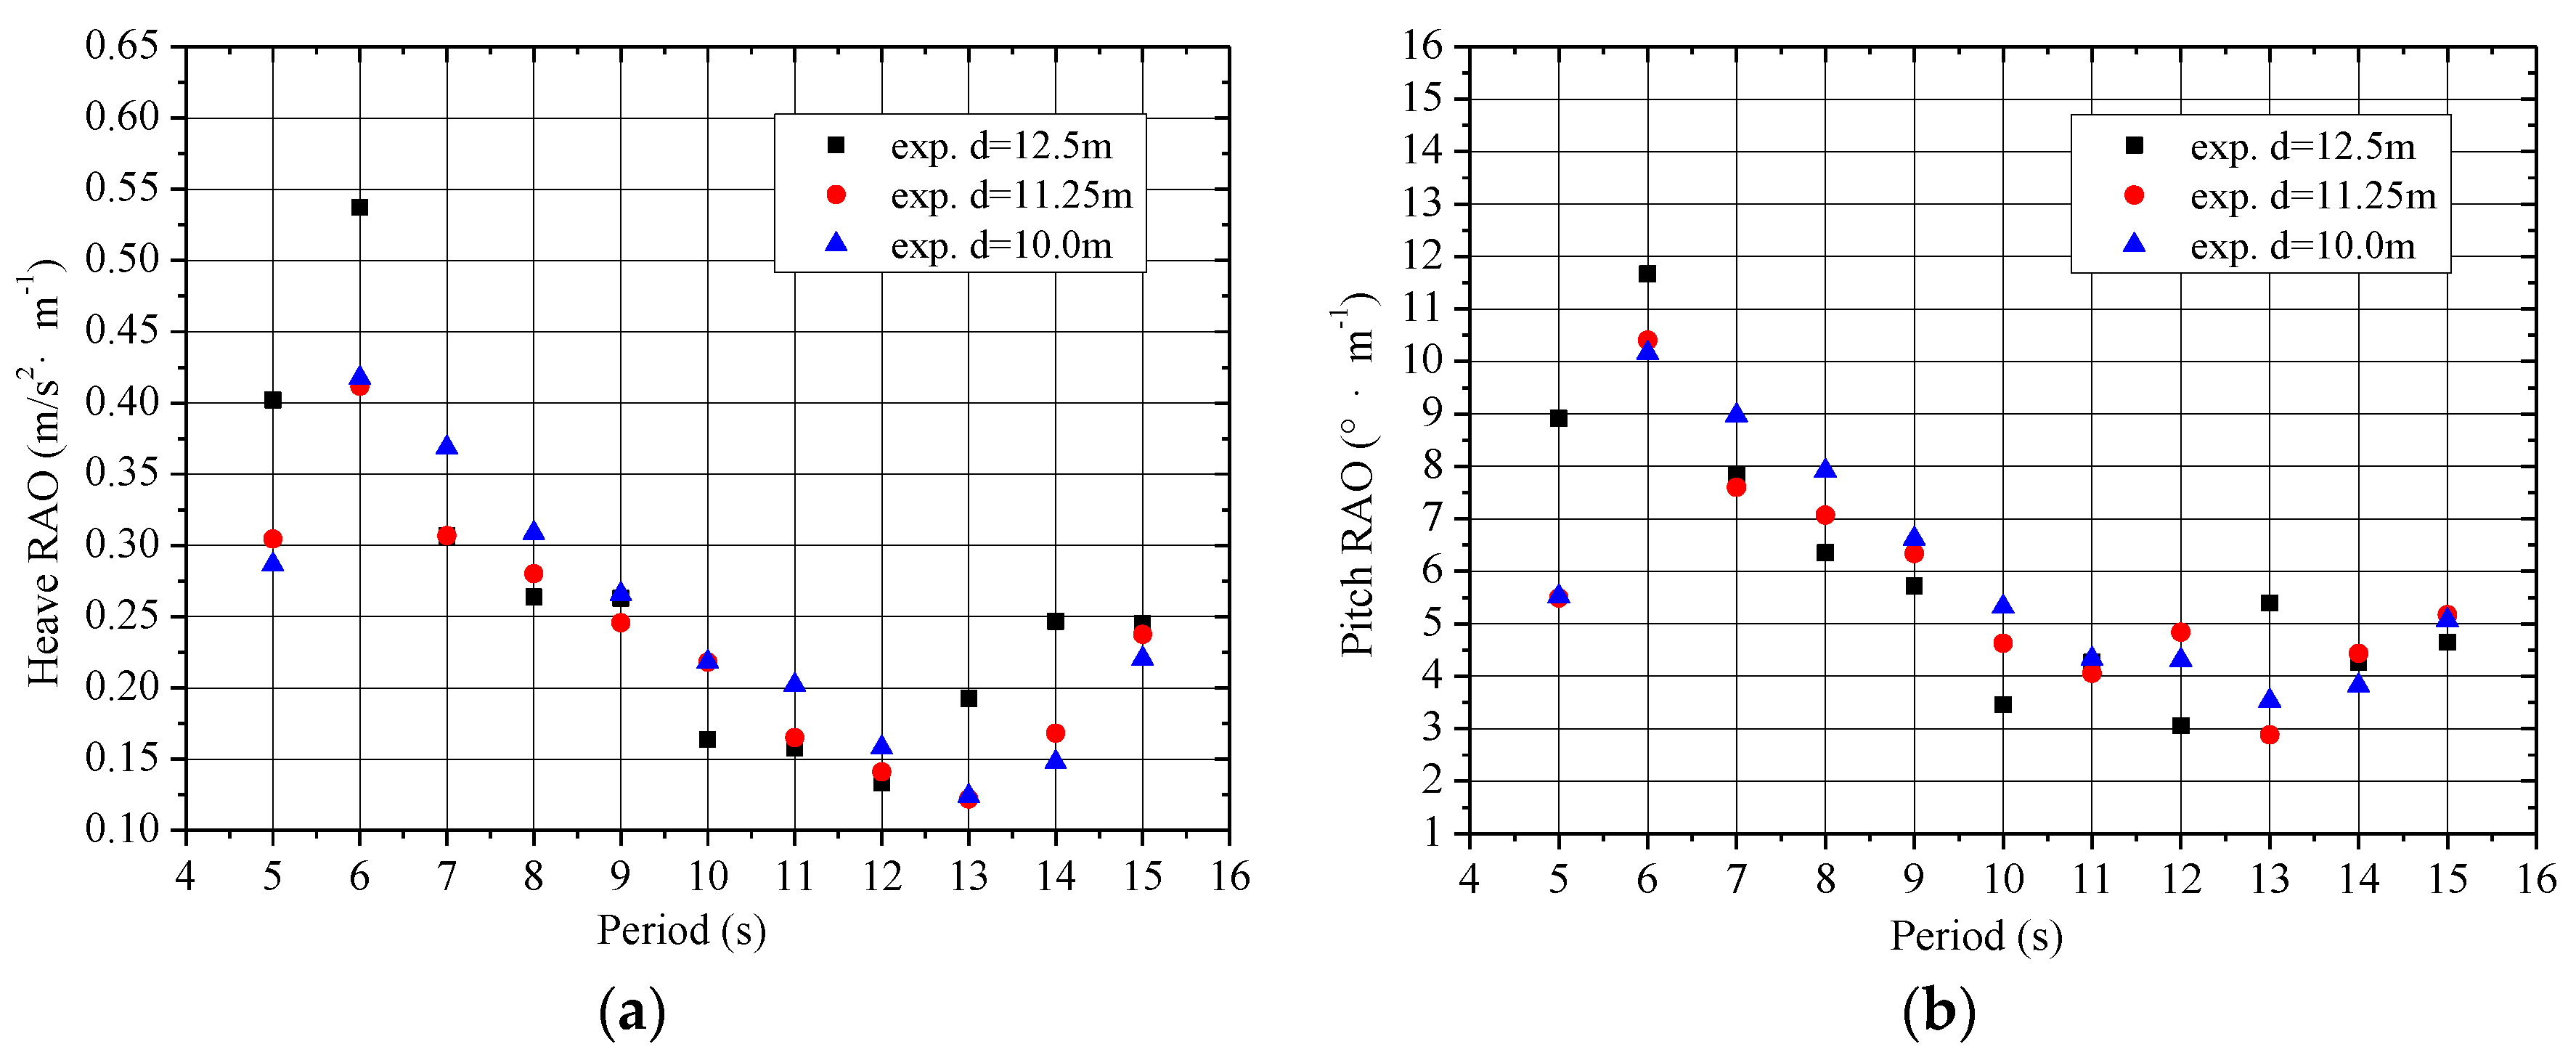
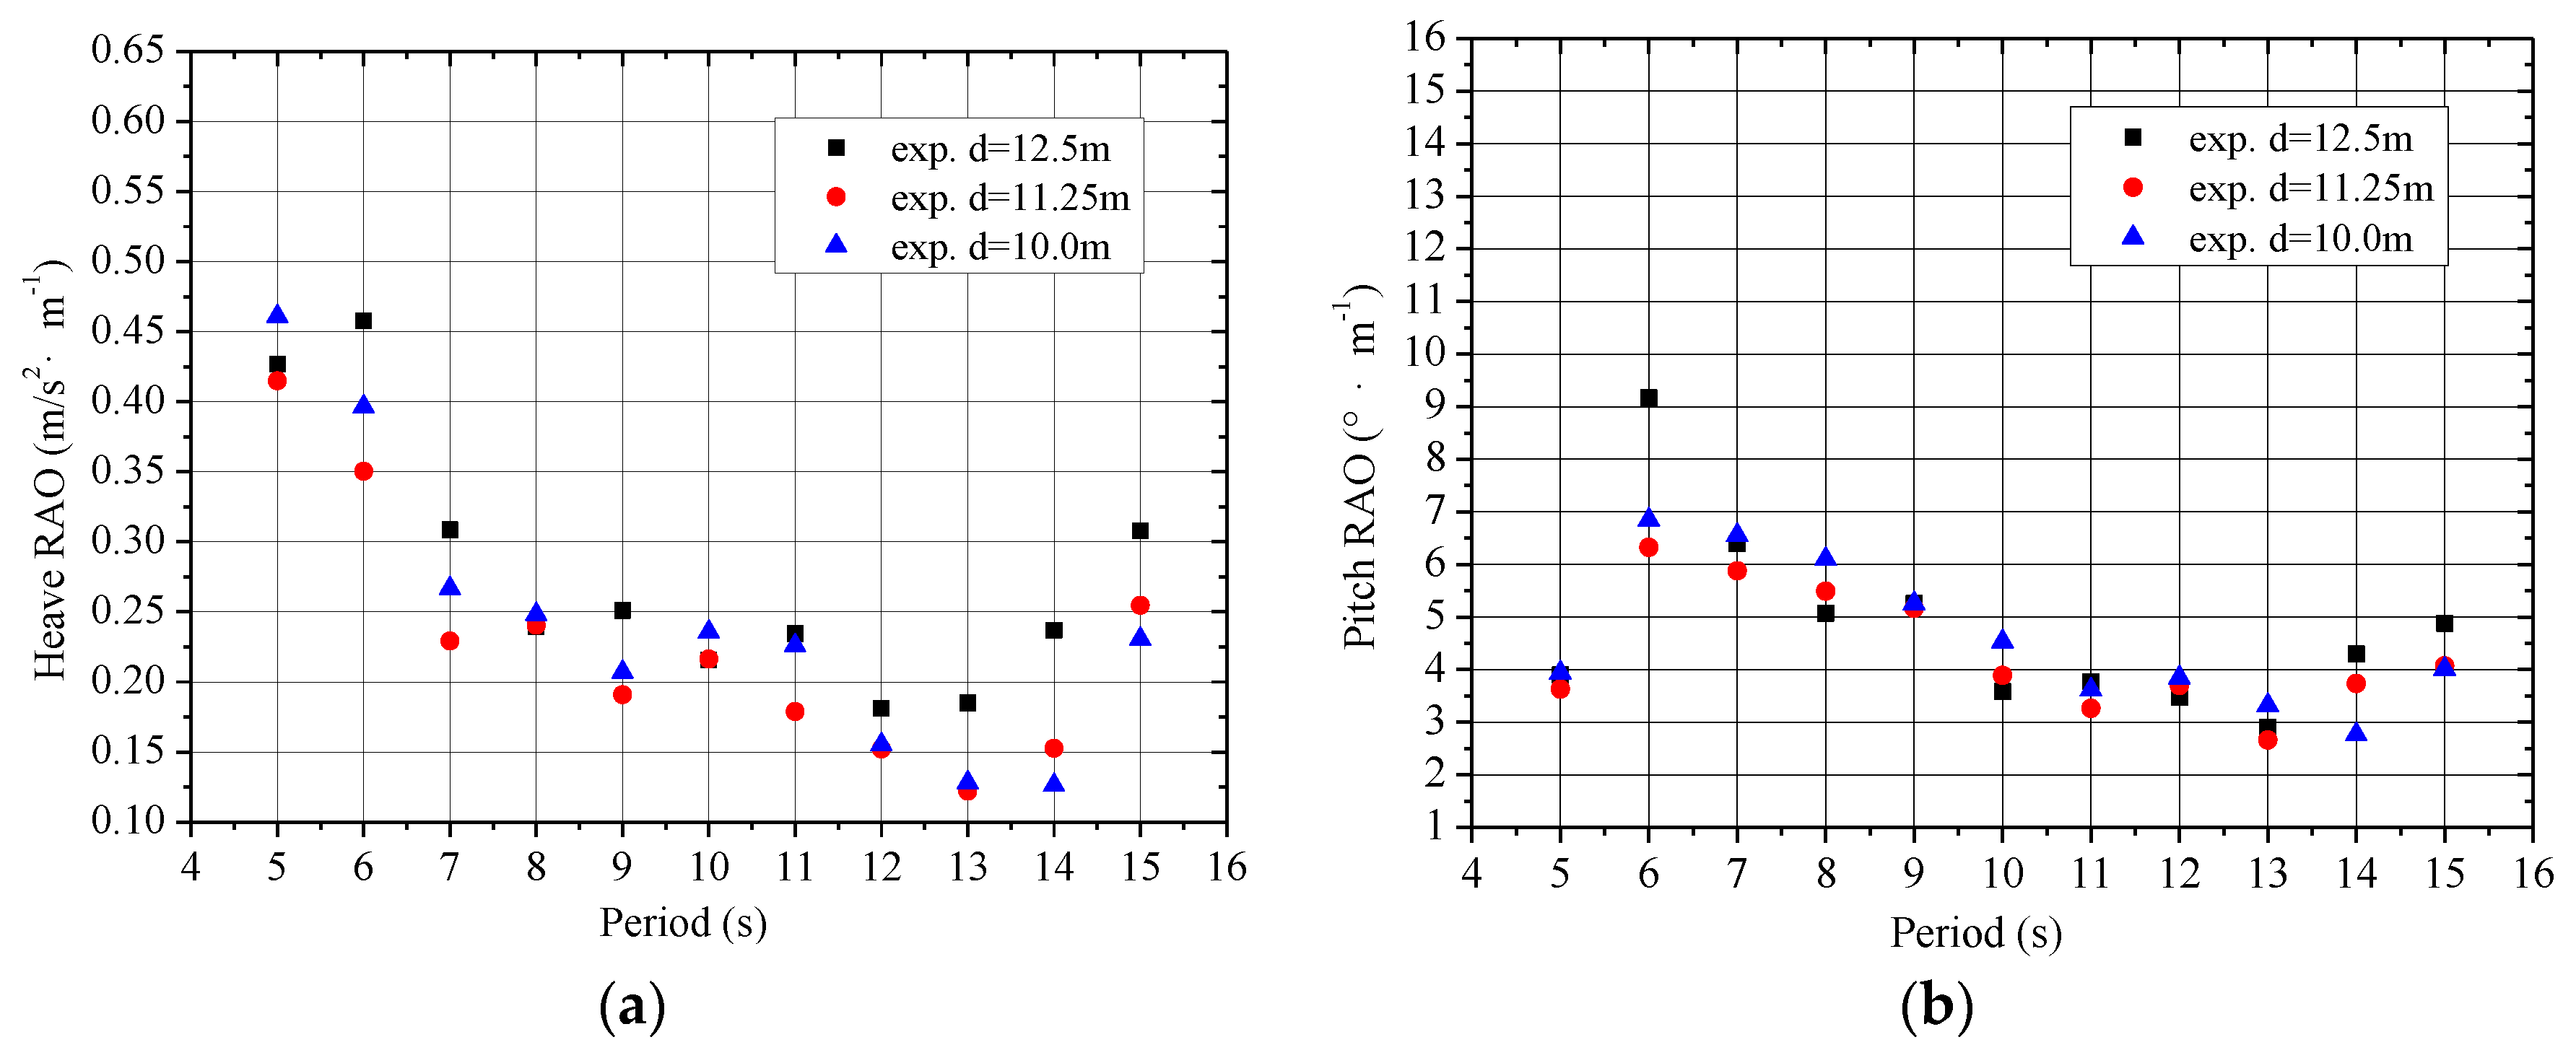
The RAOs of heave acceleration and pitch angle for Model 1 with different water depths at 4.5 m draft are shown in
Figure 13. The maximum amplitudes of heave acceleration and pitch angle, 0.537 m/s
2 and 11.67° at a 12.5 m water depth, 0.46 m/s
2 and 10.41° at a 11.25 m water depth, and 0.47 m/s
2 and 10.41° at a 10.0 m water depth, all occurred near the period of 6 s. It is shown that an increase in the water depth reduced the heave and pitch motion slightly with a shallower water depth of less than 11.25 m. The RAOs of heave acceleration increased with the increase in water depth with the period less than 6 s and larger than 13 s and decreased in the other periods. The RAOs of pitch angle show a similar decrease with increasing water depth at almost the entire range of the period. With a longer period, the RAOs of pitch angle were almost constant at 4.5°.
The RAOs of heave acceleration and pitch angle for Model 2 with different water depths at 4.5 m draft are shown in
Figure 14. Only several periods significantly affect the RAOs of heave acceleration and pitch angle. They are 5 s, 6 s, and 15 s for heave motion and 5 s, 6 s, and 10 s for pitch motion. The maximum amplitudes of motion in heave and pitch first decreased and then increased with increasing water depth. The resonant period for heave motion decreased from 6 s to 5 s with a shallower water depth. This can be attributed to the added draft resulting from the blocking effect of ocean fluid. There is a positive influence on the mass involved in heaving vibration due to the added draft, decreasing the resonant period.
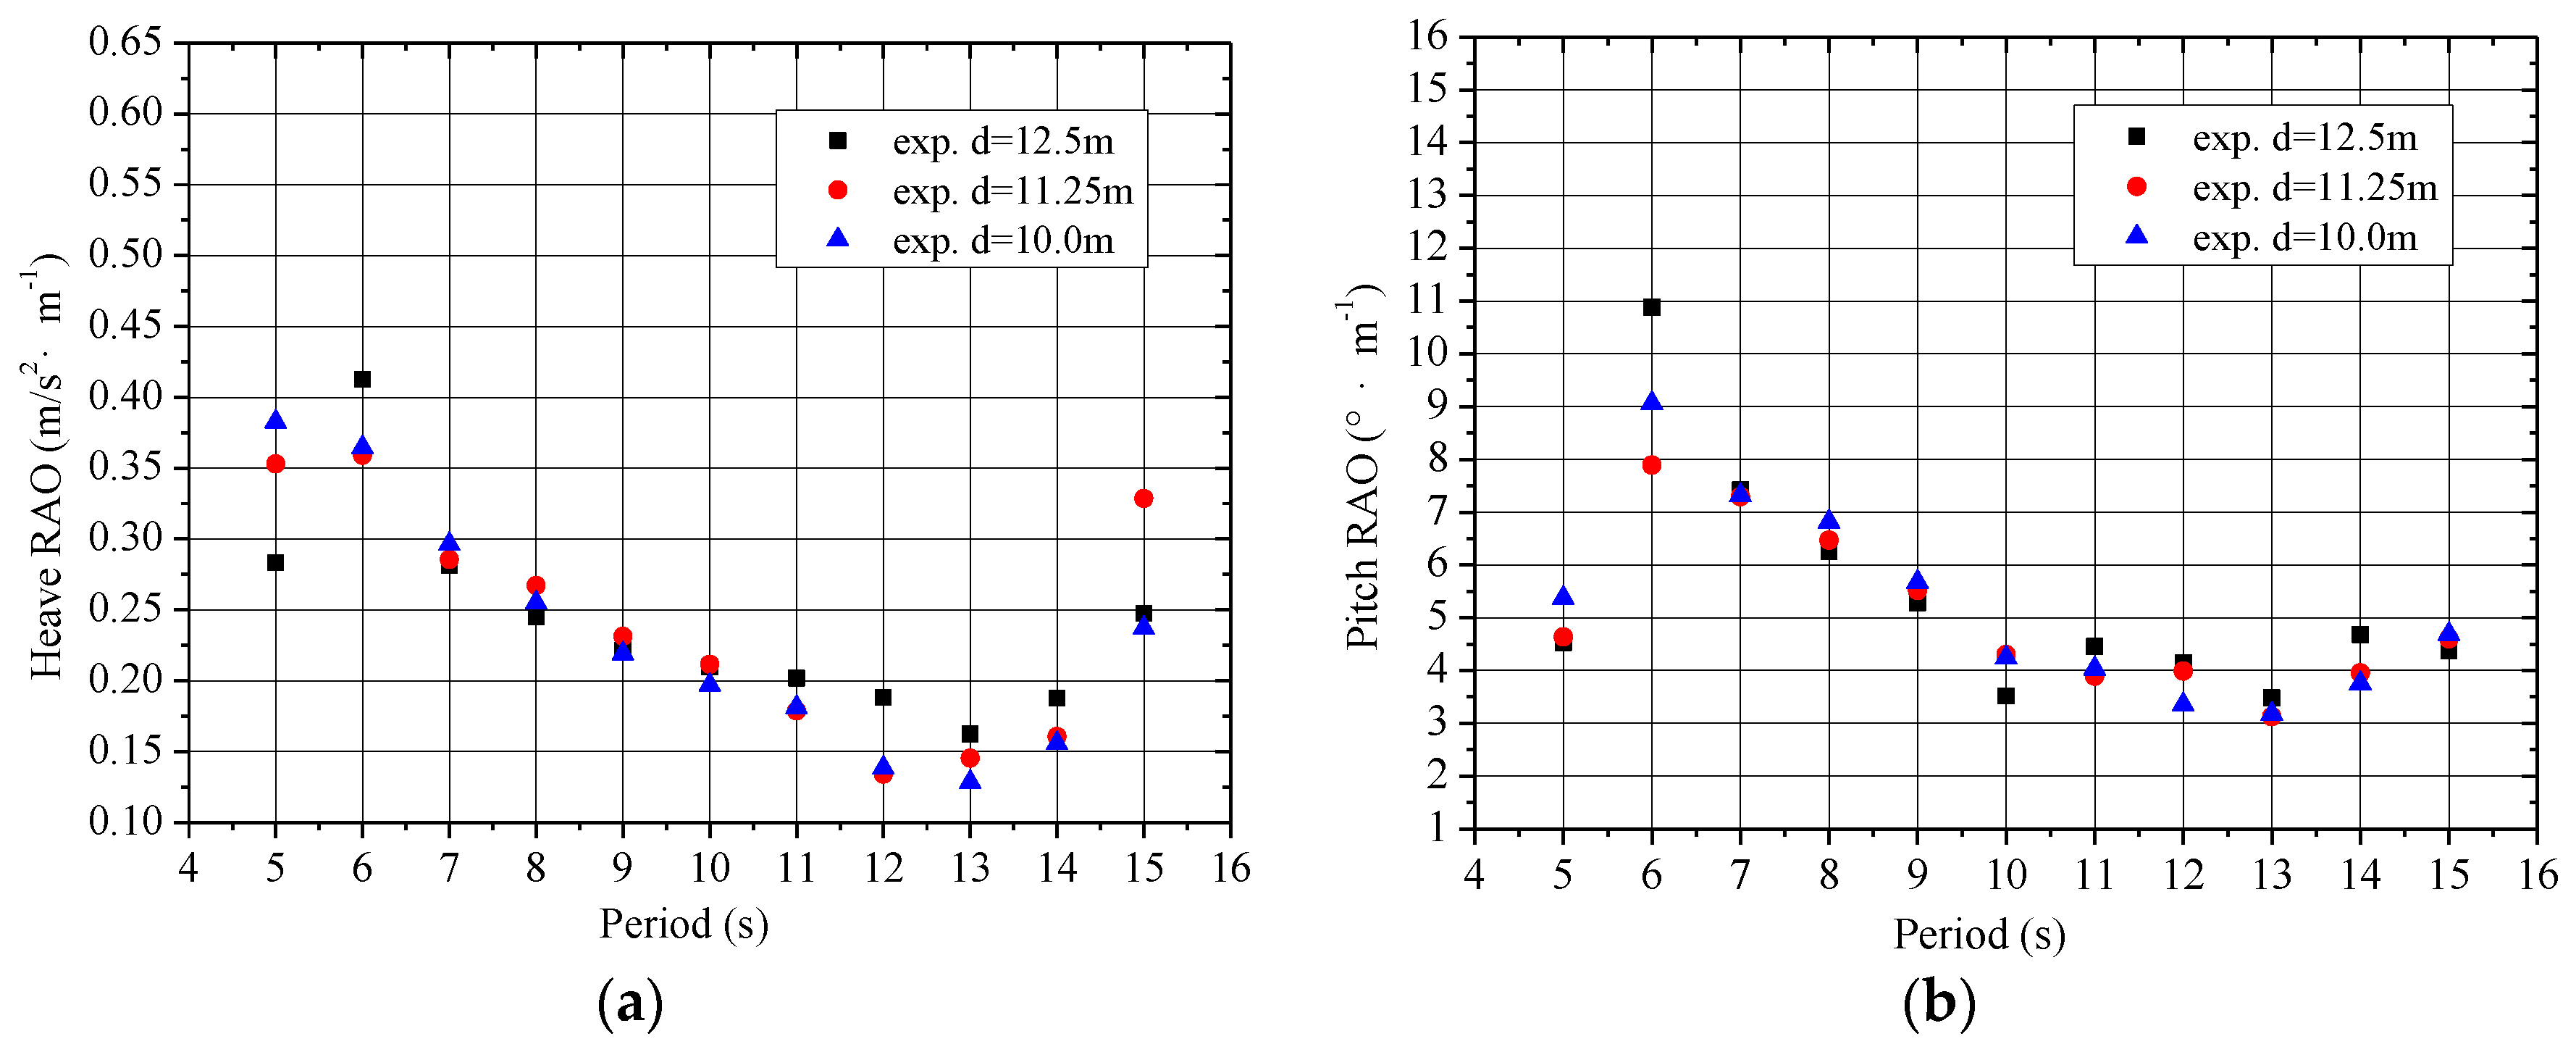
The RAOs of heave acceleration and pitch angle for Model 3 with different water depths at 4.5 m draft are shown in
Figure 15. In
Figure 15a, the maximum amplitudes of heave acceleration, 0.461 m/s
2 at a 12.5 m water depth, 0.415 m/s
2 at a 11.25 m water depth, and 0.457 m/s
2 at a 10.0 m water depth, occurred near the period of 5 s, 5 s, and 6 s, respectively. The periods of maximum values of heave acceleration increased with increasing water depth. The amplitudes of heave acceleration at 11.25 m water depth are less than those of other water depths in most periods. In
Figure 15b, a comparison of pitch RAOs with different water depths shows that an increase in the water depth slightly decreased the pitch angle. However, the maximum values of pitch RAO increased from 6.84° to 9.17° with the increase in water depth from 10.0 m to 12.5 m. A sharp fluctuation occurred around the resonant period. The reason for the fluctuation in pitch RAO can be attributed to the well-known shallow water effect: the shallower the water depth, the slower the heave and pitch motion.
5.3. Effect of Spacing between Bucket Foundations
As shown in
Table 1,
Table 2 and
Table 3, the moment of inertia of LDTBF, one of the key factors affecting the pitch motion, increases with increasing spacing between bucket foundations. In
Table 4, the ratio of wavelength to spacing of structures is inversely proportional to the spacing and the motion responses for LDTBF are inevitably changed in waves with the coupled variations of wave exciting forces caused by the hydrodynamic interaction between bucket and the structure’s own performance.
Figure 16,
Figure 17 and
Figure 18 show the motion performances of Model 1, Model 2, and Model 3 with different spacings between the bucket foundations.
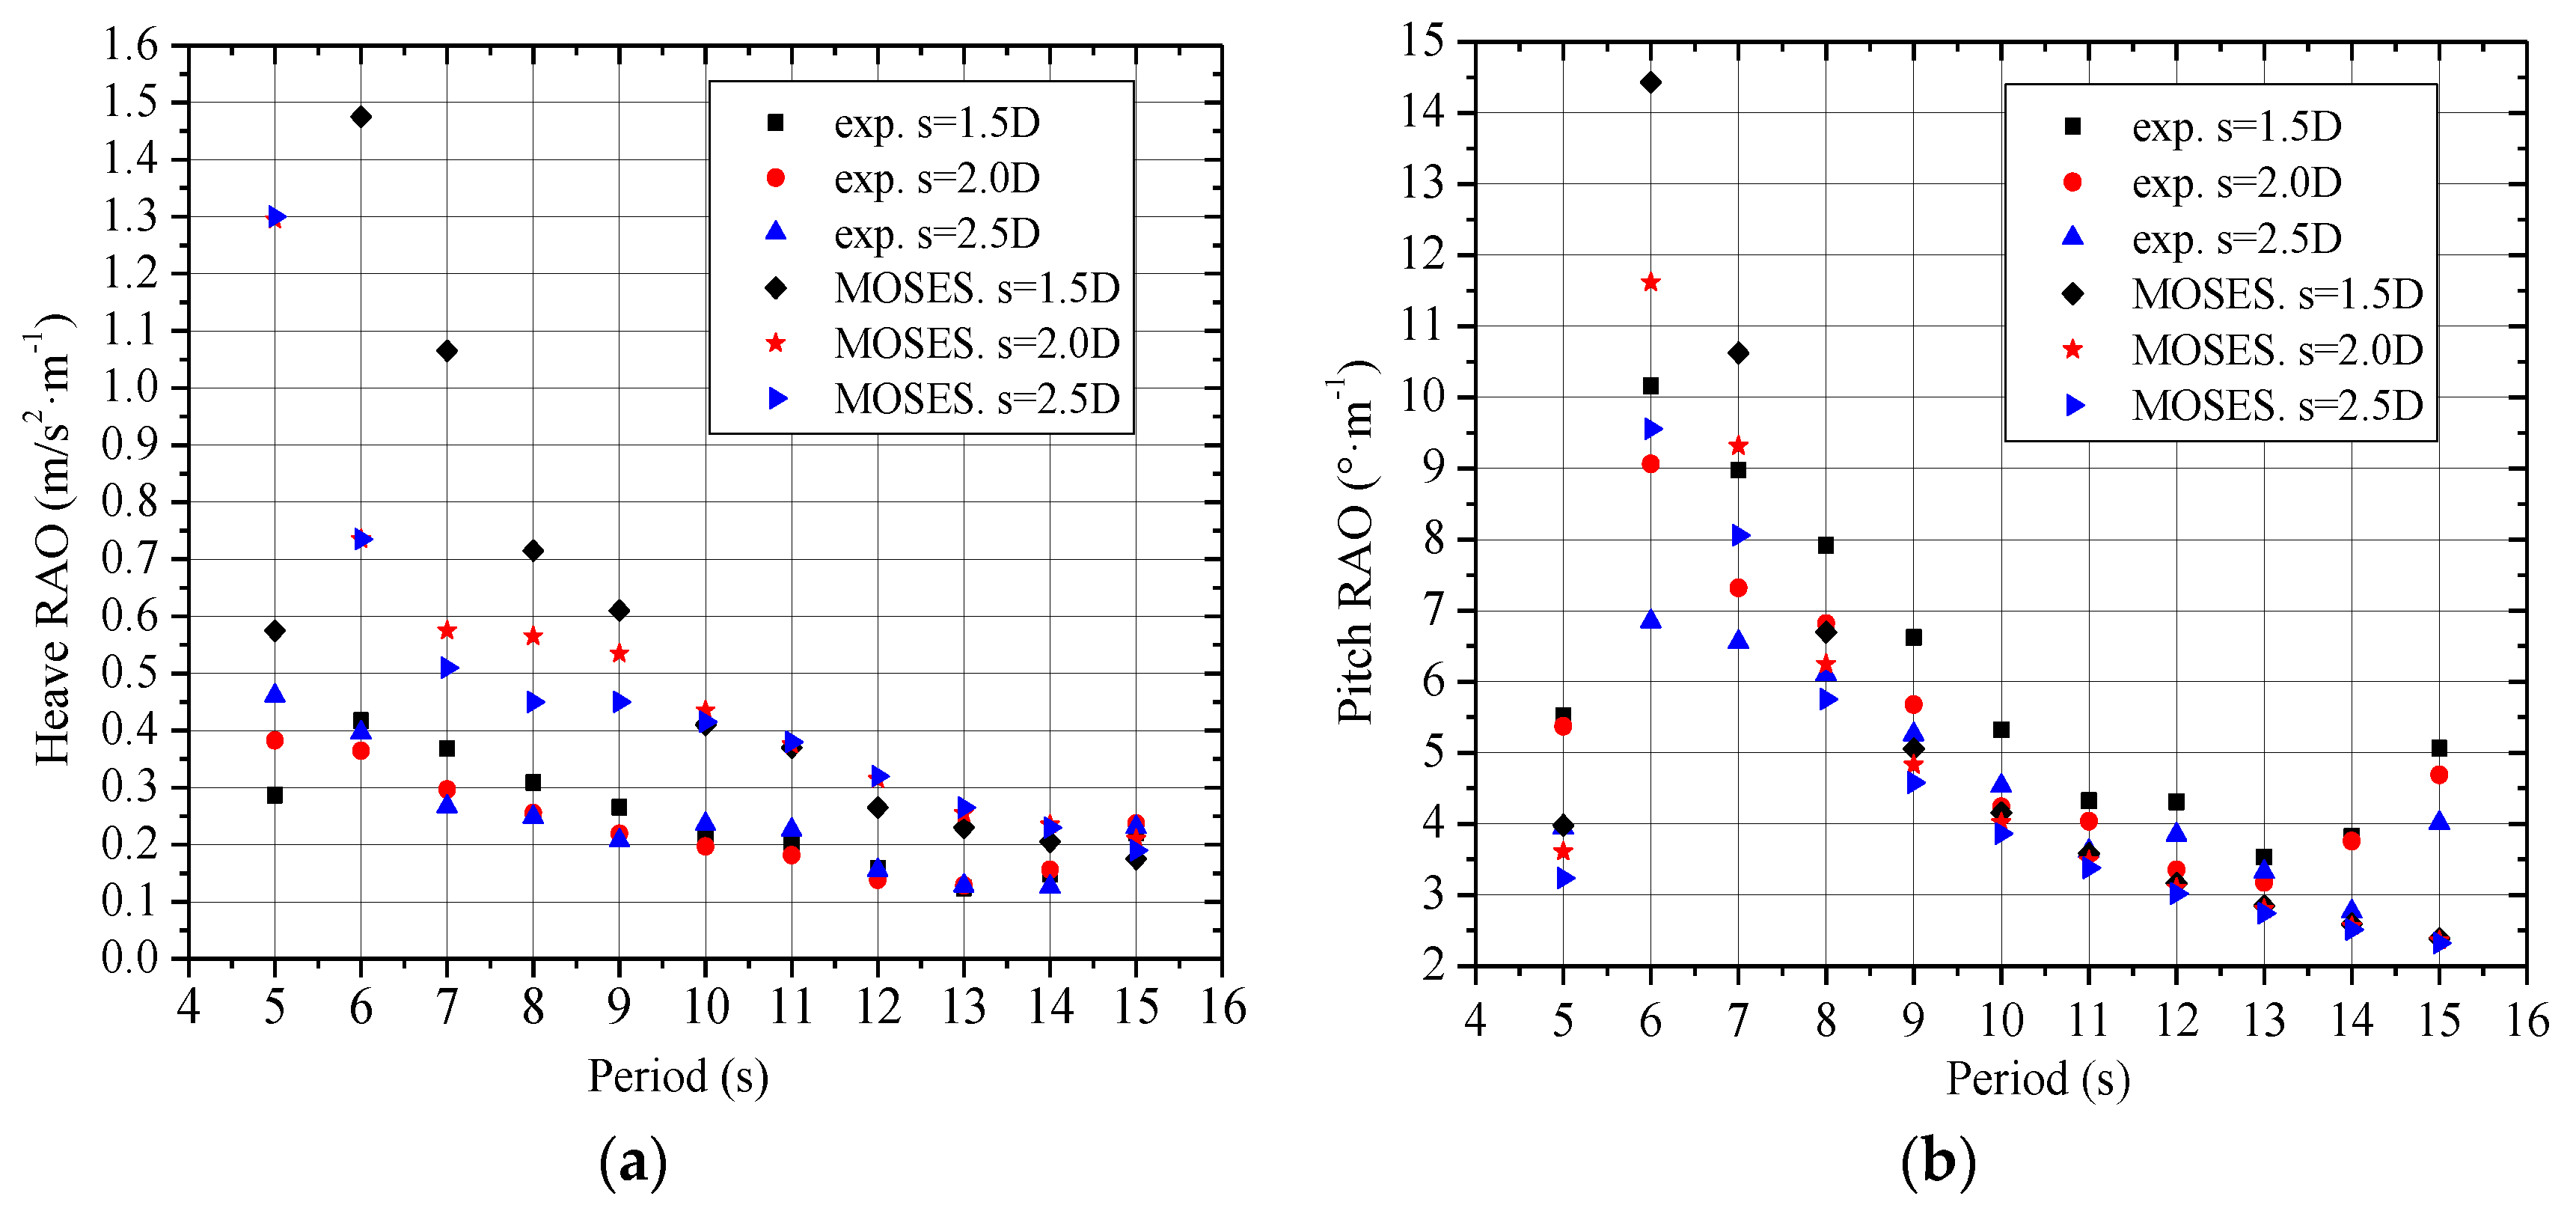
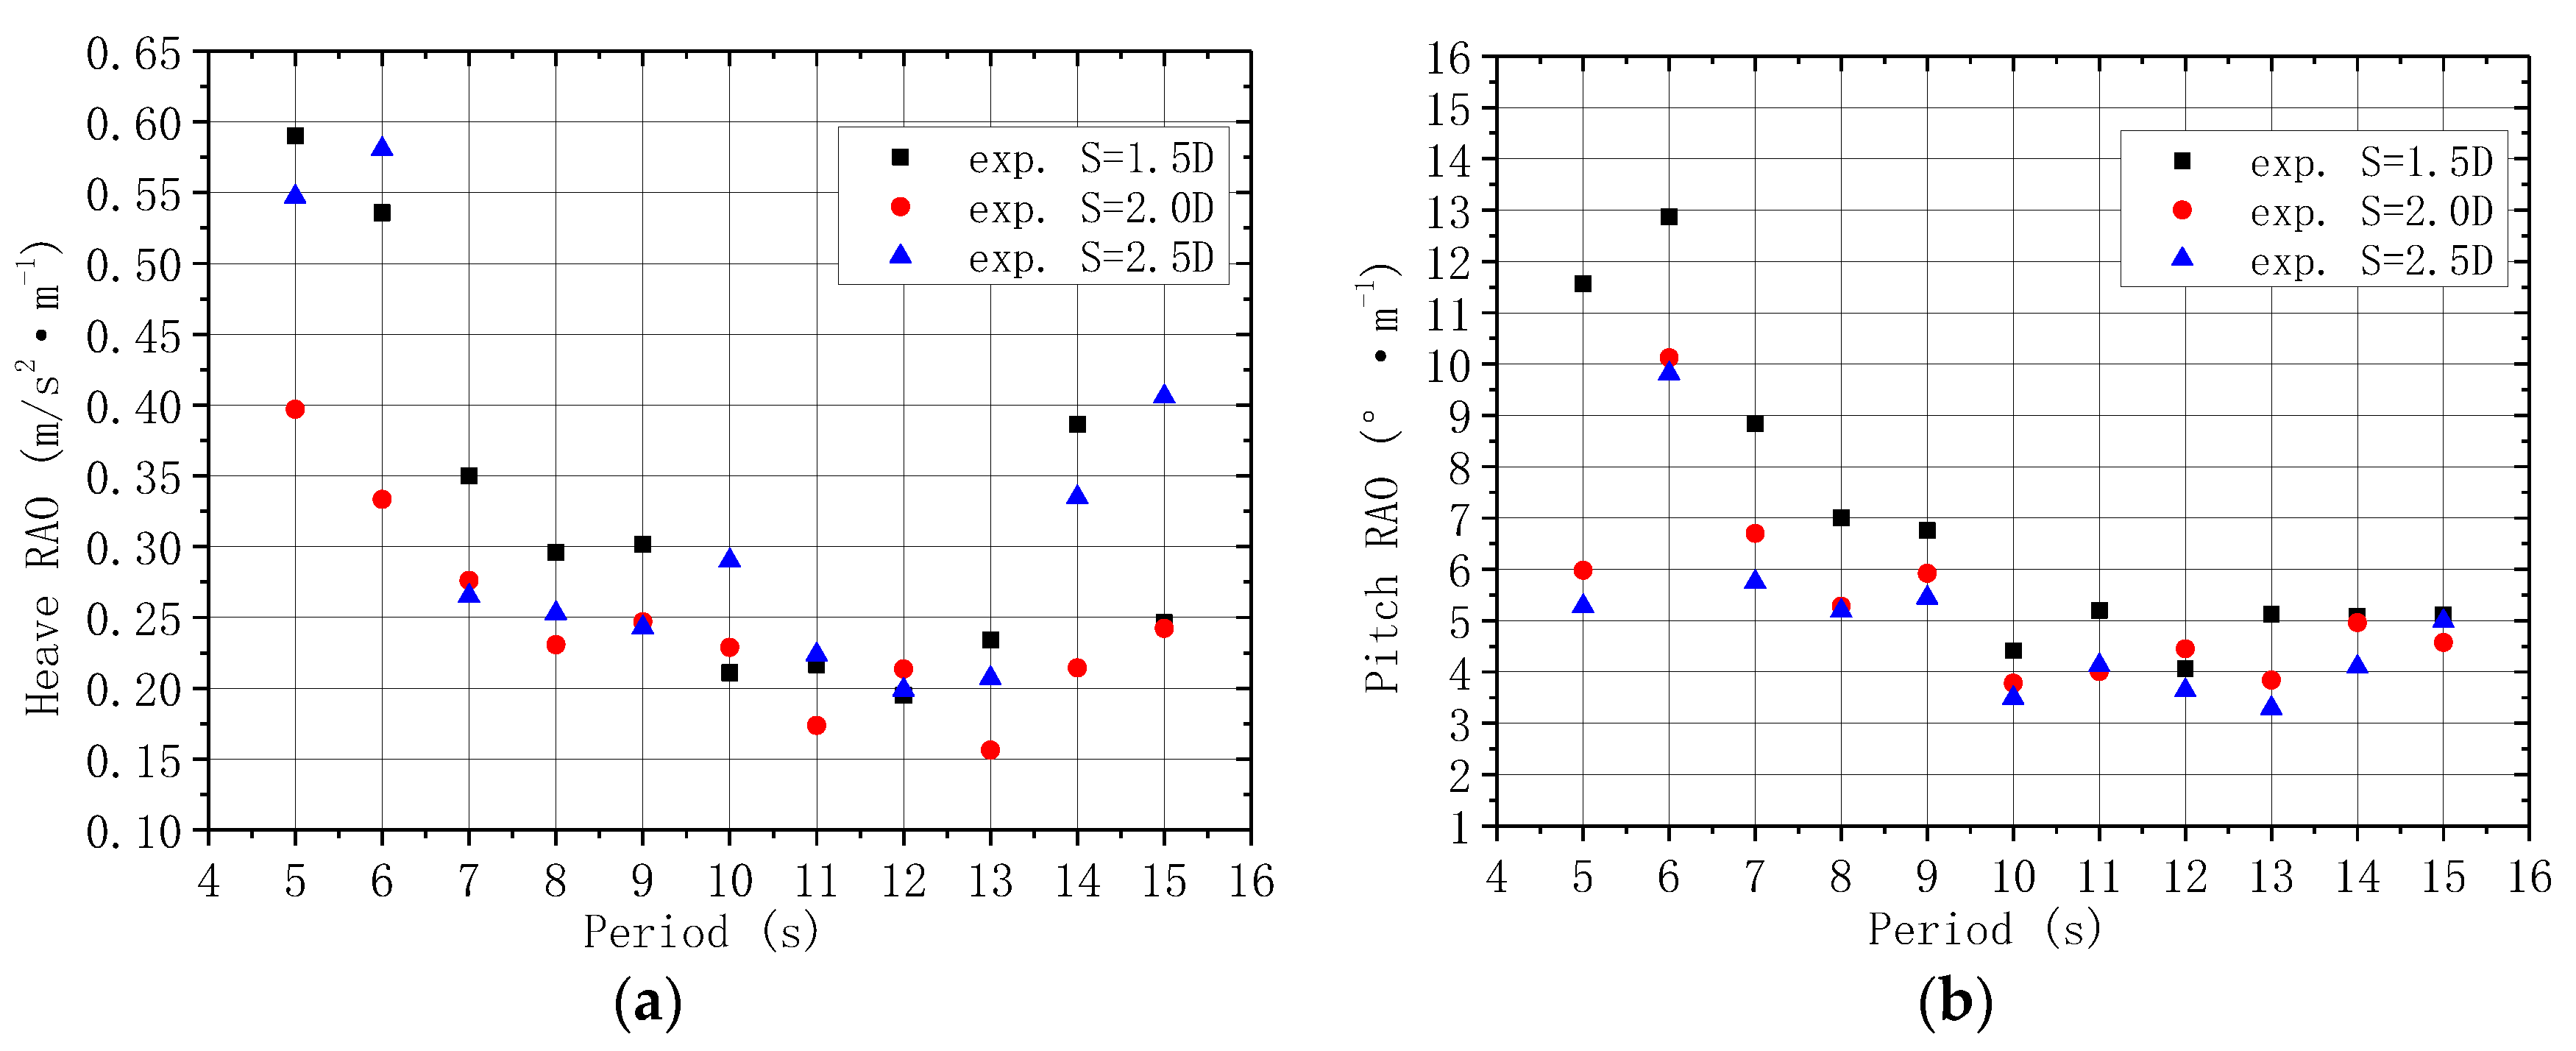
The RAOs of heave motion and pitch motion with different bucket spacings at a 4.0 m draft ata water depth of 12.5 m are shown in
Figure 16. In
Figure 16a, the maximum amplitudes of heave acceleration 0.461 m/s
2 for S = 1.5 D, 0.415 m/s
2 for S = 2.0 D, and 0.457 m/s
2 for S = 2.0 D occurred near the period of 5 s, 5 s, and 6 s, respectively. Other amplitudes of heave acceleration for S = 1.5 D and S = 2.5 D are 0.386 m/s
2 at a period of 14 s and 0.406 m/s
2 at a period of 15 s, respectively, while the responses of heave acceleration for S = 2.0 D are almost the smallest in all the periods than those of S = 1.5 D and S = 2.5 D. As shown in
Figure 16b, the pitch RAOs decreased with the increase in S. This can be attributed to a larger moment of inertia with wider spacing. However, the maximum values of the pitch angle are 12.87°, 10.12°, and 9.82°, respectively. With increasing S from 1.5 D to 2.0 D, the maximum amplitude decreased by 2.75°, while this amplitude only decreased by 0.3° when S increased from 2.0 D to 2.5 D. This indicates that simply improving the pitch RAOs by increasing the spacing between bucket foundations is limited. This cannot satisfy the requirements of low cost and high efficiency development for offshore wind power, while a larger spacing results in increasing material consumption of connecting members and the cost.
The RAOs of heave motion and pitch motion with different bucket spacings at 4.5 m draft in a water depth of 12.5 m are shown in
Figure 17. The maximum amplitudes of heave acceleration for S = 2.0 D are less than those of S = 1.5 D and S = 2.5 D around the resonant period. The heave RAOs with a wider spacing were slightly larger than those with a narrower spacing with the period longer than 7 s.
Figure 17b shows that the pitch RAOs have a similar decreasing trend as the 4.0 m draft with the increase in s. The maximum amplitudes of pitch angle, smaller than the amplitudes at 4.0 m draft, are 11.67° for S = 1.5 D, 10.88° for S = 2.0 D, and 9.17° for S = 2.5 D.
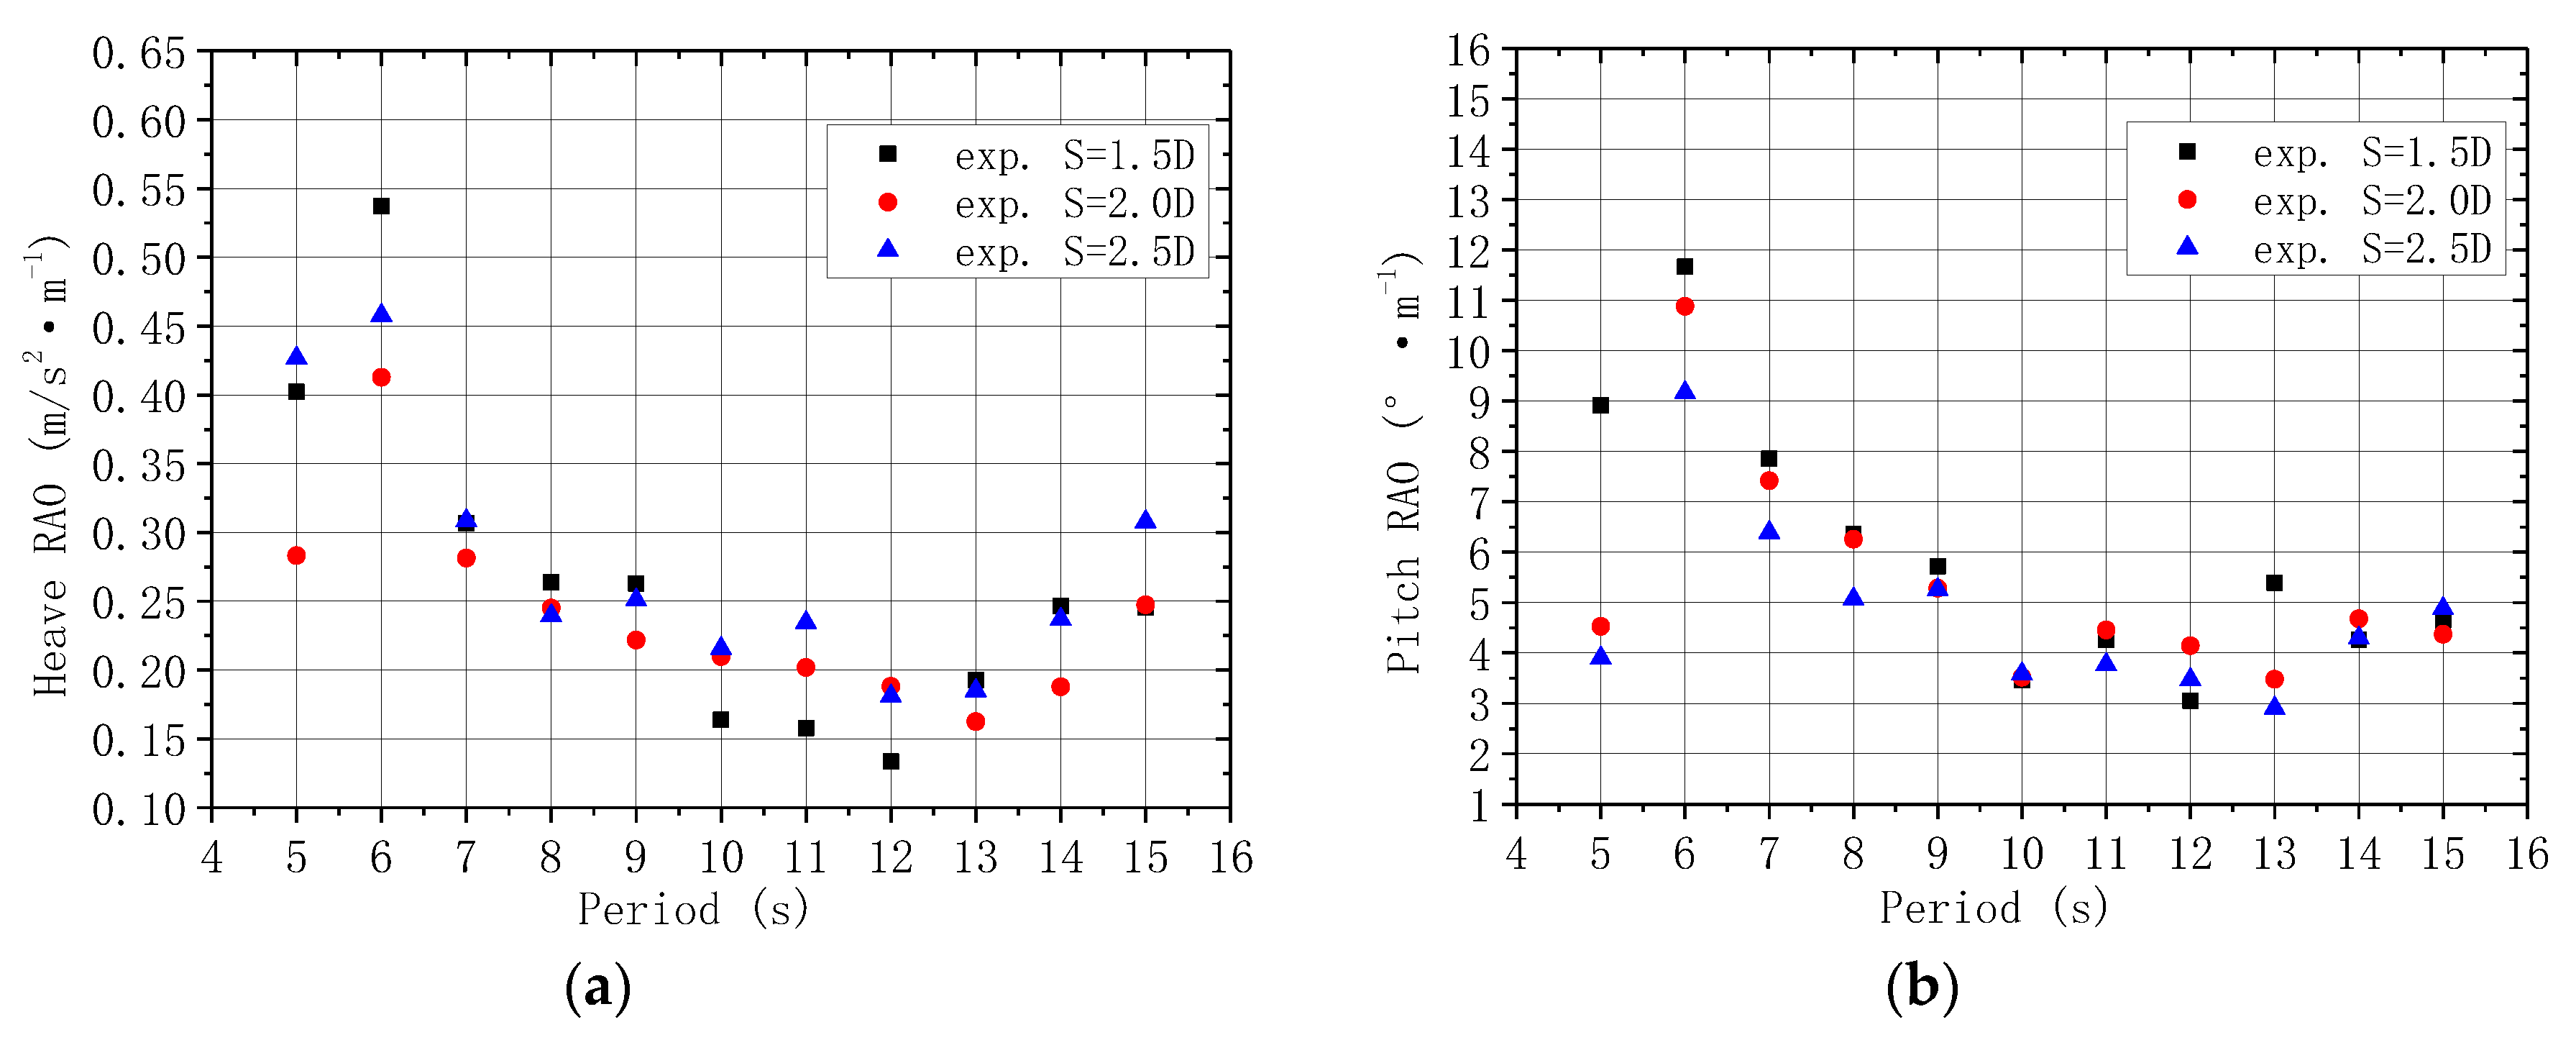
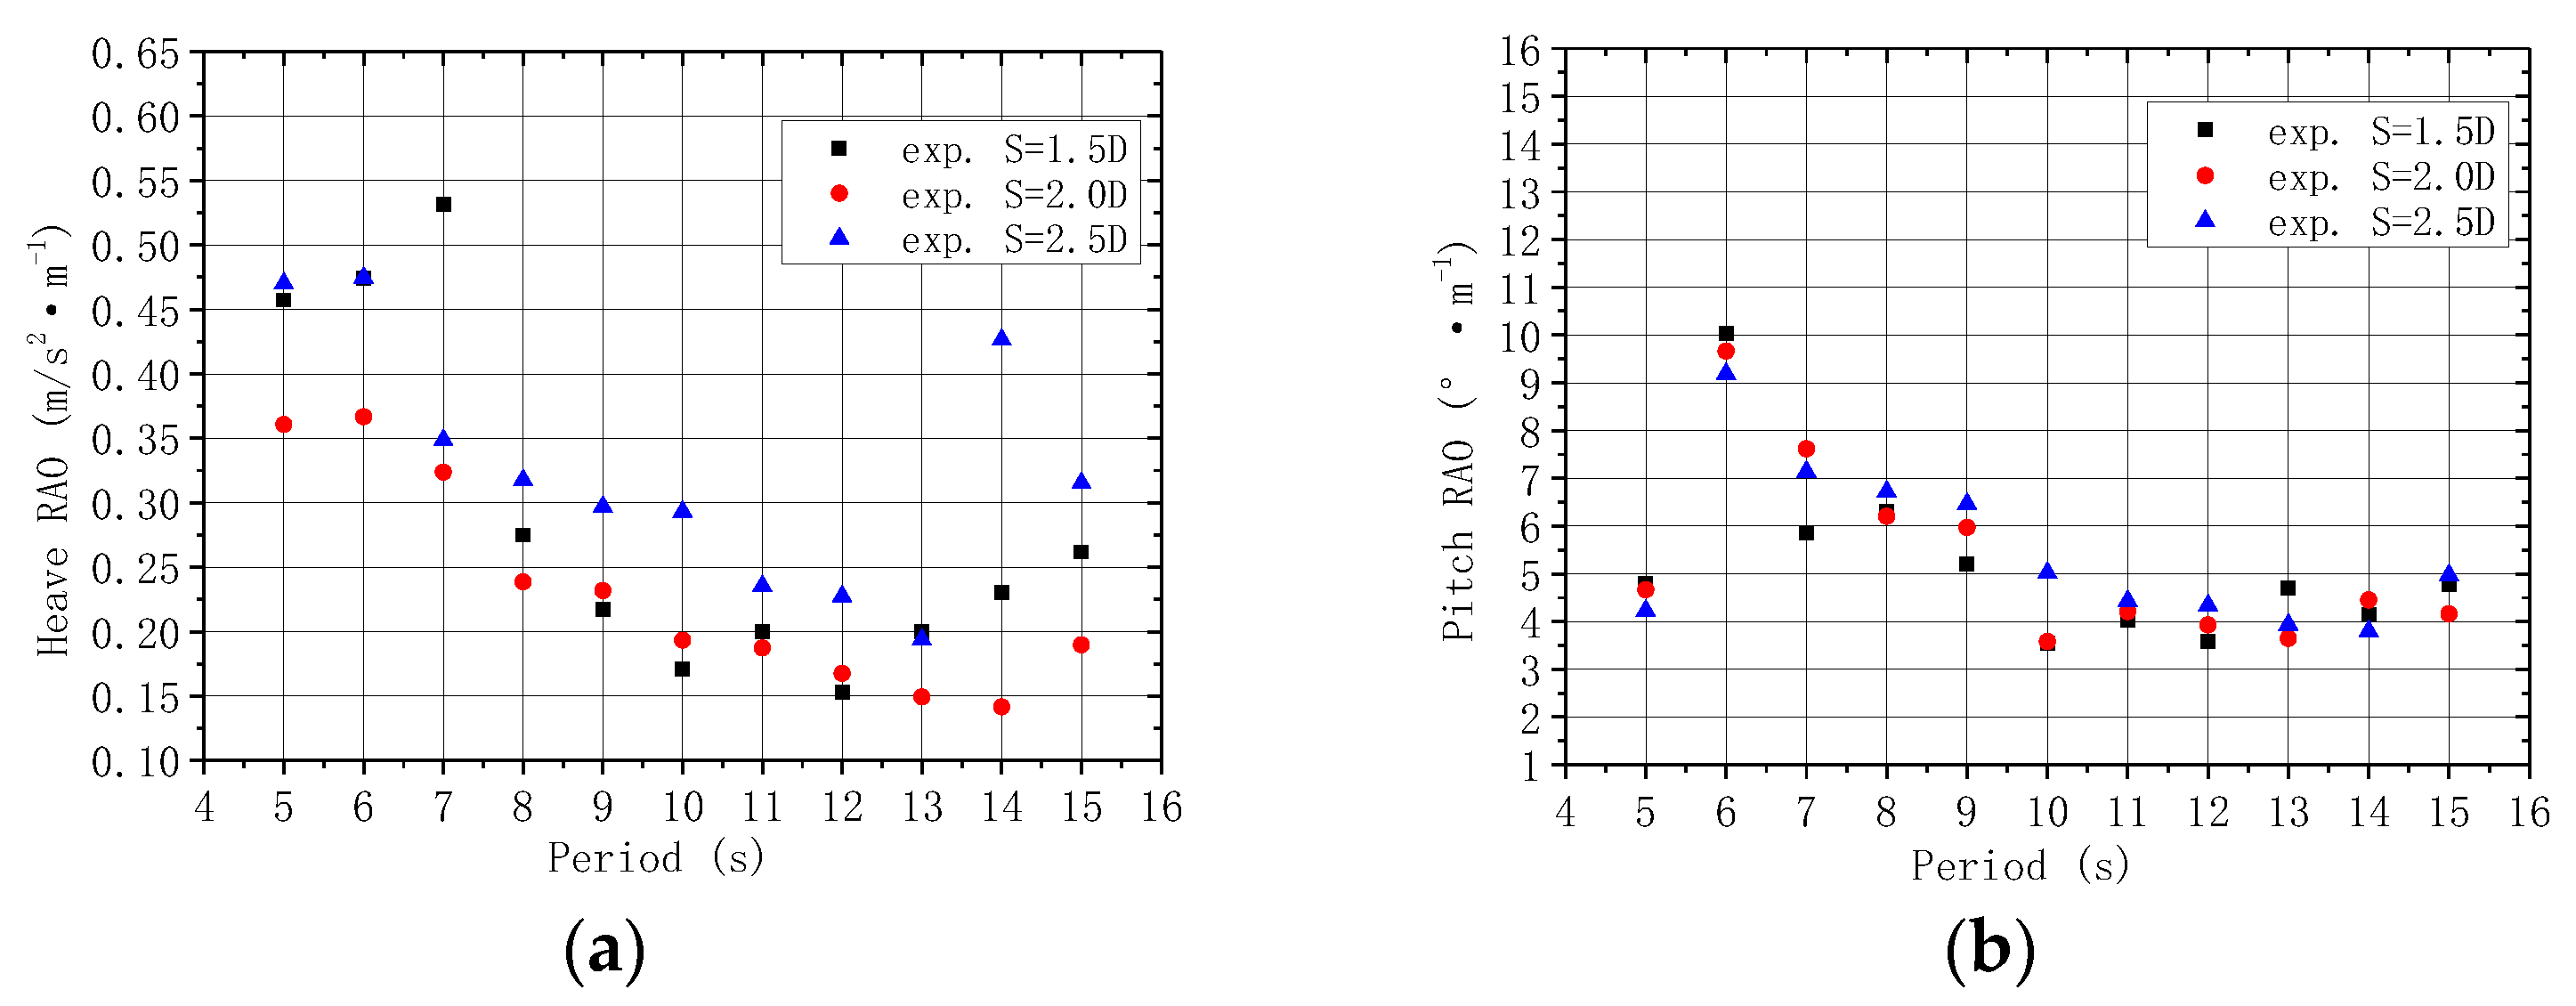
The RAOs of heave motion and pitch motion with different bucket spacings at 5.0 m draft at the water depth of 12.5 m are shown in
Figure 18.
Figure 18a shows that the maximum amplitudes of heave acceleration 0.532 m/s
2 for S = 1.5 D, 0.367 m/s
2 for S = 2.0 D, and 0.475 m/s
2 for S = 2.0 D occurred near the period of 7 s, 6 s, and 6 s, respectively. The heave RAOs with a wider spacing were larger than those with a narrower spacing when the periods were longer than 7s. As shown in
Figure 18b, the maximum amplitudes of pitch angle, smaller than the amplitudes at 4.0 m and 4.5 m draft, are 10.03° for S = 1.5D, 9.66° for S = 2.0 D, and 9.19° for S = 2.5 D. However, the pitch RAOs increase with the increase in spacing between bucket foundations, and the variation trend is contrary to the trend at a 4.0 m draft and a 4.5 m draft. The heave RAOs for S = 2.5D were much larger than those for S = 1.5D and S = 2.0 D in almost each period, i.e., the wider the spacing between bucket foundations, the larger the heave RAOs. Therefore, simply improving the pitch RAOs by increasing the spacing between bucket foundations is limited and negatively affects the motion performance during the transportation of LDTBF.
6. Conclusions
In this paper, the motion responses of LDTBFs supported by an air cushion and a water plug in each bucket foundation were evaluated through a series of laboratory tests (on 1/25 scale) and verified by the models established using the hydrodynamics software MOSES. A comparison between the experimental and simulated results indicates that the presence of an air cushion in the bucket foundation reduces the responses of structures and the technique of air floating transportation for LDTBF can be applied to engineering practices. The effects of three features, draft, water depth, and bucket spacing on LDTBF were evaluated. In this context, the main conclusions of the study are as follows:
(1) The resonant period for heaving motion increases with an increasing draft.
(2) The maximum amplitude for heaving and pitching motions decrease with the increase of draft for S=1.5D and S=2.5D, but, first increase and then decrease with an increasing draft for S=2.0D.
(3) The resonant period for heaving motion increases with an increasing water depth.
(4) The maximum amplitude for heaving and pitching motions first decrease and then increase with the increase of water depth.
(5) The maximum amplitude for heaving motion first decreases and then increases with increasing bucket spacing; futhermore, the wider the spacing between bucket foundation, the lower the heaving resonant period.
(6) The pitch RAOs decrease with the increase of spacing between the bucket foundations; however, the wider the spacing between the bucket foundations, the larger the heave RAOs.
(7) The optimal motion responses for LDTBFs are achieved at a 4.5 m draft and a 11.25 m water depth when the spacing between the bucket foundations is 2.0D.


