Article

A Novel Passive Method to Control the Swirling Flow with Vortex Rope from the Conical Diffuser of Hydraulic Turbines with Fixed Blades

1
Research Institute for Renewable Energies—Politehnica University Timisoara, 300006 Timisoara, Romania
2
Mechanical Faculty, Hydraulic Machinery Department, Politehnica University Timisoara, 300006 Timisoara, Romania
3
Center for Advanced Research in Engineering Science, Romanian Academy—Timisoara Branch, 300223 Timisoara, Romania
*
Author to whom correspondence should be addressed.
Appl. Sci. 2019, 9(22), 4910; https://doi.org/10.3390/app9224910
Submission received: 10 October 2019 / Revised: 1 November 2019 / Accepted: 12 November 2019 / Published: 15 November 2019
(This article belongs to the Section Energy Science and Technology)

Abstract

:
In this paper, we introduce a novel passive control method to mitigate the unsteadiness effects associated to the swirling flows with self-induced instabilities. The control method involves a progressive throttling cross-section flow at the outlet of the conical diffuser. It adjusts the cross-section area with a diaphragm while maintaining all positions of the circular shape centered on the axis. It improves the pressure recovery on the cone wall while the pressure fluctuations associated with the self-induced instability are mitigated as it adjusts the cross-section area. It can adjust the diaphragm in correlation with the operating conditions of the turbine. We investigated the passive control method on a swirl generator, which provides a similar flow as a hydraulic turbine operated at a partial discharge. The plunging and rotating components are discriminated using the pressure fluctuation on the cone wall to provide a clear view of the effects induced by this passive control method. As a result, the novel proof of concept examined in this paper offers valuable benefits as it fulfils a good balance between the dynamical behavior and the hydraulic losses.

1. Introduction

Nowadays hydropower is perceived as a mature technology but it has to face to new requirements more challenging than ever: the stochastic nature of renewable energy sources (wind, solar), irregular market requirements for energy, climate changes, constraints and environmental concerns [1]. Therefore, the hydraulic turbines have to operate over a wide range [2,3] under a fast change of the parameters to compensate the fluctuating part delivered in the electrical grid by the renewable energies. Several times, these requirements implied transient phenomena (e.g., load acceptance, load rejection, start-stop, emergency shutdown, spin no load, total load rejection) in operation [4,5,6,7]. Along the upstream passage of the hydraulic turbine, the potential energy of the water available in the upper tank is converted into kinetic energy. Then, this hydraulic energy available at the runner inlet is converted by the mechanical energy at the turbine shaft. The flow energy which is not converted by the runner is ingested by the drat tube of the hydraulic turbines [8]. A fraction of this residual energy is converted back into potential energy along to the draft tube [9].
Over 50–75% of this residual energy is recovered in the first part of the draft tube, which is called the discharge cone. Therefore, the hydraulic efficiency of the medium-to-low head turbines is significantly affected by performing the draft tube on a wide range operation [10].
Vu et al. [11] have shown that the hydraulic losses in a Francis turbine draft tube can reach up to 10% from the turbine head, far away from the best efficiency point (BEP). The fixed blade turbines, i.e., Francis and propeller types, operated at far-away conditions from the BEP, leads to a high level of swirl at the draft tube inlet because of the mismatch between the swirl delivered by the wicket gates and the angular momentum extracted by the runner [12]. Therefore, the decelerated swirling flow in the draft tube cone often results in the vortex breakdown (known as the vortex rope), which is the main cause of the pressure fluctuations generated in the hydraulic turbines at part load conditions [13]. This phenomenon and the associated effects is known in the literature as a draft tube surge [14,15]. One of the most harmful effects of operating hydraulic turbines at a part load are the following: the wear and fatigue of mechanical parts, cavitation and cracks of the runner blades [16,17,18,19]. Over time, several techniques have been investigated to tame/eliminate the vortex rope. The various techniques that have been employed to mitigate vortex rope are intended either to produce an axisymmetric draft-tube flow or to diminish the swirl in the draft tube below the critical level, including pulsating axial jet, J-groove, air admission/injection, splitter plates, fins, runner crown extension and freely rotating runner cone extension (FRUCE) [20,21,22,23,24]. These techniques bring improvements at part-load conditions.
Notwithstanding, passive techniques cannot be moved to other regimes, which may add undesirable hydraulic losses. Our group has promoted the active water injection method through the runner crown along to the turbine axis to control the decelerated swirling flow from the conical diffuser of hydraulic turbines operating at part-load conditions [25]. Extensive experimental investigations were carried out by Bosioc et al. [26], showing that a jet discharge larger than 10–12% of the volumetric flow rate associated to the operating point is required to remove the vortex rope and its undesirable effects. From a practical point of view, these investigations have revealed a new issue regarding the control jet supply. Here, a significant fraction of the turbine discharge bypasses the runner leading to unacceptable volumetric losses. As a result, a flow-feedback approach is proposed by Resiga and Muntean [27] to supply the jet with a twin spiral case to collect a fraction of the discharge from the cone outlet. The jet is driven by the pressure difference between the cone wall and the pressure at the jet nozzle outlet. The flow-feedback approach was experimentally investigated by Tănasă et al. [28] assessing it performances. Ten percent of the jet discharge is delivered by the plain flow feedback and only 2% boost is provided by the ejector pumps. These active control methods act to increase the axial flux of the moment of momentum to stabilize the flow instead of to diminish the swirl level below the critical level (to decrease the tangential flux of the moment of momentum) like the passive control methods mentioned above. Javadi and Nilsson numerically examined a new idea about the water injection method [29], and considered a swirl component superposed over an axial jet in order to improve its effects. Their investigations have shown that the pressure pulsations, velocity fluctuations and the size of the vortex rope decrease when a jet with a flow rate less than 3% is injected from the runner crown. In addition, the axial water and air-water mixture was successfully tested to mitigate the unsteady effects associated to different part load operating points for a pump-turbine by Kirschner et al. [30].
In this paper, we introduce a novel passive control method to mitigate the pressure fluctuations associated to the vortex rope, relying on the latest knowledge gained from an extensive analysis of the swirling flows. This proof of a concept involves a progressive throttling of the cross-section area using an adjustable diaphragm. The control system with adjustable diaphragm is located at the end of the conical diffuser—Figure 1. All positions of the circular cross-section are centered on the axis of the turbine. The shutter area of the diaphragm has to be correlated with the turbine operating regime. As a result, the diaphragm should be retracted to the cone wall when it is unnecessary to be used (i.e., around to BEP) to avoid any additional hydraulic losses.

2. Experimental Setup

2.1. Swirling Flow Apparatus and Experimental Setup

The experimental investigations are performed on the test rig available at Politehnica University Timisoara. The hydraulic circuit presented in Figure 2 contains the swirl apparatus with two parts: (i) the swirl generator and (ii) the convergent-divergent test section. The swirl generator delivers a swirling flow configuration similar to one determined in a Francis runner operated at 70% partial discharge [31]. At this regime, the vortex rope generates the largest pressure fluctuations.
Several details about the swirl generator are available in two benchmark cases: (i) the Timisoara Swirl Generator test case available at the Turbomachinery Special Interest Group (TSIG) [30]; and (ii) the AC6-14 test case included in the ERCOFTAC database [32]. The swirl generator has an upstream annular section with stationary and rotating blades for generating swirling flow (Figure 2). It has three components: the ogive, the guide vanes, and the free runner. The ogive with four leaned struts has the role to sustain the swirl generator. The main part of the swirl generator is the free runner. Its main purpose is to redistribute the total pressure at the entrance of the cone. The free runner induces an excess of energy near the shroud and a deficit of energy near the hub. Therefore, it acts as a turbine at the hub and as a pump at the shroud having a vanishing total torque. The 10-bladed runner spins freely and ensures the designed output flow configuration. The cone angle of 17° selected in this case corresponds to modern hydraulic turbines. We performed the unsteady pressure measurements on the cone wall using a set of eight fast response transducers. The transducers are displaced on four levels (labeled L0, L1, L2 and L3) along to the cone. The first level (L0) is located in the throat of the test section. The next three levels are located at 50 mm, 100 mm and 150 mm downstream the throat section. The pressure transducers with an accuracy of ±0.13% within a full range of ±100 kPa are flush-installed on the cone wall. This experimental setup allows us to examine the swirling flows with a single vortex rope as we visualize it on our test rig. We select the time interval of 32 s at a sampling rate of 256 samples per second for data acquisition based on several investigations. At least 10 data sets were acquired for each flow regime to ensure data reliability.
The standard deviation σ is defined according to Equation (1) being around ±1% for all measured values.
σ = ( p i   p ¯ ) 2 N 1
We have achieved the measurements for a discharge of Q = 30 L/s corresponding to a Reynolds number of 3.8 × 10⁵. The discharge correspond to a flow rate coefficient of q = 0.23 [33]. A flow meter with an accuracy of ±0.15% within the full range is installed on the test rig, Figure 2. The water temperature from 20 °C to 24 °C is determined during our measurements with no cooling system installed on the test rig. As a result, the uncertainties given by the temperature variations are negligible because of the water volume which is large enough (larger than 4 m3). The entire hydraulic circuit was completely filled with water with no volume of air trapped inside. We perform the experimental investigations considering over-pressure conditions. Only non-cavitating vortex rope was examined in our investigations. Then, a constant value is selected for the water density. The method developed by Bosioc et al. [26] applies to assess the performances of the new proof of a concept. In this way, we compare the results for a new proof of a concept against other control methods (e.g., axial water jet method).

2.2. The Passive Control Method with Diaphragm

The main component of this novel control method for taming the vortex rope effects is an adjustable diaphragm. The diaphragm system installed on our swirl apparatus is presented in Figure 2—right side, placed at the cone outlet. The diameter of D = 0.16 m with area of A0 = 0.0201 m2 is associated to the cone outlet.
We selected four openings corresponding to different shutter areas of the adjustable diaphragm. The inner diameters of d = 0.134 m, 0.113 m, 0.1 m and 0.088 m and their associated shutter areas of Ad = 0.014 m2, 0.01 m2, 0.0078 m2 and 0.006 m2 are considered in this experimental study. These values of inner diameter correspond to the shutter area ratios (Aa) of 30%, 50%, 60% and 70% regarding the cone outlet area A0, see Table 1.

3. Pressure Data Analysis

3.1. Mean Pressure Analysis

The goal of the discharge cone is to convert the kinetic energy into potential energy with minimum hydraulic losses. This energy conversion is expressed by the wall pressure recovery coefficient cp, which it is given in dimensionless form by Equation (2),
c p = p ¯ p ¯ L 0 ρ V t 2 / 2 w h e r e V t = Q π D t 2 / 4
where p ¯ L 0 is the mean pressure on the wall at L0 level—Figure 3a, p ¯ is the mean pressure measured downstream on the cone wall, ρ = 998 kg/m3 is the water density, Vt is the bulk velocity in the throat and Dt = 2Rt = 0.1 m is the throat diameter corresponding to L0 level.
The distribution of the pressure coefficient cp along the cone wall against the dimensionless axial coordinate is plotted in Figure 3b. We consider the dimensionless axial coordinate regarding the throat radius Rt displaced at L0 level of the test section—Figure 3a. The wall pressure recovery in the first part of the cone up to L1 level is negligible if it uses the diaphragm. In contrast, a significant improvement of the wall pressure recovery is obtained downstream to L1 level delaying the separation flow on the wall. For instance, the pressure recovery coefficient (at the wall) is practically twice in the middle of the conical diffuser (on L2 level).
It is expected when the pressure recovery on the cone wall is improve it will have diminished additional hydraulic losses associated to the vortex rope. However, the hydraulic losses increase on the cone once the diaphragm continues to obstruct the flow. The hydraulic losses cannot be correctly quantified based on the available experimental data.
Tănasă et al. [34] revealed that the hydraulic losses are less than half of the value received for the case with the vortex rope up to the relative shutter area of 50% (d = 0.113 m), and no larger than twice up to the relative shutter area ratio of 70% (d = 0.088 m), respectively.

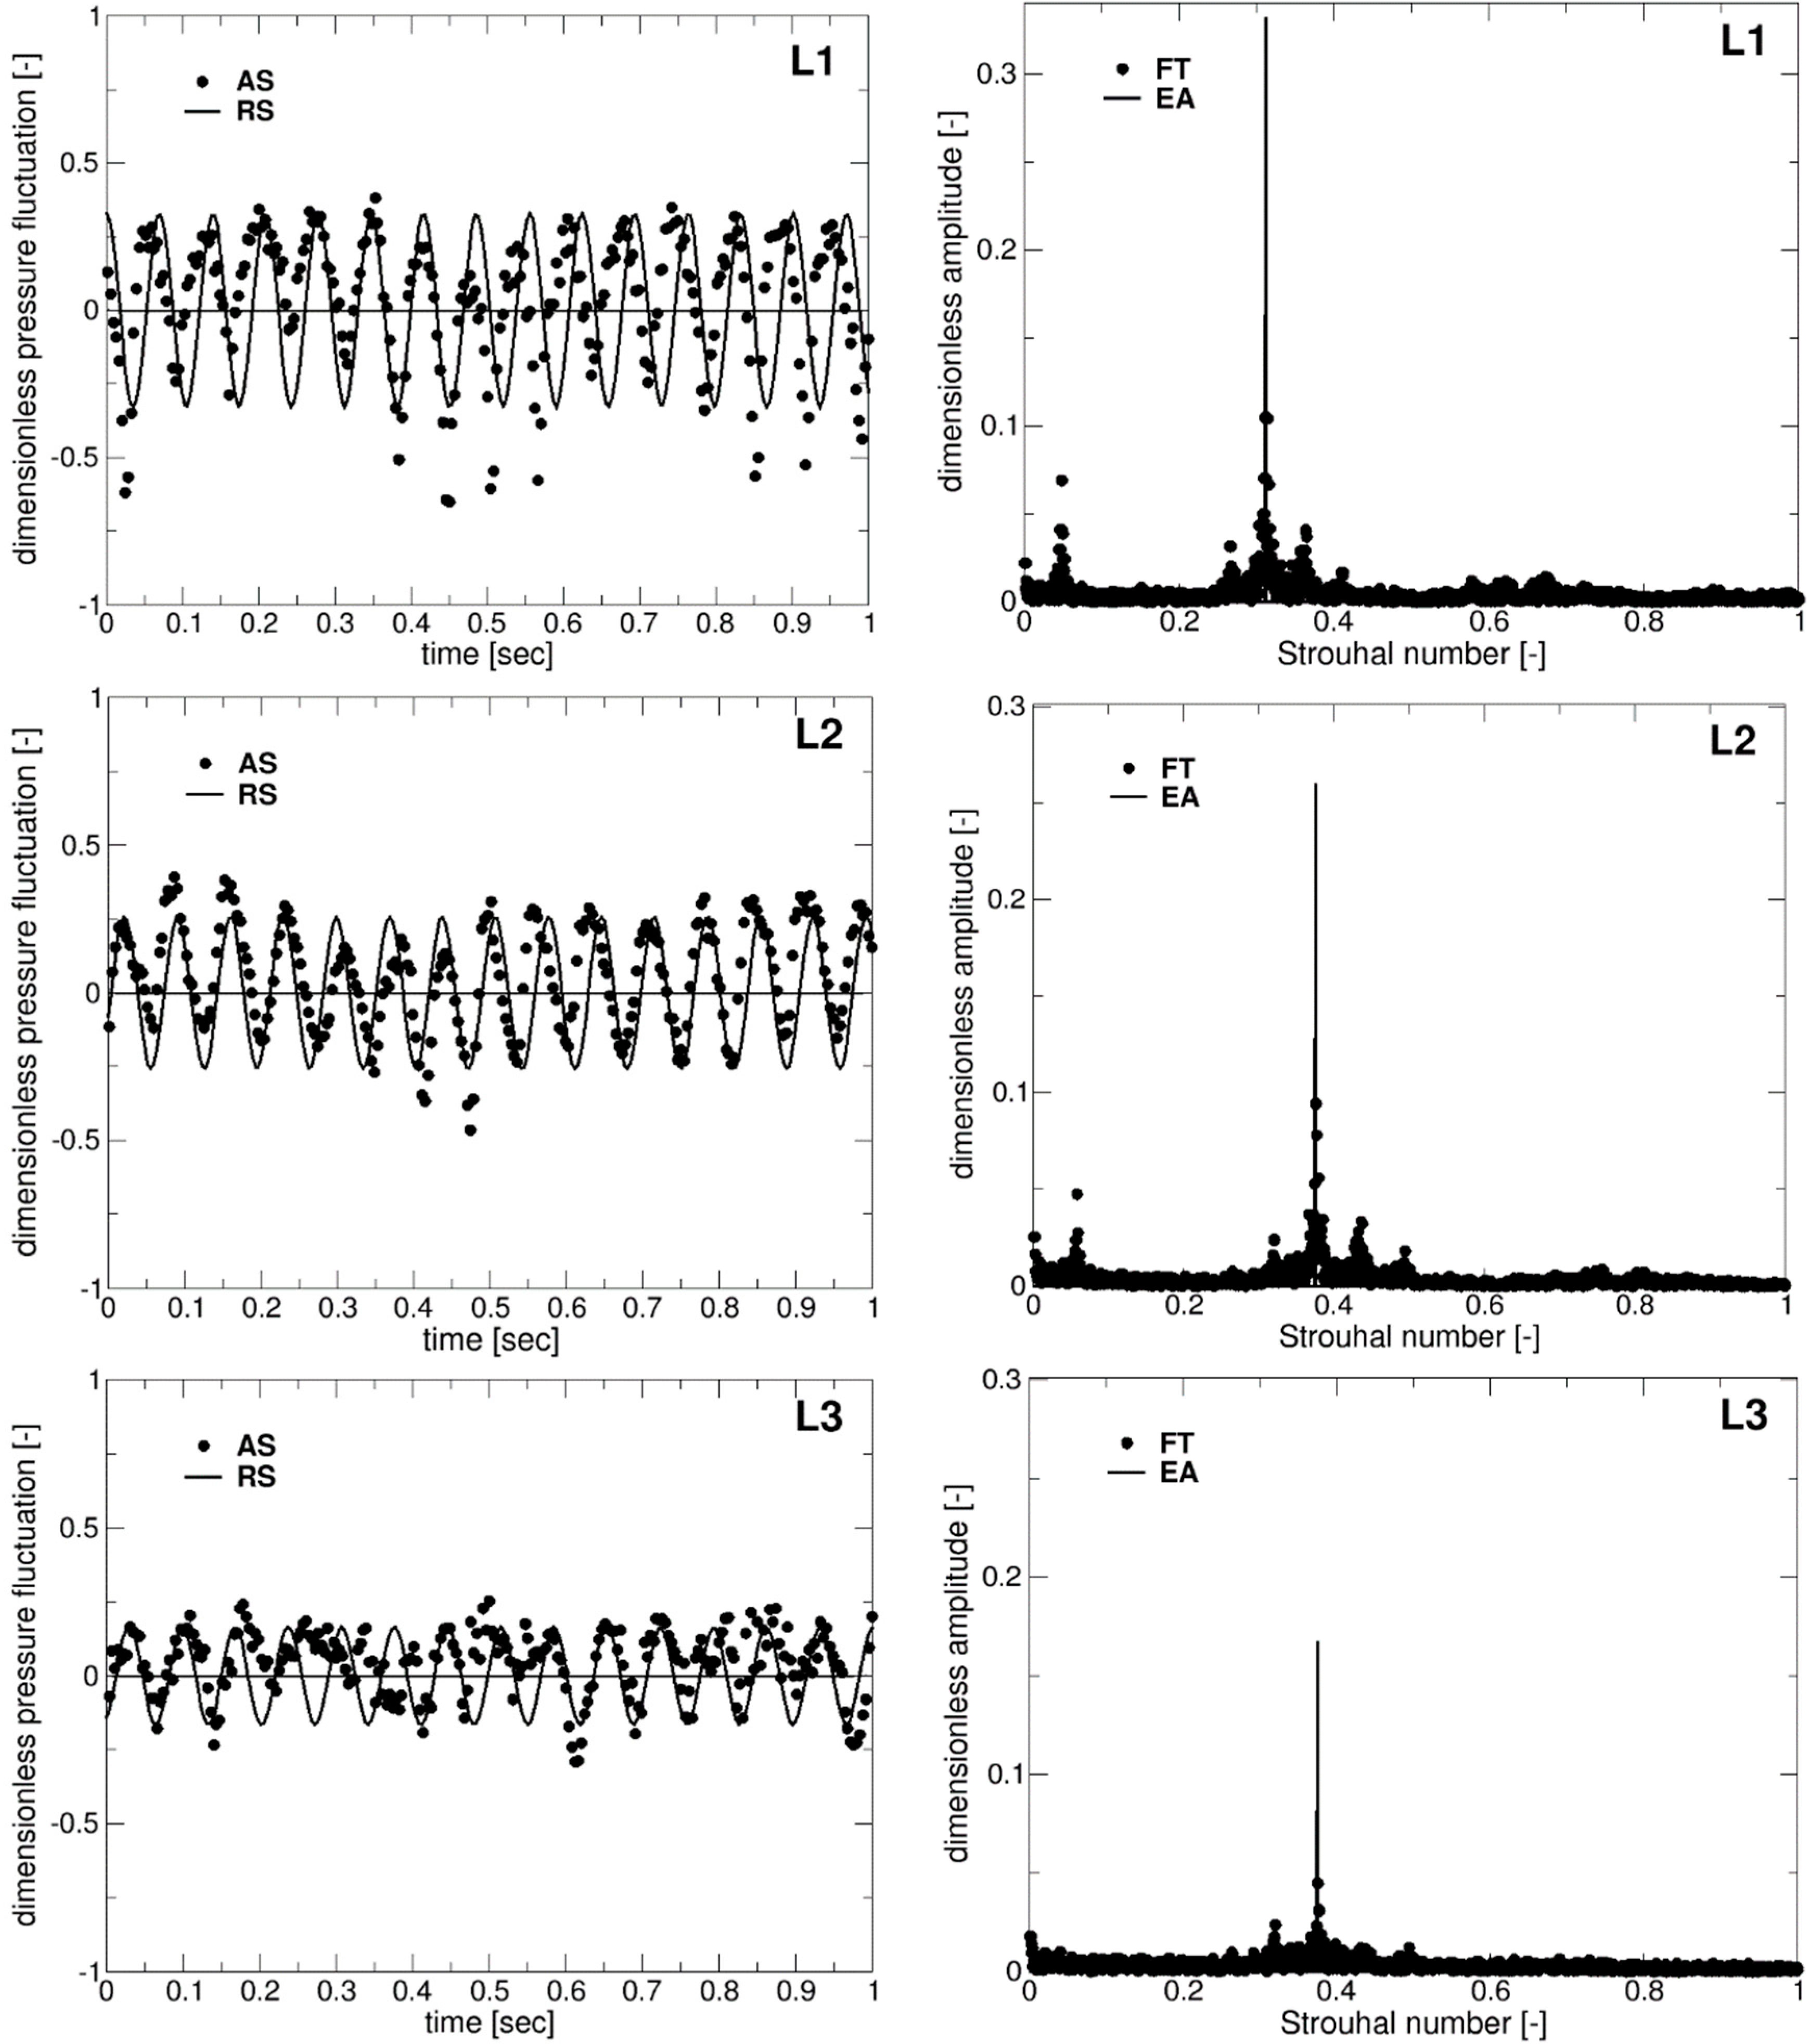
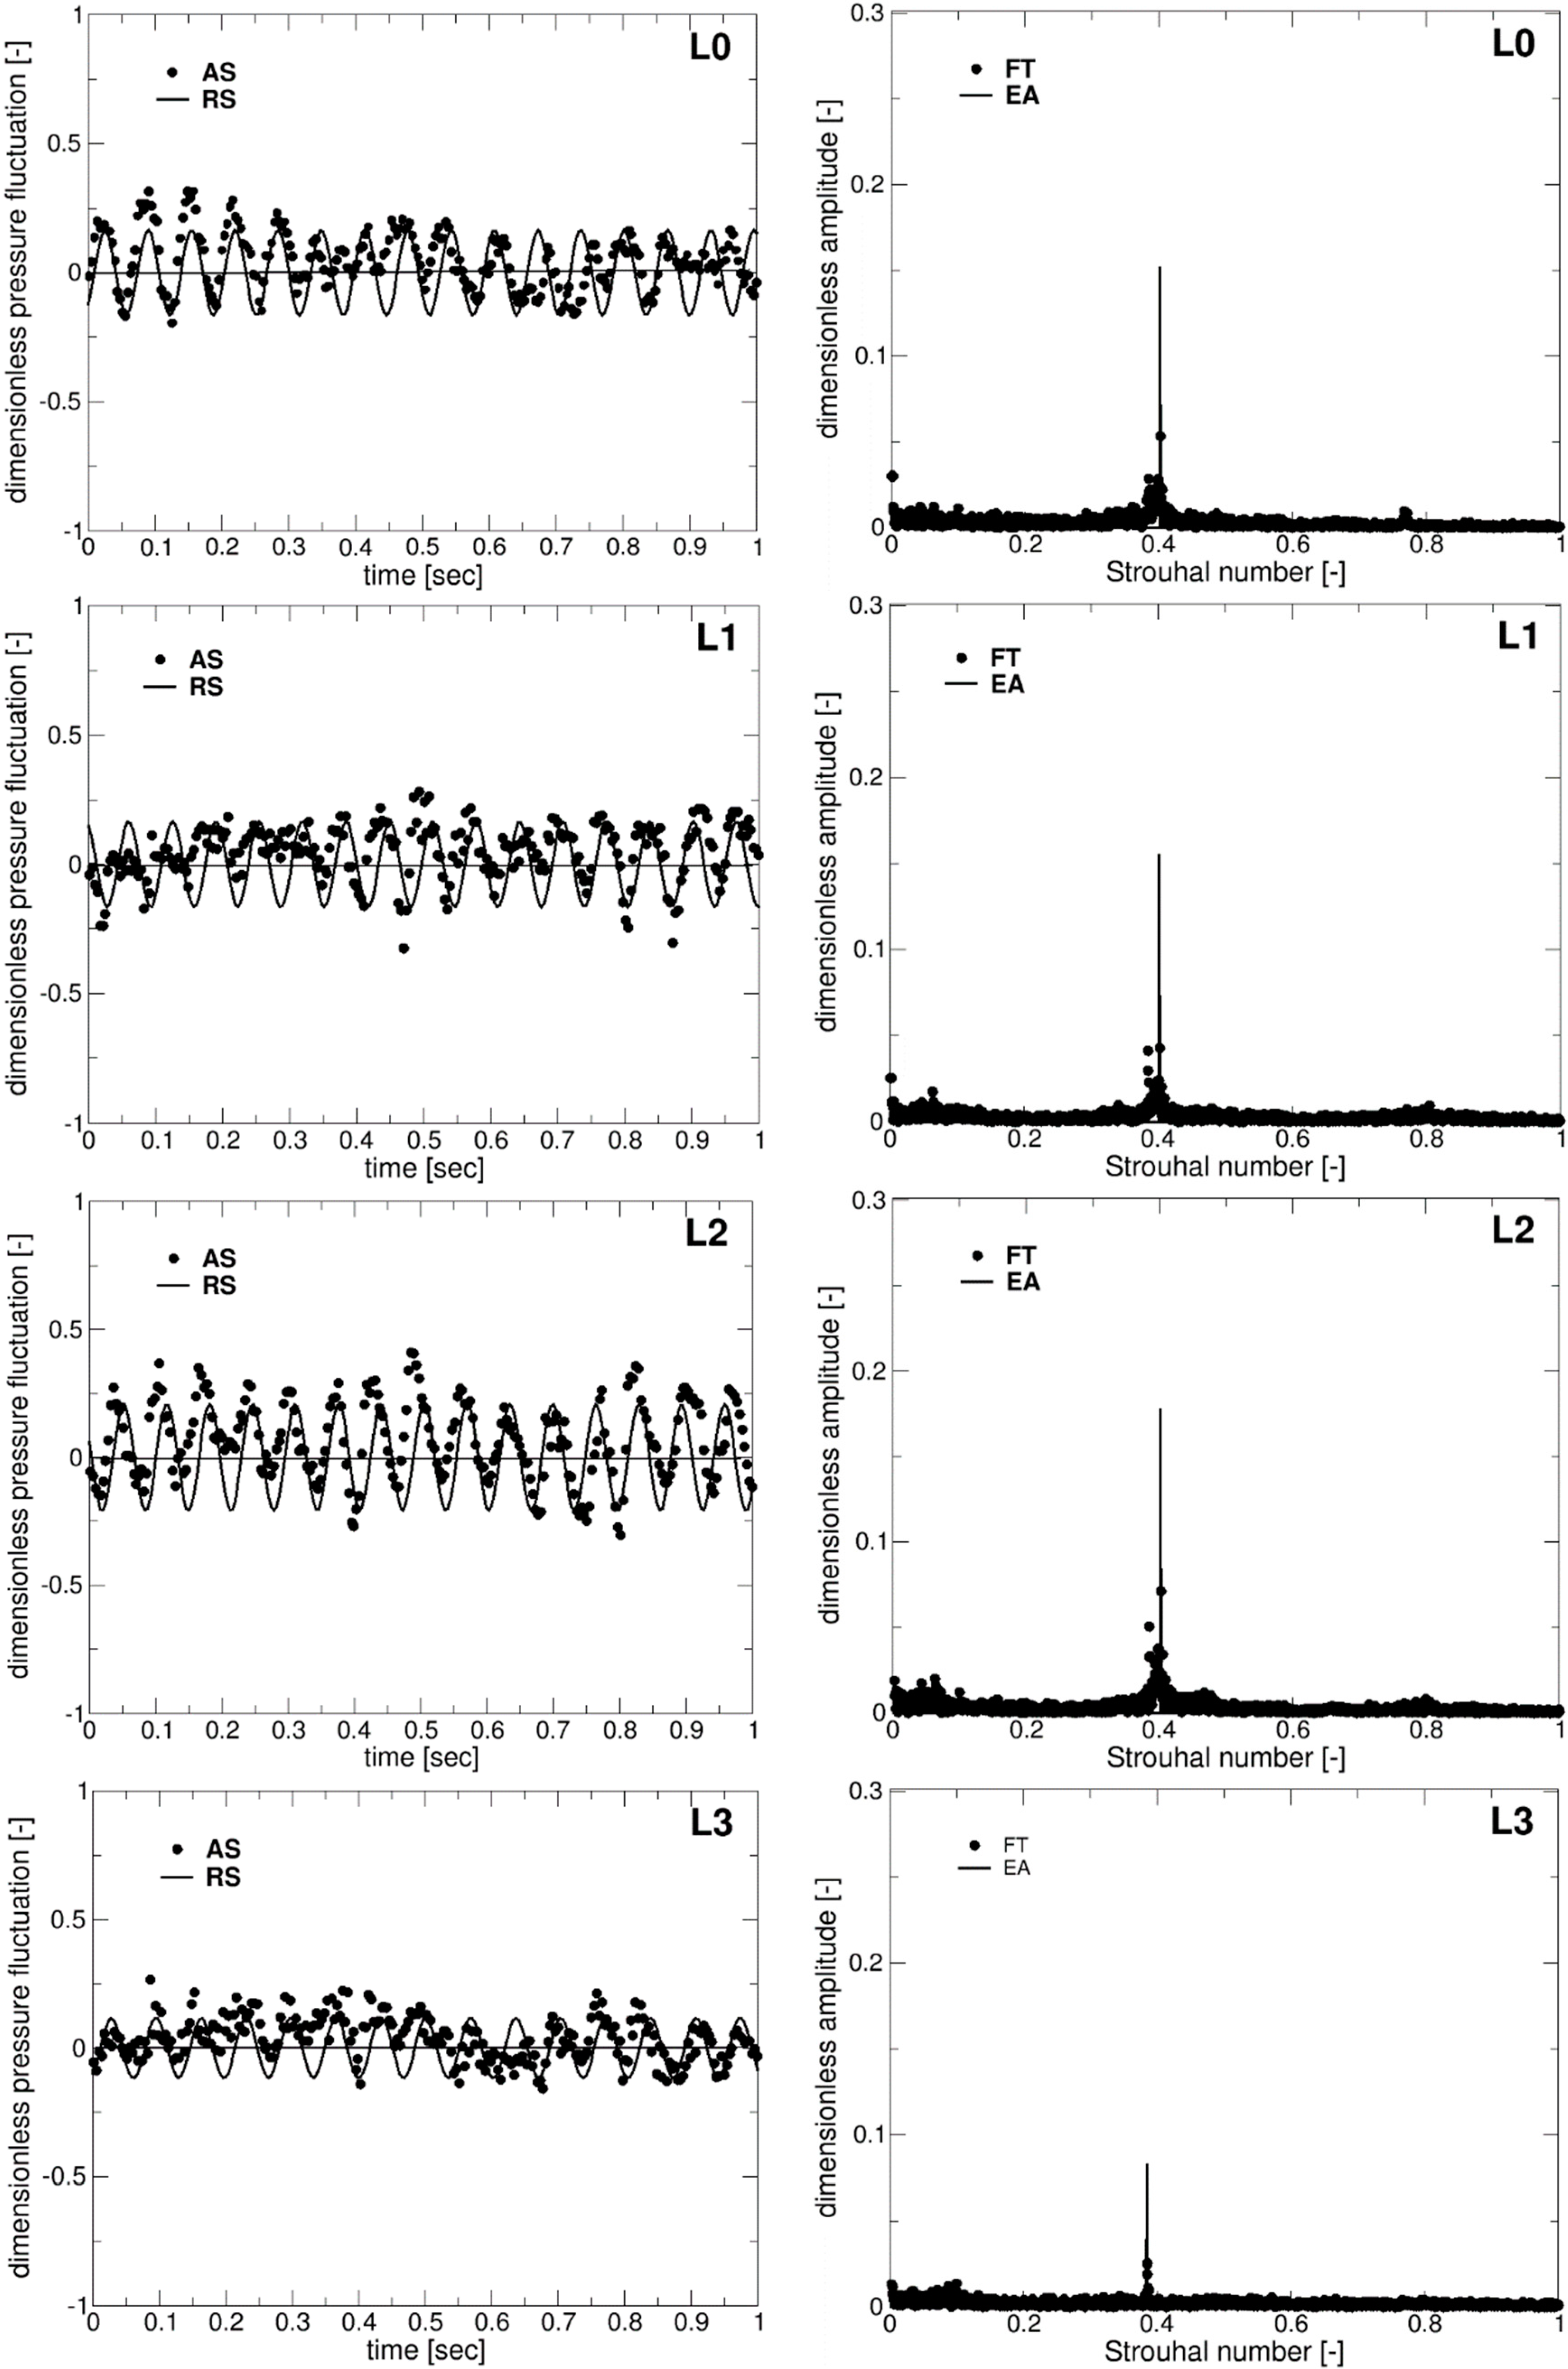
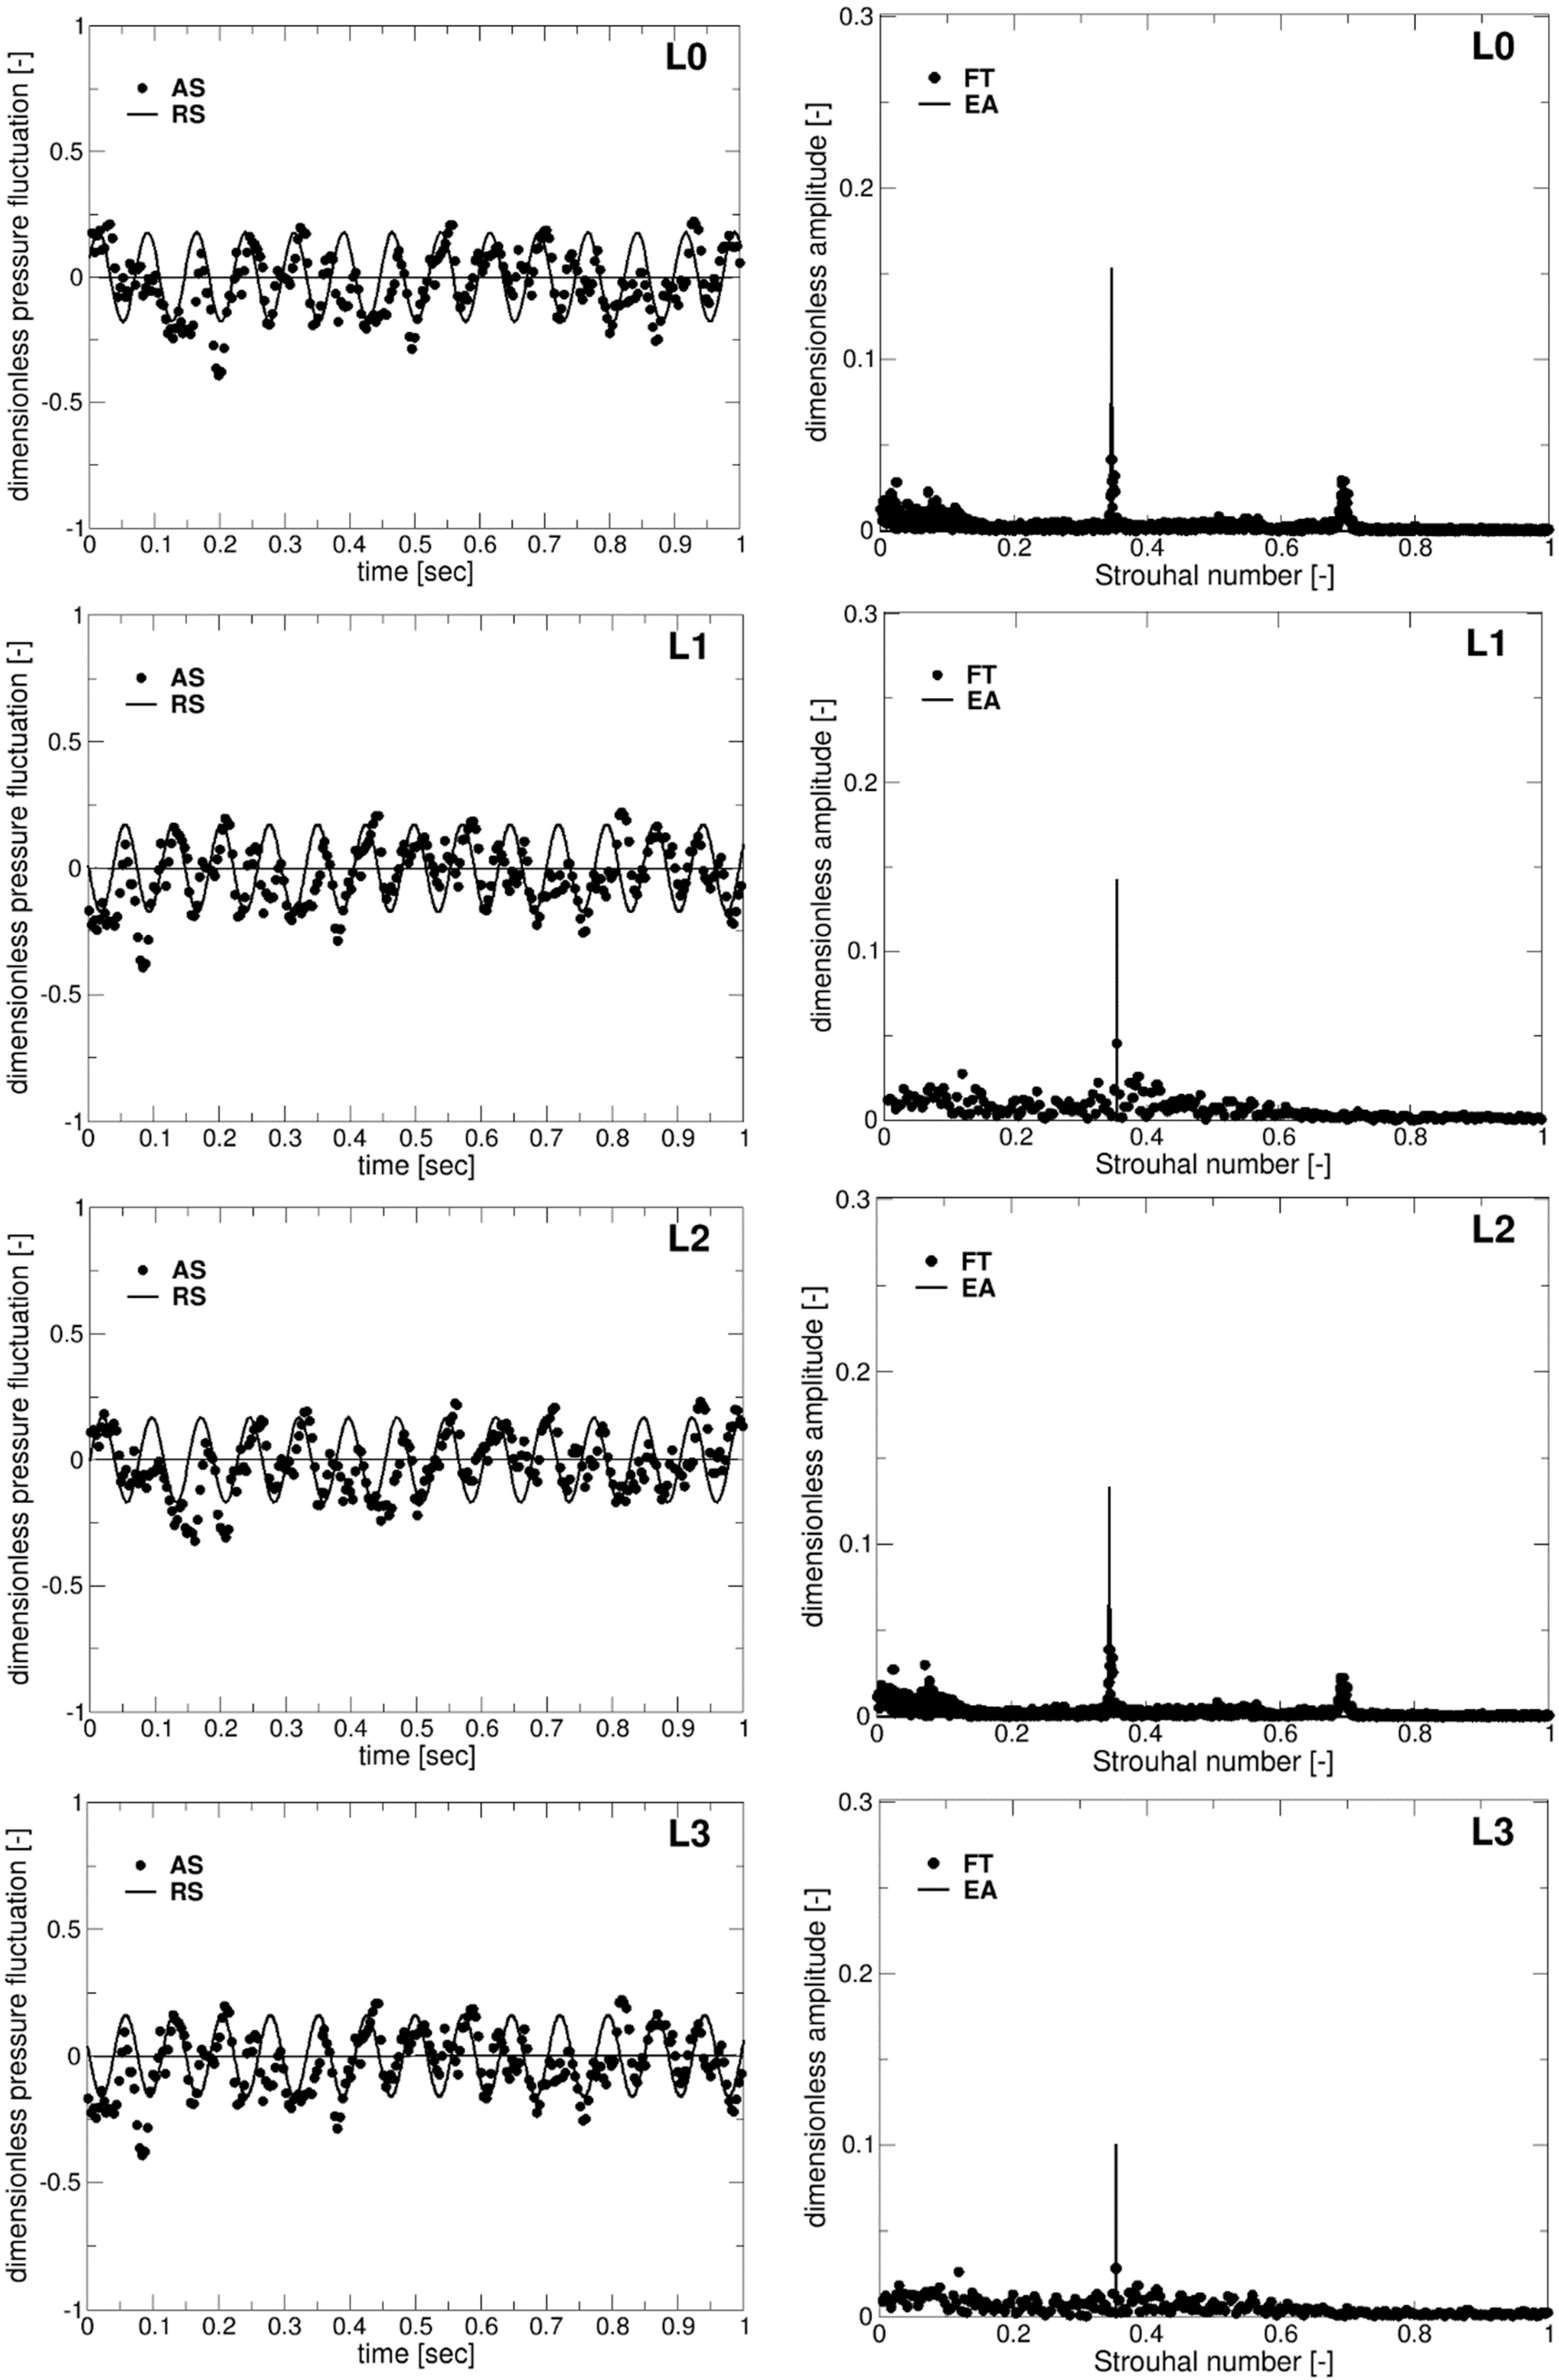
3.2. Unsteady Pressure Analysis

In this section, we investigate the Fourier spectra of the unsteady pressure signals acquired on the cone wall for all shutter area ratios. The fundamental frequency associated with the self-induced instability and the equivalent amplitude determined based on Parseval’s theorem [35] are obtained for each case. The precessing frequency is written in dimensionless form using the Strouhal number,
Sh = f D t V t ,
while the dimensionless amplitude of the pressure pulsation is given as follows,
A 2 p RMS ρ V t 2 / 2
The equivalent pressure pulsation amplitude is 2 p RMS where p RMS is the root mean square of the unsteady part of the pressure signal according to Parseval’s theorem [26]. This value quantifies the level of the flow unsteadiness. The acquired pressure fluctuations (AS), the reconstructed signals (RS) and its Fourier spectra (FT) on all four levels of the cone wall are plotted in Figure 4 for the case with vortex rope (without diaphragm). The Strouhal number Sh~0.39 is associated with the dominant frequency of the helical vortex rope. Here, the maximum equivalent amplitude (EA~0.28) is obtained on L1 level being associated with the largest eccentricity of the vortex filament [36]. The experimental investigation of the unsteady pressure field on the cone wall is performed for all diaphragm openings corresponding to different shutter area ratios. Significant pressure pulsation mitigation is obtained for all cases, with case involving diaphragm in comparison with the case without the diaphragm.
In this paper, the acquired pressure fluctuations (AS), the reconstructed signals (RS) and its Fourier spectra (FT) on all levels of the cone wall for two diaphragm shutter area ratios of 50% (d = 0.113 m) and 70% (d = 0.088 m) are plotted in Figure 5 and Figure 6, respectively. One can observe that the maximum equivalent amplitudes of EA~0.17 were obtained. This value is diminished by over 45% in the case without the diaphragm. A synopsis view over dynamic performances of this new control method is provided in Figure 7. The evolution of equivalent amplitudes on the cone wall for all investigated cases is provided in Figure 7a. In addition, the Strouhal number associated with the self-induced instability for all investigated cases is plotted in Figure 7b. It can be observed that the frequency is changing in a limit of 10% for the case with the maximum shutter area ratio. The Strouhal number is practically unchanged when the shutter area is slightly increased while the maximum equivalent amplitude of the pressure pulsations is mitigated. On the other side, it significantly decreases the maximum equivalent amplitude on all levels, being around the same values for diaphragm cases with shutter area ratios from 50% to 70% (d = 0.113 … 0.088 m).
Two snapshots with flow structure captured on the test rig are presented in Figure 8 to support the results. To visualize the flow structures, we introduced air in the rig. One can observe a precessing helical vortex for a swirling flow with no control method in Figure 8a. The bubble-type vortex is visualized at the shutter area ratio of 70% corresponding to the inner diameter of the diaphragm of d = 0.088 m. This vortex shape is less harmful from the dynamic point of view than the helical shape presented in Figure 8b. Zhang et al. [37] visualized a similar helical structure in a draft tube cone of a Francis turbine model operating at part-load conditions.
Extensive experimental and numerical investigations have given a comprehensive understanding of the flow structure with various details of the hydrodynamic field [38]. Resiga et al. [39] have shown that the velocity profiles with central recirculation or quasi-stagnation region capture well the velocity field associated to swirling flow in a cone.
The helical vortex is wrapped on the central recirculation or quasi-stagnation region with a larger angle than the cone wall, inducing strong pressure fluctuations on the cone wall.
Moreover, Skripkin et al. [36] identify aperiodic pressure pulses on the cone wall because of self-merging and reconnecting of the vortex helix with the formation of a vortex ring.
Sarpkaya [40], Hall [41] and Leibovich [42,43,44] showed that the vortex breakdown is a sudden change in the slender vortex core, evolving downstream into a bubble shape or a helical pattern. Tănasă et al. [45] numerically shows this recirculation region captured inside the cone. As a result, the bubble type is an axisymmetric expansion of the recirculation zone with smaller eccentricity being less harmful than the helical type.
It may be worthwhile to note that the diaphragm inducing an axisymmetric flow forces the transition from a helical type to a bubble shape. A compromise between the pressure pulsation mitigation and the hydraulic losses has to be performed when this method is used. For this reason, the shutter area ratio of a diaphragm between 40–60% is recommended to be operated at part-load conditions to maintain a good balance between the hydraulic losses and the pressure fluctuation mitigation [34]. As a result, the dimensionless equivalent amplitudes on the cone wall obtained for the diaphragm control method with the shutter area ratio of 50% are compared against swirling flow with vortex rope and the method of axial water jet method with 10% discharge, developed by Bosioc et al. [26] (Figure 9). By comparison, when it is used the diaphragm, the amplitudes has lower values than the water jet injection method.

3.3. Pressure Pulsations Decomposition

Wahl [46] identifies two types of pressure fluctuations associated with the draft tube surge. First one is the asynchronous (rotating) type of the pressure fluctuation being associated to the precession of the helical vortex. The asynchronous pressure fluctuation is trapped in the discharge cone, according to Wu et al. [47]. The other fluctuation is synchronous (plunging) one. This fluctuations travel as standing waves along to the hydraulic passage being dangerous in operation. Several theories have been advanced to account for synchronous pressure fluctuations [48,49]. Nishi et al. [21] suggested that the interaction between the vortex rope and the draft tube elbow is the source of the synchronous fluctuations. Jacob and Prenat [50] have performed a phase analysis for two simultaneously acquired pressure signals on the discharge cone of a Francis turbine to discriminate between rotating (asynchronous) and plunging (synchronous) oscillations, respectively. In their investigations, the synchronous (plunging) component was lower in amplitude than the asynchronous (rotating) component. However, the synchronous (plunging) pressure pulsations are accepted as the driving mechanism behind most operational problems related to draft tube surging, although there are times when simple vibration and noise caused by the asynchronous (rotating) pulsations can be serious.
Synchronous (plunging) pressure fluctuations can produce variations in head, discharge, torque, and output power known in the literature as a power swing [13]. Equations (5) and (6) are applied for two unsteady signals acquired on the same level to discriminate between asynchronous and synchronous components, respectively:
P ( t ) = ST 1 + ST 2 2
R ( t ) = ST 1 P
As expected, the equivalent amplitudes associated with the rotating component (RC) are larger than the plunging component (PC) for the case without the diaphragm (Figure 10). This means the helical structure of the vortex rope is well developed. The plunging component (PC) becomes dominant regarding the rotating component (RC) when the diaphragm with a shutter area ratio larger than 50% throttles the cone outlet area. In these cases, the flow structure in the cone changes as the cross-section closes, revealing a bubble type for the case with an area ratio of 70%. In addition, the mitigation of pressure pulsations by up to 45% for all diaphragm cases highlighted in the previous section implies a significant decrease of the rotating component (up to 80–90%) correlated with a slight increase (10% to 50%) of the plunging component compared with the case without a diaphragm (note that we investigated the diaphragm method on a surrogate model of swirl generator). However, the goal was to mitigate the rotating part associated to the vortex rope. This conclusion supports our previous recommendation about selecting a diaphragm with a shutter area ratio from 40% to 60% [34].

4. Conclusions

The paper introduces a novel passive control approach for mitigating the self-induced instabilities in decelerated swirling flows using an adjustable diaphragm. We performed extensive experimental investigations without and with a diaphragm placed at the cone outlet. Four diaphragm openings with the following shutter area ratios of 30%, 50%, 60% and 70% are selected. The experimental investigations are performed on a swirling flow test rig. The unsteady pressure signals are acquired on the cone wall to assess the performances of the new control method. The pressure recovery on the cone wall is obtained based on mean values while the dynamic behavior is determined from the unsteady part of the recorded signals. Next, both plunging and rotating components are discriminated based on the acquired unsteady pressure signals.
The conclusions are summarized as follows:
(i)
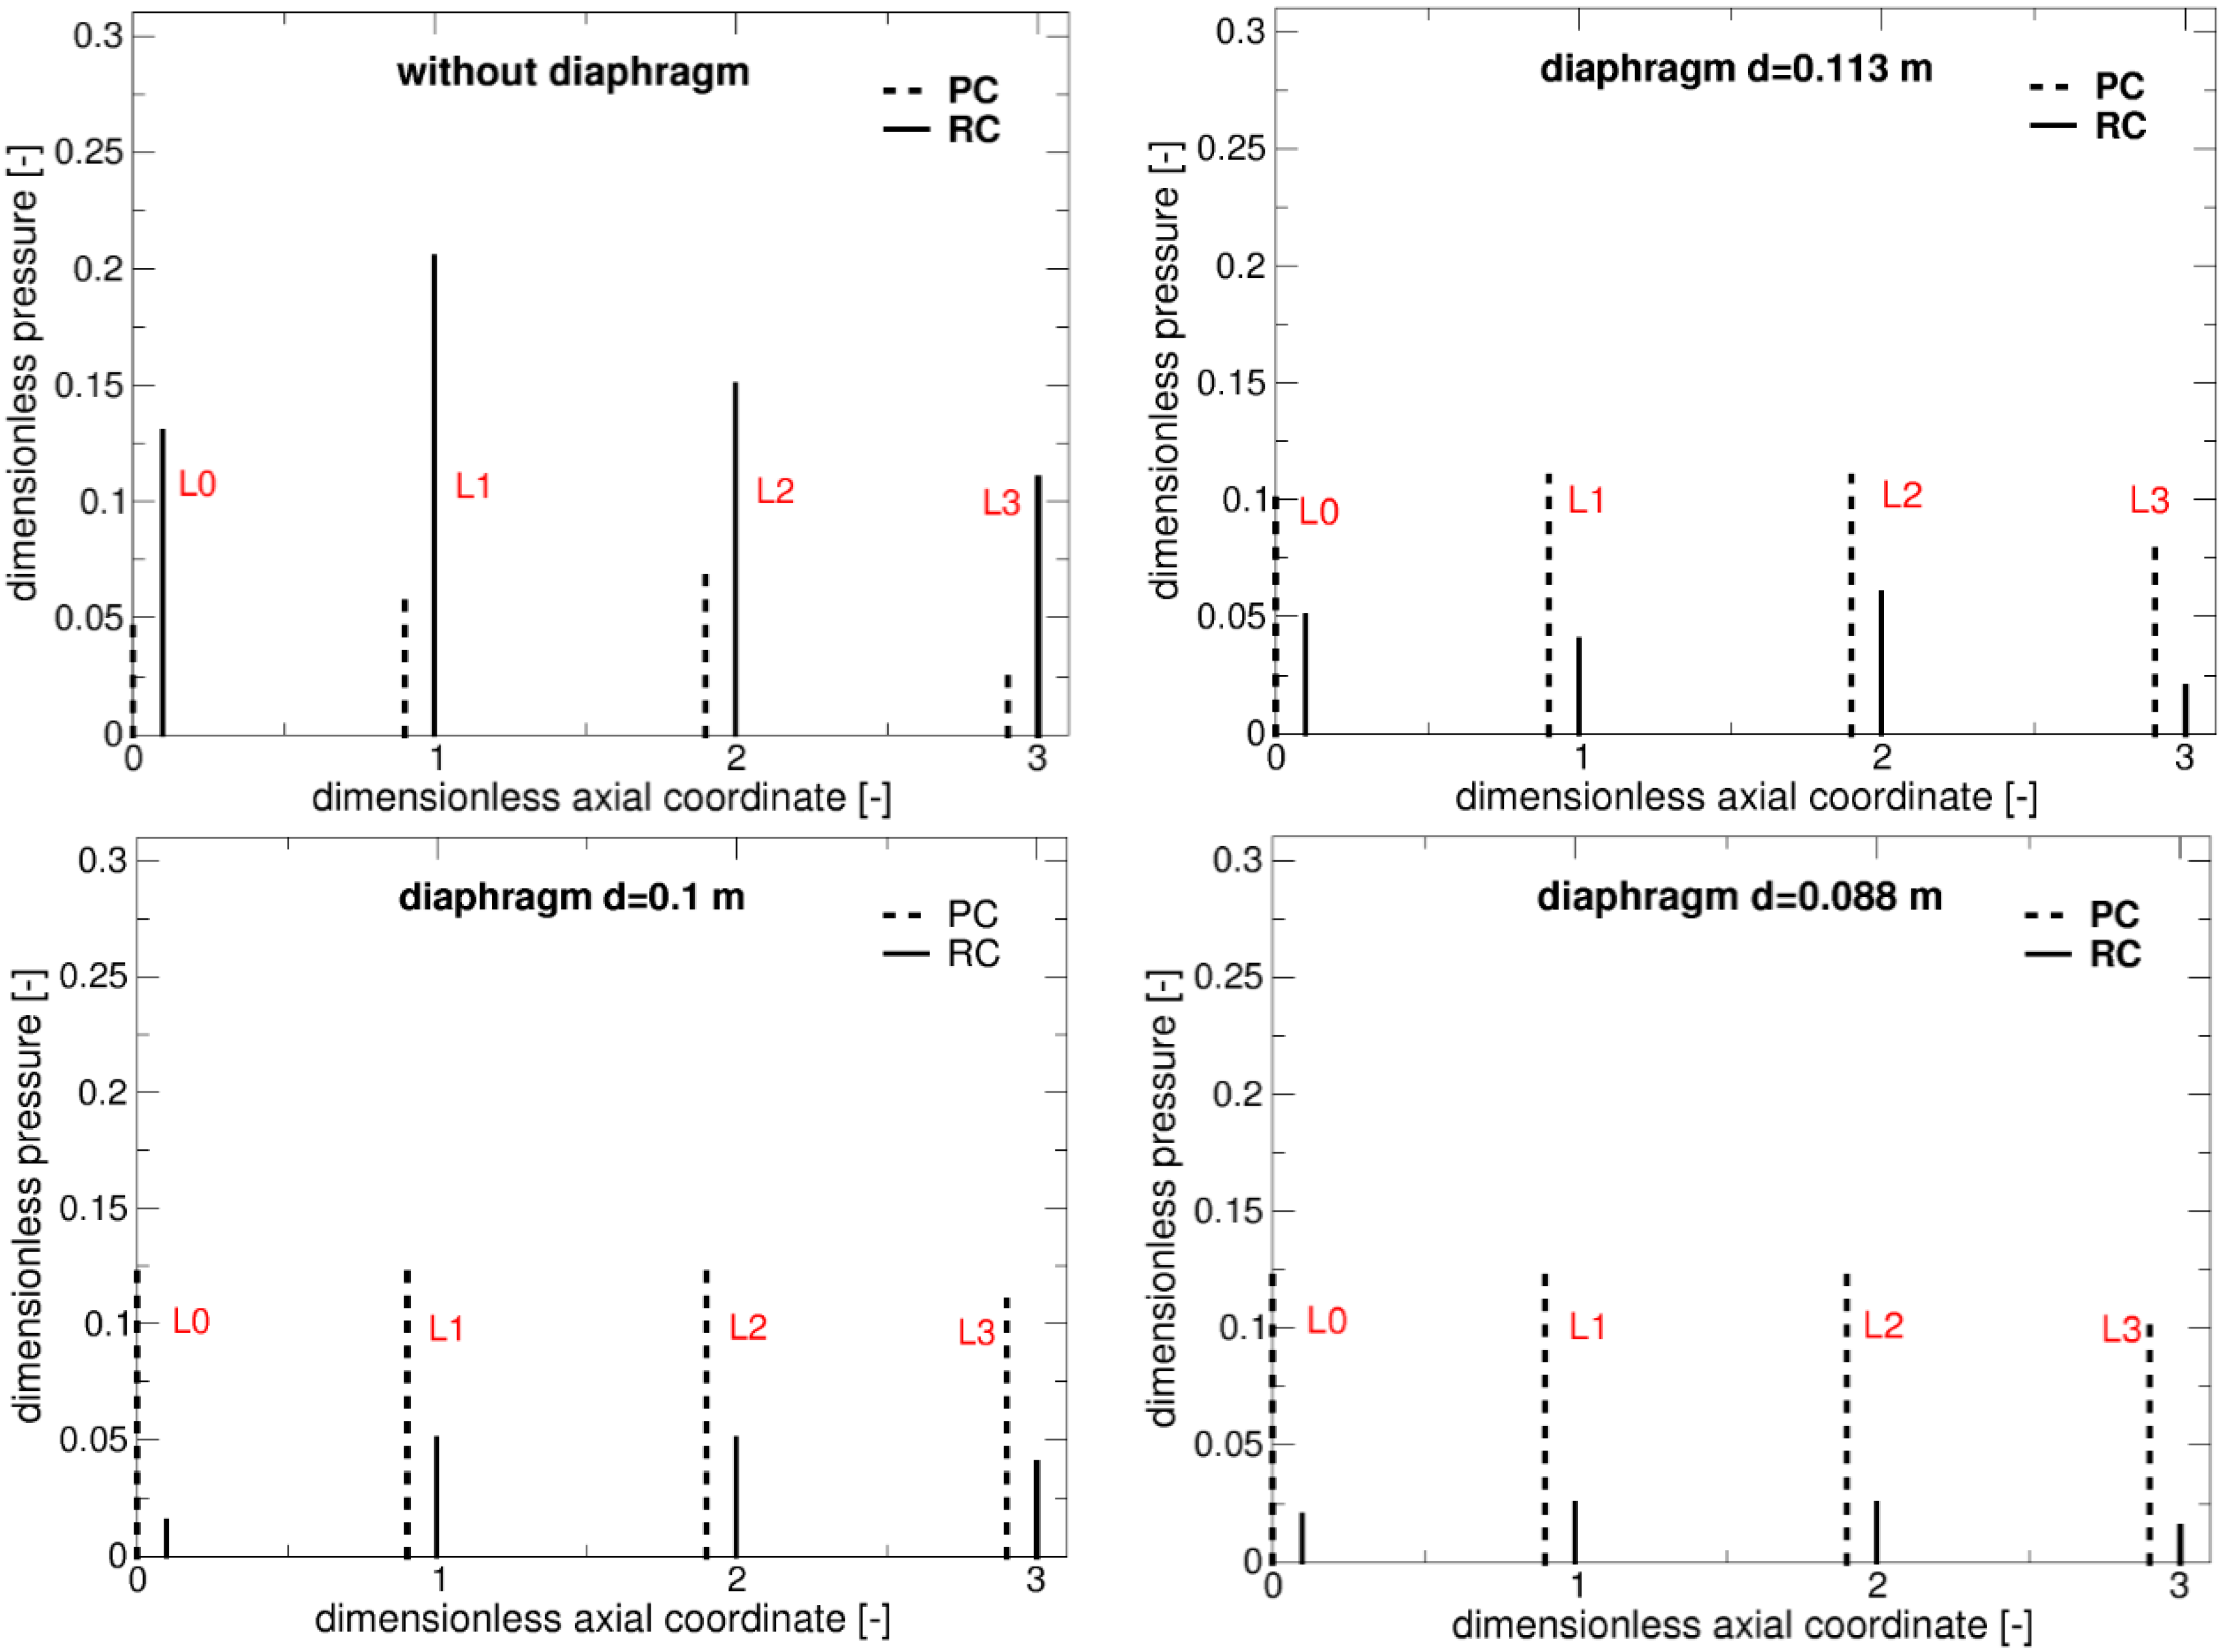
The pressure recovery on the cone wall is significantly improved using the diaphragm method regarding the swirling flow (e.g., the pressure recovery on the cone wall is more than twice of that on the L2 level, which is located in the middle of the cone).
(ii)
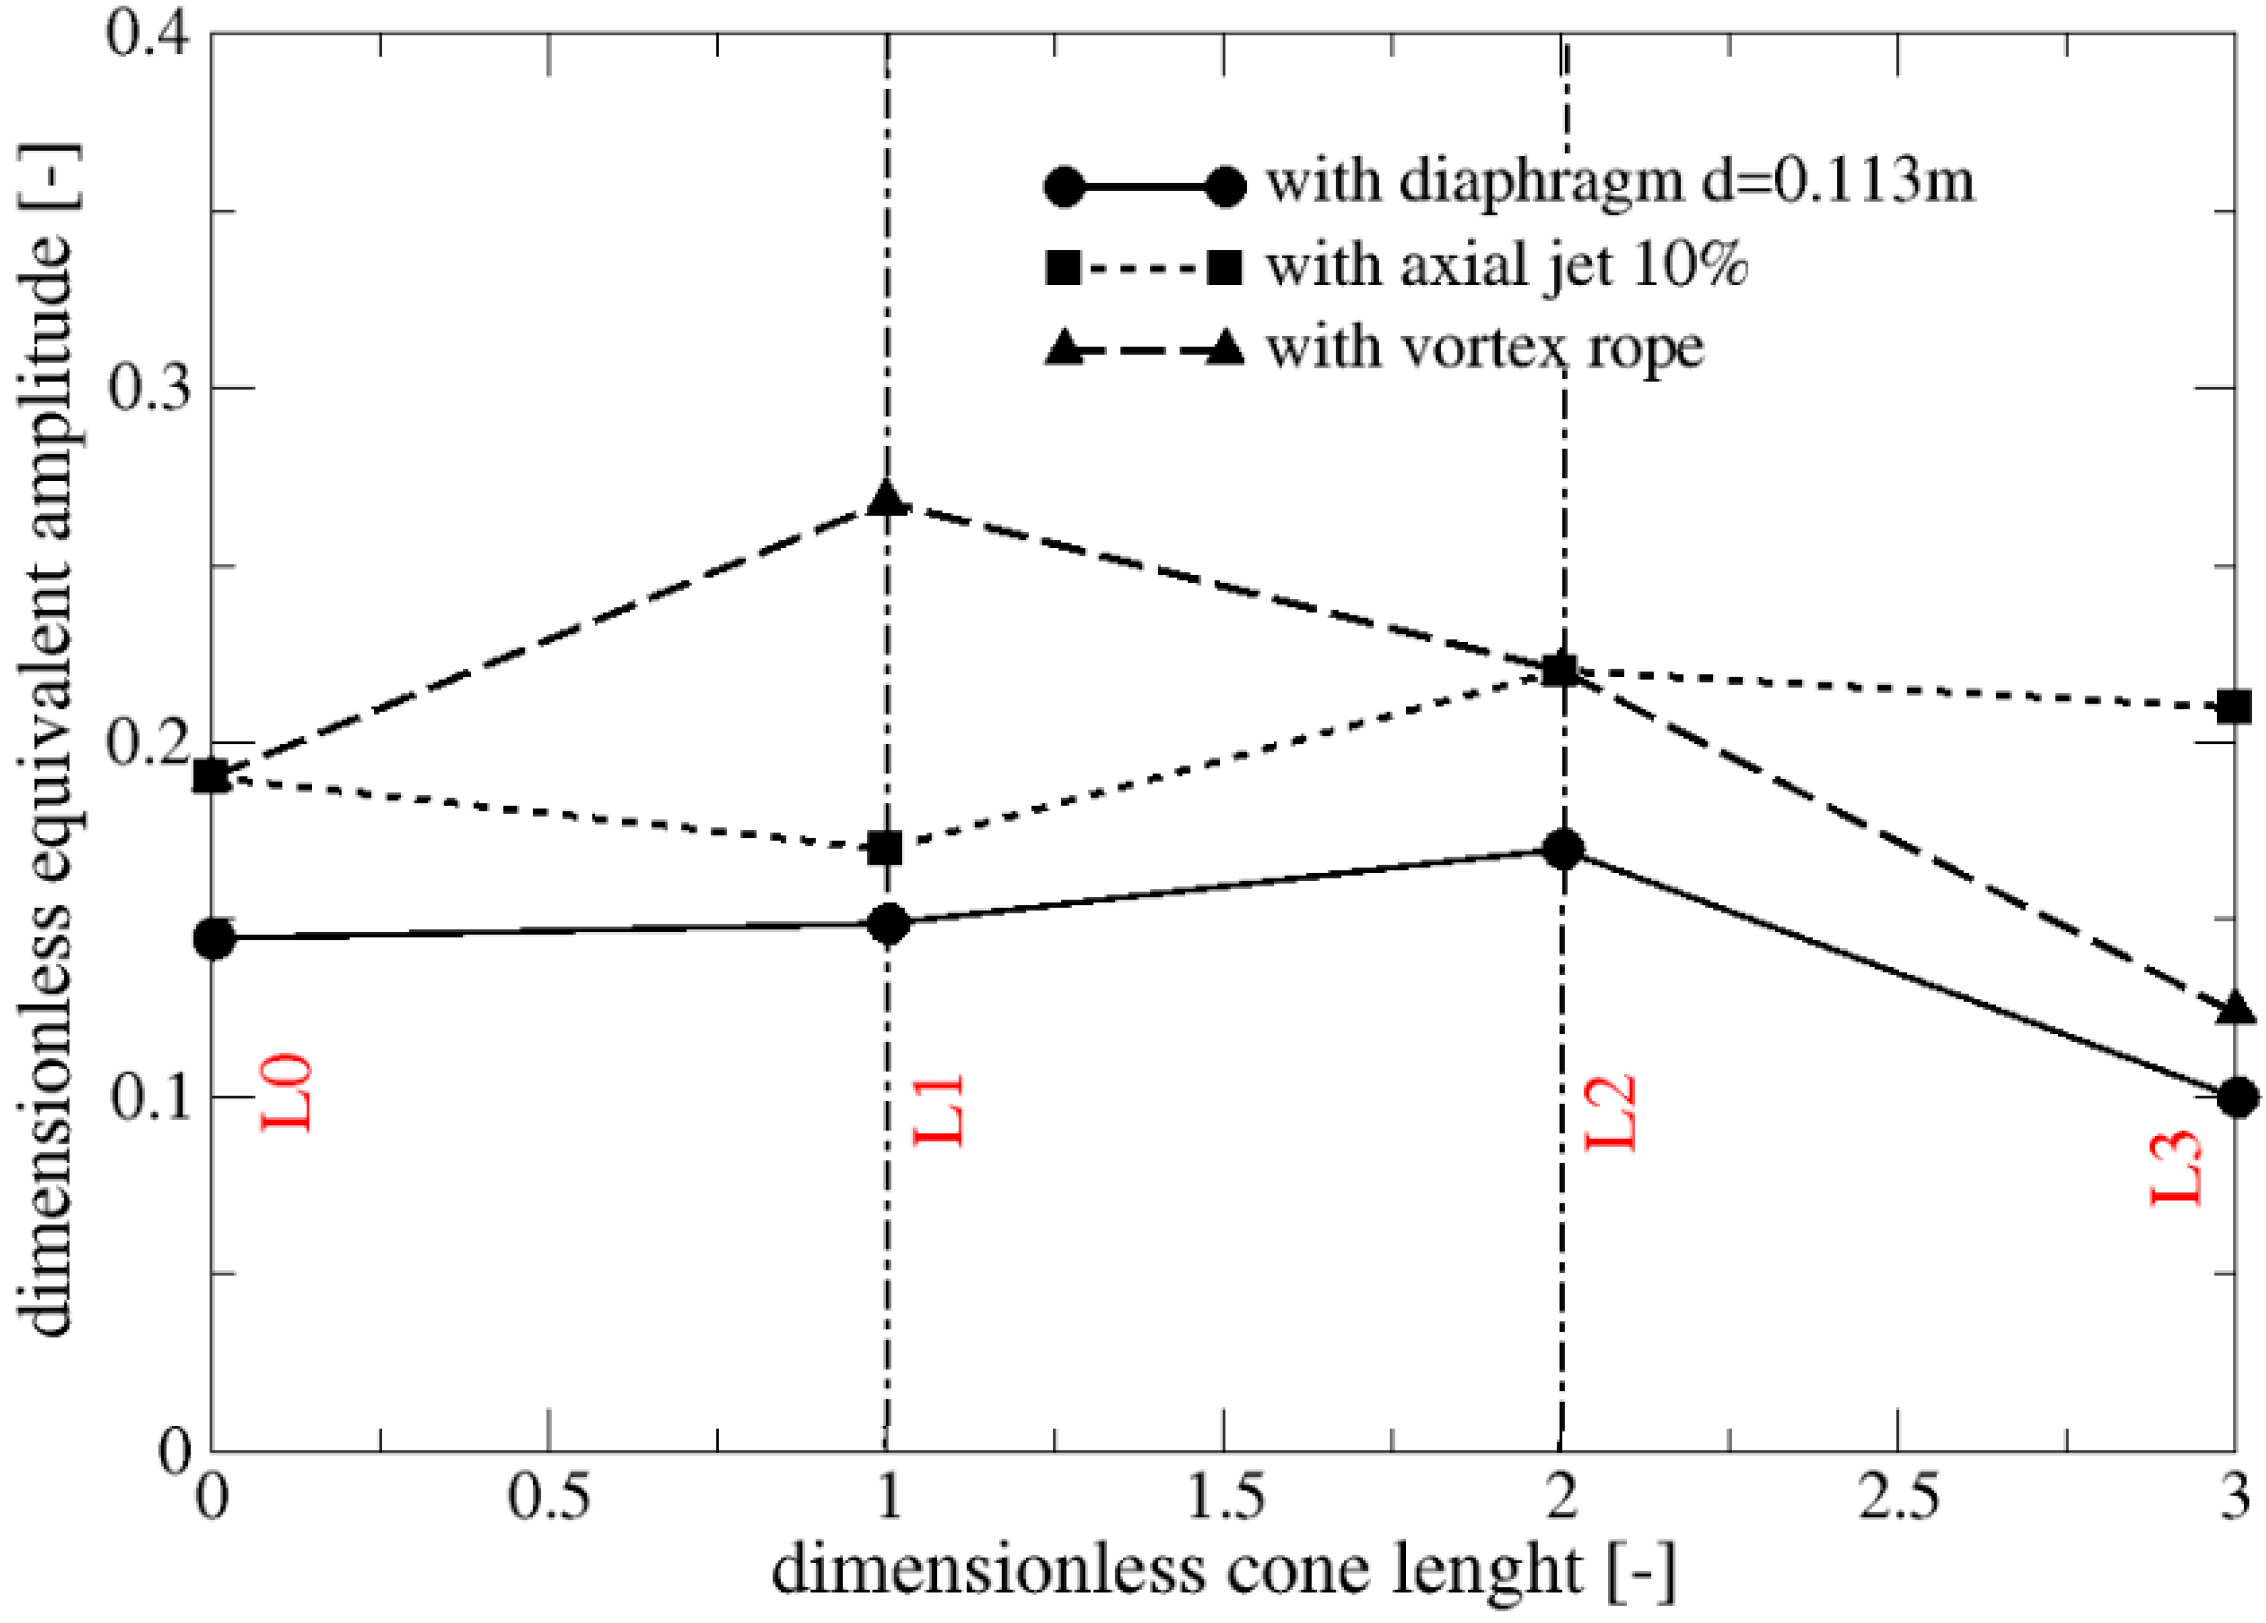
The diaphragm method decreases the amplitude of the pressure fluctuation up to 45% while the frequency remains practically unchanged.
(iii)
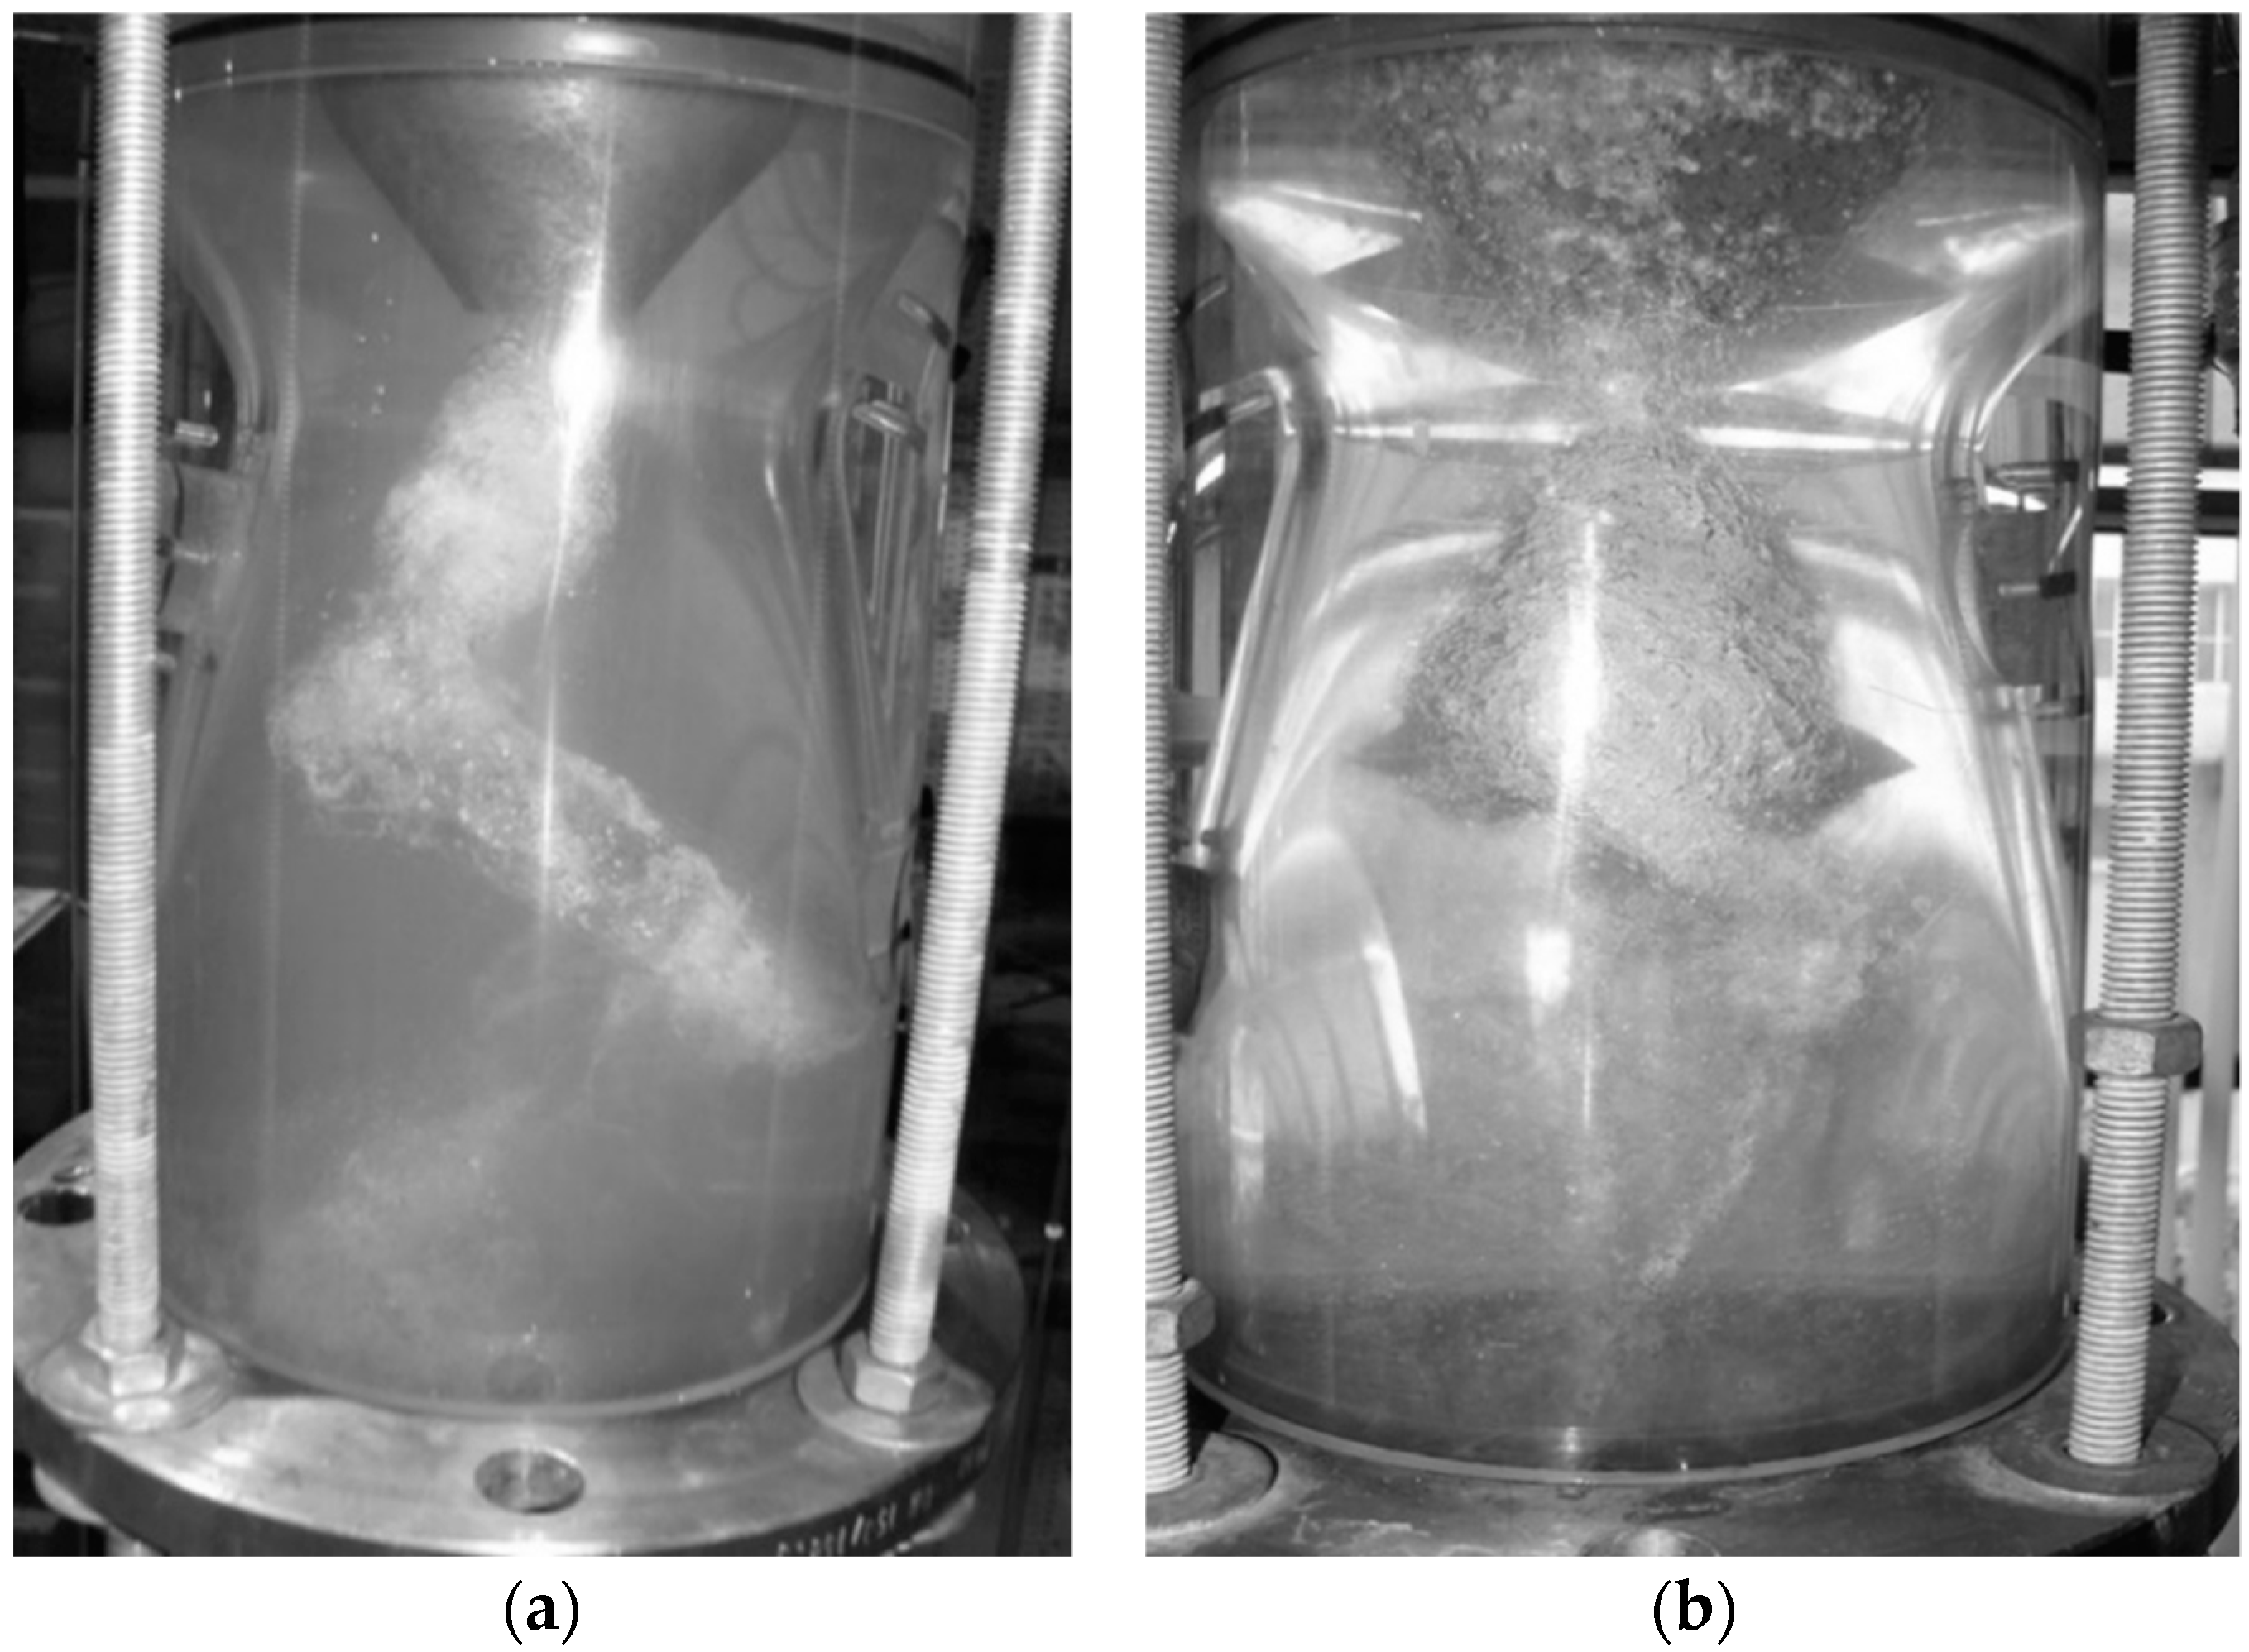
The bubble-type vortex flow configuration occurs when the diaphragm shutter area ratio of 70% (d = 0.088 m) is selected. This vortex configuration is less harmful than the swirling flow with the helical vortex rope.
(iv)
The amplitude of the rotating component is significantly diminished when the shutter area of the diaphragm is increased. In contrast, the amplitude of the plunging component is slightly amplified when the diaphragm shutter area is increased.
(v)
The mitigation of this plunging component is the subject of another research study using a pulsating water jet control method [51].
The dimensionless equivalent amplitudes obtained with this passive control method are compared against an axial water jet control method. The dimensionless equivalent amplitudes associated to the diaphragm method with the shutter area ratio of 50% are smaller than values with axial water method with 10% jet discharge. One can conclude that the novel proof of a concept examined in this paper brings valuable benefits if it fulfils a good balance between the dynamical behavior and the hydraulic losses. The diaphragm method is simple, robust, low-cost, is easy to implement on a real turbine, and is easily operated.
This passive control method can be appropriately adjusted in terms of the operating conditions. We recommend that the diaphragm be operated with the shutter area ratios from 40% to 60% for a swirling flow configuration (as investigated in this paper) to strike a good balance between the dynamical behavior and the hydraulic losses. In addition, we recommend the diaphragm be switched on at the recommended operating conditions, while it should be retracted to the cone wall if the hydraulic turbine operates around the best efficiency point.

5. Patents

This new method for swirling flow control is patented according to State Office for Inventions and Trademarks—Romania, no. 130075: Title: Method and equipment for controlling the swirling flow through the conical diffuser of hydraulic turbines. Inventors: Susan-Resiga, R.F., Tanasa, C., Bosioc, A.I., Ciocan, T., Stuparu, A., Muntean, S.

Author Contributions

Conceptualization, R.S.-R.; Investigation, C.T.; Methodology, A.B.; Validation, C.T.; Writing—original draft, C.T.; Writing—review & editing, S.M.

Funding

This research received no external funding.

Acknowledgments

This work was supported by research grant GNaC2018—ARUT, No. 1362/01.02.2019, financed by Politehnica University of Timisoara.

Conflicts of Interest

The authors declare no conflicts of interest.

Nomenclature

ASAcquired signal
RSReconstructed signal
FTFourier transform
EAEquivalent amplitude
PCPlunging component
RCRotating component
Dt [m]Reference diameter of the throat D t = 0.1 [ m ]
f [ Hz ] Dominant frequency
Q [ m 3 / s ] Main discharge at the inlet of the test section
c p [ ] Dimensionless pressure coefficient
N Number of measured samples
p ¯ [ Pa ] Mean pressure
p R M S [ Pa ] Root mean square of the pressure signal
S h [ ] Strouhal number
Vt [m/s]Bulk velocity in the throat of convergent- divergent test section
σ Standard deviation
ρ [ kg / m 3 ] Density

References

  1. SWECO. Study on the Effective Integration of Distributed Energy Resources for Providing Flexibility to the Electricity System; European Commission: Brussels, Belgium, 2015. [Google Scholar]
  2. Muntean, S.; Susan-Resiga, R.; Goede, E.; Baya, A.; Terzi, R.; Tîrşi, C. Scenarios for refurbishment of a hydropower plant equipped with Francis turbines. Renew. Energy Environ. Sustain. 2016, 1, 1–6. [Google Scholar] [CrossRef]
  3. Valero, C.; Egusquiza, M.; Egusquiza, E.; Presas, A.; Valentin, D.; Bossio, M. Extension of Operating Range in Pump-Turbines. Influence of Head and Load. Energies 2017, 10, 2178. [Google Scholar] [CrossRef]
  4. Pavesi, G.; Cavazzini, G.; Ardizzon, G. Numerical Simulation of a Pump–Turbine Transient Load Following Process in Pump Mode. ASME J. Fluids Eng. 2018, 140, 021114. [Google Scholar] [CrossRef]
  5. Trivedi, C.; Cervantes, M.J.; Gandhi, B.K.; Dahlhaug, O.G. Transient Pressure Measurements on a High Head Model Francis Turbine During Emergency Shutdown, Total Load Rejection, and Runaway. ASME J. Fluids Eng. 2014, 136, 121107. [Google Scholar] [CrossRef]
  6. Trivedi, C.; Cervantes, M.J.; Dahlhaug, O.G.; Gandhi, B.K. Experimental Investigation of a High Head Francis Turbine during Spin-No-Load Operation. ASME J. Fluids Eng. 2015, 137, 061106. [Google Scholar] [CrossRef]
  7. Trivedi, C.; Gogstad, P.J.; Dahlhaug, O.G. Investigation of the unsteady pressure pulsations in the prototype Francis turbines during load variation and start-up. J. Renew. Sustain. Energy 2017, 9, 064502. [Google Scholar] [CrossRef]
  8. Susan-Resiga, R.; Ciocan, G.D.; Anton, I.; Avellan, F. Analysis of the swirling flow downstream a Francis turbine runner. ASME J. Fluids Eng. 2006, 128, 177–189. [Google Scholar] [CrossRef]
  9. Ciocan, T.; Susan-Resiga, R.F.; Muntean, S. Modelling and optimization of the velocity profiles at the draft tube inlet of a Francis turbine within an operating range. J. Hydraul. Res. 2016, 54, 74–89. [Google Scholar] [CrossRef]
  10. Kubota, T.; Han, F.; Avellan, F. Performance Analysis of Draft Tube for Gamm Francis Turbine. In Hydraulic Machinery and Cavitation; Cabrera, E., Espert, V., Martínez, F., Eds.; Springer: Dordrecht, The Netherlands, 1996; pp. 130–139. [Google Scholar]
  11. Vu, T.; Retieb, S. Accuracy assessment of current CFD tools to predict hydraulic turbine efficiency hill chart. In Proceedings of the 21st IAHR Symposium on Hydraulic Machinery and Systems, Laussane, Switzerland, 9–12 September 2002; pp. 193–198. [Google Scholar]
  12. Susan-Resiga, R.; Muntean, S.; Avellan, F.; Anton, I. Mathematical modeling of swirling flow in hydraulic turbines for the full operating range. Appl. Math. Model. 2011, 35, 4759–4773. [Google Scholar] [CrossRef]
  13. Valentin, D.; Presas, A.; Egusquiza, E.; Valero, C.; Egusquiza, M.; Bossio, M. Power Swing Generated in Francis Turbines by Part Load and Overload Instabilities. Energies 2017, 10, 2124. [Google Scholar] [CrossRef]
  14. Rheingans, W.J. Power swings in hydroelectric power plants. Trans. ASME 1940, 62, 171–184. [Google Scholar]
  15. Nishi, M.; Liu, S.-H. An Outlook on the Draft-Tube-Surge Study. Int. J. Fluid Mach. Syst. 2013, 6, 33–48. [Google Scholar] [CrossRef]
  16. Dorji, U.; Ghomashchi, R. Hydro turbine failure mechanisms: An overview. Eng. Fail. Anal. 2014, 44, 136–147. [Google Scholar] [CrossRef]
  17. Avellan, F. Introduction to cavitation in hydraulic machinery. In Proceedings of the 6th International Conference on Hydraulic Machinery and Hydrodynamics, Timisoara, Romania, 21–22 October 2004. [Google Scholar]
  18. Luo, X.-W.; Ji, B.; Tsujimoto, Y. A review of cavitation in hydraulic machinery. J. Hydrodyn Ser. B 2016, 28, 335–358. [Google Scholar] [CrossRef]
  19. Luna-Ramírez, A.; Campos-Amezcua, A.; Dorantes-Gómez, O.; Mazur-Czerwiec, Z.; Muñoz-Quezada, R. Failure analysis of runner blades in a Francis hydraulic turbine—Case study. Eng. Fail. Anal. 2016, 56, 14–325. [Google Scholar] [CrossRef]
  20. Nakanishi, K.; Ueda, T. Air supply into draft tube of Francis turbine. Fuji Electr. Rev. 1964, 10, 81–91. [Google Scholar]
  21. Nishi, M.; Wang, X.M.; Yoshida, K.; Takahashi, T.; Tsukamoto, T. An Experimental Study on Fins, Their Role in Control of the Draft Tube Surging. In Proceedings of the 18th IAHR Symposium on Hydraulic Machinery and Cavitation, Valencia, Spain, 16–19 September 1996; Cabrera, E., Ed.; Springer: Dordrecht, The Netherlands, 1996; pp. 905–914. [Google Scholar]
  22. Biela, V.; Beltran, H. Draft tube fins. In Proceedings of the 19th IAHR Symposium Section on Hydraulic Machinery and Cavitation, Singapore, 9–11 September 1998; Brekke, H., Ed.; World Scientific: Singapore, 1998; pp. 454–461. [Google Scholar]
  23. Gogstad, P.J.; Dahlhaug, O.G. Evaluation of runner cone extension to dampen pressure pulsations in a Francis model turbine. IOP Conf. Ser. Earth Environ. Sci. 2016, 49, 082019. [Google Scholar] [CrossRef]
  24. Pasche, S.; Avellan, F.; Gallaire, F. Optimal Control of Part Load Vortex Rope in Francis Turbines. J. Fluids Eng. 2019, 141, 081203. [Google Scholar] [CrossRef]
  25. Susan-Resiga, R.; Vu, T.C.; Muntean, S.; Ciocan, G.D.; Nennemann, B. Jet Control of the Draft Tube in Francis Turbines at Partial Discharge. In Proceedings of the 23rd IAHR Symposium on Hydraulic Machinery and Systems, Yokohama, Japan, 17–20 October 2006. [Google Scholar]
  26. Bosioc, A.I.; Susan-Resiga, R.; Muntean, S.; Tanasa, C. Unsteady Pressure Analysis of a Swirling Flow with Vortex Rope and Axial Water Injection in a Discharge Cone. ASME J. Fluids Eng. 2012, 134, 081104. [Google Scholar] [CrossRef]
  27. Susan-Resiga, R.; Muntean, S. Decelerated Swirling Flow Control in the Discharge Cone of Francis Turbines. In Proceedings of the 4th Int. Symposium on Fluid Machinery and Fluid Mechanics, Beijing, China, 24–27 November 2008; Springer: Berlin/Heidelberg, Germany, 2009; pp. 89–96. [Google Scholar] [CrossRef]
  28. Tănasă, C.; Susan-Resiga, R.; Muntean, S.; Bosioc, A. Flow-Feedback Method for Mitigating the Vortex Rope in Decelerated Swirling Flows. ASME J. Fluids Eng. 2013, 135, 061304. [Google Scholar] [CrossRef]
  29. Javadi, A.; Nilsson, H. Active flow control of the vortex rope and pressure pulsations in a swirl generator. Eng. Applic. Comput. Fluid Mech. 2017, 11, 30–41. [Google Scholar] [CrossRef]
  30. Kirschner, O.; Schmidt, H.; Ruprecht, A.; Mader, R.; Meusburger, P. Experimental investigation of vortex control with an axial jet in the draft tube of a model pump-turbine. IOP Conf. Ser. Earth Environ. Sci. 2010, 22, 012092. [Google Scholar] [CrossRef]
  31. Petit, O.; Bosioc, A.; Nilsson, H.; Muntean, S.; Susan-Resiga, R. Unsteady Simulation of the Flow in a Swirl Generator Using OpenFOAM. Int. J. Fluid Mach. Syst. 2011, 4, 199–208. [Google Scholar] [CrossRef]
  32. Javadi, A.; Bosioc, A.; Nilsson, H.; Muntean, S.; Susan-Resiga, R. Experimental and Numerical Investigation of the Precessing Helical Vortex in a Conical Diffuser, With Rotor–Stator Interaction. ASME J. Fluids Eng. 2016, 138, 081106. [Google Scholar] [CrossRef]
  33. Bosioc, A.; Muntean, S.; Tănasă, C.; Susan-Resiga, R.; Vékás, L. Unsteady pressure measurements of decelerated swirling flow in a discharge cone at lower runner speeds. IOP Conf. Ser. Earth Environ. Sci. 2014, 22, 032008. [Google Scholar] [CrossRef]
  34. Tănasă, C.; Muntean, S.; Ciocan, T.; Susan-Resiga, R.F. 3D Numerical Simulation versus Experimental Assessment of Pressure Pulsations Using a Passive Method for Swirling Flow Control in Conical Diffusers of Hydraulic Turbines. IOP Conf. Ser. Earth Environ. Sci. 2016, 49, 082018. [Google Scholar] [CrossRef]
  35. Riley, K.F.; Hobson, M.P.; Bence, S.J. Mathematical Methods for Physics and Engineering: A Comprehensive Guide; Cambridge University Press: Cambridge, UK, 2006. [Google Scholar]
  36. Skripkin, S.G.; Tsoy, M.A.; Kuibin, P.A.; Shtork, S.I. Study of Pressure Shock Caused by a Vortex Ring Separated from a Vortex Rope in a Draft Tube Model. ASME J. Fluids Eng. 2017, 139, 081103. [Google Scholar] [CrossRef]
  37. Zhang, R.; Mao, F.; Wu, J.; Chen, S.; Wu, Y.; Liu, S. Characteristics and Control of the Draft-Tube Flow in Part-Load Francis Turbine. ASME J. Fluids Eng. 2009, 131, 021101. [Google Scholar] [CrossRef]
  38. Štefan, D.; Rudolf, P.; Muntean, S.; Susan-Resiga, R. Proper Orthogonal Decomposition of Self-Induced Instabilities in Decelerated Swirling Flows and Their Mitigation Through Axial Water Injection. ASME J. Fluids Eng. 2017, 139, 081101. [Google Scholar] [CrossRef]
  39. Susan-Resiga, R.; Muntean, S.; Hasmatuchi, V.; Anton, I.; Avellan, F. Analysis and Prevention of Vortex Breakdown in the Simplified Discharge Cone of a Francis Turbine. ASME J. Fluids Eng. 2010, 132, 051102. [Google Scholar] [CrossRef]
  40. Sarpkaya, T. On stationary and travelling Vortex Breakdowns. J. Fluid Mech. 1971, 45, 545–559. [Google Scholar] [CrossRef]
  41. Hall, M. Vortex breakdown. Ann. Rev. Fluid Mech. 1972, 4, 195–218. [Google Scholar] [CrossRef]
  42. Leibovich, S. The Structure of Vortex Breakdown. Ann. Rev. Fluid Mech. 1978, 10, 221–246. [Google Scholar] [CrossRef]
  43. Leibovich, S. Vortex Stability and Breakdown: Survey and Extension. AIAA J. 1984, 22, 1192–1206. [Google Scholar] [CrossRef]
  44. Novak, F.; Sarpkaya, T. Turbulent Vortex Breakdown at High Reynolds Numbers. AIAA J. 2000, 38, 825–834. [Google Scholar] [CrossRef]
  45. Tănasă, C.; Bosioc, A.; Muntean, S.; Susan-Resiga, R.F. Experimental and Numerical Assessment of the Velocity Profiles Using a Passive Method for Swirling Flow Control. In Proceedings of the 6th IAHR International Meeting of the Workgroup on Cavitation and Dynamic Problems in Hydraulic Machinery and Systems (IAHRWG2015), Ljubljana, Slovenia, 9–11 September 2015. [Google Scholar]
  46. Wahl, T.L. Draft Tube Surging Hydraulic Model Study. Master’s Thesis, Colorado State University, Fort Collins, CO, USA, 1990. [Google Scholar]
  47. Wu, Y.; Li, S.; Liu, S.; Dou, H.-S.; Qian, Z. Vibration of Hydraulic Machinery; Springer: Dordrecht, The Netherlands, 2013. [Google Scholar]
  48. Favrel, A.; Muller, A.; Landry, C.; Yamamoto, K.; Avellan, F. Study of the vortex-induced pressure excitation source in Francis turbine draft tube by particle image velocimetry. Exp. Fluids 2015. [Google Scholar] [CrossRef]
  49. Pasche, S.; Gallaire, F.; Avellan, F. Origin of the synchronous pressure fluctuations in the draft tube of Francis turbines operating at part load conditions. J. Fluids Struct. 2019. [Google Scholar] [CrossRef]
  50. Jacob, T.; Prenat, J. Francis Turbine Surge: Discussion and Data Base. In Proceedings of the 18th IAHR Symposium on Hydraulic Machinery and Cavitation, Valencia, Spain, 16–19 September 1996; Cabrera, E., Ed.; Kluwer Academic Publishers: Dordrecht, The Netherlands, 1996. [Google Scholar]
  51. Tănasă, C.; Ciocan, T.; Muntean, S. Numerical assessment of pulsating water jet in the conical diffusers. AIP Conf. Proc. 2017, 1906, 050002. [Google Scholar] [CrossRef]
Figure 1. Meridian view of the elbow draft tube (cone, elbow and part of the diffuser) together with the adjustable diaphragm at the cone outlet. Three openings of the adjustable diaphragm associated to different operating points are detailed.
Applsci 09 04910 g001
Figure 2. Sketch of the test rig with the main elements of the hydraulic circuit (a). Detail of the test section and swirl generator (b).
Applsci 09 04910 g002
Figure 3. Detail of test section and swirl generator (a). Pressure coefficient measured on the cone wall for swirling flow with vortex rope (solid line) and the cases with diaphragm method (b).
Applsci 09 04910 g003
Figure 4. Pressure fluctuations on all levels without diaphragm: acquired signals (AS) vs. reconstructed signals (RS) (left) and it Fourier spectra (FT) vs. equivalent amplitudes (EA) (right).
Applsci 09 04910 g004aApplsci 09 04910 g004b
Figure 5. Pressure fluctuations on all levels with shutter area ratio of 50% (d = 0.113 m): acquired signals (AS) vs. reconstructed signals (RS) (left) and its Fourier spectra (FT) vs. equivalent amplitudes (EA) (right).
Applsci 09 04910 g005
Figure 6. Pressure fluctuation on all levels with shutter area ratio of 70% (d = 0.088 m): acquired signal (AS) vs. reconstructed signal (RS) (left) and its Fourier spectrum (FT) vs. equivalent amplitude (EA) (right).
Applsci 09 04910 g006
Figure 7. Global dimensionless equivalent amplitude (a) and Strouhal number (b) versus shutter area from the outlet test section.
Applsci 09 04910 g007
Figure 8. Visualization of the self-induced instabilities in decelerate swirling flows: (a) helical type with no diaphragm; (b) bubble type of diaphragm shutter area ratio of Aa = 70% (d = 0.088 m).
Applsci 09 04910 g008
Figure 9. Comparison of the dimensionless equivalent amplitudes obtained for following cases: swirling flow with vortex rope (long dashed line), axial water jet method with 10% discharge (dashed line) and the diaphragm control method with shutter area of 50% (d = 0.113 m) (solid line).
Applsci 09 04910 g009
Figure 10. Rotating—RC (asynchronous) and plunging—PC (synchronous) components along to the cone wall for the cases without the diaphragm and with diaphragm area ratios of 50% (d = 0.113 m), 60% (d = 0.1 m) and 70% (d = 0.088 m), respectively.
Applsci 09 04910 g010
Table 1. Data for all investigated diaphragm openings.
Diaphragm Inner Diameter
d [m]
Diaphragm Inner Area
Ad = πd2/4 [m2]
Cone Outlet Area
A0 = πD2/4 [m2]
Shutter Area
Ar = AD − Ad [m2]
Shutter Area Ratio
Aa = Ar/AD [-]
0.1340.01400.02010.00610.3
0.1130.01000.01010.5
0.1000.00780.01210.6
0.0880.00600.01410.7

