1. Introduction
Soil conservation is one of the main sustainability goals in ensuring food security and environmental protection [
1]. For this reason, the production of food with the minimum impact on the environment is a major challenge for agricultural production. Nitrogen (N) is a critical input for optimum crop production because it promotes rapid growth of corn plants, increases leaf size and quality, and promotes fruit and seed development [
2]. Many grain legumes require limited doses of N fertilisers, but others, such as maize, are big consumers of N, and consequently of energy [
3]. This is important because maize is the second largest crop worldwide, with a production of 615,533,645 Mton (millions of tons) [
4]. Moreover, in corn production the use of herbicides for the chemical control of weeds is intensive [
5]; its high water requirements and the associated nutrient runoff contribute to several impacts on the environment such as eutrophication, algal growth and hypoxia in downstream water bodies [
6]. Other corn production-associated environmental impacts are the unsustainable use of water for irrigation, the expansion of genetically modified corn, soil erosion and biodiversity loss [
4]. This situation is unsustainable in the long term.
Research on the environmental impacts of corn has been mainly on cultivation techniques [
3,
5,
7,
8] and the production of biofuels [
6,
9,
10], so there is limited information on the impacts produced by the transformation of corn for human consumption using life cycle analysis. The study by Grant and Beer [
11] was conducted using life cycle assessment (LCA) for the determination of greenhouse gas (GHG) emissions from pre-agricultural activities on farms and post-farms in the manufacture of corn chips, taking as an indicator the CO
2 equivalent (CO
2 eq) and as a functional unit a box of ten 400 g packages of corn chips. They found that GHG emissions from obtaining raw materials comprises approximately 5% of the total throughout their life cycle; corn cultivation produces around 27%, and the manufacturing stage of corn fritters around 68%. The study showed that the most important source of GHG emission is the emission of nitrous oxide on the farm as a result of the application of fertilisers (0.12 kg of CO
2 eq per box). Sánchez Femat [
12] took as a basis the ISO 14067:2013 standard to perform an analysis of the carbon footprint produced by ten nixtamal mills distributed in the Metropolitan Zone of the Valley of Mexico. His door-to-door study produced a result of 43.38 kg CO
2 eq t
−1 of processed nixtamal mass.
Corn has many food uses, among which is its use for making tortillas. This is a millennial product which is part of the culinary tradition that continues to lift generations and cultures. Historically it was considered as the “bread of life” and there is a connection between Mesoamericans of around 2500 years ago and today’s international tortilla marketplace [
13]. Nowadays there is a great demand in North America and some countries in Central America; in the United States, the tortilla market is projected to reach USD 29.39 billion at a Compound Annual Growth Rate (CAGR) of 5.50% over the forecast period. North America alone captures 59.06% of the global market share in the year 2017 [
14]. The tortilla is a food in circular and flattened form, with diameters ranging from 160 to 300 mm and is 2 to 6 mm thick. It is made with the mass of cooked corn that is obtained through the process of nixtamalisation [
15]. In Mexico, half of the corn produced goes to the production of nixtamalised corn tortillas, while 11.3% of corn production is used to make flour for tortillas [
16,
17]. The National Council for the Evaluation of Social Development Policy (CONEVAL) estimates that in the urban environment the annual per capita consumption of tortillas is 56.7 kg, and in rural areas, 79.5 kg [
18].
Despite the economic and cultural importance of the tortilla, a study describing the environmental impact derived from the production of nixtamalised corn tortillas using an LCA approach has not been carried out. For this reason, the environmental impacts associated with each of the stages of its production are unknown. The LCA is a useful method that has been used in numerous agri-food studies in order to identify environmental hotspots and pinpoint solutions to mitigate environmental burdens [
19]. The aim of this study is to identify the environmental hotspots of the tortilla as a support tool for food sovereignty, the generation of GHG emission reduction strategies, and the identification of opportunities for the technological improvement of the process.
Tortilla Description
There are two ways to produce the dough for making tortillas: the traditional method (corn–nixtamal–dough–tortilla) and that based on nixtamalised corn flour (corn flour–dough–tortilla) [
20]. Tortillas in Mexico are created mainly with nixtamalised corn dough, which represents 65% of the national production, compared to 35% produced with the nixtamalised corn flour [
21]. In Mexico, white corn is traditionally used to make tortillas and oils, while yellow corn is mostly used for livestock pigments and starches.
The process of cooking the tortilla is very varied, from the use of “comales” (a flat iron griddle) to automatic machines known as “tortilladoras” (see
Figure 1). Currently, the most used manufacturing process in the United States and Mexico is the semi-industrial automatic tortilla machine, which, in addition to the moulding, bakes the dough in a continuous process [
20].
2. Materials and Methods
Life cycle assessment (LCA) is one of the most established environmental assessment methods for modelling the environmental effects of goods and services throughout their life cycle [
23]. An LCA identifies the environmental impacts of all stages in the production cycle and enables the evaluation of environmental impacts for comparative and improvement purposes [
24]. To achieve this, the LCA requires that the process be checked in order to identify all resources used (materials, energy) and all emissions of environmental pollutants (wastes, effluents, and emissions) [
25].
2.1. LCA Approach and Assumptions
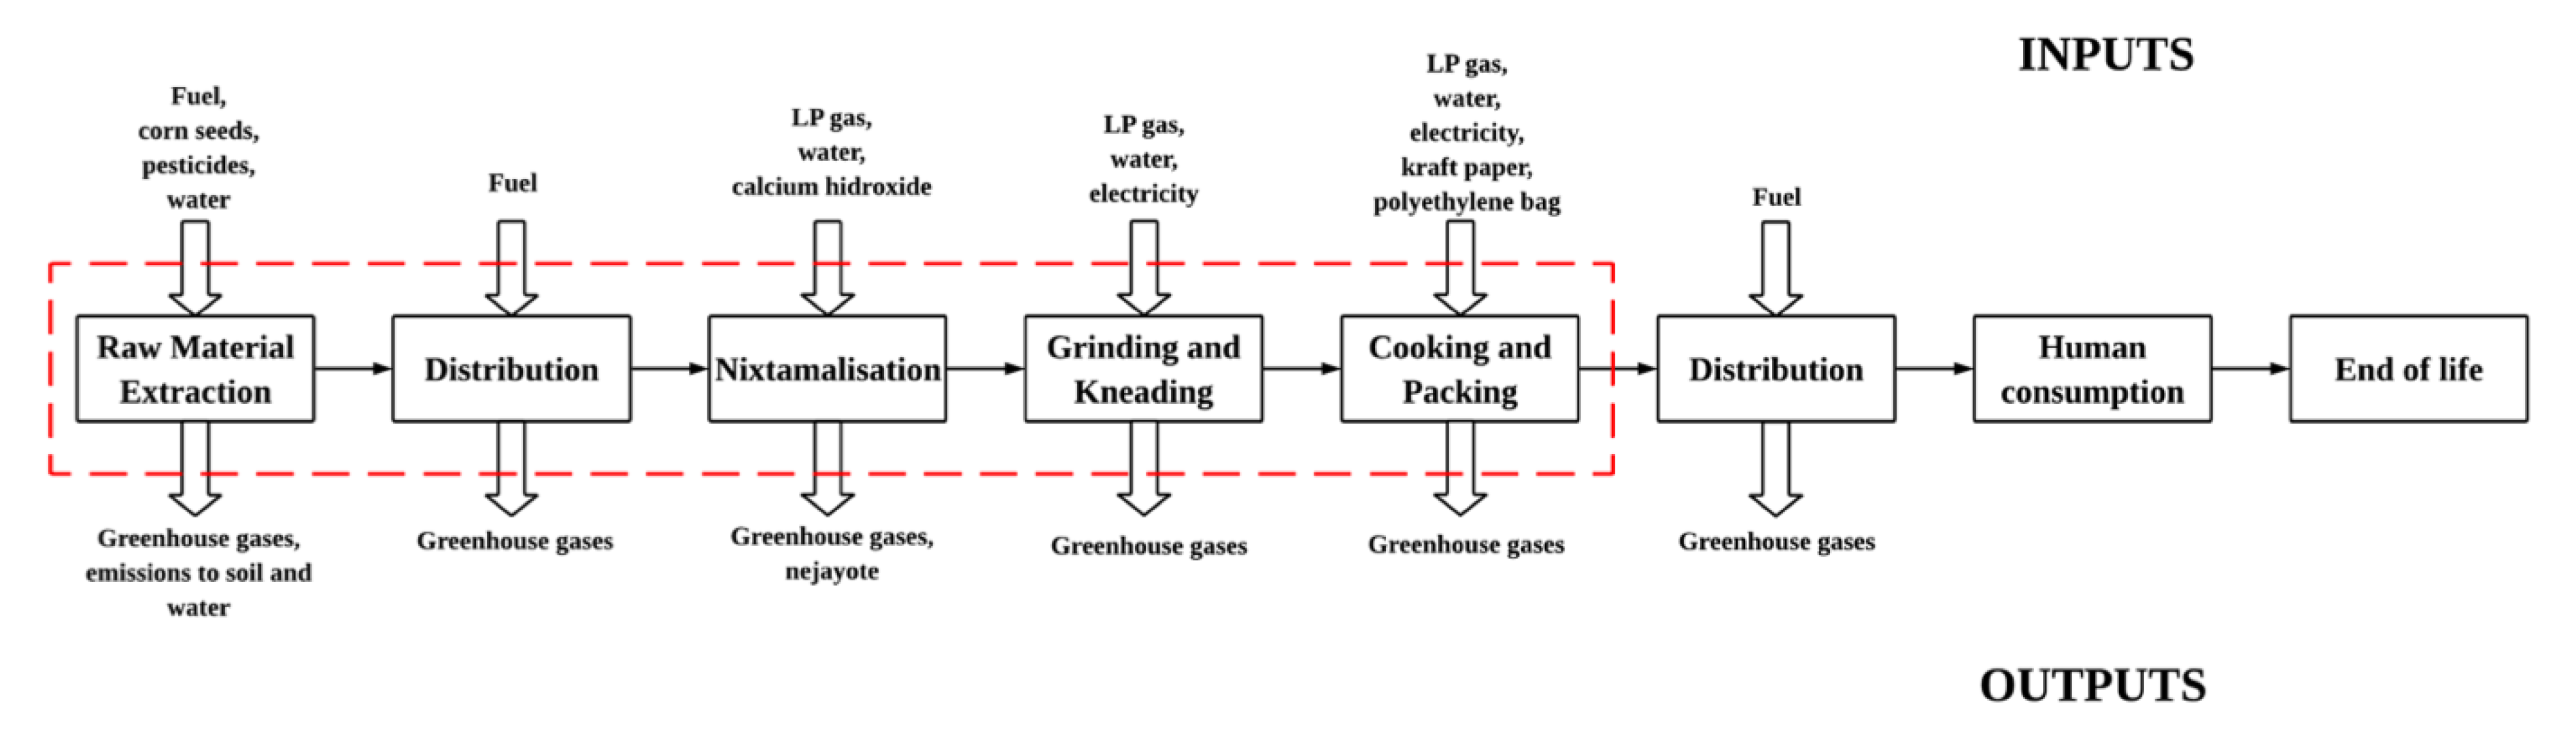
The process studied included only the corn–nixtamalisation–dough–tortillas production. The functional unit is one kilogram of tortillas packed in kraft paper. In the limits of the system (
Figure 2), it was considered from the obtaining of raw materials for the production of corn, to the elaboration of the already packaged product, with a focus on the cradle to the door, i.e., “cradle to gate”. The stages of obtaining the rest of the raw materials, the use of the product, and the disposition of the residues at the end of life were excluded. In this study no comparisons were made between systems. A producer in Quiroga, Michoacán was surveyed in the year of 2017 to understand the process of corn production. A tortilla shop, equipped with a nixtamal mill and an automatic tortilla maker was studied, which is representative of the business class in Mexico that complies with the official standard for dough, tortillas and prepared flours [
26].
The stages considered in the LCA are:
Production of raw material. The production of white corn is considered because it is the raw material for the production of tortillas. It includes the preparation of the earth up to the drying of the seed. The preparation of the land uses the conservation tillage technique with the use of an agricultural tractor, which includes a ploughing phase, two harrowing phases and sowing. Mechanised planters are used to plant the seed and the first fertilisation of the soil is carried out, adding the total amount of the required phosphorus and 40% of the total nitrogen. The second fertilisation consists of adding the remaining nitrogen to the corn. Pest control is carried out by sprinklers coupled to the tractor. Harvesting is done with agricultural harvesters to later go through a grain drying process. Once dry, the grain is packed in sacks and distributed to the tortilla shops.
Transport of raw material. This includes the distribution of the pesticides, fertilisers and supplies necessary to produce corn, as well as those needed for the production of tortillas, such as corn and calcium hydroxide in the nixtamalisation stage.
Nixtamalisation. The technique is based on the cooking of the corn grains in a calcium hydroxide solution (Ca(OH)
2) or lime. For each kg of corn, 15 g of lime are used in 3 L of boiling water (85–100 °C) for at least 45 min, depending on the hardness of the grain [
27]. The mixture is left to rest for 8–24 h in the cooking solution (knowing as nejayote), then washed two or three times with clean water to remove the nejayote, the pericarp of the grain and any impurities. The result of alkaline cooking is the nixtamalised or nixtamal corn. Subsequently, it is passed to a wet milling process to obtain the dough (with 48–55% humidity).
The cooking of the dough. The dough is baked in an automatic tortilla machine which moulds, cuts and bakes. The machines are fuelled by natural gas or propane as a fuel source and the mechanical system is powered by electricity. The dough is fed through a hopper where there are two rollers (kneading) that rotate in opposite directions, directing the dough to the extruders which, in turn, feed the moulders, where it is shaped flat and then cut out by some blades. The discs of dough move along a hot iron caterpillar to be cooked at temperatures of 280–300 °C with a residence time of 20 to 40 s. Each side is cooked twice, at the end the tortilla is obtained [
28]. Approximately 30 g of dough is needed for each tortilla. The complete process of the production system is shown in
Figure 3.
2.2. Life Cycle Inventory of Corn Tortilla
The data and sources to execute the life cycle inventory (LCI) of tortilla production are described in
Table 1. These data are referenced to the functional unit according to the ISO methodology [
29]. The data were validated according to the quality criteria referred to by the ISO international standard [
30].
The life cycle analysis was performed using SimaPro software version 8.5.0. The environmental impact assessment of tortilla production considered the 18 midpoint impact categories of the ReCiPe method (2008): climate change (CC), ozone depletion (OD), terrestrial acidification (TA), freshwater eutrophication (FE), marine eutrophication (ME), human toxicity (HT), photochemical oxidant formation (POF), particulate matter formation (PMF), terrestrial ecotoxicity (TET), freshwater ecotoxicity (FET), marine ecotoxicity (MET), ionising radiation (IR), agricultural land occupation (ALO), urban land occupation (ULO), natural land transformation (NLT), water depletion (WD), mineral resource depletion (MRD) and fossil fuel depletion (FD).
2.3. Transport of Materials
The materials needed for the production of tortillas are purchased from various suppliers. Through an interview, the location of each one of them was identified and then the distance travelled in the transport of the inputs was calculated using the web application “Google-Maps” (
Table 2).
2.4. Corn Production
In order to carry out the LCI of corn production, a producer from the city of Quiroga, Michoacán, Mexico, was interviewed. The resulting information is detailed below.
2.5. Nixtamalisation
For this process, the materials and supplies necessary for the production of 1 kg of nixtamalised corn were considered. The materials required are corn grains, calcium hydroxide Ca(OH)
2 and water. The water consumption was calculated considering the 2:1 formulation of water and corn, in addition to the water used for washing the nixtamal. The energy and/or heat inputs for this process are propane and electricity. The consumption of electrical energy was determined according to the technical specifications of the equipment available in the tortilla shop. The losses of corn dough after washing were assigned according to the Mexican norm [
27]. The results of this analysis are shown in
Table 5.
2.6. Grinding
The materials and supplies necessary to produce 1 kg of dough were considered. The required material is nixtamalised corn from the nixtamalisation process. The consumption of electrical energy in this process was determined according to the technical specifications of the equipment used. A nixtamal mill of the brand Arisa ML100, 1/3 HP at 110 V, with a capacity of 80 kg h
−1 and a mixer of the brand Tortimex Inox-430, 1 HP at 110 V with a capacity of 50 kg of dough per load were used. The water consumption of this process was estimated by a material balance in which nixtamalised corn enters with 42% humidity and leaves as a dough product with a humidity of 55%. The results of this process are shown in
Table 6.
2.7. Baking the Dough and Packing
The inputs for the production of 1 kg of tortilla from nixtamal were identified. The consumption of electrical energy for this process was determined according to the nameplate data of the Verduzco brand tortilla machine model TV-40. Its production capacity is 70 kg h
−1, with electricity consumption of 1.32 kWh and 3.8 L h
−1 of propane. The tortillas are delivered to the consumer wrapped in food-grade paper, with a grammage of 17 g m
2. The LCI analysis for this stage is shown in
Table 7.
2.8. Energy Flows and Greenhouse Gases for Tortilla Production
The total cumulative energy demand (
CED) of a product is a parameter that represents the total of all energy inputs, concerning the consumption of primary energy. With respect to LCA phases [
36] the
tortilla CED can be expressed as Equation (2):
Global warming potential indicators, derived respectively from the calculation of the energy flows and the calculation of the GHG emissions, were also taken into account. These results were calculated for a mass based on functional unit (FU), for a nutritional energy value FU (100 kcal) and for a price-based FU. The FU is a reference unit, to which the inputs and outputs must be connected [
37].
Mexico is divided into eight economic regions (
Table 8), which each represent separate activities and economical characteristics,
Figure 4 is a schematic representation of the various purchasing powers of the Mexican regions.
The obtained results showed that to process the FU of tortilla (1 kg of packed tortilla), the
CEDtortilla = 1.03 MJ of primary energy is required; this represents 0.419 kg CO
2 eq/FU. The Mexican government uses the “basic basket” as the set of essential goods and services so that a family can satisfy their basic consumption needs from their income. The tortilla is a staple food for Mexicans, nutritionally and for cultural identity, and as such, it is one of the 83 items that comprises the basket. In fact, according to the National Consumer Price Index [
41], the tortilla represents 6.78% of food expenses. Regardless of this importance, prices vary nationwide, as shown in
Figure 5a. Prices do not match geographic purchasing powers, as the Pacific area—which has the highest purchasing power—has the lowest national price for tortillas. The explanation for this might be associated to the higher degree of mechanisation and availability of newer tortilla equipment. Northern zones are known for their higher industrialisation levels in Mexico, with probably more energy-efficient processes for tortilla production. This represents an opportunity for further study.
The Mexican electric power generation mix, or electricity mix, in the distinct economic zones is described in
Table 9.
Figure 5b represents the cost per energy unit, calculated from the tortilla price. These prices were calculated from the average price for tortilla in year 2017 in each zone. However, the electricity mix varies in each zone. The northern part relies heavily in fossil fuels, whereas the southern part generates electricity mainly by hydroelectric technology.
Figure 5c shows the kg CO
2 eq as related to the tortilla price. As a result, zones with the highest prices have the lowest global warming indicators, such as the Northeast and the Southeast zones.
Finally,
Table 10 shows a comparison of environmental impacts for selected food products, particularly bread. Despite the difference in grain (wheat versus corn), the global warming indicator is comparable among bread types and tortillas, with the main hotspot being identified as the corn production phase.
4. Conclusions
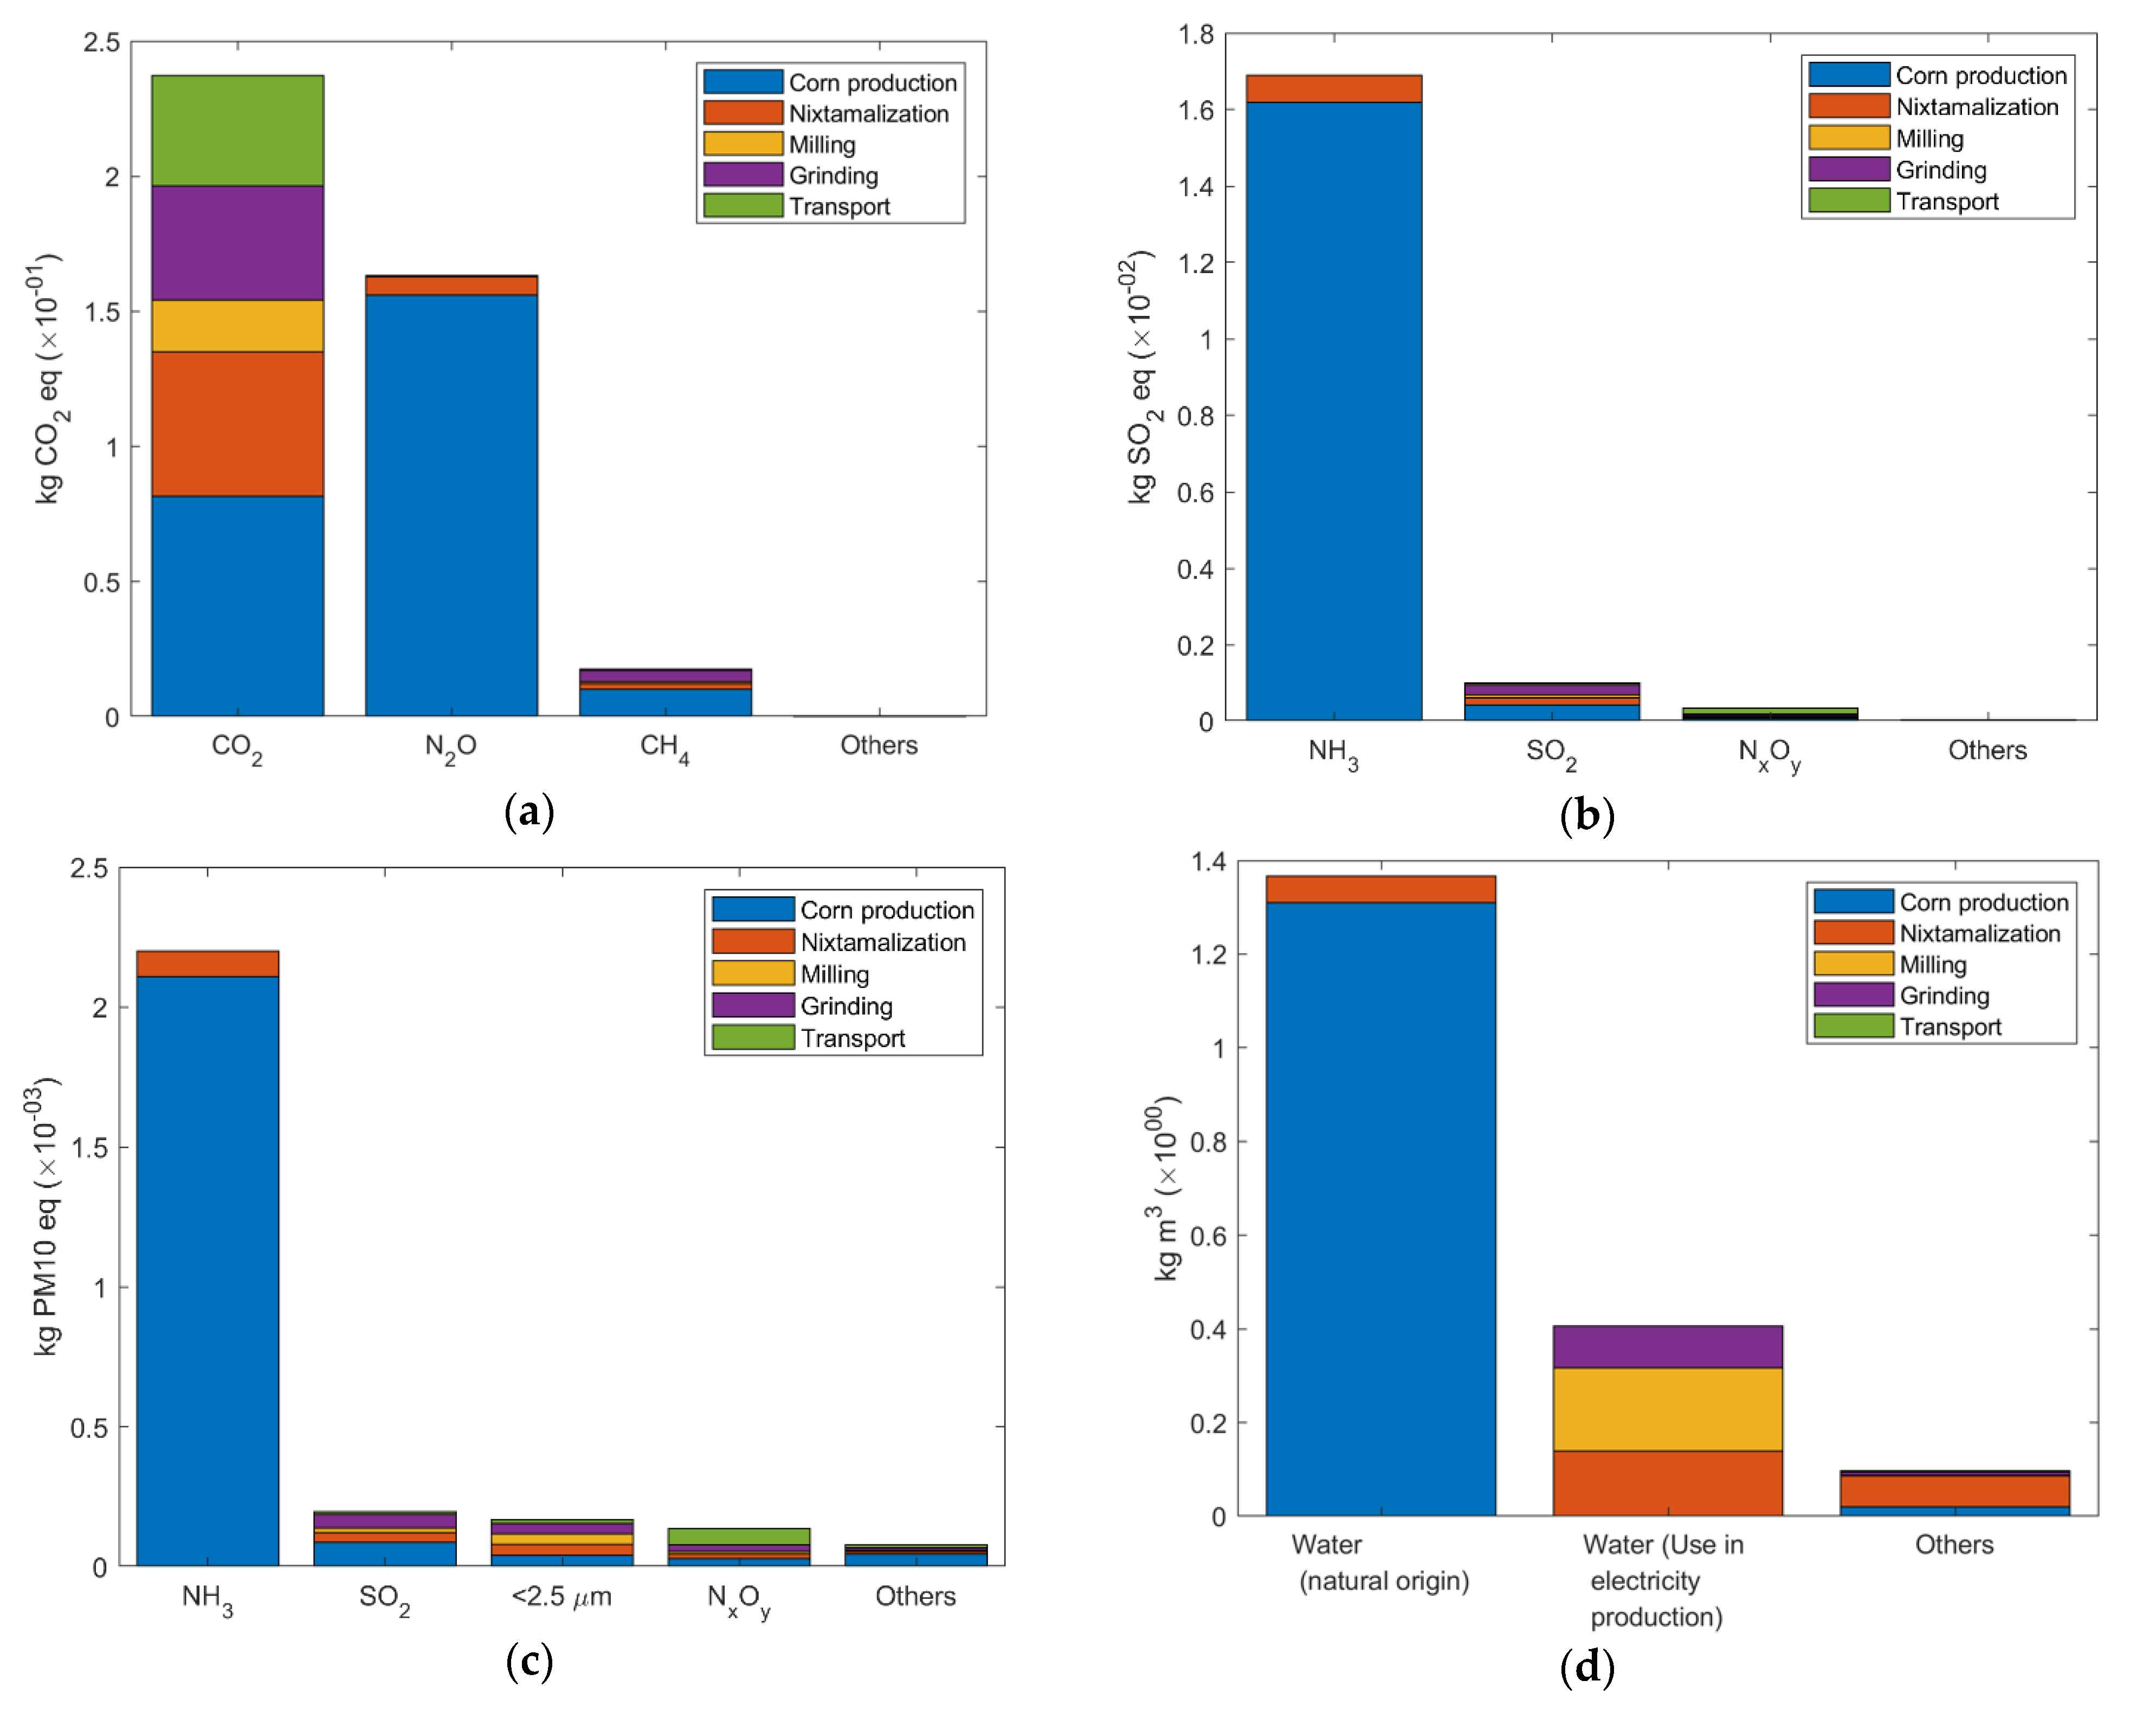
This investigation allowed estimating the potential environmental impacts of the production of tortillas by the life cycle analysis method included in ISO 14040 and ISO 14044. The corn production stage was the unitary process with the most significant impact on 15 of the 18 categories evaluated; this was due to the use of fertilisers and pesticides during the development of the crop.
Due to the lack of specific literature on the environmental impacts of tortilla production, the comparisons with other studies were limited to general considerations about the life cycle of cereal products. Based on the results obtained, improvements could be made in the production processes to reduce their environmental impacts, especially the cultivation phase. Possibilities include the search for environmentally friendly fertilisers that do not affect the yield of crops, or changing to organic soil fertilisation. Although this project was only evaluated for a tortilla shop, the analysis is scalable at each production level.
For future research, the following recommendations are made: (a) compare the environmental impacts of tortilla production of nixtamalised corn flour with dough; (b) compare the environmental impacts of tortilla production in various geographical conditions; (c) evaluate the water footprint of corn production by irrigation and by storm; and d) carry out an LCA that covers the final disposal of the waste generated in the process.

 ,
, 


