1. Introduction
Heating, ventilation, and air conditioning (HVAC) systems usually are the largest energy use systems in commercial buildings. For a generic office building, more than 60% of total energy use can be generated by HVAC system [
1]. Within the HVAC system itself, the most energy-consuming part is the chiller plant system, which consists of chillers, pumps, cooling towers and some other electromechanical equipment. In most practical applications, considering standby capacity, operational flexibility and, most importantly, high energy efficiency under partial load, multiple devices of the same type are usually connected in parallel to a group or station. Therefore, the group operation of the pump, chiller and cooling tower systems come to be a significant topic in the optimal control of a chiller plant system, where the key points and difficulties are how to determine loading/unloading and matching speed or part load ratio (PLR) of all running equipment.
Considerable studies have been undertaken to regulate the optimal group operation of the pump, cooling tower and chiller systems, to mainly realize the energy conservation [
2] and thermal comfort goal [
3]. Most researchers have focused on employing various numerical algorithms to resolve such an optimization problem. Some researchers have adopted genetic algorithm [
4], dynamic programming algorithm [
5], evolutionary algorithm [
6], extreme value analysis algorithm [
7], and mixer integer nonlinear programming (MINLP) algorithm [
8] to optimize the group operation of variable speed pumps (VSPs). For the chillers’ optimal group operation, evolutionary algorithm [
9], generalized reduced gradient algorithm [
10], branch and bound algorithm [
11], particle swarm algorithm [
12], and simulated annealing algorithm [
13] has been adopted for the optimal chiller load (OCL). The optimization algorithms for the group operation of cooling tower include constrained inverse optimization [
14], mixed-integer nonlinear programming (MINLP) algorithm [
15], artificial bee colony algorithm [
16], particle swarm algorithm [
17].
However, these algorithms are not straightforward and usually need either the input of abundant data for the algorithm training or case-by-case development for unequal systems. Unfortunately, high computation and implementation cost make it difficult for these algorithms to be widely adopted in real applications [
18].
Some researchers have tried to find analytical solutions to solve this optimization problem for assisting with the straightforward control algorithm design. An analytical solution for speed optimization has been derived [
18,
19,
20]. One basic rule is to maintain the same speed ratio for identical parallel connected pumps, which has been verified by experimental studies [
21,
22]. Typical principles of chiller sequencing control, commonly used in practical applications, include direct power-based control, bypass flow-based control, return chilled-water temperature-based control, and total cooling load-based control [
23].
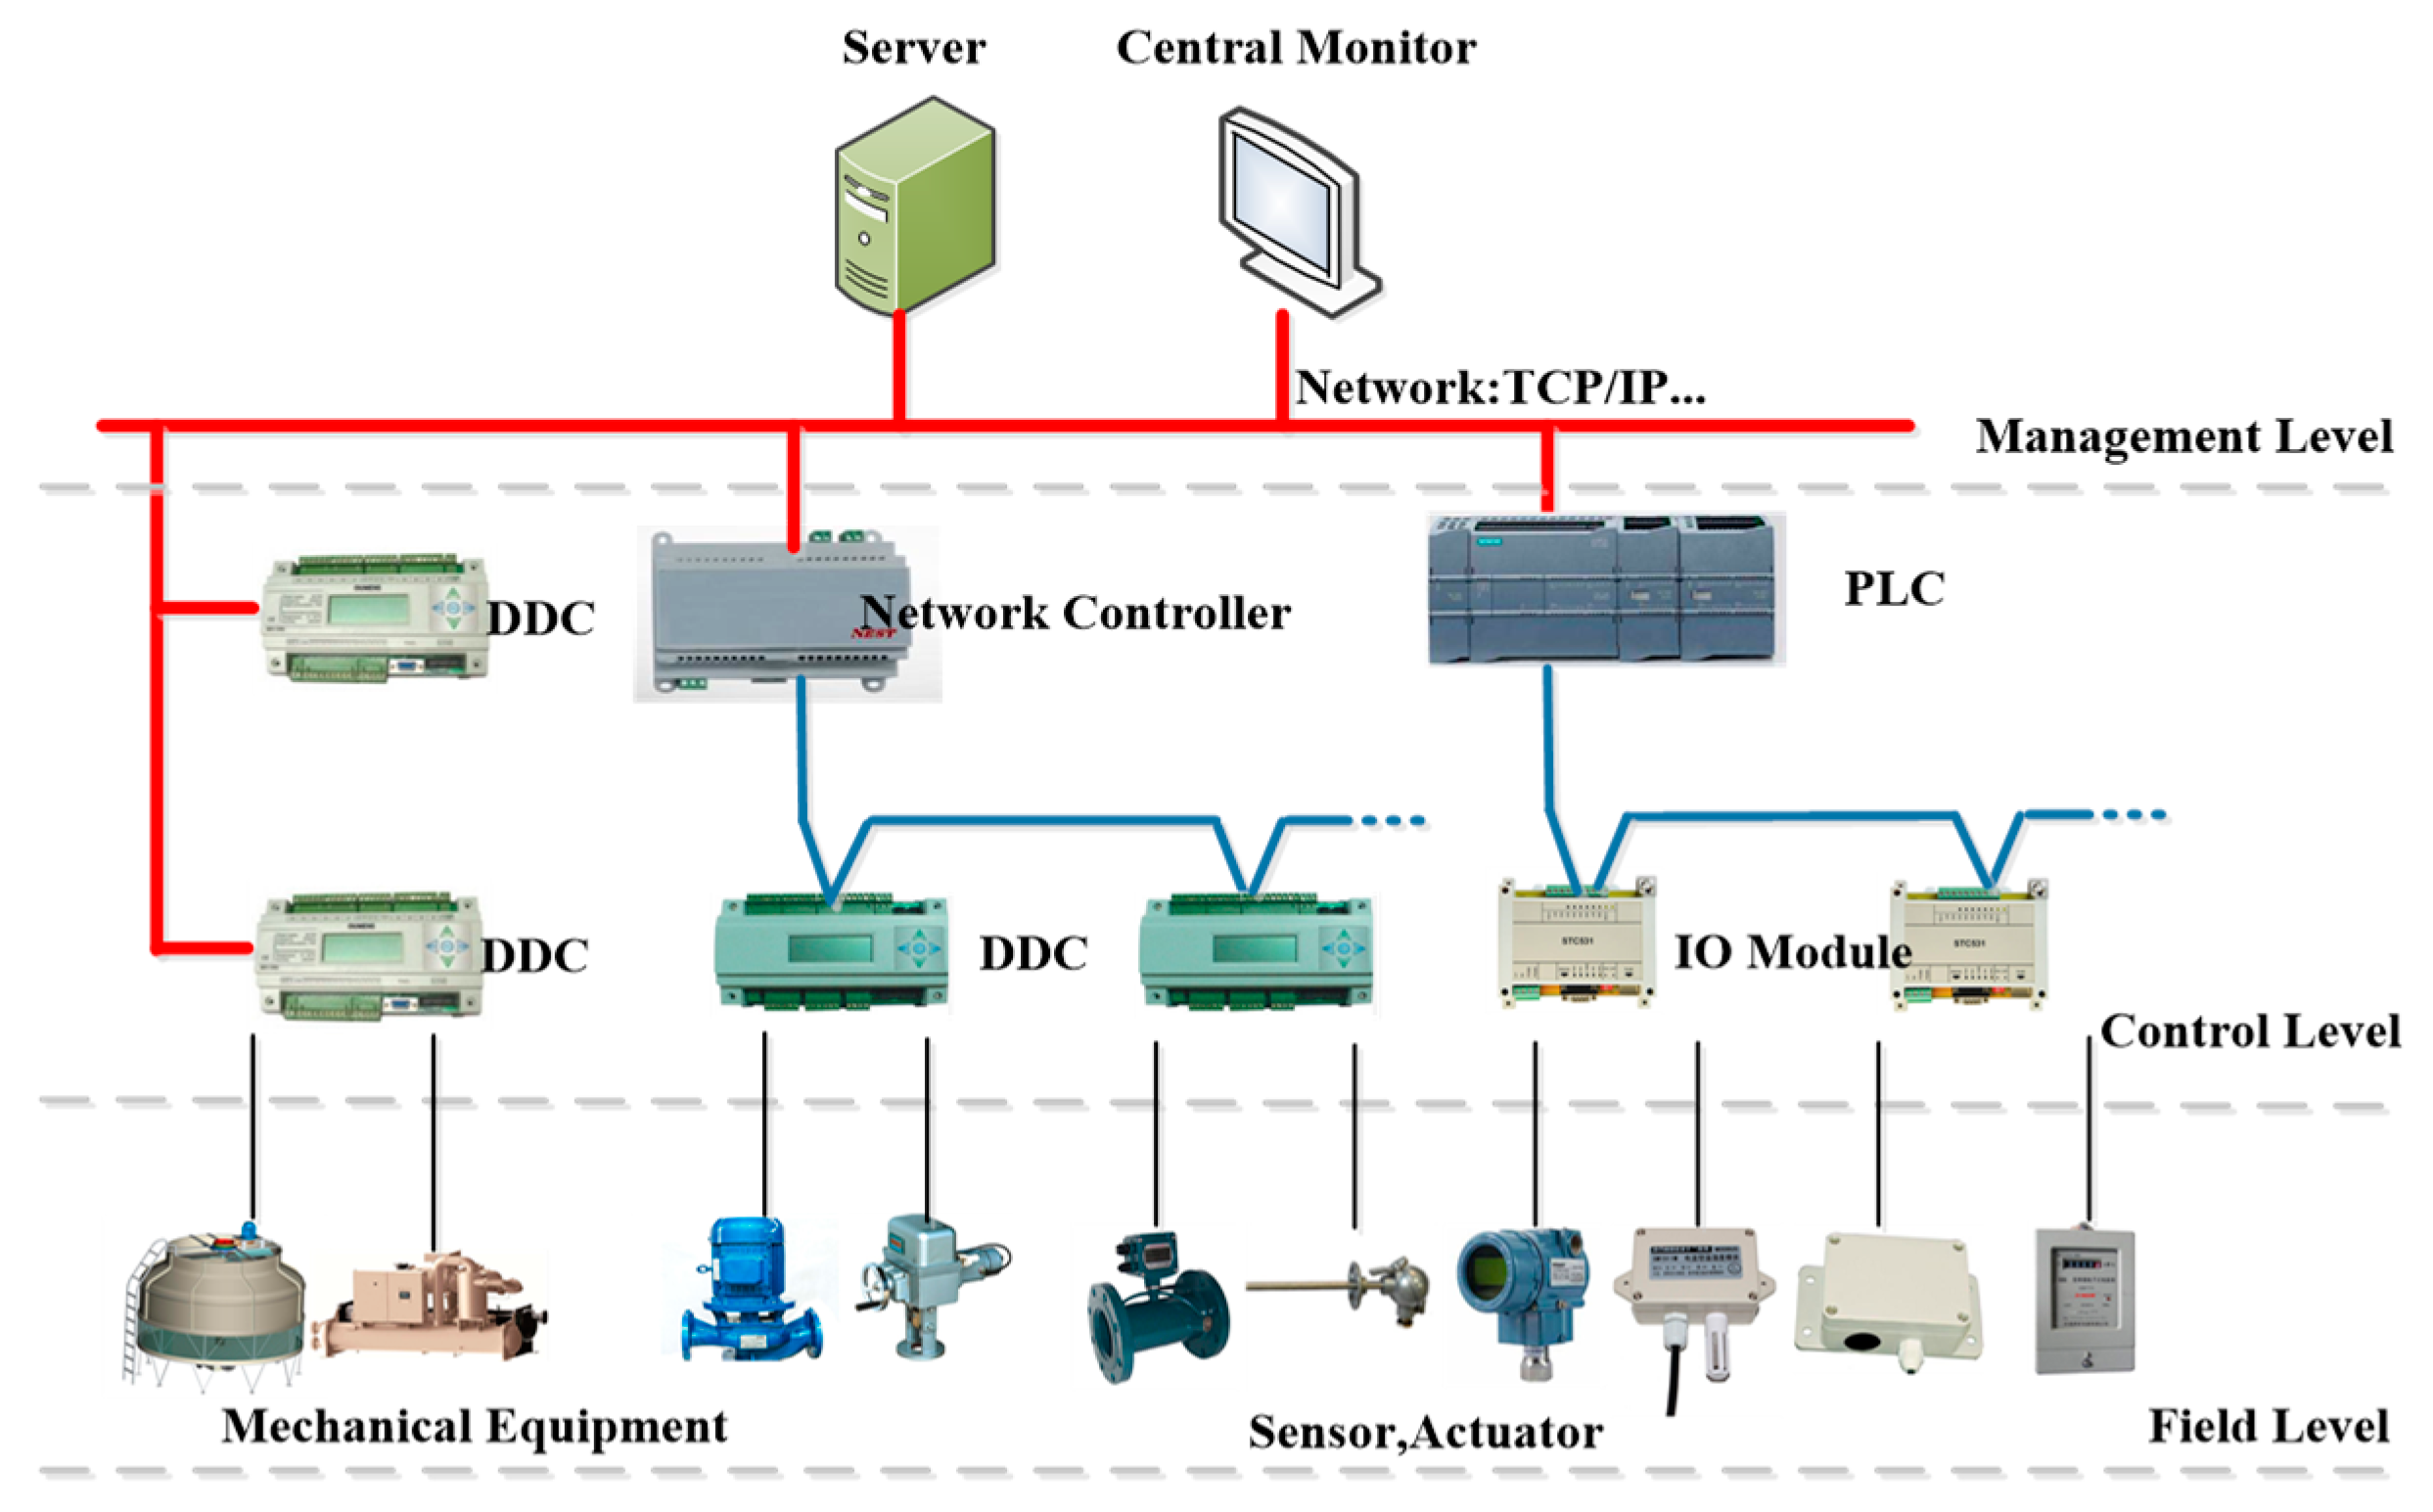
In the current practical applications, whatever optimal group operation is used, the system structure has remained unchanged for almost 30 years [
24]. It uses a hierarchical tree topology, as shown in
Figure 1, with a centralized controller (PLC or DDC) to complete control tasks. The centralized controller firstly collect data from each unit of equipment and then perform calculations. After that, it make decisions based on a centralized control algorithm and send out control instructions to each unit of equipment. With this centralized control structure, when the system configuration changes, the control algorithm or strategy needs to be adjusted or reprogrammed accordingly. These works which include onsite measuring, wiring, configuring, commissioning, and secondary development mean that each control system is unique and case-by-case developing. Therefore, the development of a centralized chiller plant control system leads to a high labor cost.
To address the actual application problems described in above, this paper proposes a decentralized control method for the group control of parallel-connected device in chiller plant system. Thus, it presents a new chiller plant control system from a different point of view.
Table 1 summarizes frequently used notations in this paper. The rest of this paper is organized as follows. Based on new understanding,
Section 2 introduces the structure and basic elements of the decentralized, flat-structured control system.
Section 3 gives a brief introduction to the decentralized optimal control algorithm for the main equipment in chiller plant system.
Section 4 presents a use case to demonstrate the practicability and energy saving effect of the proposed method. Finally,
Section 5 gives a conclusion, and it also presents further research directions in future.
2. Decentralized, Flat-Structured HVAC Automation System
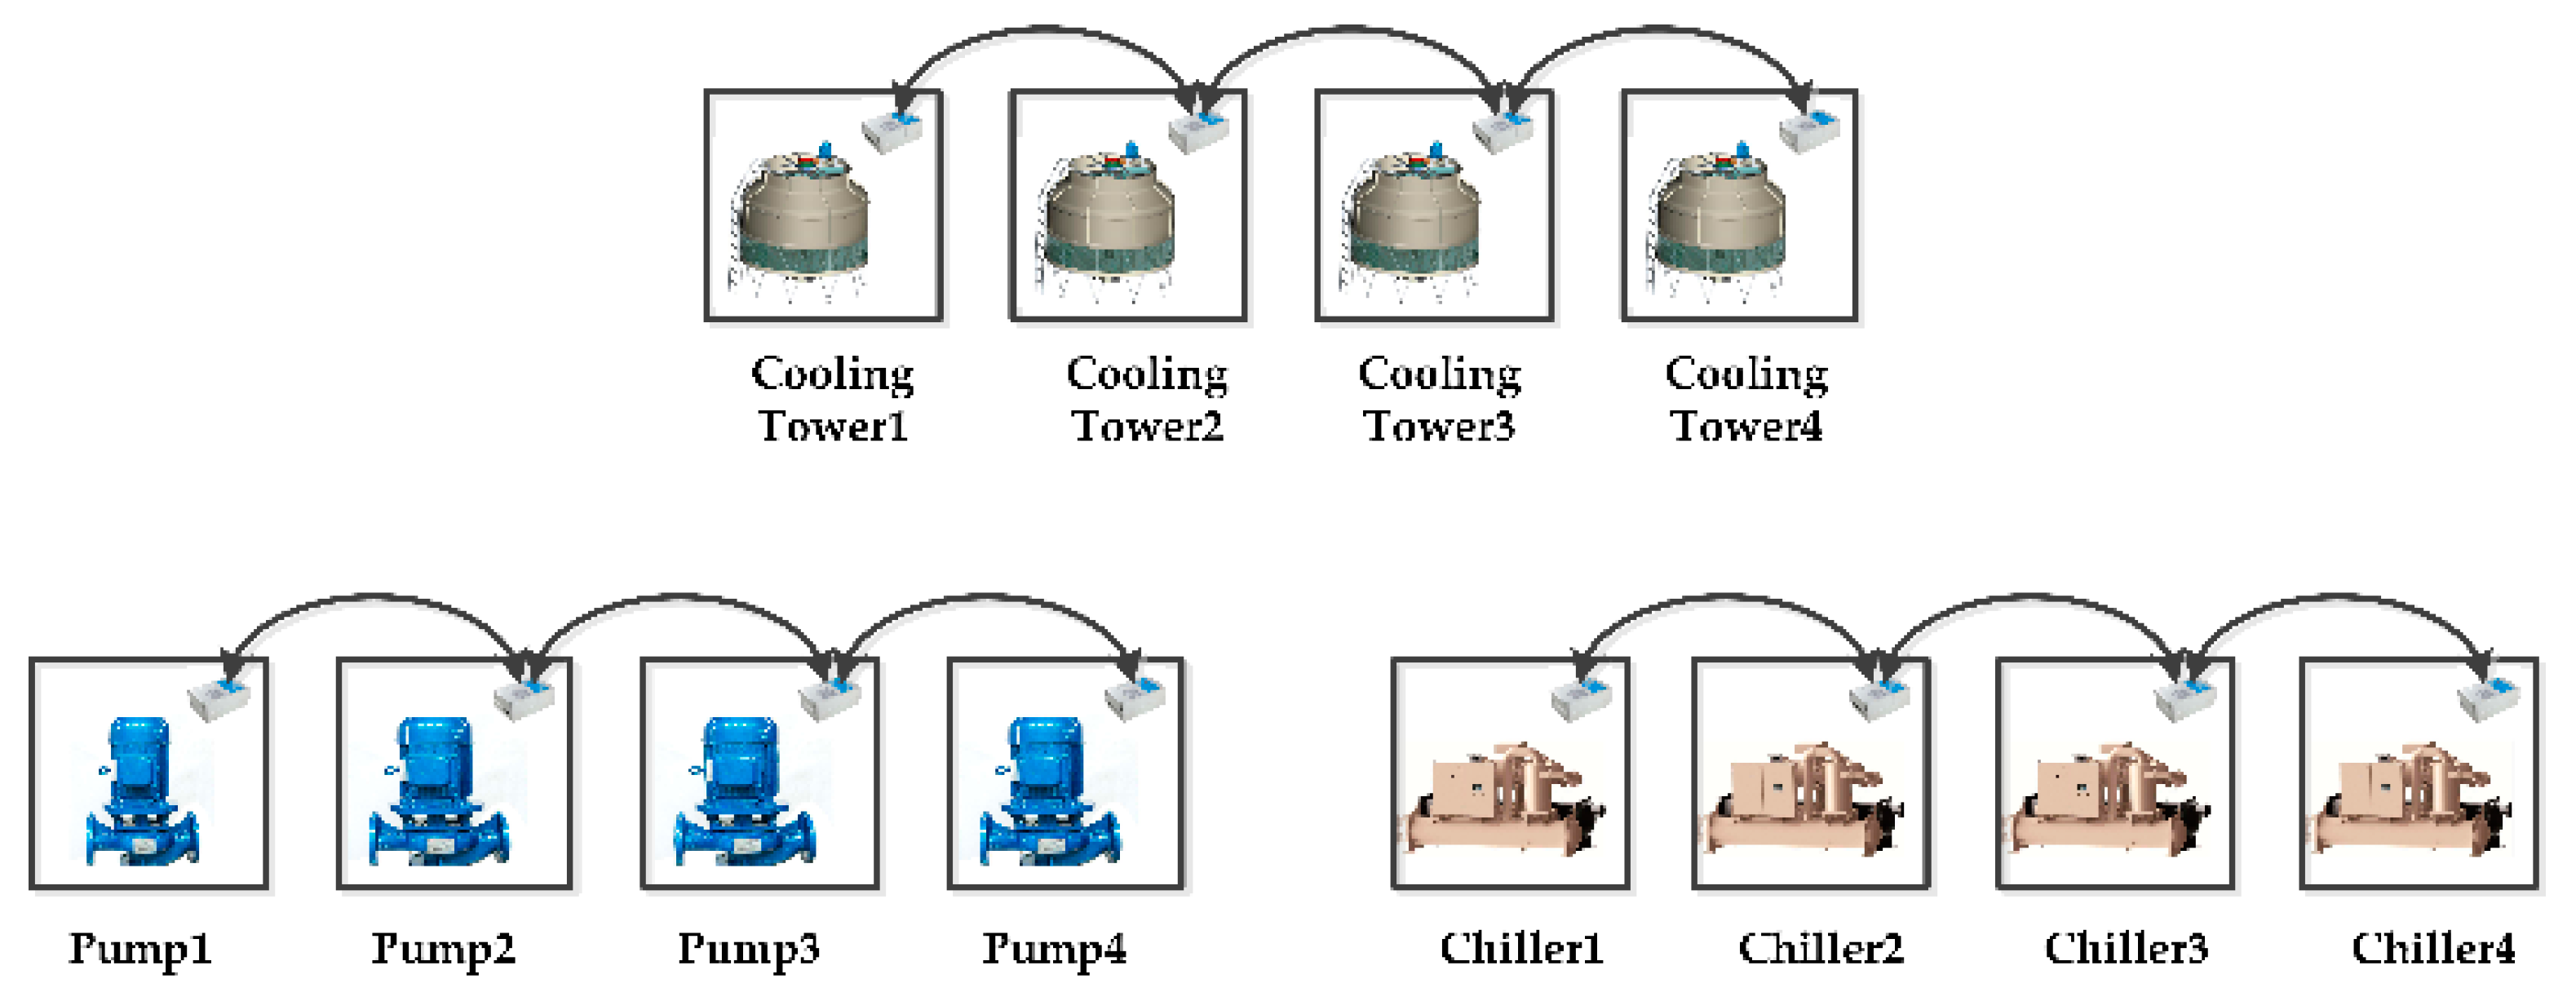
Figure 2 shows that cooling tower group, VSP group, and chiller group are connected in parallel in this decentralized control structure. Each unit has its own decentralized controller, so it turns into a smart unit. These smart units for the same group are communicated by either wire or wireless, in order to meet the control requirement and increase the energy efficiency.
Centralized controllers, such as DDC or PLC, are not used in the decentralized control system. The installation of a decentralized controller which includes the control algorithm and performance specifications can convert a conventional mechanical unit into a smart unit. As a result, this simplifies the onsite modeling, configuration, commissioning, and development, since it brings a good communication capability between different smart unites when building the whole system. These smart units will be converted into mature products integrating large amounts of preceding work by such a decentralized control structure. In addition, no extra controller is needed for the system. The decentralized control system enables units to conduct a “plug-and-play” work, and then it leads to a more flexible and scalable system than the traditional system.
2.1. Basic Unit
Based on the decentralized chiller plant control structure, the devices’ operation mode is changed from manual configuration and centralized monitoring in the central controller to independent collaborative work between intelligent devices. Therefore, it is necessary to unify and standardize the input and output parameters of various intelligent devices. The basic work is to determine the standard information model of the smart devices.
2.1.1. Standardized Information Model
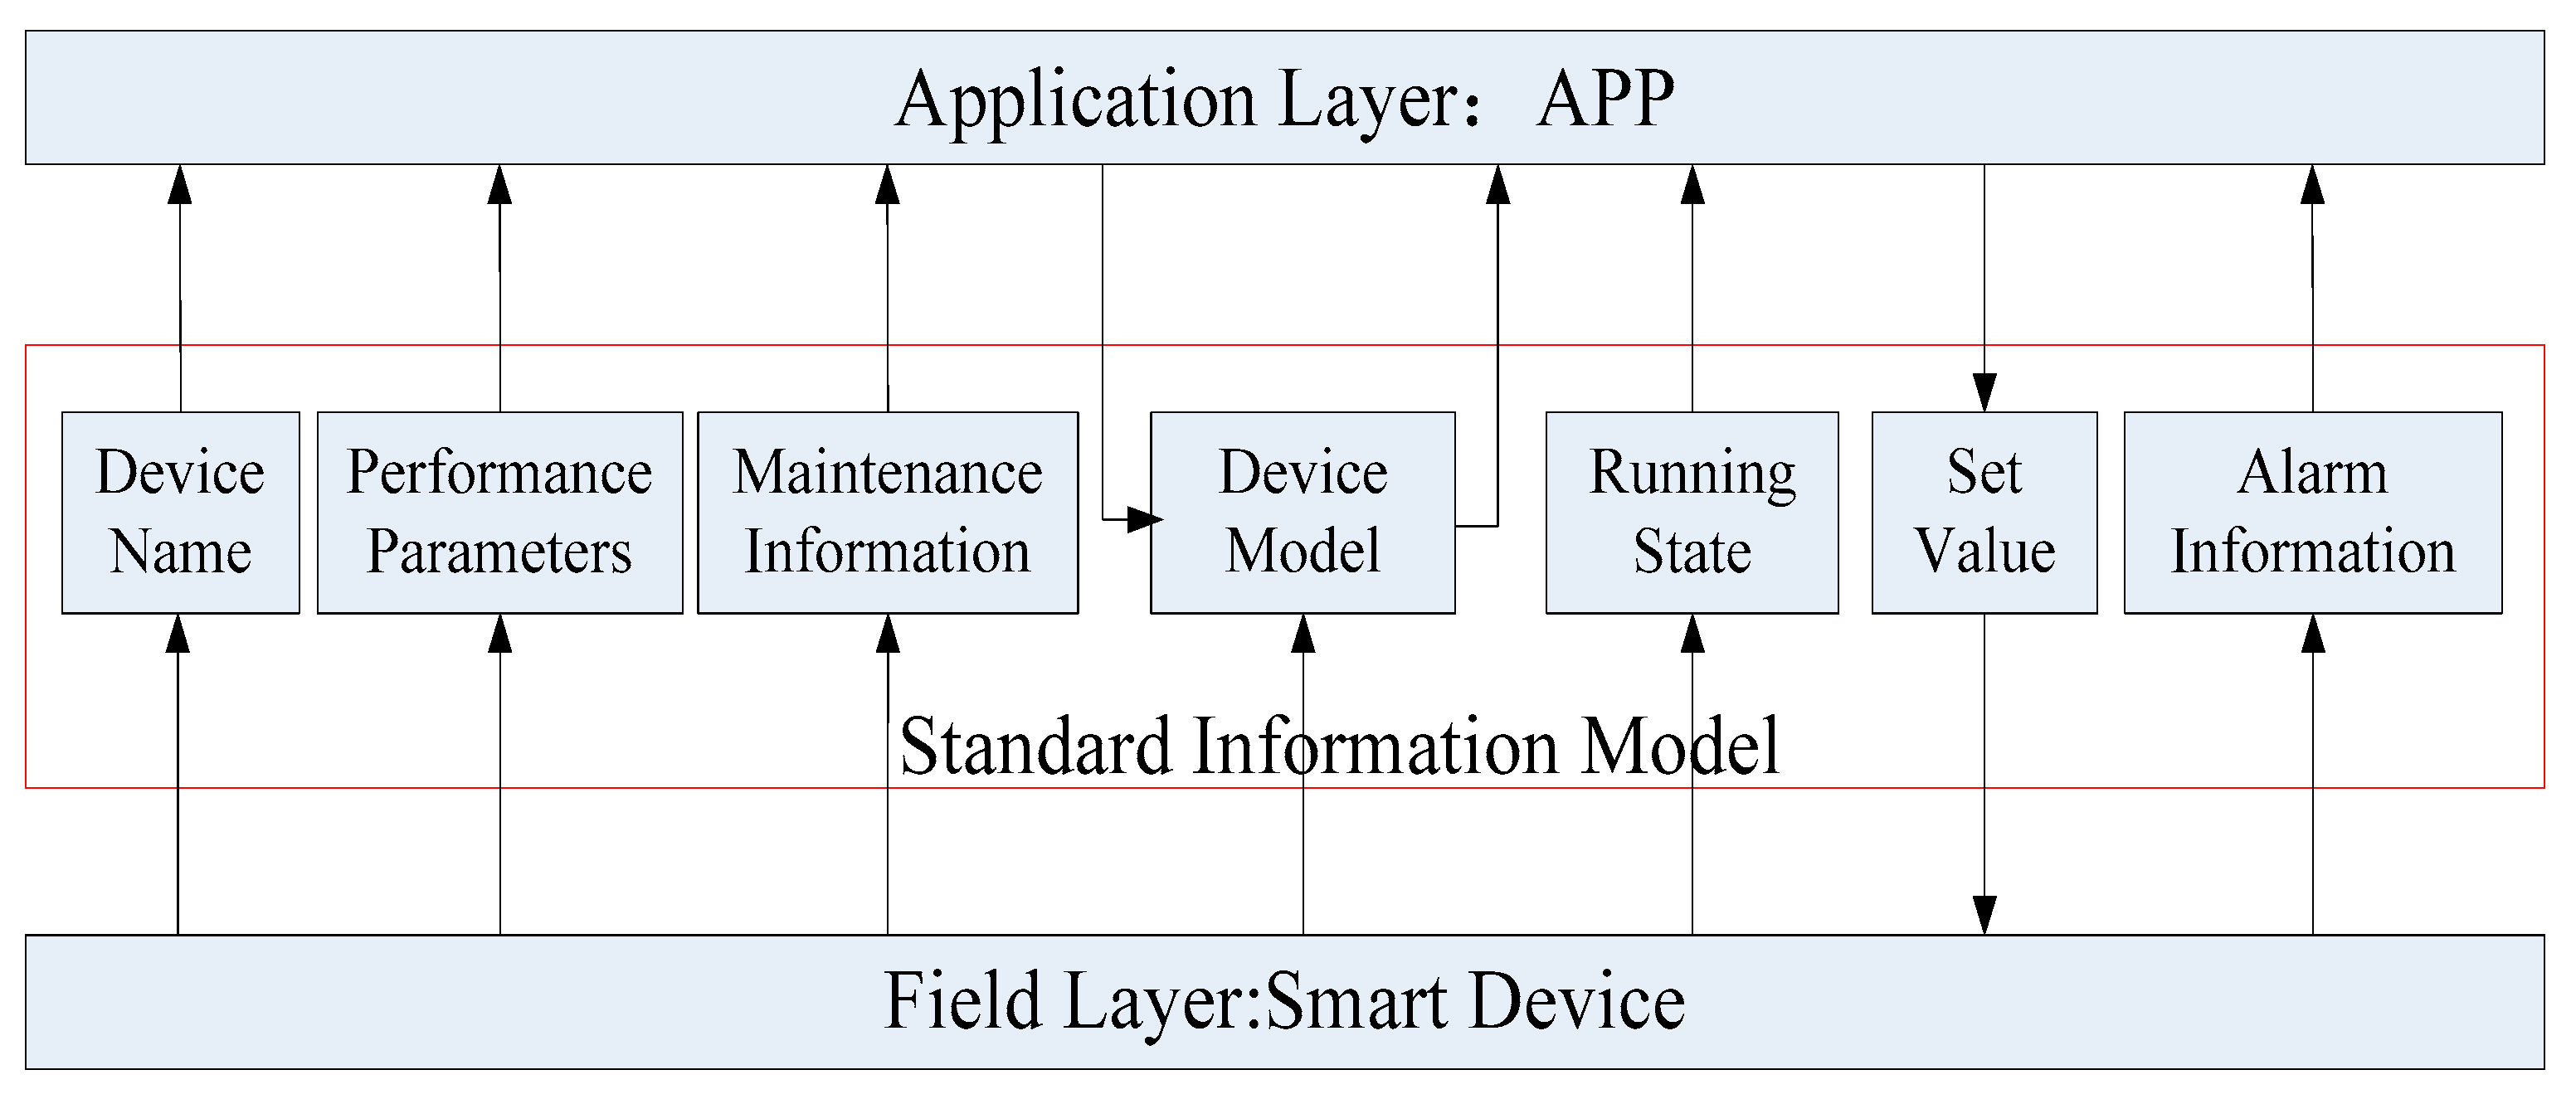
The establishment of the standardized information model of intelligent equipment, facing the field layer at the bottom of the decentralized control system, is the basis for universal replacement and plug-and-play implementation of intelligent devices from different manufacturers and with different types, as shown in
Figure 3. The standardized information model of smart devices is a universal set of information for maximizing operation of similar electromechanical devices. When equipment of different manufacturers and different types changes, or when an accessory sensor or an auxiliary actuator inside the smart device changes, the smart device still follows a standardized information model, independent of the data format and communication protocol within the smart device. Thus, the decentralized control system can be directly compatible with various intelligent devices that follow the standard information model, and avoid a large number of networking configuration work on site.
The establishment of the standardized information model of intelligent devices, facing the application layer at the upper layer of the decentralized control system, provides the basis for the “universal” development and application of various management software and control algorithms, as shown in
Figure 3. Based on the standardized information model of various types of intelligent devices, the data interfaces provided by various standard information models can be called, so that the APPs at the application layer can be directly operated on the decentralized control system of different chiller plant system without secondary development for different systems. It is the basis for the decentralized control algorithm and the versatility and extensibility of other APPs in the application layer.
In summary, the standardized information model of smart devices is the basis for the versatility and extensibility of the decentralized control system. The information of the smart device in its actual operation and the cooperation between the smart devices can be divided into seven categories: device name, maintenance information, performance parameters, device model, running status, set value, and alarm information, as shown in
Figure 3. At the same time, according to the seven information classification methods, taking the chiller, water pump and cooling tower commonly used in the chiller plant system as an example, all the information points of each smart device are classified, and all the information points in each category are listed in
Table 1.
The data sources of these seven types of parameters are different. Some are built into the smart device by the device manufacturer at the factory, such as device model, maintenance information, etc. Some are obtained by the device’s own controller DCU (Drive Control Unit) in the actual operation, and then they are mapped and updated to the standard information model database in decentralized controller, such as various operating status information during the running of the equipment, alarm information, etc. Some are the set value that are obtained through coordinated calculation by the management software or the control algorithms running at the decentralized controller. And some are the device name or the device number derived from the identification rule running at the decentralized controller level.
2.1.2. Device Model
Chiller. COP is usually used to express the operating efficiency of the chiller, i.e., the ratio of cooling capacity to power consumption of the chiller. Generally, it can be fitted as a quadratic polynomial of three variables [
25], i.e., a ten-coefficient formula commonly used by chiller manufacturers. The specific expression is shown in Equation (1),
where
is the partial load ratio,
is the temperature of the water leaving the evaporator, and
is the temperature of the water entering the condenser.
Pump. Firstly, a new variable, pump speed ratio
(
), is defined as
where
is the actual running speed of pump,
is the rated speed of pump.
Then, the pumps operation curve at all rated and non-rated working conditions could be expressed as Equations (3) and (4),
where
,
, and
are the pump head, flow rate and mechanical efficiency at the rated speed, respectively;
b,
c,
d and
,
,
are constants that vary with the characteristics of a specific pump, which can be obtained from the experimental data or manufacturer data under the rated conditions.
Cooling tower. Under normal circumstances, the cooling tower efficiency and the ratio between the condenser water mass flow rate and the air mass flow rate of the cooling tower can be combined into a polynomial curve [
26], as shown in Equation (5),
where
,
,
are the cooling tower efficiency, condenser water mass flow rate and air mass flow rate respectively;
,
,
,
are constants that vary with the characteristics of a specific cooling tower, which can be obtained from the manufacturer data or experimental data under the rated conditions.
The device manufacturers can fit the corresponding coefficients according to corresponding equation, based on the test data of multiple working conditions, by testing the cold machine under different working conditions, and write the coefficients into the device before the device leaves the factory.
2.2. Network & Communication
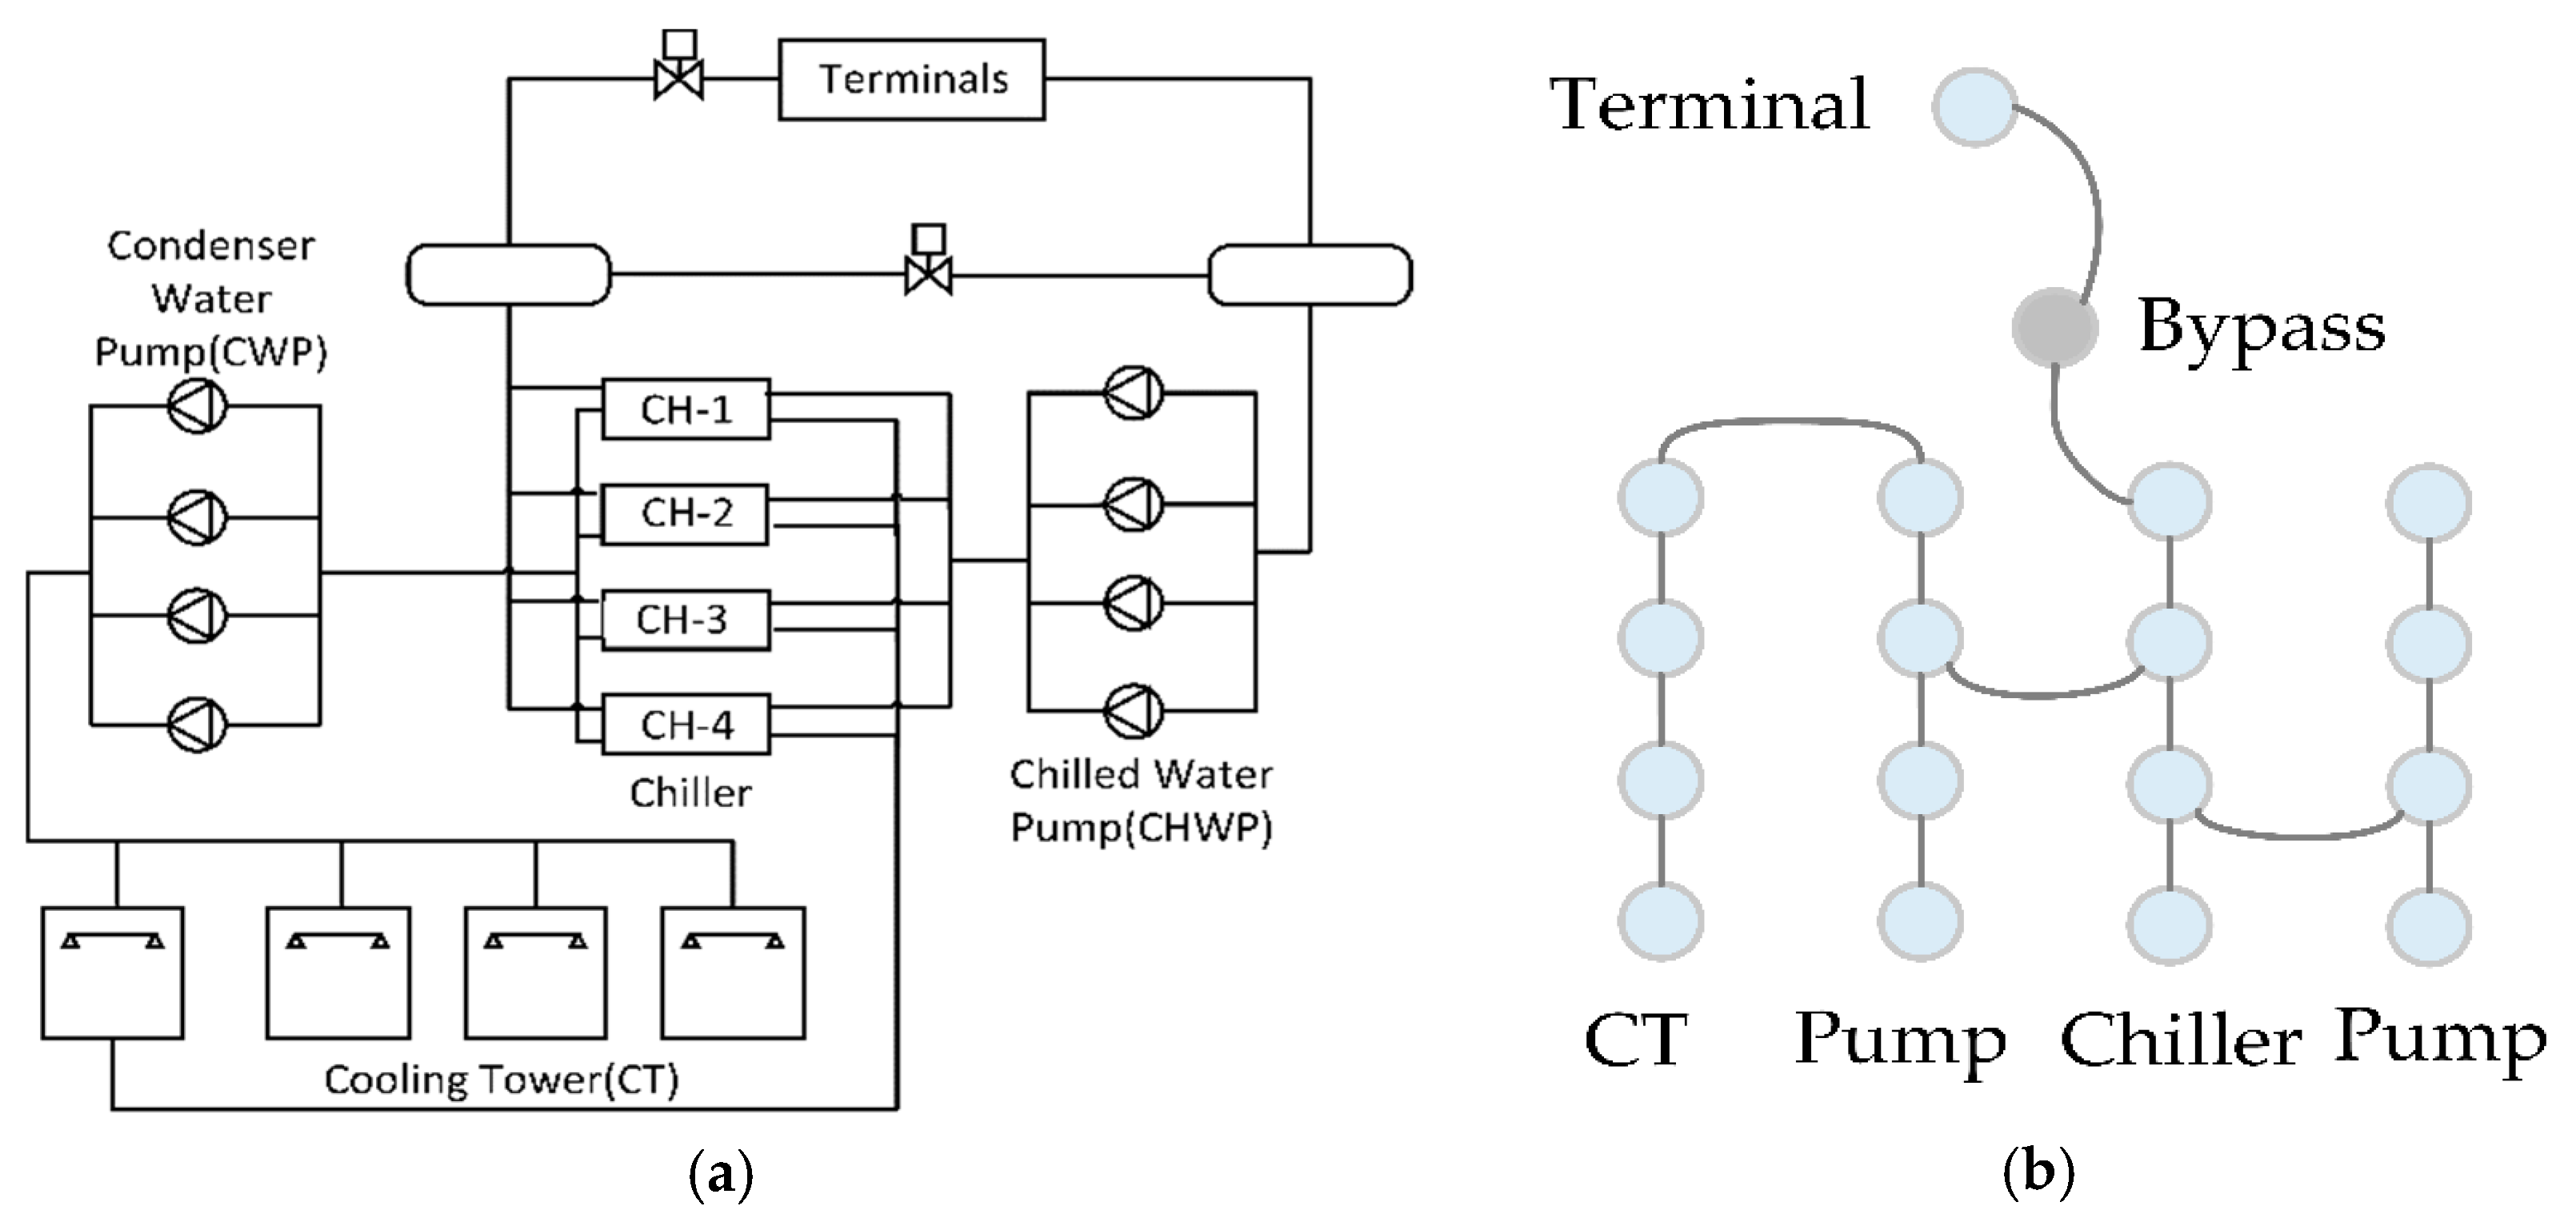
Under the consideration of the designing and using functions, the electromechanical devices in the chiller plant system are physically connected through pipes according to a certain paradigm, which can also reflect the control requirements between the devices to some extent. As shown in
Figure 4a, it is a schematic diagram of the physical connection of a typical cooling station. Four refrigerating pumps are connected in parallel, that is, the adjacent refrigerating pumps are directly connected by water pipes. In operation, four pumps need to mutually negotiate to complete the control objectives. Therefore, the basic simple and intuitive rule is to connect the devices with communication lines according to the physical connection topology of the devices. The communication connection topology of the smart device shown in
Figure 4b is identical to the physical connection topology of the device.
The special features of the above network are: (1) there is no centre of the network, all nodes are equal; (2) nodes can only communicate with their neighbours; (3) the network is scalable. It’s very flexible to expand the network by connecting nodes to the adjacent nodes in the network.
Based on the simple and straightforward rules, the communication connection is completed. The “smart devices” exchange information through communication to complete various control tasks together, which is equivalent to automatically generating the control system, that is, completing the “plug and play” system construction.
2.3. Decentralized Computing
Since there is no centre node in the system, decentralized computing is required. In a traditional system, in which the centre node collects data, computing is carried out by the centre node, like the brain. However, in the decentralized system, computing is carried out through collaboration of all the nodes, like the neuron system. For example, in solving a linear system of equation
, the problem decomposition and decentralized algorithm are as follows [
27]:
First, the problem is decomposed into pieces. Each node holds part of the problem. Back to the chiller plant system, the parameters describe whether the pieces of the problem come from local measurement or a neighbour of the basic unit. No node knows the entire problem. Each node corresponds to an unknown in the system of equations, as well as a row equation. Second, based on the variable information and local variables of the adjacent nodes and the equation information, each node updates the calculated local variables . Through repeated interactions between a large number of nodes, the results of each node’s calculations converge. In this process, a large number of identical individuals work together to accomplish a global problem by performing local tasks and collaborating.
3. Decentralized Control Algorithm
3.1. System Cooperative Protection Algorithm
This algorithm focuses on the safe and stable operation of all intelligent electromechanical equipment (chiller, water pump, cooling tower) in the cooling station, ensuring that it can work independently. The basic purpose is to automatically realize the automatic sequence start and sequence stop of each device of the cooling station system. During the whole running process, after the user sets the switch of the device through the schedule or manually, the device interacts with other devices in the same group to determine whether the condition for executing the instruction is met. If the condition is met, the corresponding power on/off command is executed; if the conditions are not met, the status is maintained and the instruction decision judgment is continued.
3.2. Device Self-Organizing Optimization Control Algorithm
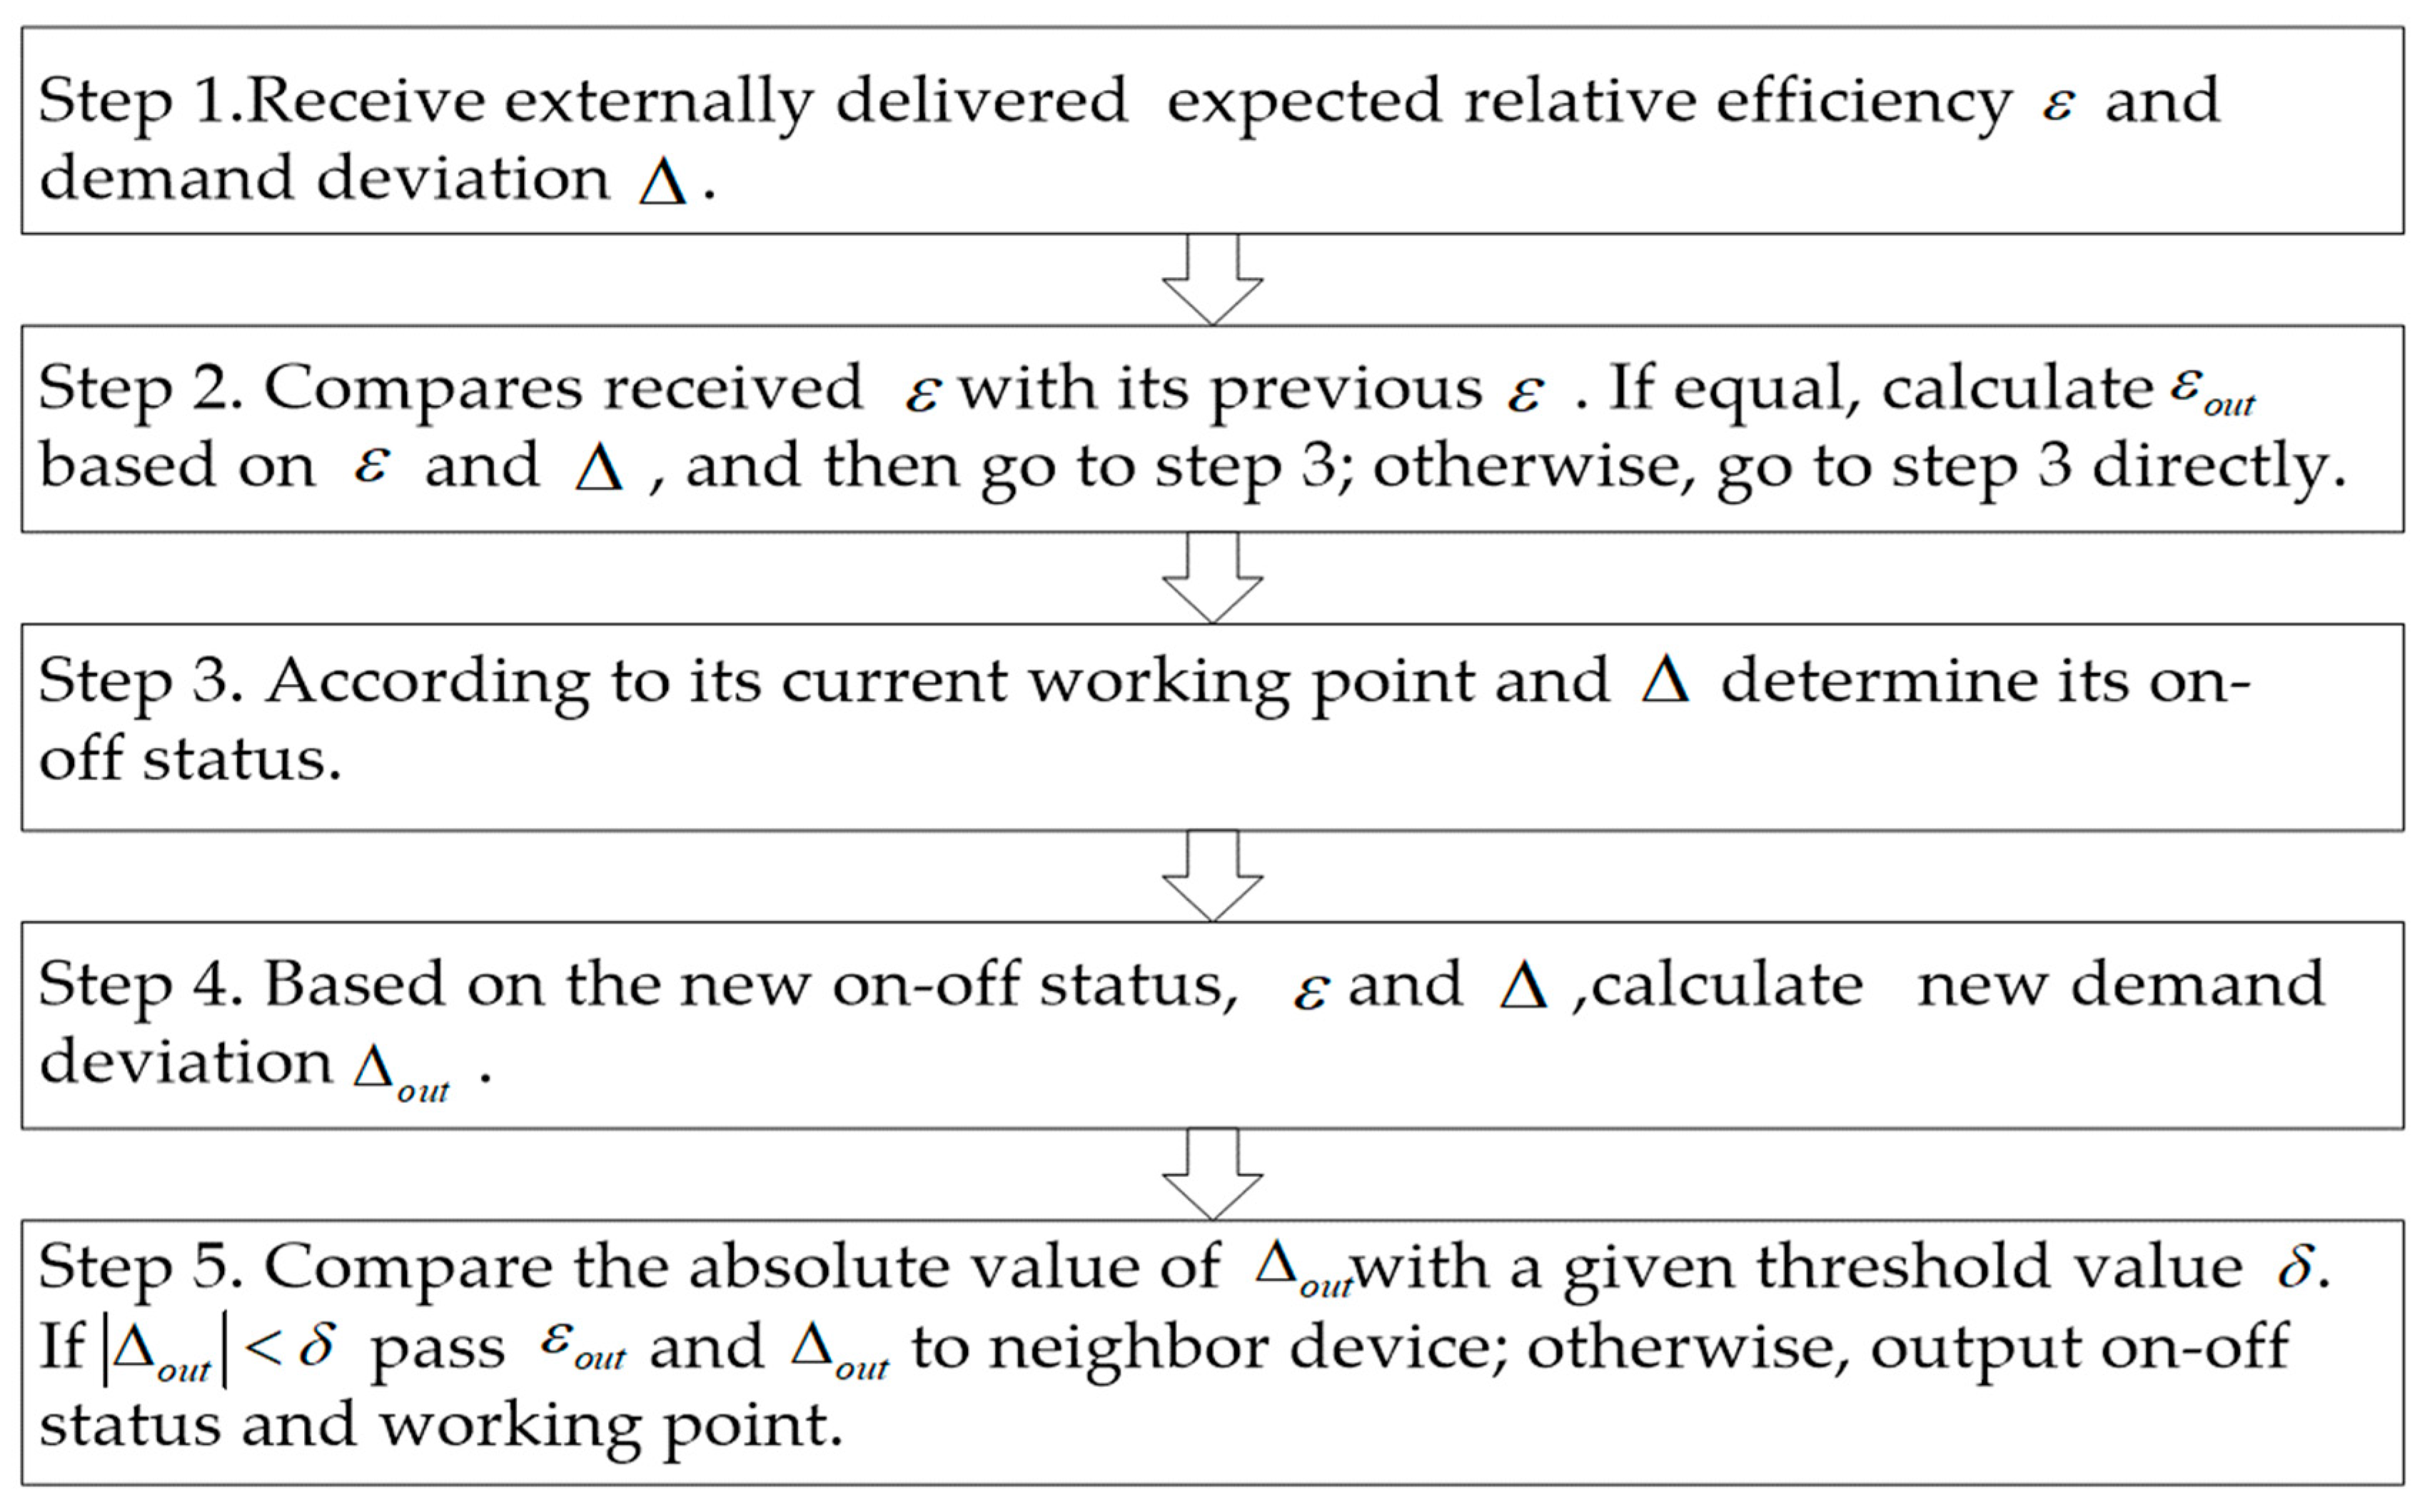
The adjustment process of the device self-organizing optimization control algorithm is an iterative process in which multiple devices negotiate with each other. The basic principle of optimal control is that all equipment takes the highest point of efficiency as the starting point of adjustment, and determines the direction of adjustment according to the direction in which the initial working point of the equipment deviates from the highest efficiency point, and at the same time, transmits the expected efficiency
and demand deviation
to the neighbor nodes. According to the received efficiency expectation and demand deviation, the node combines its current efficiency expectation, outputs new efficiency expectation
and demand deviation
, and transmits it to the neighbor nodes. When the transmitted demand deviation is less than the set calculation precision
, the calculation converges. Then the nodes output and execute the new control results. The flow chart of the device self-organizing optimization control is shown in
Figure 5.
For different devices, and need to be defined separately. The chiller efficiency expectation can be defined as the ratio of the current COP to the highest COP, and the deviation of the distribution amount is the deviation between the current assumed cooling load and the total system cooling load demand.
The pump efficiency expectation can be defined as the ratio of the current efficiency to the highest efficiency, and the deviation of the distribution amount is the deviation of the currently provided flow from the total system flow demand.
In actual engineering, in order to avoid uneven water distribution, the lower limit of the flow rate of the cooling tower is usually set to avoid uneven flow of the flow due to the flow rate of the cooling tower. Therefore, the number optimization problem of the cooling tower can be simplified as follows, the cooling towers are turned on as much as possible under the given total flow rate of the condenser water, and the flow rate assigned to each cooling tower is not lower than the minimum flow rate set by each. Therefore, the efficiency expectation
can be defined as the ratio of the actual condenser water flow rate
of the cooling tower to the minimum condenser water flow rate
set by the cooling tower, i.e.,
, and the deviation
of the distribution amount is the difference between the total flow taken by the current cooling tower and the total flow of the system condenser water. More detailed description of the device self-organizing optimization control algorithm can be referred to article [
28].
3.3. Coordination Optimization Algorithm for Trunk Pipe Coordinator
The function of the chilled water trunk pipe coordination controller optimization control is to calculate the user side cooling load demand, and at the same time, by adjusting the bypass valve, the chilled water quantity is guaranteed to meet the minimum flow demand of the chiller. According to the minimum flow demand of the chiller, the current chilled water flow, and the measured value of the pump differential pressure, the demand differential pressure that meets the minimum flow rate is calculated. When the demand pressure difference is greater than the set value of the differential pressure of the water pump, the opening degree of the bypass valve is increased; when the pressure difference is less than the set value of the differential pressure of the water pump, the opening degree of the bypass valve is reduced. Through the combination with the control of the chilled water pump, the amount of chilled water is satisfied while minimizing the energy loss caused by the bypass.
The function of the condenser water trunk pipe coordination controller is to ensure that the return water temperature of the chiller is not less than the lower limit of the return water temperature. When it is found that the return water temperature of the condenser water is lower than the lowest temperature of the chiller operation, increase the opening degree of the bypass valve to ensure the normal operation of the unit; when the return water temperature is higher than the lowest temperature of the chiller operation, gradually reduce the opening degree of the bypass valve to reduce the energy loss caused by the bypass.
4. Case Study Based on New System
This chapter aims to conduct a case study applying the decentralized, flat-structured HVAC automation system to evaluate the cooling system for an aquatics centre, which is a commercial building located in Beijing, China. The climate of Beijing is a typical semi-humid continental monsoon climate in the north temperate zone. It is hot and rainy in summer, cold and dry in winter, and short in spring and autumn. The annual average temperature in the main urban area is between 11 and 13 °C. The annual extreme maximum temperature usually occurs in July, generally between 35 and 40 °C, and the annual extreme minimum temperature usually occurs in January, generally between 20 and −14 °C. Summer precipitation accounts for about three quarters of annual precipitation. In this case study, we demonstrate the energy efficiency, operability and cost saving of the control system.
4.1. System Description
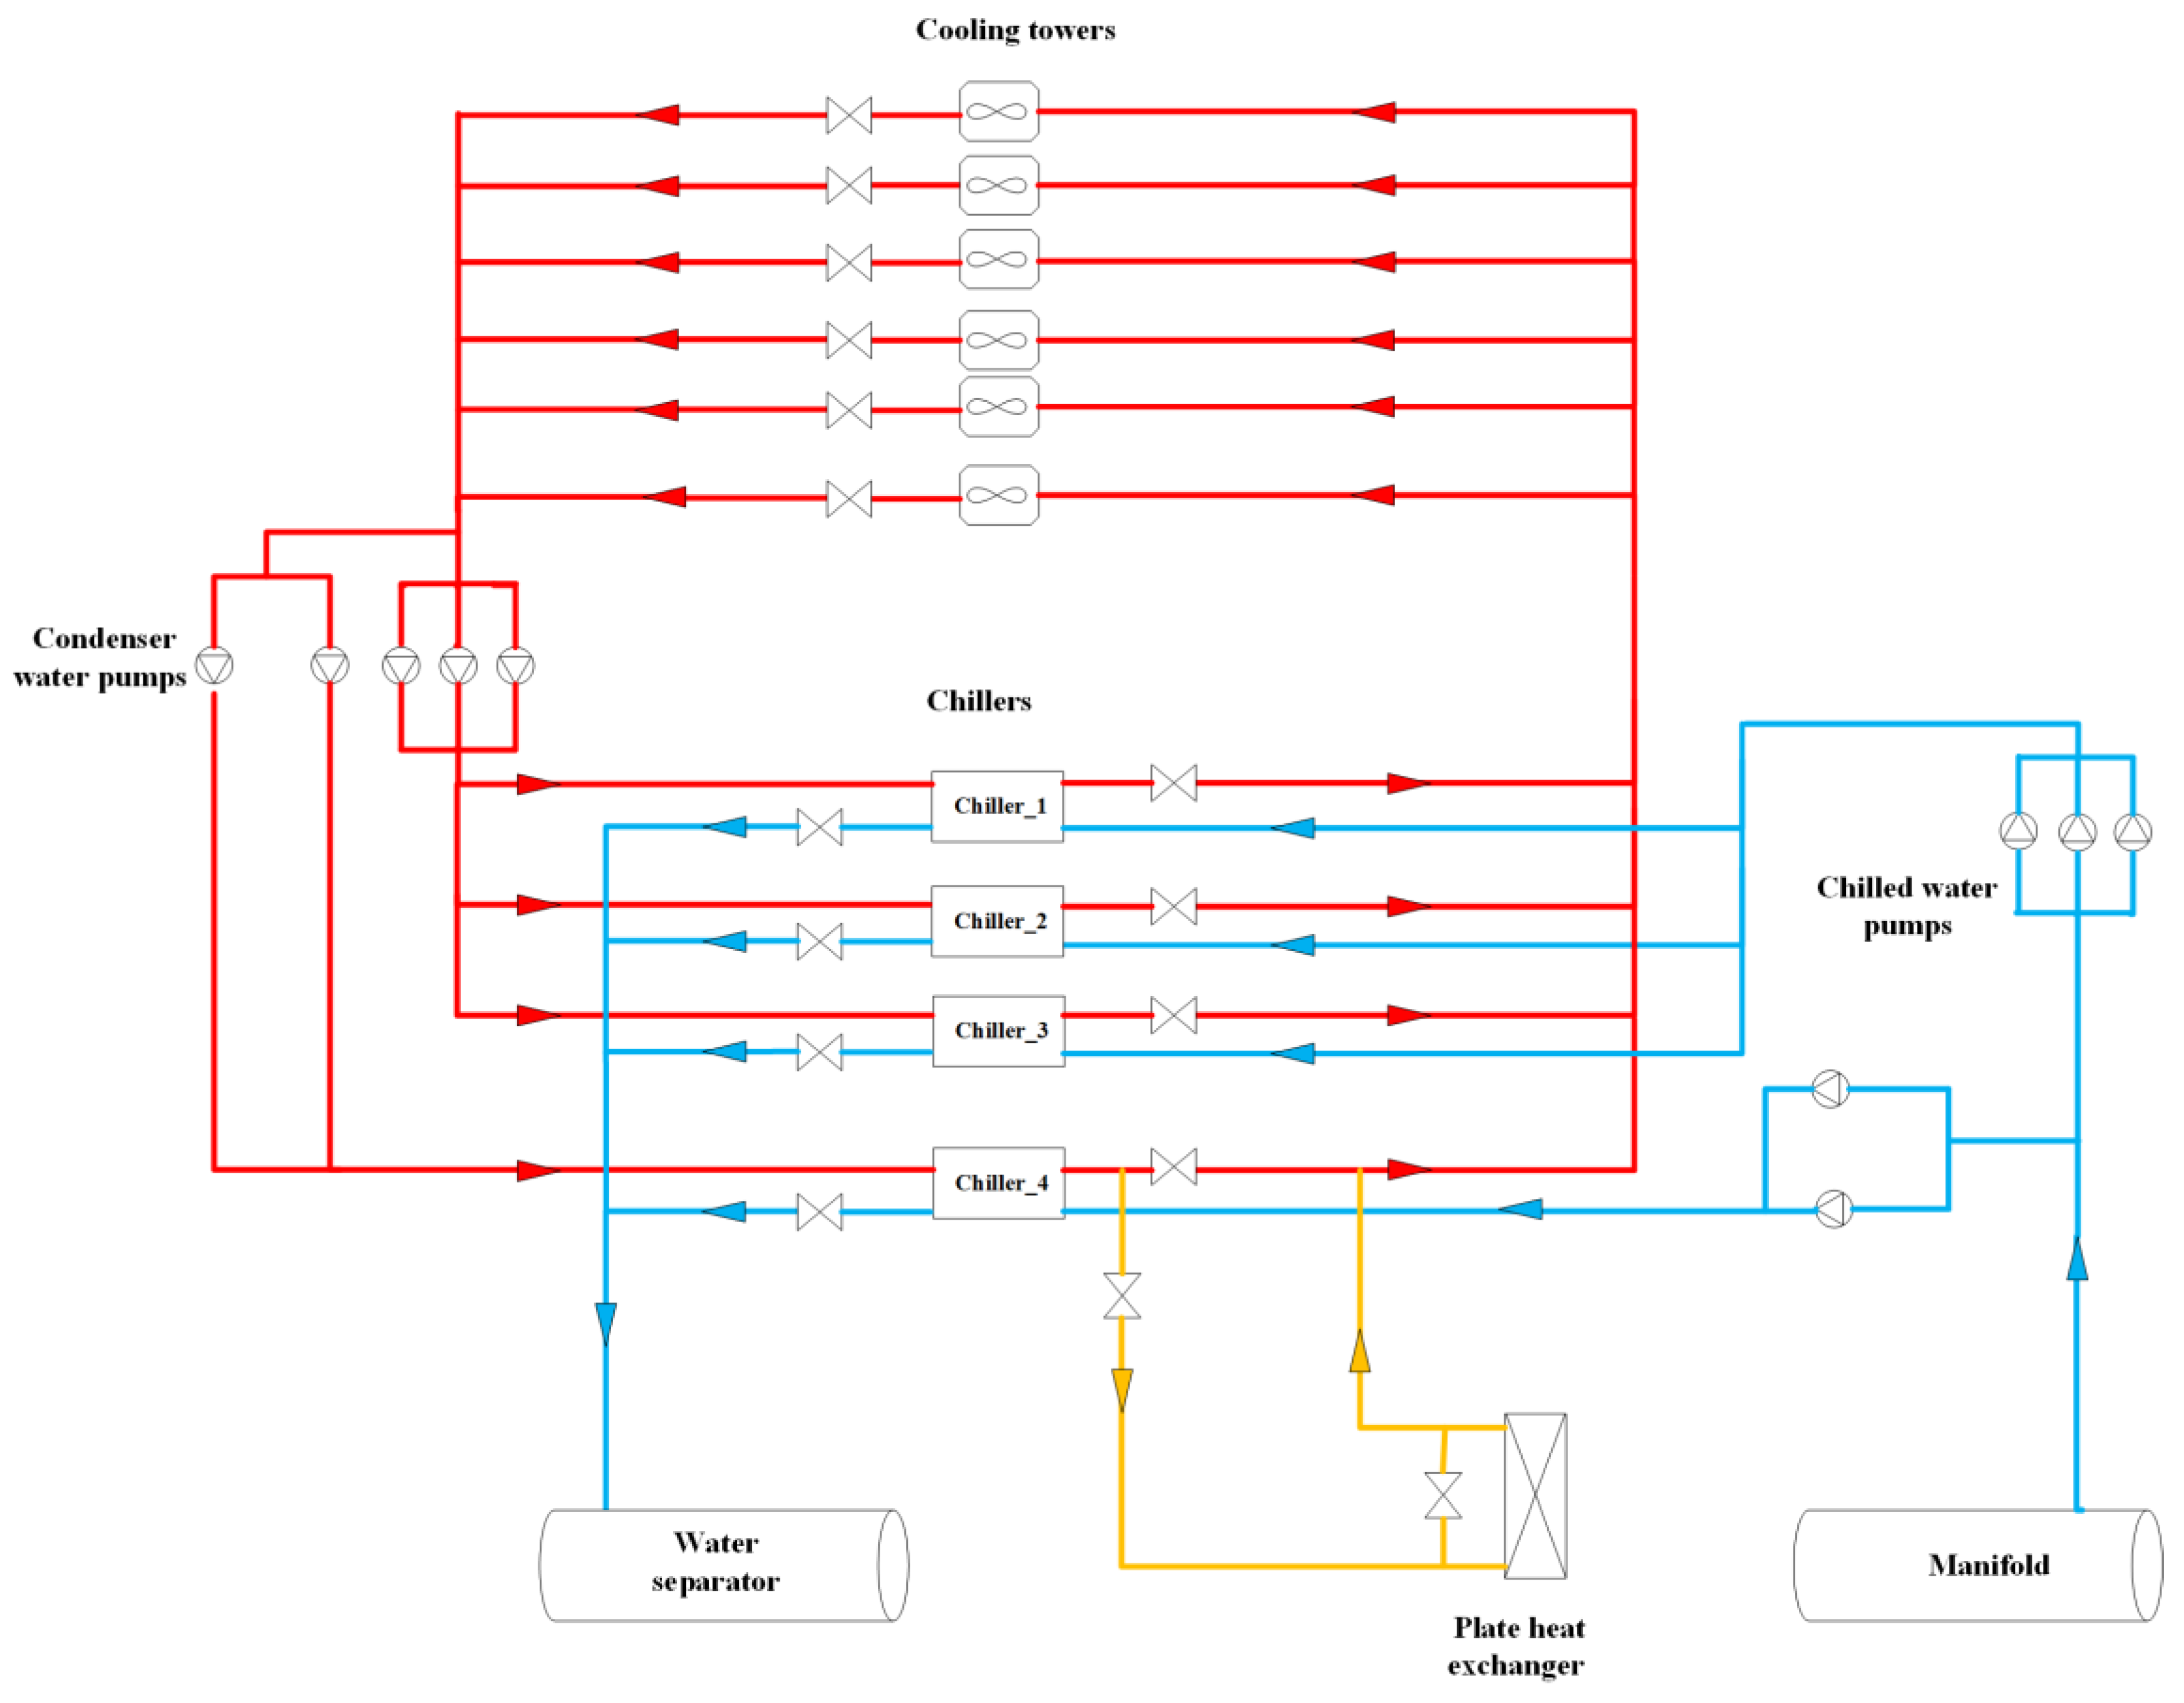
The aquatics centre adopts the chiller plant system for centralized cooling, with a cooling area of about 80,000 square meters. The chiller plant system mainly includes three centrifugal chillers, one centrifugal chiller with heat recovery, six cooling towers, five condenser water pumps, five chilled water pumps. These devices are mainly installed on the underground second floor. The nominal information of the main components in the cooling system is listed in
Table 2. The schematic drawing of the cooling system is shown in
Figure 6.
The original automatic control system of the cooling station cannot play the role of automatic control and energy-saving operation. There are several outstanding problems: firstly, the automatic control system has been modified many times, the original system is difficult to be closed and upgraded, and the retrofitting cost is high; secondly, the automatic control system is basically abandoned in maintenance, and cannot truly realize automatic control. The number of running equipment and frequency conversion operation require manual operation, which does not reduce the labor cost and optimize the operation.
4.2. Scheme Design of the Decentralized Control System
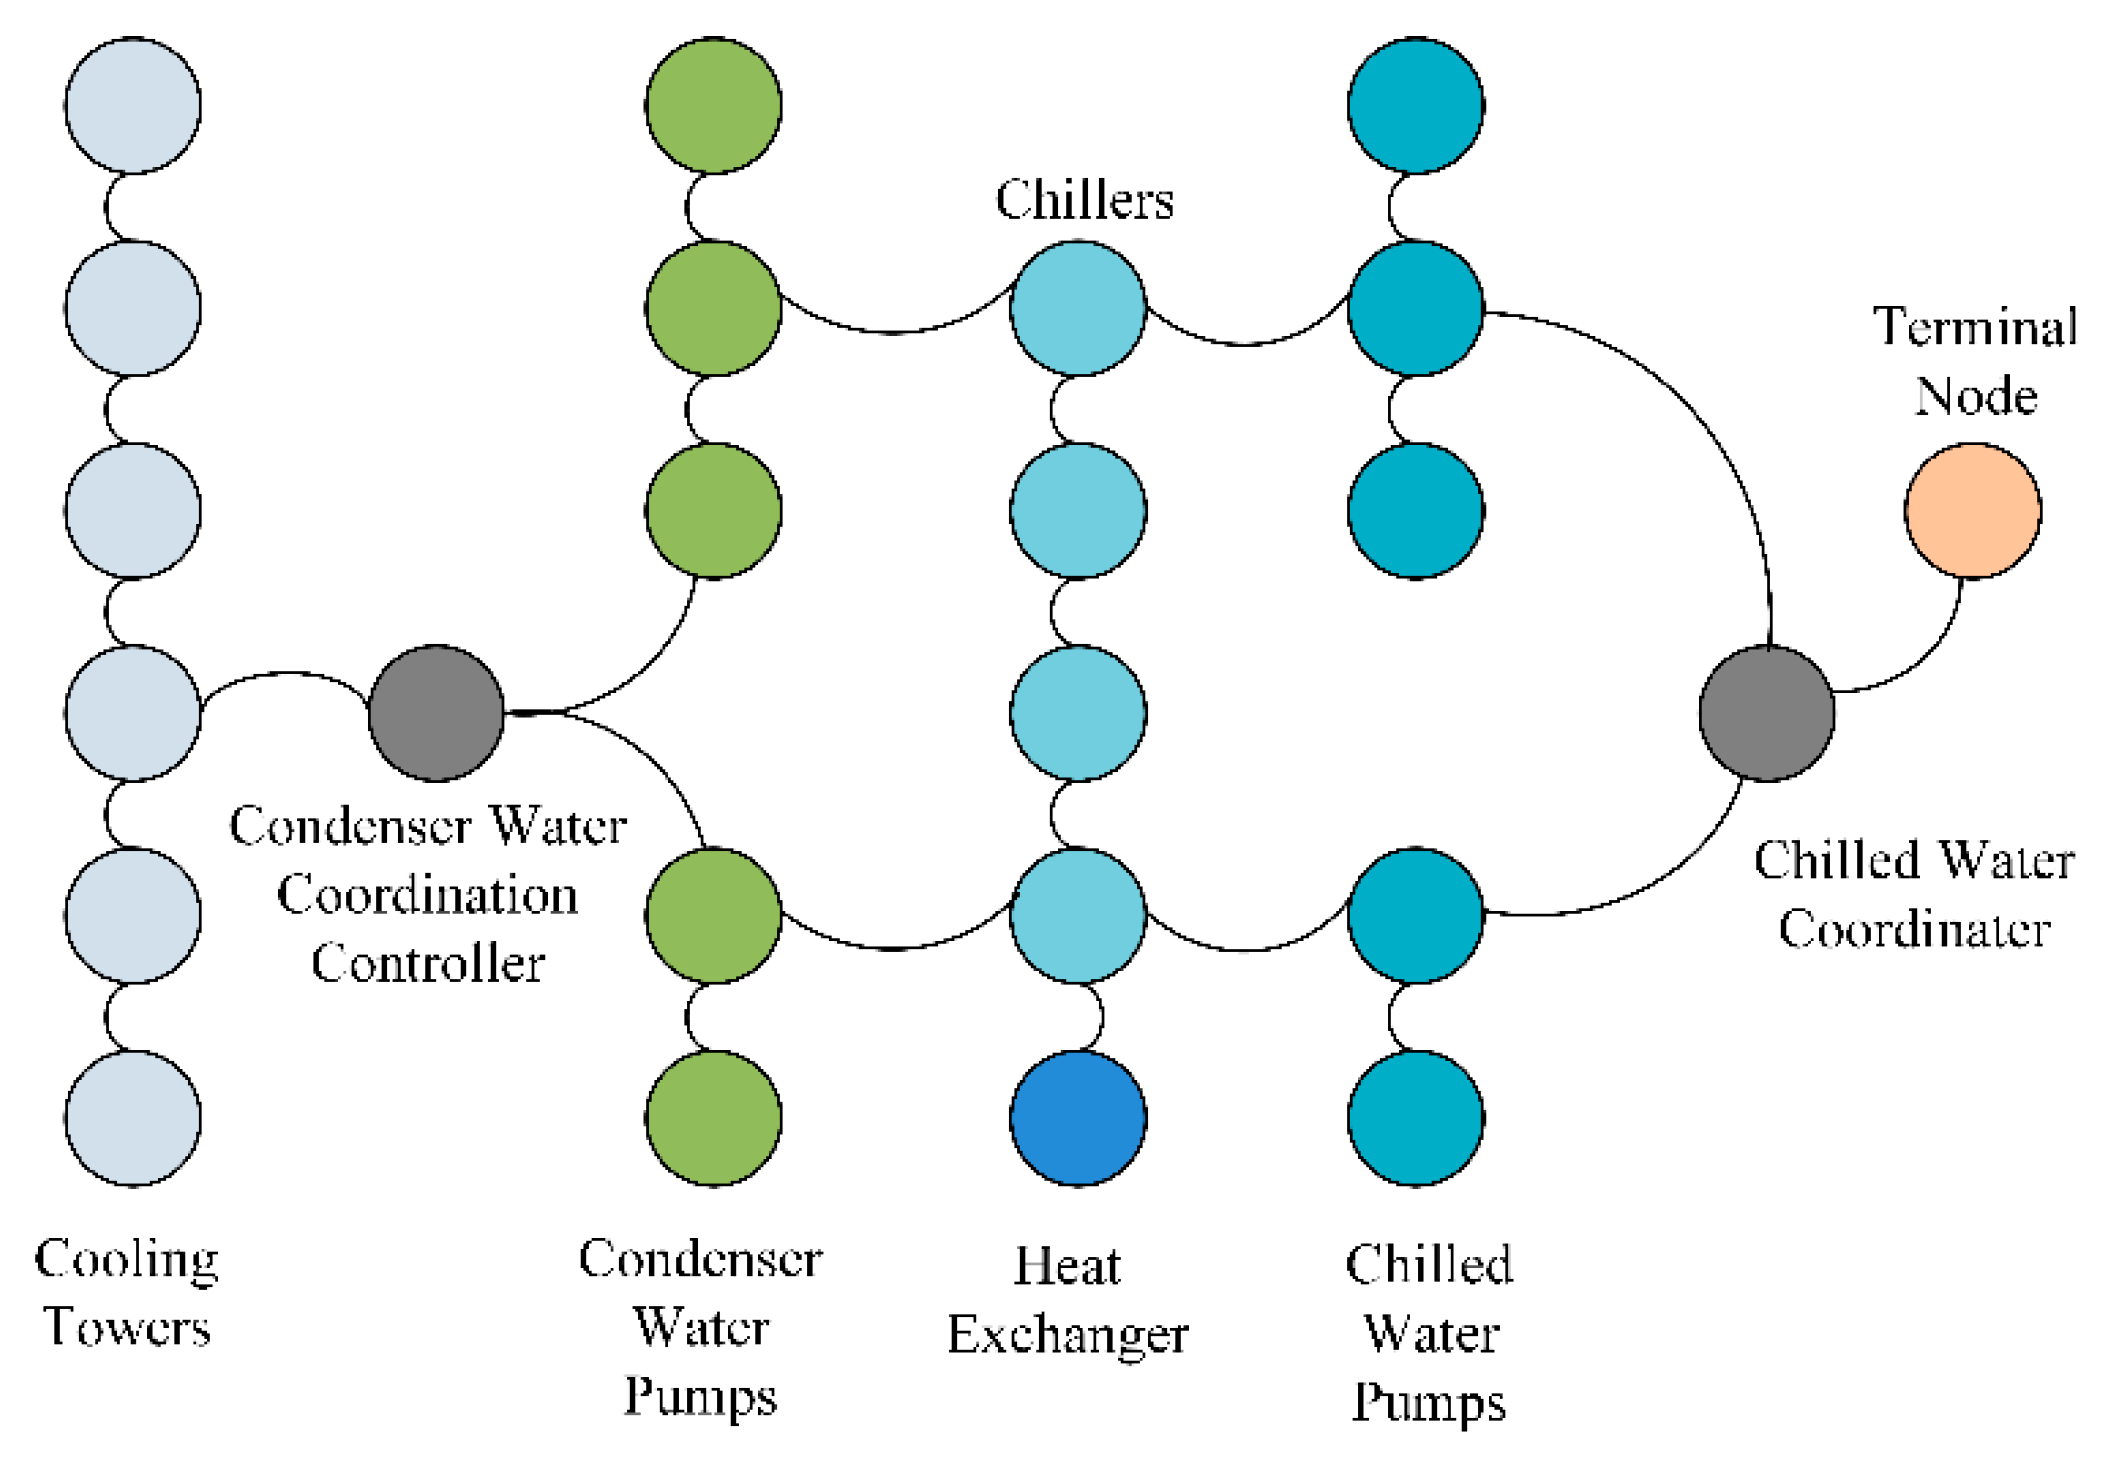
On the basis of the original water chiller, cooling tower, condenser water pump, chilled water pump and related coordination devices, an intelligent node (CPN, Computing Process Node) is set for each large electromechanical equipment, which is upgraded to intelligent electromechanical equipment. CPN is responsible for monitoring various parameters related to the target equipment and establishing an intelligent node network according to the physical topology relationship. The system topology connection relationship is shown in
Figure 7.
All standard databases are built in each CPN. When the CPN is connected to the live DCU, through the information exchange, the CPN will know that the DCU corresponds to a chiller or a water pump, thus automatically forming a database corresponding to the DCU. The detailed information of the standard database for each device are described in
Section 2.1. The model parameters of chillers and pumps are obtained from device manufacturer, which can be seen in
Table 3 and
Table 4. Each CPN has powerful arithmetic processing functions. All CPNs are connected to form a multicore, centerless computing platform, namely a “centralized computer.”
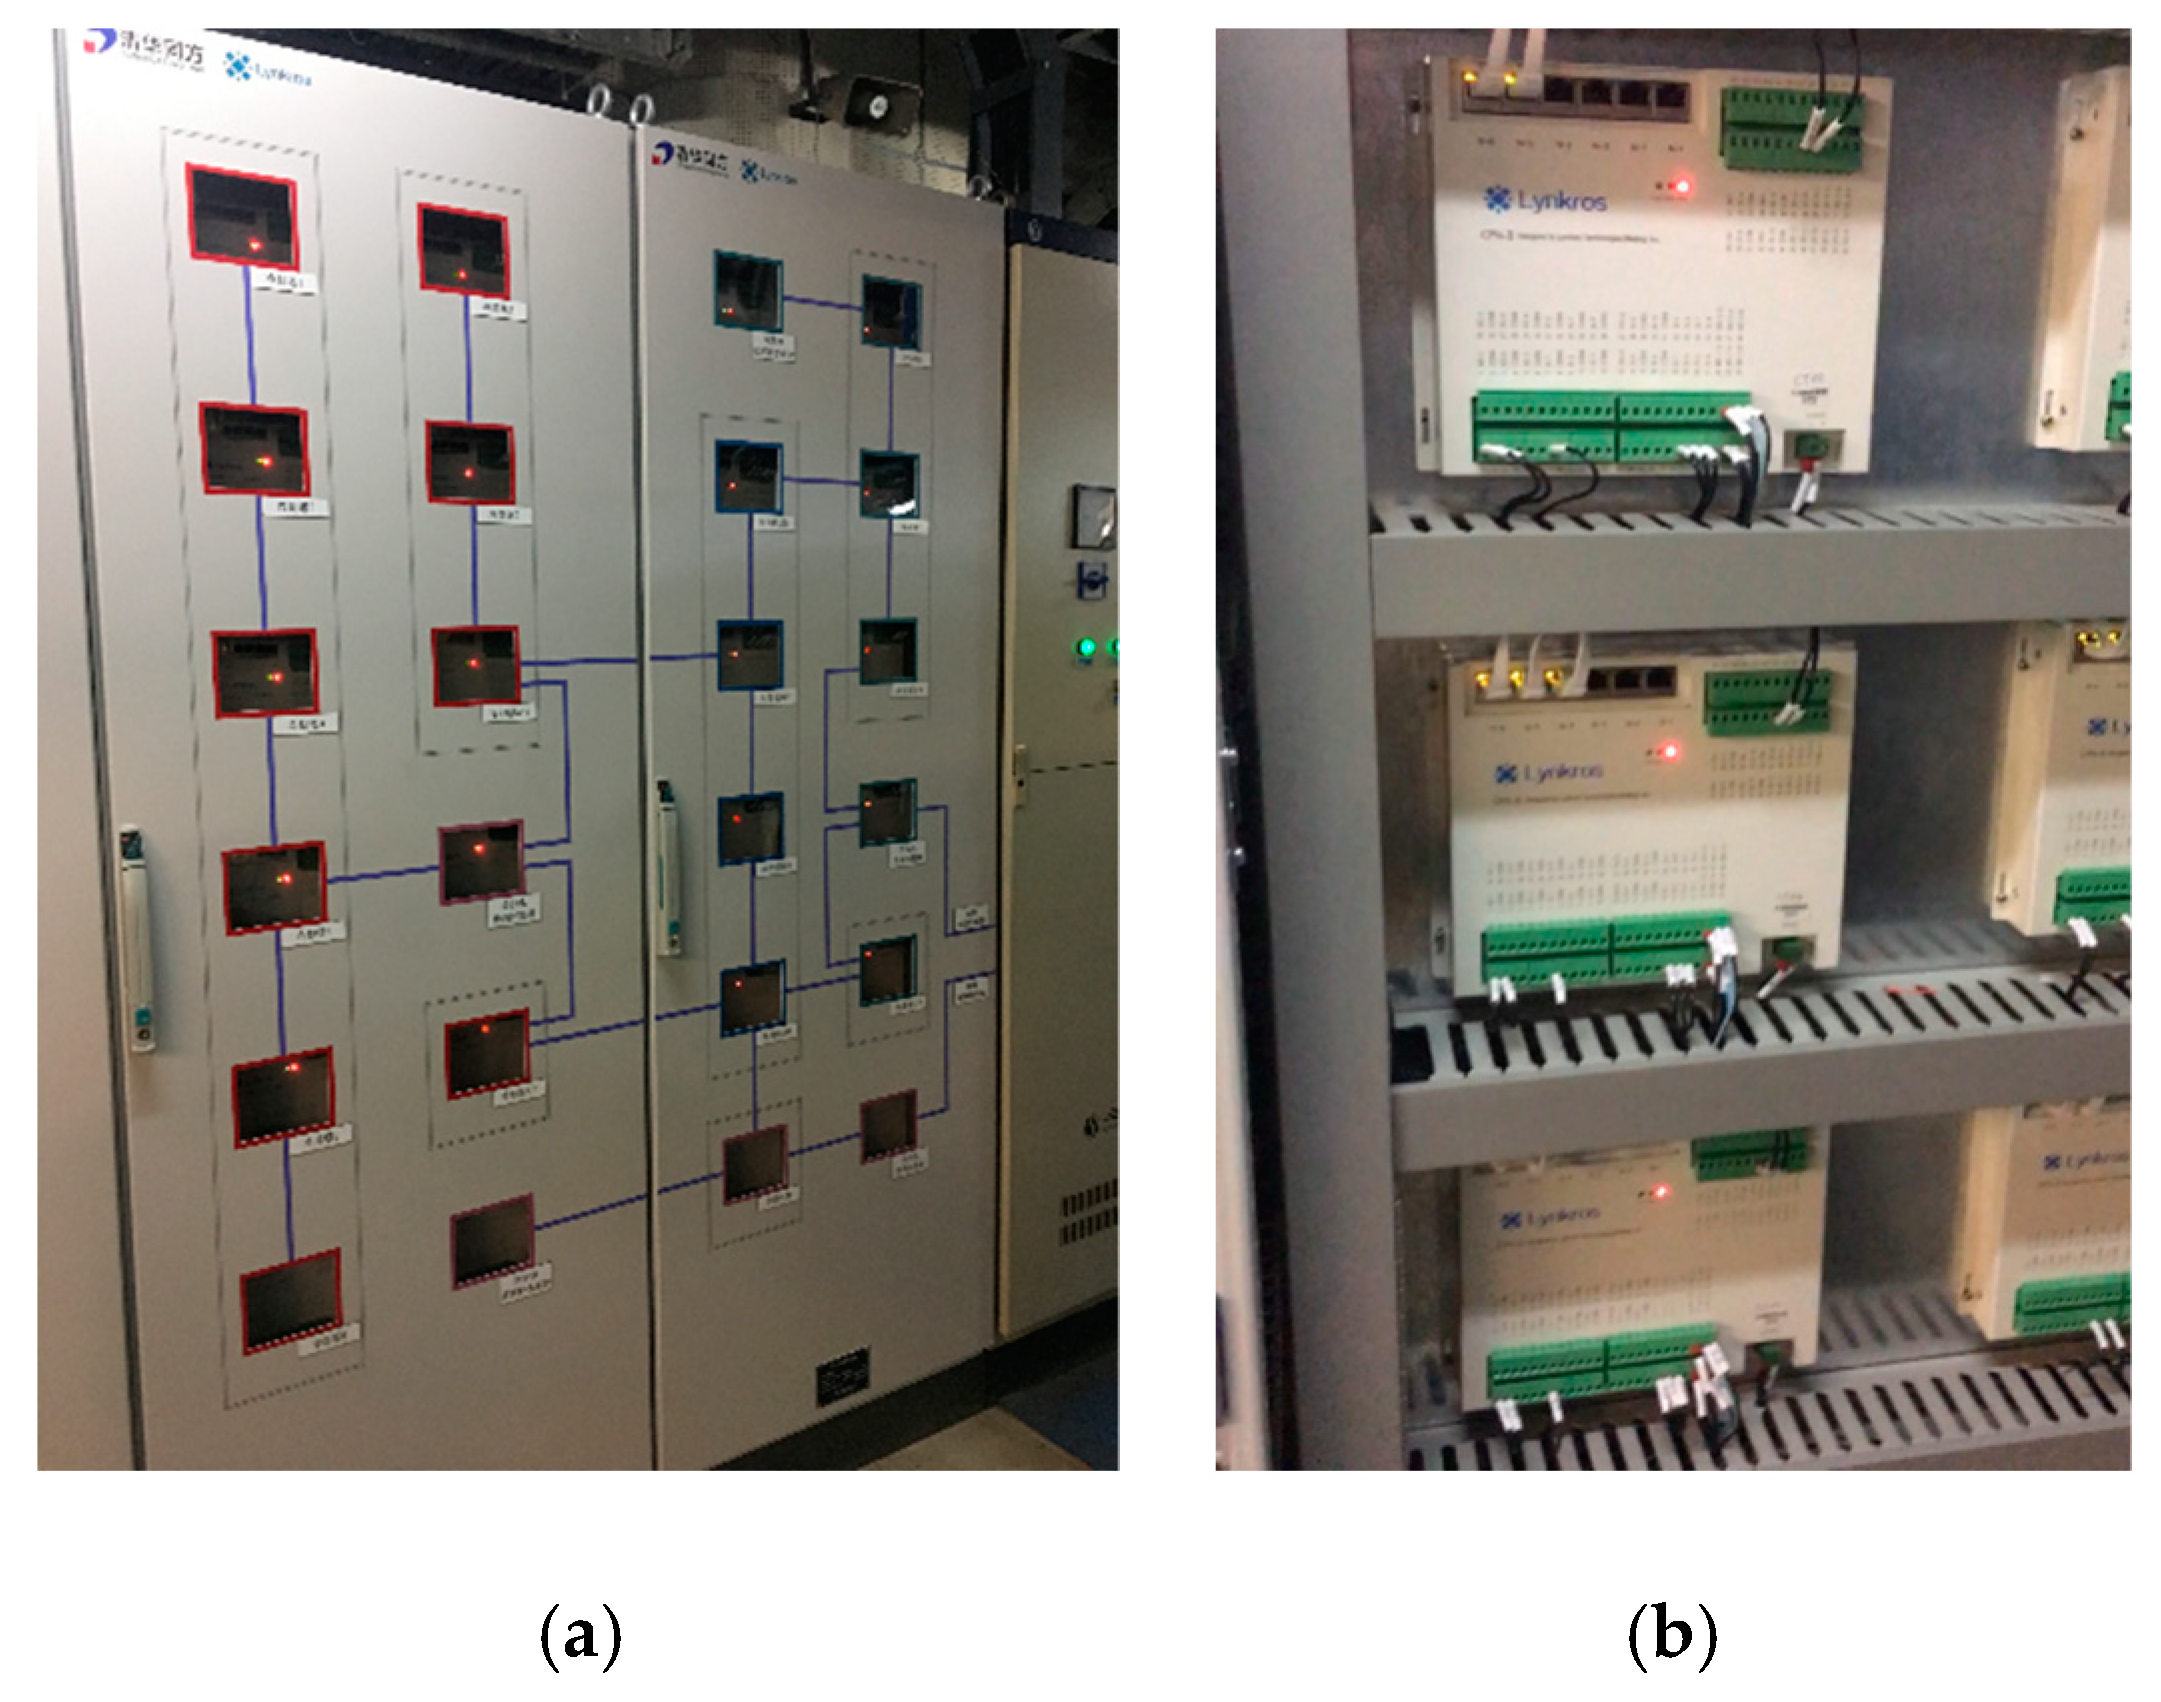
Figure 8b is the physical map of the CPNs. Each CPN is connected according to the physical topology relationship and is assembled into cabinets which are shown in
Figure 8. Finally, each CPN is downloaded the corresponding control algorithm APP described in
Section 3. Thus, all the CPNs can automatically monitor the parameters and issue control instructions.
4.3. Results and Analysis
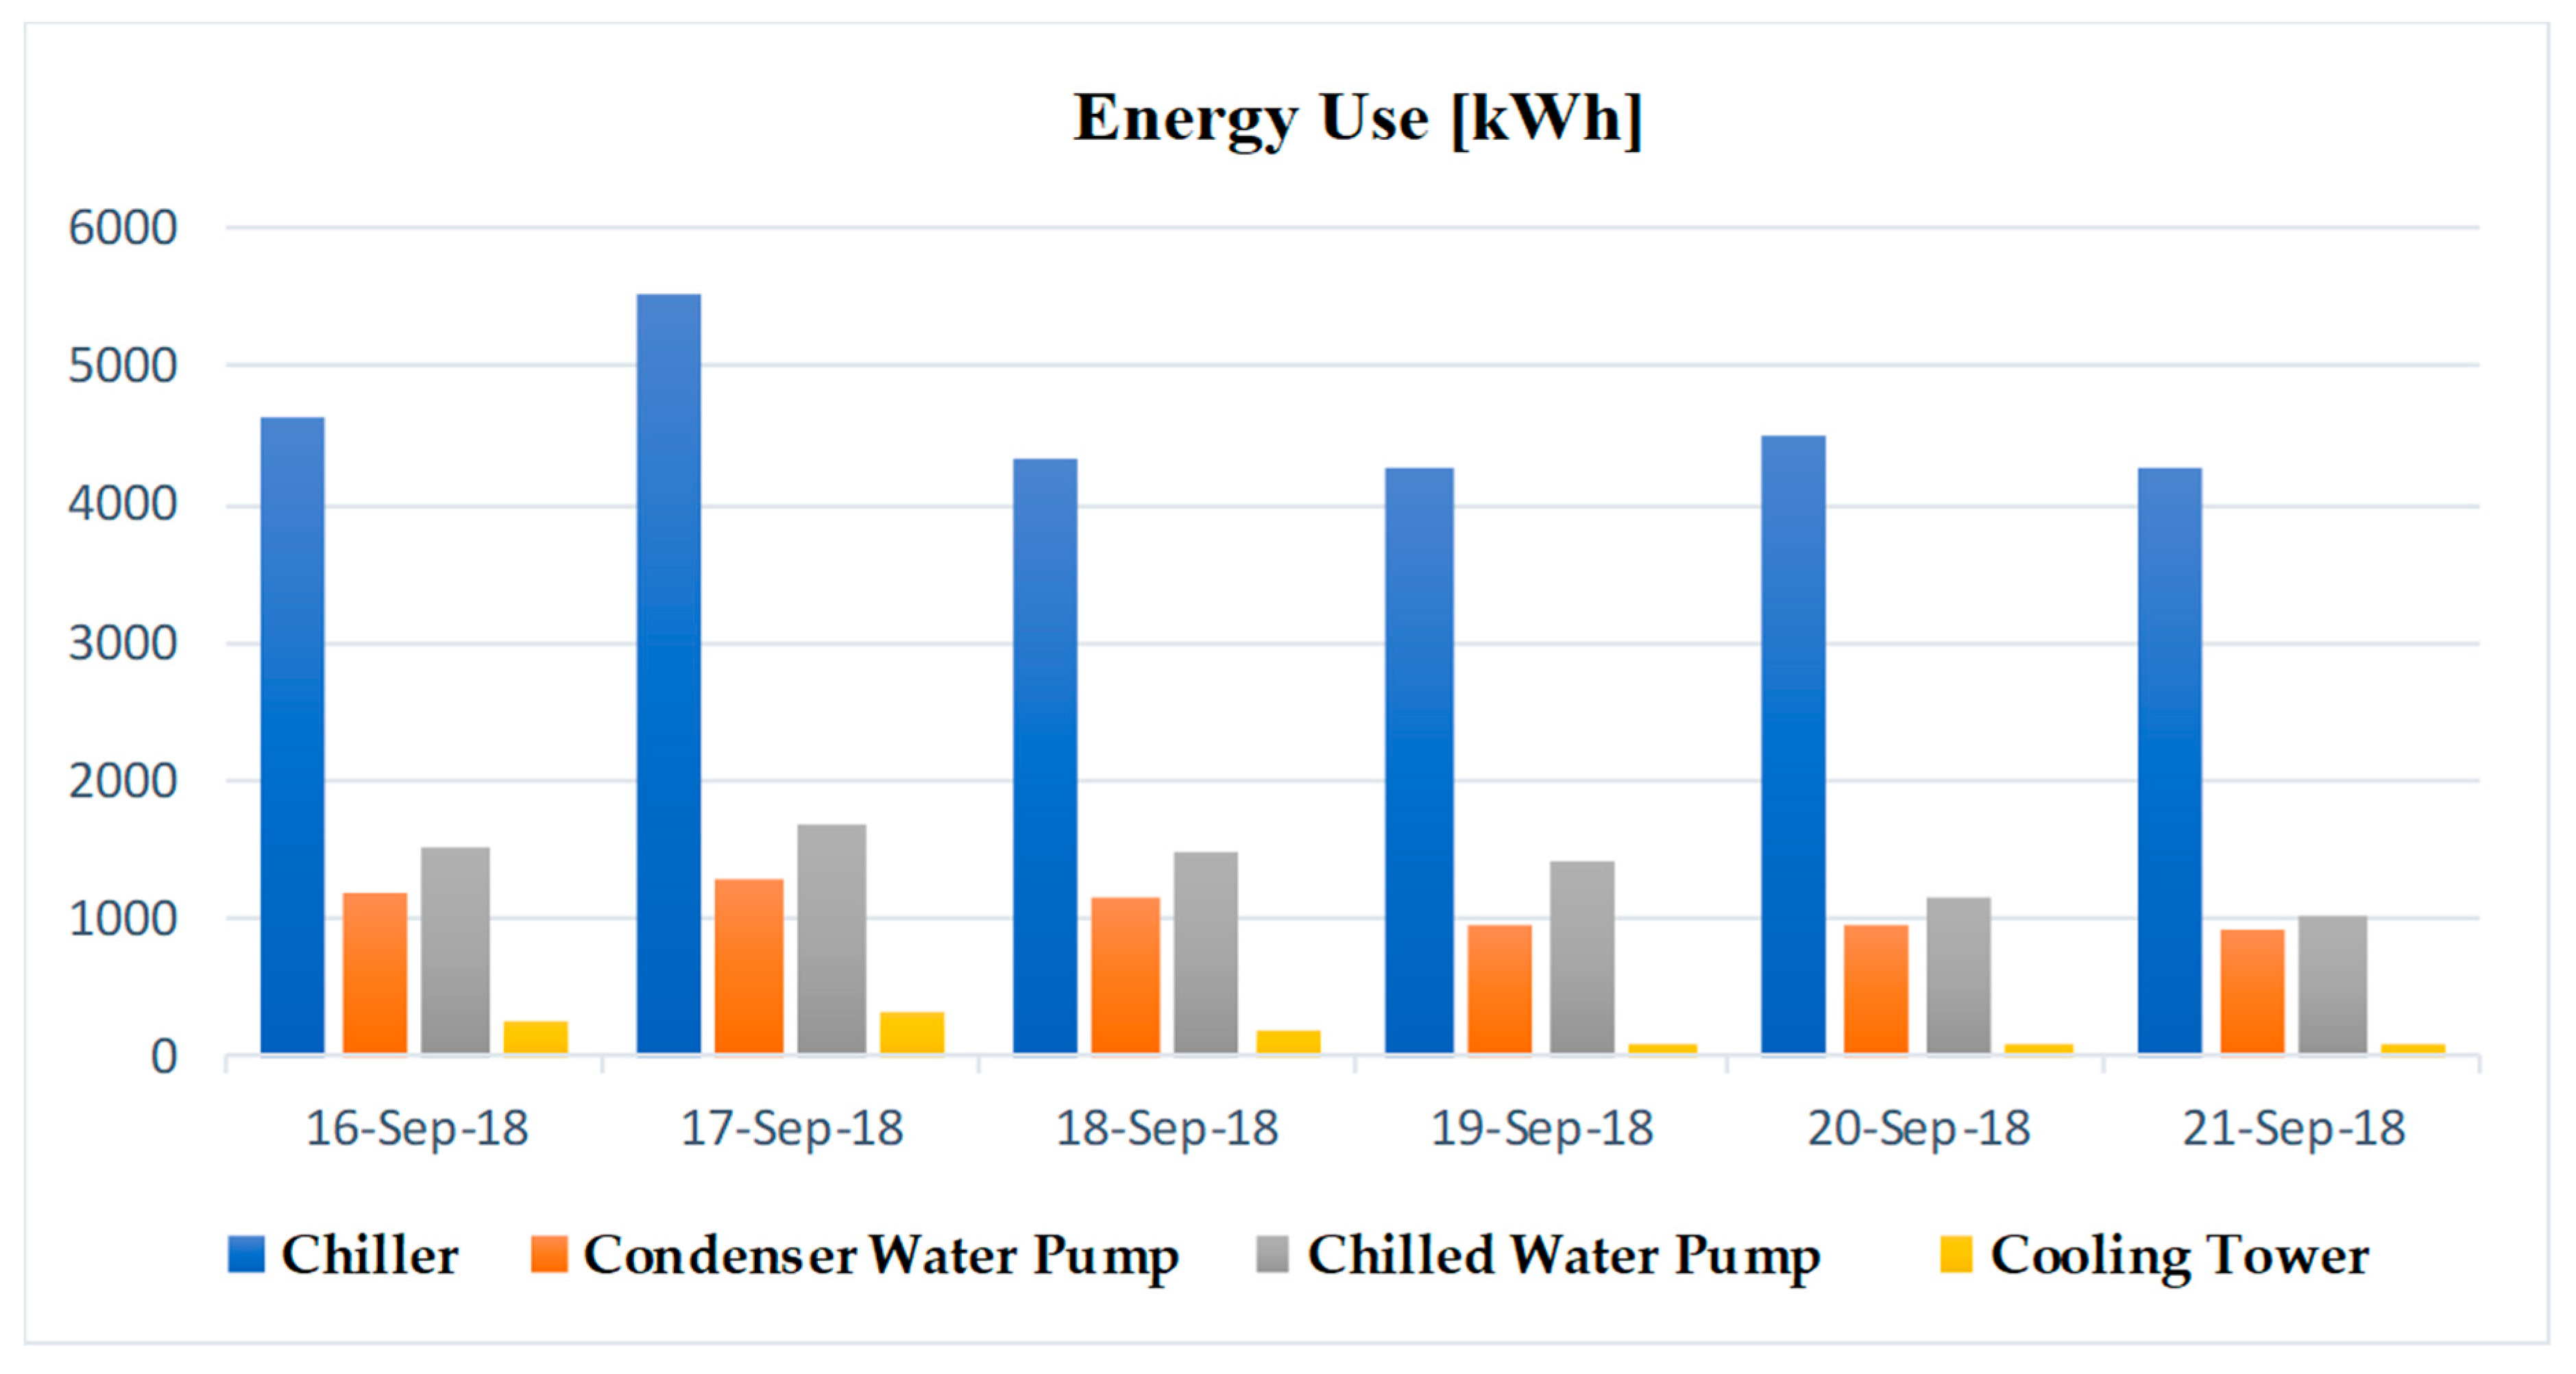
From 19 September 2018, the system started to operate the energy-saving optimization strategy. The comparison of the operation effects of the optimization control is as follows, among which, from September 16 to 18, the larger chiller was turned on, the water pump and cooling tower was operating at a constant frequency of 50 HZ, and the number of units was manually adjusted by the user. From September 19 to 21, the chiller was automatically selected according to the terminal load. The frequency and number of water pumps and cooling towers were automatically adjusted by optimizing control APP.
To analyze the energy efficiency of the decentralized control system, the energy use of the main equipment before and after the installation of the control system is calculated, which can be seen in
Figure 9. Only 6-day energy use records are selected, mainly because the start time of optimal control operation is September 19, and there is little difference in meteorological conditions for these 6 consecutive days. Specific meteorological parameters are shown in the
Table 5. The highest and lowest temperatures in these six days are 27 °C and 14 °C, respectively. And the weather is mainly cloudy and sunny.
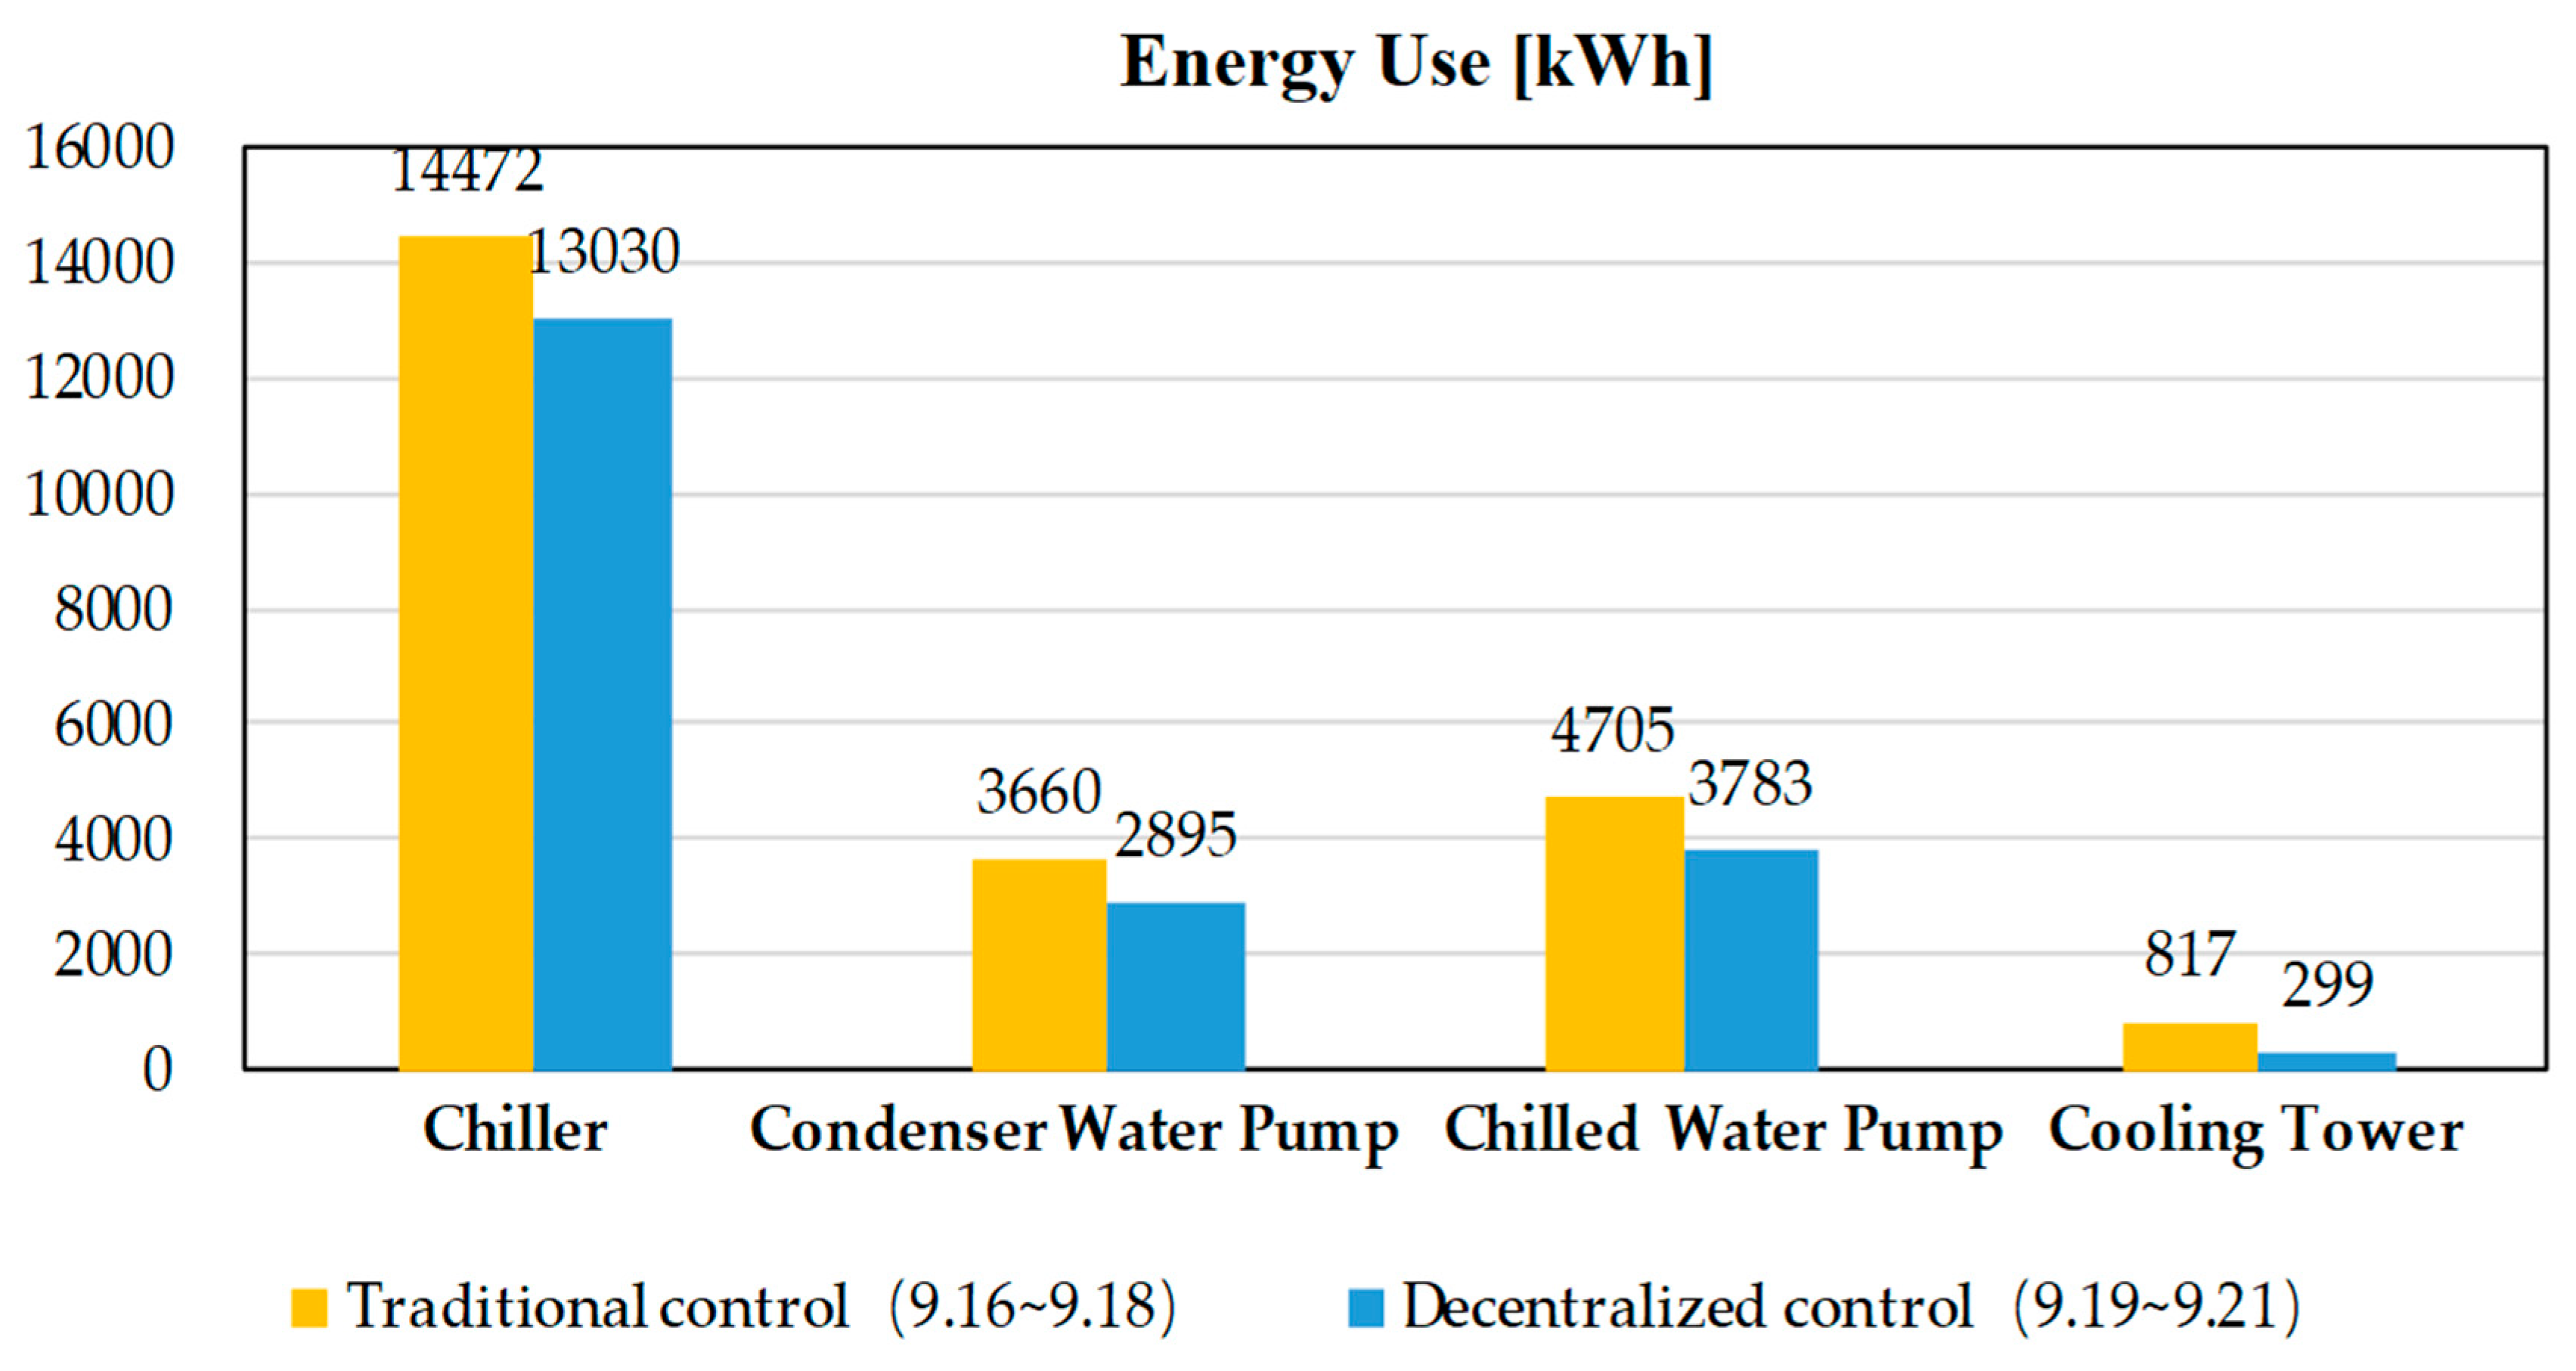
Condenser water pumps and chilled water pumps were adjusted by number and frequency conversion, with energy saving rates of 20.9% and 19.6% respectively. At the same time, the original system had all cooling tower water valves fully opened. Under the automatic control strategy, the cooling tower water valves were switched on and off according to the cooling water volume and the operation of the cooling tower fan, avoiding the water mixing phenomenon of the cooling tower, which reduced energy use by 63.4%. The average temperature of condenser water decreased more than 1 °C, and the energy efficiency of the chiller was relatively improved 10%. The comparison of the energy use of the main device under traditional control and decentralized control can be seen in
Figure 10. Totally, the energy saving rates of the whole system reached to 15.4%, which can be seen in
Table 6.
In order to further reflect the energy conservation of the method proposed in this paper, I calculated the monthly system energy use of the chiller plant system from starting up in May to shutting down at the end of September. The comparison of the energy use of the main device in each month is shown in
Figure 11.
Table 7 lists the monthly energy use of the main device from May to September. From 19 September 2018, the system started to operate the energy-saving optimization strategy. In September, the total energy use of the chiller plant system decreased significantly compared with the previous four months, 267,953 kWh less than that in August and 33,996 kWh less than that in May.
At present, the decentralized control system has the following functions:
- (1)
System remote monitoring. Users with permission can browse the operation status, failure status, key operation parameters, operation energy use, etc. of each controlled device by logging in the webpage; and can control the start-stop state of each equipment according to the authority, or set the parameters such as rotation speed, frequency, chiller outlet water temperature setting value, etc.
- (2)
The operation and maintenance of the equipment are simplified without complicated manual operation procedures. The daily time switch machine can be set by setting the schedule. The management personnel can set and switch modes according to the scene, thus adapting to flexible and changeable management requirements.
- (3)
Realize the local safety protection and sequential start-stop of the equipment independently.
- (4)
Through coordinated control among equipment to reduce energy use in system operation. During system operation period, through energy-saving optimization APP to realize efficient and optimized operation of the system.
In the commissioning phase, the decentralized control system eliminates manual network configuration commissioning work. In the maintenance phase, the operation and maintenance of the equipment is simplified, and no complicated manual operation process is required. Thus, it is time saving and cost saving.
In summary, the proposed decentralized, flat-structured HVAC automation system is energy efficiency, operability and cost saving.
4.4. Prospects for Optimal Control
Optimizing the control of the terminal air-conditioning box system can facilitate the supply of cold energy on demand, reduce the bypass of water and solve the problem of “large flow and small temperature difference”. At the same time, the control of the cooling station can be combined with the air conditioning box, and the set value of the total chilled water supply pressure which can be adjusted according to the terminal intelligent node. For example, if the water quantity of the terminal equipment is insufficient, the rotating speed of the water pump can be increased according to the number of terminals that do not meet the requirements. Under the condition that all ends meet the requirements, if there is too much water at the end, the rotating speed of the water pump is reduced. In this way, on the premise of meeting the demand of cooling capacity at each end, the pressure set point is reduced as much as possible to further lower the energy use of the water pump.
5. Conclusions
The automation system is complicated and prolonged, because it requires an enormous amount of secondary onsite development effort like configuration and commission. Each control system should be exclusive and individual development for onsite measurement, wiring, configuration, commissioning, and development. Then, it incurs high maintenance and labor cost. To solve the actual engineering problems, this paper presents a decentralized, flat-structured control method for HVAC system. It is based on intelligent nodes (CPN) to realize device self-identification and automatic networking. Moreover, using the developed decentralized control algorithm APP, the intelligent nodes can negotiate with each other to achieve global optimization control. It reduces the workload of wiring, configuring and commissioning, and it can be easily applied to other HVAC systems. The application of an actual decentralized HVAC automation system proved that the proved method is energy efficiency, operability and cost savings.
The optimized decentralized control for equipment of chiller group, water pump group, and cooling tower group is gained. However, the mechanisms among different device groups, like how the chiller group and water chill group work together to achieve a high energy efficiency, should be studied in the future. In addition, in the future research, long term data will be collected to further verify the effectiveness and energy saving of the control system.


