1. Introduction
The correlation between demand and utilization of public transport and sustainability is widely known not only among experts but also among citizens. However, the connection of demand elements and usage of public transport is not trivial and definitely worth studying. We consider two major components of the demand: different quality elements of urban transport such as comfortability from physical or mental point of view, waiting and travel time, etc.; and price elements such as ticket prices or provided discounts.
Quality element impacts have been studied by many researchers previously. Duleba and Moslem conducted a survey in Mersin about different stakeholder group preferences on the amelioration of the urban bus system quality items [
1]. Perlaviciute et al. emphasized the different emotional responses in the demand of a public service [
2], while De Luca stressed the importance of quality elements in urban transport planning [
3]. Shafabakhsh et al. listed quality issues for an appropriate public transport system to reach an international airport [
4]. Abbaspour et al. investigated the impact of noise pollution in urban areas and the change of citizen demand reacting towards this [
5].
The connection between transport fares and public demand is somewhat contradictory. Although the expected negative correlation (higher fares—lower public transport demand and vice versa) has been proven many times [
6,
7,
8,
9] and not only for low income citizens but also for the higher social class, there are also counterexamples. Brechan found that price reduction in an urban transport case did not make significant impact on public vehicle utilization [
10].
Recently, experiments on totally free public transportation in some cities has raised the attention of researchers and the public [
11,
12].
As can be seen in the short overview, the connection of demand elements and public mode choice and through this, sustainability issues, is not evident and contradictory in some cases. Consequently, it is definitely worth analyzing the specific situation before making such a significant decision as improving the quality of public transport service or modifying the transport fare system of a city (or even of a country). This decision requires support by a thorough survey on citizens’ preferences and processing the results with a scientifically well-proven methodology.
The objective of this paper is to introduce a well-applicable model based on a multi-criteria decision making (MCDM) method, the Analytic Hierarchy Process (AHP). Survey results are also provided on the current public transport demand situation of the capital of Jordan, Amman. It has to be emphasized that this is a pioneer study in terms of pairwise comparison of quality and cost elements in a public transport system case in an integrated AHP survey. Being the first experimental attempt to apply AHP for this purpose, the conventional form of the technique was selected as the methodology because of the reliability of its original tools: the Consistency Ratio (CR) and the sensitivity analysis. The authors of the current paper have previously used more current forms of AHP such as Fuzzy, Interval, Pareto types of AHP, or its combination with Kendall rank correlation [
1,
13,
14,
15,
16], however, in this first exploratory case the traditional approach seemed more reliable. The experience of the case study allows us to state that the constructed model is appropriate for supporting public transport system improvement decisions and might be applicable for other, arbitrary cities as well.
The rest of the paper includes a Methodology section in which the applied model is presented. Afterwards the characteristics of the survey and the results are analyzed. Finally, conclusions are drawn and some suggestions are given for the general application of the methodology and some remarks for further research are provided.
2. Literature Review
Urban transport pricing is one of the significant factors influencing the supply quality of public transport. In particular, in emerging cities with low incomes and low car-dependency rates, public transport plays a vital role in providing access for citizens to desired destinations, such as jobs, education, and health care. Moreover, urban transport fares severely influence not only citizens’ quality of life and travel options, but also the air quality.
Zhang et al. aimed in their study to enumerate the public transport fee, changing the impact on passengers’ satisfaction. However, the obtained results showed the inefficiency of recovering passenger satisfaction after a short time of the new fare policy and passengers’ negative points of view toward the increase did not reduce the utilization of the service in a long term. Moreover, the high negative impact was significant in the first month after the fare increase through a slight decrease in service utilization, while after four months the utilization level rebounded back and ended up almost in the same level before changing the fare policy. Predominantly, the new fare policy did not impact the public transport utilization long term [
17].
The findings of several studies demonstrated that not only the lower income citizens are significantly affected by the urban transport fare increases, but also the high income citizens, which might cause harsh damage of the environment [
6,
8,
9]. For instance, more potential passengers would be attracted to get their own car in the case of more expensive public transportation.
Yang and Tang explored the influence of the urban transport fare on the environment and they found that the urban transport fare increase negatively affected the air quality in the short term because of the immediate change of fare. However, they increased the sophistication of their results by making distinction between short and long term impacts; they found that the growth of fares had an immediate reaction by the public decreasing their public travels, thus causing more air pollution but in the long term this effect disappeared and public trips increased again [
18]. Other studies have proven however, that the fare increase tends to cause the citizens to use private transportation modes even in the long term; and by that, the total vehicle usage grows significantly which has a negative impact on the environment by the higher CO
2 emissions [
19]. Vice versa, when the citizens change their travel mode from private vehicles to public transportation, the amount of CO
2 emissions decreases by default, because of the previously stated reason [
20].
In some small EU cities, free fare public transport exists like Hasselt, Belgium, and Templin, Germany, however, Cats et al. evaluated the fare free of public transportation system in Tallinn, Estonia. The outcomes, unsurprisingly, showed that the free fare system achieved an increase in passenger numbers in all cities [
12,
21].
Thøgersen investigated whether the free urban transport can attract more users and he found that the free public transport service motivated more citizens to use public transport and the increase of usage was quite significant [
11]. Additionally, Hess found out that free urban transport was efficient in attracting large numbers of new urban transport users or shifting drivers to utilize urban transport [
12]. Moreover, Miller and Savage pointed out that the urban transport user numbers diminished noticeably after fare pricing increased [
7]. However, Brechan found that use of public transport was not significantly raised after changing the urban transport fare, but the citizens appreciated the lower fares in general [
10].
Another example is the Australian government, which endeavored to enhance the utilization of urban transport by providing a new fare system, which efficiently influenced the quality of life and environment quality, and to provide sustainable and functional cities. The system boosted the passenger numbers by reducing the fare cost which could then result in overall revenue gain [
22].
By applying the fare free systems those jobs which have been dealing with collecting and checking the fare payments in the transport companies (ticket controllers, ticket sellers) are deliberated, and this free human capacity can be used for other operations of the public transport system [
23]. However, in big cities, the fare free system has significant limitations, because the public transport system becomes, in a short period of time, overburdened and it increases the operation and maintenances cost [
24]. Obviously, the transport company and local government lose the revenue from ticket selling by creating a free public transport system, consequently a thorough cost benefit analysis is necessary for all specific cases before this implementation.
Based on previous research results it can be stated that even the citizens’ social relations will be reduced when the urban transport service is unaffordable [
25]. Furthermore, in many countries there are some people using a public transport service without paying for it and some of them produce an illegal ticket facsimile. There are several reasons for that, however, the main reason is the high price of the tickets, especially in some EU countries like Austria, Germany, and Switzerland, which in turn affects the local economy and the sustainability of the cities [
26]. There are several studies that evaluated the public transport where the price was fixed and the main issue was improving the supply quality of the urban transport system [
13,
14,
15,
16].
The other important aspect for public transportation is reducing the real damage to the environment. Qin and Zhang investigated the impact of a public transport subsidy on the greenhouse gas (GHG) emissions, and they realized that optimal public transport subsides reduce GHG emissions, which almost achieved the social desired level [
27]. However, Park et al. highlighted the GHG emissions influence climate change by increasing the air pollution [
28]. Chen and Deng proposed a new model based on AHP and Dempster–Shafer evidence theory (D-S theory) for estimating the impact of transport measures on the examined city from an environmental point of view [
29].
In the following, an integrated AHP model is shown for surveying passenger demand including both quality and cost considerations. Pricing and service quality elements are considered as decision making attributes for passenger survey participants and these attributes are compared, pairwise, from the aspect of the necessity of their improvement.
3. Methodology
Analytic Hierarchy Process (AHP) is a technique organizing complex decisions, based on a mathematic structural approach. The AHP, as one of the multi criteria decision making methods, was introduced by Prof. Thomas L. Saaty. The technique is a popular functional method in decision-making methodology because it has a friendly user approach and it can be implemented easily [
30]. This approach is applied to derive ratio scales from pairwise comparisons and the input can be obtained from actual measurements, for example, weight, price, etc., or from subjective opinions such as preference and perceived satisfaction [
31]. The process allows small, tolerable inconsistencies in judgment with the ratio scales being derived from the principal eigenvectors whereas the consistency index is achieved from the principal eigenvalue [
32]. Measuring the customer satisfaction level is needed in any public transportation project, because the attitude of the target user group determines the public demand. Thus, the objective of the current research was to determine and analyze the customer preferences of the public transport system development in order to help the decision makers in deciding the appropriate implications to create a more sustainable system. This objective might be completed by a hierarchical decision support model applying the AHP approach.
Accordingly, Analytic Hierarch Process was chosen for the recent research among the multi criteria decision techniques because of the nature of the decision problem to be solved. To provide the evaluators with a clear overview and following the AHP procedure a hierarchical structure of the transport demand elements was made to present the criteria and sub-criteria of the decision. Since the simultaneous examination of quality and cost type elements in an integrated multi-criteria AHP model is rare in the scientific literature, the procedure is introduced in detail, highlighting the steps in which the two different type of attributes are pairwise compared.
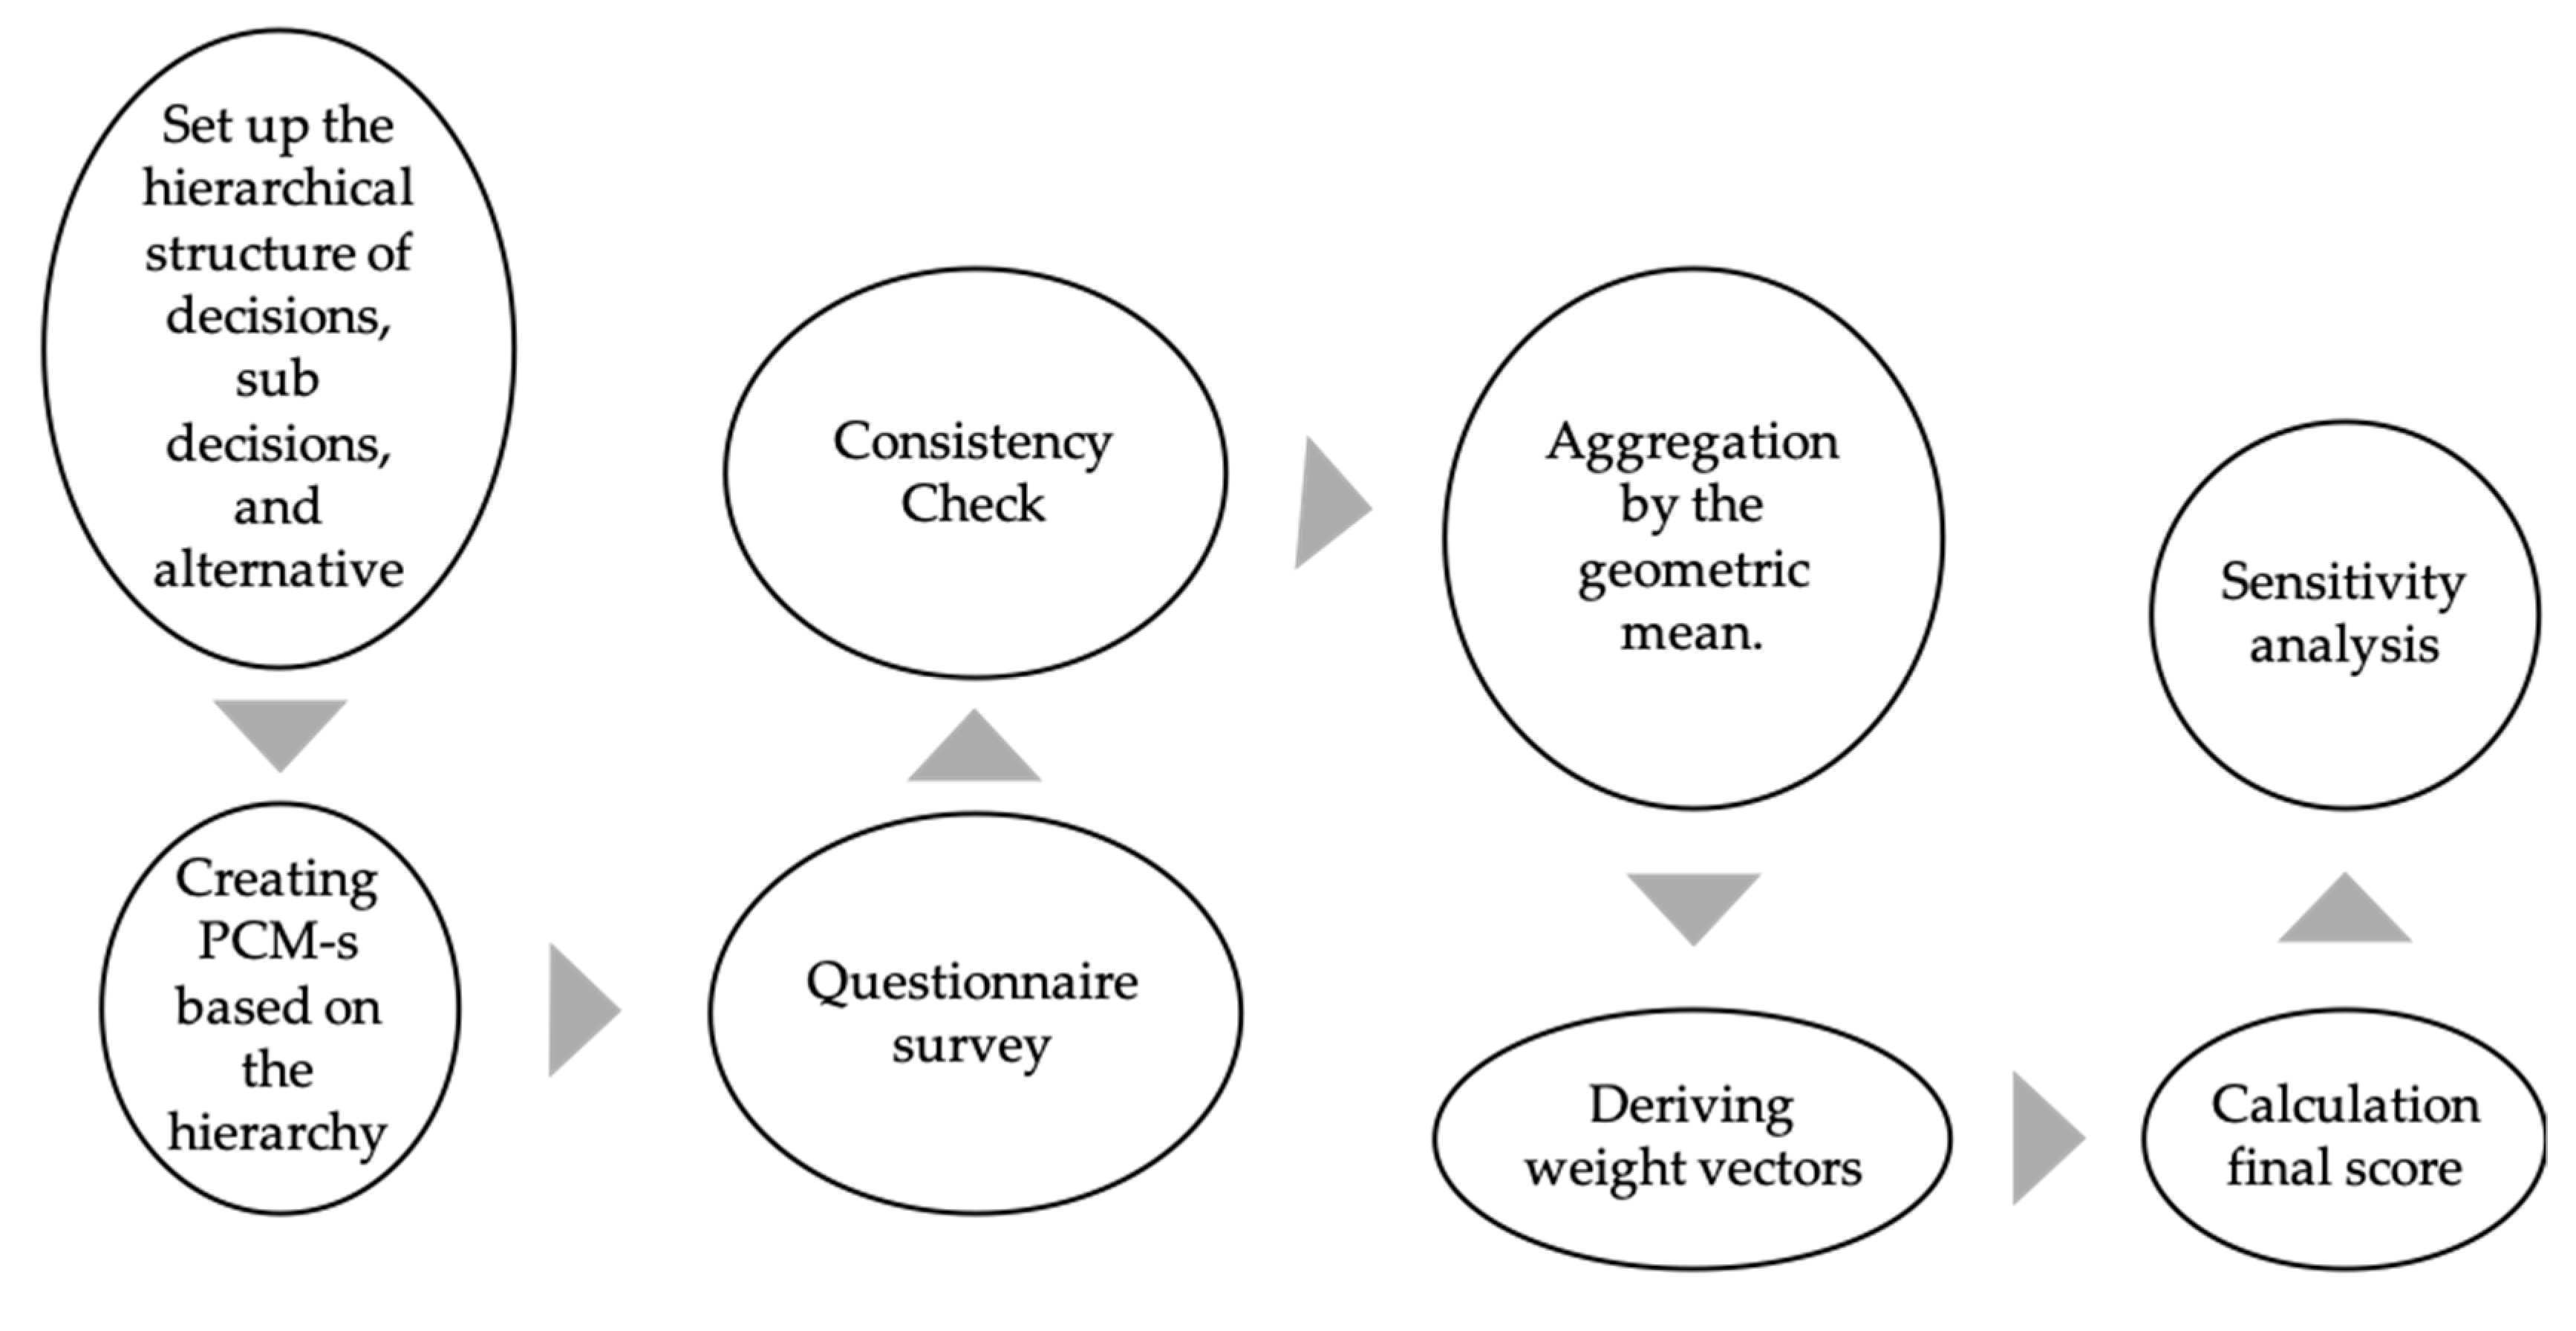
The Analytic Hierarchy Procedure consists of the following steps:
Defining the problem.
Defining the objectives of the problem or consideration of all actors, objectives, and its outcome.
Determination of the criteria (both quality and cost) for evaluation
Structuring the problem in a hierarchy of different levels constituting goal, criteria, sub-criteria, and alternatives. Note that the quality and cost type attributes should not necessarily be separated to different levels.
Comparing each element in the corresponding level and calibrating them on the 1–9 Saaty scale [
33] (see
Table 1).
Performing calculations to find the maximum eigenvalue, consistency index (CI), and consistency ratio (CR).
If the CI and CR are satisfactory, the decision is taken based on the normalized values; otherwise, the procedure is repeated until these values lie in a desired range.
The matrix A is considered consistent if all of its elements are positive, transitive, and reciprocal as:
For consistent pairwise comparison matrices (PCM-s), the Perron theorem stands:
The dominant eigenvector of such PCM is trivial to be determined by Saaty’s eigenvector method [
33]: if
A is a consistent matrix, then the eigenvector
w can be calculated by finding its maximum eigenvalue
While in AHP, decision makers most likely do not evaluate PCM-s consistently (for the evaluation, the Saaty scale is recommended, see
Table 1) the eigenvector method can be used provided a consistency check has been conducted for the evaluations. Thus, for AHP applications the eigenvector method can be used for deriving the weight scores of the decision elements, however only in those cases in which the pairwise evaluations meet the inconsistency tolerance, measured by the Consistency Ratio. Note that the criterion of consistency must refer to both quality and cost type of attributes. Consequently, during the AHP process the consistency of answers must be examined by Saaty’s Consistency Index (CI) and Consistency Ratio (CR) [
23,
24,
25]:
where
CI is the consistency index, _
max is the maximum eigenvalue of the PCM, and
n is the number of rows in the matrix.
CR can be determined by:
RI is the random consistency index as demonstrated in
Table 2. The threshold was also determined by Saaty, if CR is below 0.1 (CR < 0.1), the PCM can be considered as acceptable from inconsistency point of view. Since most of the AHP applications involve several evaluators, the individual scores have to be aggregated, and avoiding rank reversal, the calculation of the geometric mean [
31] of the respective evaluator scores is recommended for determining the aggregate results. If “
h” evaluators exist in the procedure,
where
denotes entries, in the same matrix position
of pairwise comparison matrices, filled in by the
decision maker. Having gained the aggregated matrices, calculating final weight vector scores considering hierarchical linkages within the decision is the next step in the procedure. It should be noted that the quality and also cost attributes must be considered as part of the hierarchy so their position in the hierarchy is a key point. As consistency has been acceptable, the final score determination can be applied as:
where
and
(
) represent the related weight coordinate from the previous level;
is the eigenvector computed from the matrix in the current level,
is the calculated weight score of current level’s elements. Sensitivity analysis enables understanding of the effects of changes in the main criteria on the sub criteria ranking and help the decision maker to check the robustness throughout the process.
The steps of conducting AHP are clearly presented in
Figure 1.
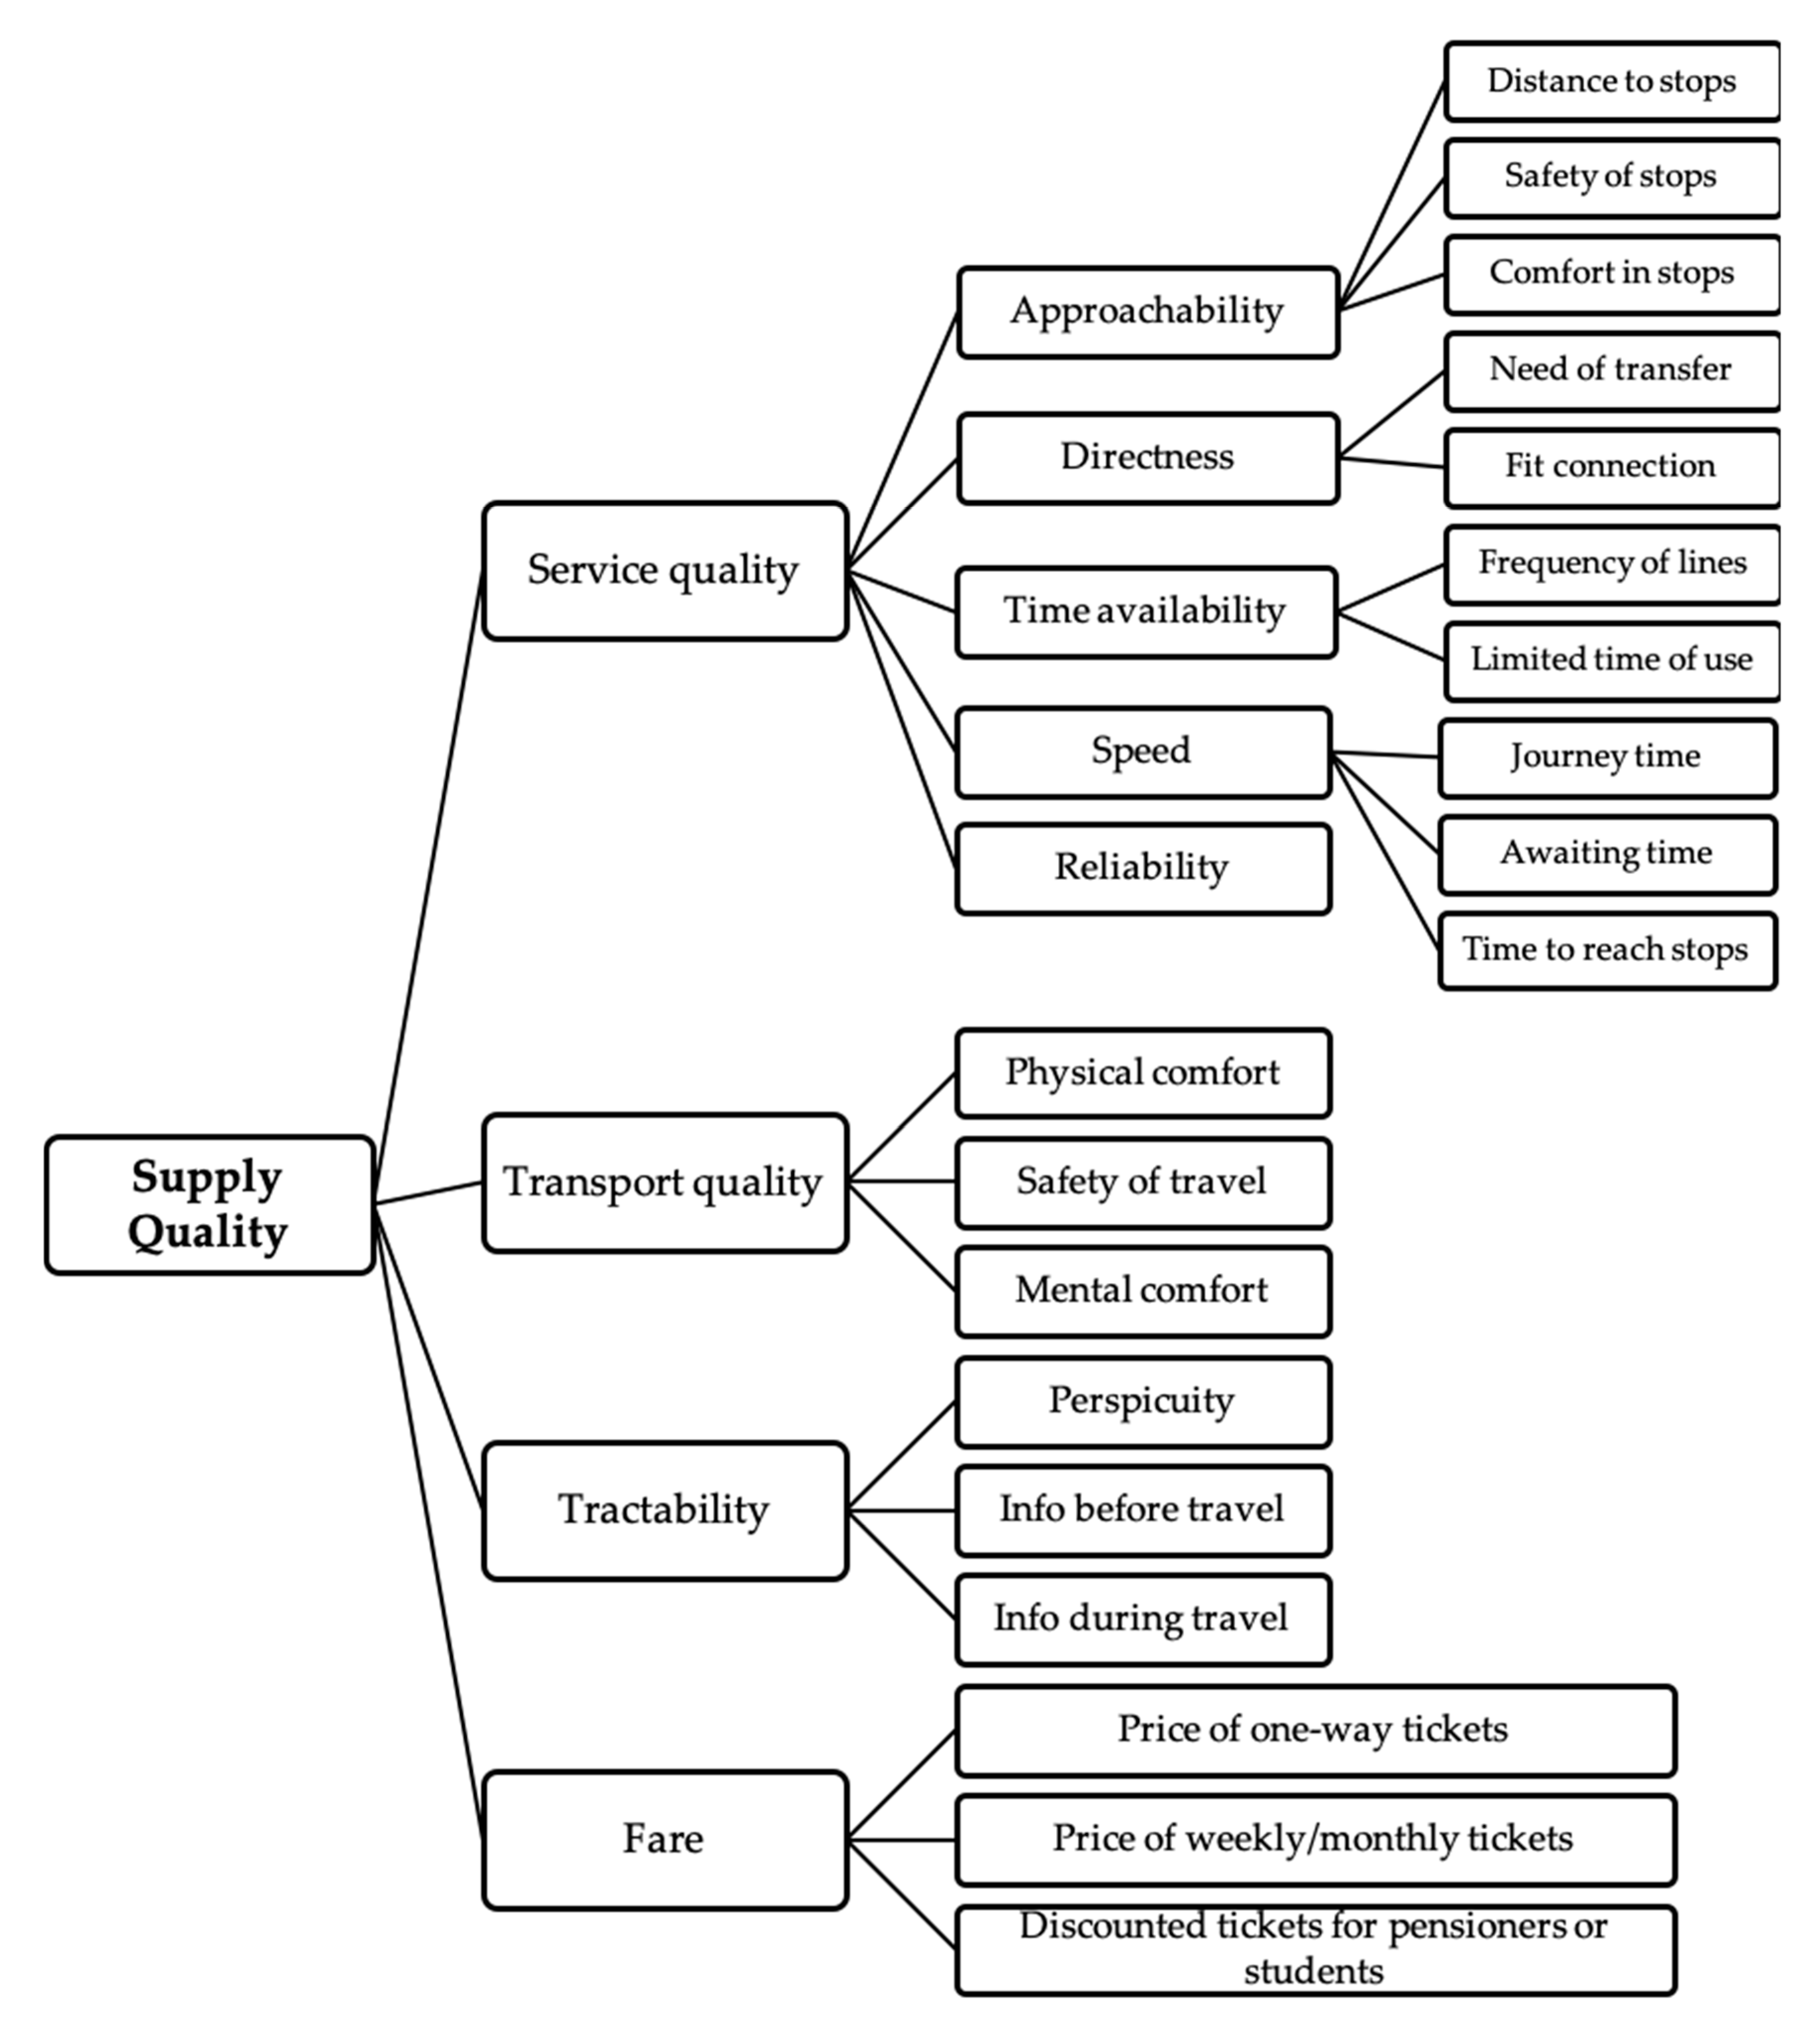
In the current research, a new hierarchal structure model (
Figure 2) was constructed and implemented in order to support the public bus transportation in Amman, Jordan. This is the first model in public transportation multi-criteria decision making where quality and cost issues are pairwise compared. As shown in
Figure 2, the first level is more general, the second level is detailed, and the third one is more detailed and specific so the data can be increased essentially on a wide range of components in a complete manner, keeping the hierarchy. The supply quality elements were chosen to cover the qualitative factor such as perspicuity of timetable or safety of travel, as well as quantitative factors such as fare, awaiting time, and frequency of lines. The transport quality, tractability, fare, and service quality are the four main criteria to evaluate the supply quality service in the network. The transport quality refers to the time spent on the bus, tractability refers to providing sufficient and comprehensive information before and during the journey, fare refers to price of tickets for a one way journey, price of tickets for the whole trip, and special prices for students and pensioners, while service demonstrate and describe the pre and post service elements. In this paper the passenger group was targeted only because this group represents the demand of public transport and their preferences and attitude constitute the transport demand itself. Due to the nature of the applied AHP technique, pairwise comparisons had to be completed which not only ensured a clear overlook of the supply quality elements for the citizen participants but also provided consistency in the evaluation process which is a real benefit in passenger surveys.
Figure 2 demonstrates the public transport supply quality elements constructed based on the literature review and previous research results of the authors [
1]. However, this specific structure is one of the novelties of the paper, since the integrated approach of quality and financial elements has not been applied so far for public transport decision making. Note that the dominant connections of the decision elements are hierarchical, and there are very few dependencies among the attributes (e.g., the frequency of lines might affect the awaiting time). Although some non-hierarchical correlations might be detected, the basic hierarchical structure made it possible to apply AHP and avoid the Analytic Network Process (ANP) [
34], which most likely cannot be applied for passenger surveys due to the enormous number of pairwise comparisons. As the figure demonstrates, one 4 × 4 PCM was created for the first level, one 5 × 5 and three 3 × 3 PCM-s for the second level, and two 3 × 3 PCM and two 2 × 2 matrices for the third level. The rules of AHP methodology were followed in constructing the questionnaire. For the first level the following questions were asked: Compare the importance of improvement for the service quality and transport quality elements, and so forth for all possible pairs. Additionally, for the second and third level, the same procedure was followed.
Table 3 demonstrates the criteria definitions and explanation that were used in the site survey to clarify each term and symbols for the participant citizens to have more understating, as being layman evaluators.
4. Results
The main characteristics of the conducted survey based on the hierarchical model were the following:
100 evaluators have contributed to the survey from different ages and social layers. The number of participants evidently is not statically representative, however, the MCDM provides a deeper insight based on pairwise comparisons than a simple statistical survey [
33].
A random selection of the travelers was done near by the bus stations in Amman, Jordan. Despite the random selection, the proportion of age and genders reflected the characteristics of the total of the city and the potential user’s public transportation in Amman, Jordan.
The survey was done and collected between February and April 2018 and analyzed in May 2018.
The consistent ratio (CR) for all matrices in the group was less than 0.1, accordingly it was acceptable to complete the AHP analysis procedure proposed by Saaty [
33].
Table 4,
Table 5 and
Table 6 demonstrate the priority order for the public bus transportation system elements.
In the survey, transport quality referred to the time spent in the vehicle by passengers and consisted of elements such as mental and physical comfort in the vehicle during the journey or the safety on board. Consequently, passenger evaluators established that the most critical part of the system is the service during their journey in the vehicle and not the other circumstances (before or after) of the travel.
Passenger evaluators indicated in the first level that the development of “Transport Quality C2” is the element that needs to be improved the most as presented in
Table 3, however, there were differences of preferences in the second and third rank, in which passenger side ranked “Service Quality C1” was the second most important issue, followed by “Fare C4” and in the last stage was “Tractability C3”.
It is also noticeable that transport or service quality gained greater significance compared to the other two general elements, thus, all initiations of the local municipality should focus on improving these two general items in the first stage.
For level 2, the passengers evaluated the “Safety of travel C23” as the most important issue to be improved and after that they highlighted the “Discounted tickets (C43)” to be improved as shown in
Table 5; accordingly, it can be concluded that to increase the demand on the public bus and make it sustainable the passengers priorities have to be considered.
The element “Discounted tickets (C43)” gained the second most important position out of the 14 criteria in this level even though its respective upper level element “fare” gained only low weight, and in the calculation the role of the related upper level item is large (see Equation (7)).
The element “Info before travel (C32)” gained the third position, while the “info during travel C33” gained the 11th position, although they both belong to “tractability C3”, so it is noticeable that in this case most of the passengers are familiar with the bus stop names and places, simultaneously the same passengers are suffering from the lack of the information before starting the journey, for example they require to be informed about time schedule changing, or route changing.
In the level 3, as can be seen in
Table 5, “frequency of lines” was the top priority for the passengers followed by “Fit connection” which means that the decision makers have to consider these elements when they improve the public bus system and network to raise the sustainability of urban transport.
The element “Frequency of lines (C131)” gained the most important position out of the 10 criteria in this level even though its respective upper level element “Time availability (C13)” gained only low weight, and in the calculation, the role of the related upper level item is small (see Equation (7)). Consequently, the passengers are demanding greater frequency of the buses more than the existing state of the transport operation.
The element “Fit connection (C122)” gained the second most important position out of the 10 criteria in this level even though its respective upper level element “Directness (C12)” gained only low weight, and in the calculation the role of the related upper level item is small (see Equation (7)), consequently, the passengers are seeking many more organized routes and requiring the reduced waiting time in changing bus lines.
Accordingly, passengers considered the “safety of travel” in the level 2 as one of the most important criteria to be improved due to the lack of monitoring for the driver behavior, in some cases the drivers do not follow the spot speed. The discounted tickets criteria have the second priority to be improved as this does not exist in the current public transport system. Consequently, Amman Municipality are working to improve the public transportation system in the city, for instance new buses were deployed recently to improve the public transport system and the new buses have a good surveillance system to enhance the safety of travel, and also the municipality are working on different projects to improve the whole public system.
In the level 3 the passengers evaluated the frequency of lines as the number one criteria to be improved where the new deployed buses have increased frequency, and a more organized system than the old system. Based on that, there are common points between passengers and the municipality, that the municipality is working to improve.
Sensitivity Analysis
A sensitivity test was applied for all levels. In level 1, the score of “Transport Quality” criterion was modified from 0.335 to 0.35. Certainly, the scores of the other criterion in this level were adjusted in order to keep the value one for the total sum of the weight scores, respectively, the score of the lower level elements changed accordingly (as Equation (7) indicates). In the sensitivity analysis, the first ranking level was retained and the change in ranking was examined, based on previous and ongoing public transportation projects in the city, this implication might cause a change in the priorities of the passengers.
Public transportation projects have been launched recently by the greater Amman Municipality to improve the supply quality of the service such as the Amman Bus rapid transit (BRT) project, which is going to be the city’s initial bus public transit system, within which premium, high-capacity buses run on exclusive and utterly separate lanes. The system can embody the development and style of stops, stations, traveler data, and vehicle specifications. In Amman in the busiest corridors the frequency of the buses will be increased to 3 min of the buses running. The BRT corridors in the capital of Jordan are integrated into the public transport network. One of the ambitious objectives of the project is to create direct BRT lines for the users from their origin to destination. As a pre-condition, an in-depth network of feeder services is being designed together with the BRT. Feeders can largely be buses but also may additionally embody smaller vehicles. The feeders will transport from their destinations to the closest BRT stop, thus can conjointly give a high-quality and frequent service which will probably increase the transport, and service quality satisfaction [
35]. Therefore, weighting and ranking in the first level might be changed in the future; in the sensitivity analysis this possible change was followed.
Having examined several options of small modifications in weight scores and their impact on ranking, it was found that a little increase of the weight “Transport Quality” (and parallel a small decrease of Service Quality) as shown in
Table 7, caused the most significant rank change in the results. Interestingly, this change indicated the high importance of discounted tickets which was among the objectives of the research to examine fare considerations in the system. Even though the change of scores is very minor in the first level, the “Safety of travel” attribute fell by five positions for this minor change and “Discounted tickets” kept or even improved its ranking. Thus, level 2 was found to be sensitive, as shown in
Table 8.
The element “Safety of travel” gained merely the sixth rank with only a slight modification of the respective first level attribute, the “Transport quality”. Based on this, the element “Discounted tickets” can be considered as most important, being more stable than the originally prioritized “Safety of travel”.
As can be seen in
Table 7, the other attributes proved to be stable in rankings.
Table 9 demonstrates the slight change in level 3 after the sensitivity test, and it can be seen that the attribute “Comfort of stops“ gained one position and was ranked 5th instead of the 6th position, while the attribute “Time to reach stops“ lost one position simultaneously, therefore, level 3 is considered more stable than level 2.
5. Conclusions
This paper aimed to introduce a new approach of determining public transport demand by a multi-criteria decision making (MCDM) model which integrates the supply quality and fare attributes related to the local public bus transport system. Since this was a pioneer study which integrates quality and cost type attributes, the conventional for of AHP was selected as the methodology. The application of the model verified the assumption that valuable information can be acquired by an AHP survey targeting the preferences of citizens towards the improvement of the current public transport system. The results proved to be realistic, reflecting the real needs of users and providing deeper insights into passenger satisfaction than conventional transport surveys.
Since public transport system modifications such as increasing or decreasing fares or ameliorating certain elements of the system, e.g., purchasing new buses, are generally top-down decisions, the new approach provides new information from the real user side, which might be an asset for the decision makers.
The introduced general model can be suitable for surveying different stakeholder groups, in arbitrary sized cities applying small or large samples. However, it has to be noted that due to the several pairwise comparisons, the survey procedure is quite demanding and requires a lot of time and effort from the evaluators, so gathering responses from several passenger respondents might be problematic. This is a disadvantage of the current model, thus, for a bigger sample, another methodology might be more suitable than the demonstrated AHP technique and questionnaire. Additionally, more recent forms of AHP exist in the scientific literature e.g., fuzzy models, combined models with other MCDM techniques such as TOPSIS, Machine Learning, ELECTREE, and after this first study, the methodology might be more sophisticated. As another remark for further research, the combination of this model with the other large group of demand determination models, the Discrete Choice Modelling techniques might result in an even more reliable analysis of public transport demand.


