1. Introduction
Many factors affect a student’s academic performance. Student achievement depends on teachers, education programs, learning environment, study hours, academic infrastructure, institutional climate, and financial issues [
1,
2]. Another extremely important factor is the learner’s behavior. H.K. Ning and K. Downing believe that major constructs of study behavior, including study skills, study attitude, and motivation, to have strong interaction with students’ learning results. Students’ perceptions of the teaching and learning environments influence their study behavior [
3]. This means if teachers can grasp the bad attitudes of students, they can make more reasonable adjustments to change the learning environment for the students. To conclude whether good or bad behavior for a particular student is not an easy problem to solve, it must be identified by the teacher who has worked directly in the real environment. The teacher can track student behavior by observing and questioning them in the classroom. This process is not difficult in a classroom that has few students, but it is a big challenge for a classroom with a large number of students. It is valuable to develop an effective tool that can help teachers and other roles to collect data of student behavior accurately without spending too much human effort, which could assist them in developing strategies to support the learners. In this way, the students’ performances could be increased.
1.1. Background
Many researchers have commented on the behaviors that influence students’ performances. Arnold L. Glass and Mengxue Kang have pointed out that students who are distracted by watching videos, playing games, or texting while taking lecture notes on digital devices are far more likely to have their long-term memory affected. In this manner, the students perform more poorly in exams, even if short-term memory is not impacted [
4]. People like to think they can multitask. But this is a myth. What people are doing when they say they are multitasking is constant task switching. Although switching costs may be relatively small, sometimes just a few tenths of a second per switch, they can add up to significant amounts when people repeatedly switch back and forth between tasks [
5]. When we switch from one task to another task, the brain cannot continue and keep up with everything that it has just done. Therefore, there will be a delay as one’s attention moves from one task to another. When the students pay more attention in class, there is a higher probability of better achievement, as stated in the book of Dorothy Piontkowski, Robert Calfee [
6]: “Shannon (1942) reported positive correlations between the degree of attentiveness as measured by Morrison’s cues and student achievement.” The evidence which shows that digital devices influence the attention of students in the classroom is shown in a study by Bernard McCoy [
7]. It showed “a belief among teachers that constant use of digital technology hampered their student’s attention spans and ability to persevere in the face of challenging tasks.” Additionally, a survey written in the study showed that 71% of teachers thought technology damaged students’ attention. And 64% people who took another survey said that technology did “more to distract students than to help them academically.” Bernard’s study also pointed out that students have also identified learning distractions caused by digital technology. Wei, Wang, and Klausner [
8] found out that texting during class partially affected a student’s ability to self-regulate his/her sustained attention to classroom learning. In an earlier study, Wei and Wang [
6] noted college a student’s ability to text and perform other tasks simultaneously during class might become a habit over time. Such habits may be defined as automatic behaviors triggered by minimum consciousness [
9].
To keep track of the actions/behaviors of students, two potential approaches can be taken: surveys and quizzes. However, these two approaches are inconvenient, and lack objectiveness, since the people might not remember what they did exactly. With the development of the computer vision field, the work of recording and analyzing students’ behaviors in the classroom in real-time is not an impossible thing at present. Il-Hyun Jo et al. believe that a systematic understanding of each learner’s educational needs is required, and they prepared customized instructional strategies and customized content by collecting, analyzing, and systematizing learners’ data [
10]. Today, academic analytics is one of the actions that can be captured with real-time data-reporting and predictive modeling, which helps suggest likely outcomes from familiar patterns of behavior. The faculty might soon be able to use these data on behaviors as guides for course redesign and as evidence for implementing new assessments and lines of communication between instructors and students [
11]. In particular, one of the possible reasons that make students do things other than pay attention to the lessons is poor lesson content during lecture time. Since then, from the data observed, the department of students might communicate to the lecturers to modify the content to be as suitable as possible for students. On the other hand, lecturers themselves redesign that content to let students interested in the lessons instead of neglecting them. Another action the faculty might intervene in is to directly communicate with students who have had negative attitudes during lecture time in recent days to detect the reasons why they have had those them. Our study aims to develop a software system based on computer vision to recognize students’ behavior in the classroom environment.
1.2. Existing Systems
There are several solutions for the proposed system such that the monitoring of students’ behaviors can be achieved to evaluate their studying performances. Assessing the progress of learners has been explored in an environment without digitally quantified inputs and their uninformative possibilities were calculated for the implementation [
12]. They developed a system that can monitor attention in the classroom during the lecture which can lead to two possible outcomes: a real-time reporting system or summary report. The main focus aspects are quantifying body motion and the estimation of eye-gaze direction. With eye-gaze direction, there can be three distinct directions: the teacher/slide, notebook/bench, and other directions. The motion metrics were tested by annotating the regions in which each student resides and measuring the amount of movement inside of it. The data was collected and ready for supervised machine-learning. However, in this paper, only assumptions and theories about the way to address students’ behaviors are deeply investigated. A doctoral thesis for the program in computing and communication [
13] showed the approaches to evaluate attention by metrics: motion, gaze estimation, and body-pose detection. For motion, differences in attention are manifested on the level of audience movement synchronization with the idea that attentive students would have a common behavior pattern. The relationship between head orientation and gaze direction was also studied. The combination of head detection and pose estimation was used to extract measures of audience head and gaze behavior. Meanwhile, the synchronization of student’s head orientation and teacher’s motion serves as a reliable indicator of the attentiveness of students. They showed that the behavior which can be used for the project is moving, but they needed to work around their assumption about the experiment. A data analysis module with the integration of computer vision technologies and machine learning algorithms to perform attendance taking was investigated to understand the students’ behaviors and students’ motion with minimum human intervention [
14].
The computer vision system uses cameras placed in a suitable location in the classroom as its data collector module; facial recognition and body-motion detection are applied to take attendance and behavior analysis. Haar cascade face detection is applied to detect faces, and Eigenface and Fisherface approaches. These approaches are used to train and recognize students’ faces. For body detection, the cascade classifier and histogram of oriented gradients (HOG) are used. There are four rules of body detection which are based on “face is detected,” “upper body is detected,” “full-body is detected.” Furthermore, they lead to performances: sitting and concentrating in classroom, sitting but not concentrating in classroom, and standing and ready to leave the classroom. Some specialized digital devices, such as Kinect from Microsoft, have been employed [
15] to utilize the capabilities of collecting behavioral data of multiple students. The students’ attention was evaluated by five human observers, who noted types of behavior from each student: writing, yawning, supporting head, leaning back, or gazing, and then found the attention level for each of the behavior; each behavior had a different range to evaluate the level of attention, and that was calculated by taking the mean of them. But there were some limitations: the ground truth data on attention, computed from human observer estimates, was not entirely reliable (need better evaluation of attention level); the training data was not large enough; and the Kinect sometimes detected incorrectly and produced erroneous results. In addition, the seven features computed from low-level Kinect data were not comprehensive enough to be able to describe all observed behavioral differences of the test persons (e.g., cannot detect writing). Recently, a school in Hangzhou, China, is using facial recognition to monitor the behavior of their students [
16]. The technology that classifies the students is generally based on their range of emotions—from antipathy to happiness (and a whole host of others). The system also cross-checks the faces of all students against the school database to mark the attendance and has the ability to predict if a student is feeling sick. Unfortunately, the results of most actions have not yet been published. However, this showed the possibility to use facial recognition technology to help and monitor students.
1.3. Contribution of This Paper
The major contribution of this paper was to develop a complete algorithmic process that addresses appropriate processing methods for an automatic system of monitoring student behavior. The system acts as a data collection and aggregation tool for decision making. There are many different types of behaviors of students in the classroom, as mentioned in the previous section; in this research, we focused on determining where the learner was observing across time. Our system was designed to surpass all the existing student behavior monitoring systems by evaluating and applying several computer vision techniques, such as face detection, facial landmark detection, face embedding, face classification, and gaze estimation. We implemented the algorithm for 3D position estimation. The combination of estimated locations and eye-gaze is a reliable assessment of the estimated user attention. It allows us to be able to respond in the real environment, where the layout of classrooms is different (special layout, large area, etc.) by using a combination of several cameras. Together with the combination algorithm, we used the inference ability based on the statistics of previous observations to enhance the accuracy of computer vision techniques. We also proposed a data summarization algorithm to combine and enhance the performance of these techniques.
As an additional contribution, a web application that supports the lecturers and academic staff has been developed. The web application can take part in the academic portal as part of the business intelligence module. Videos recorded during a student session will be processed, and then the system performs several computer vision techniques automatically. We visualized the analyzed data in the form of charts and slideshows on the web. Not only are the aggregation results included in the report, but the detail level of data can be accessed. Through this application, faculties not only assess the general situation of all students in the class but also grasp the details of the situation of each specific student to propose strategies to improve the quality of learning.
Finally, we evaluated our proposed algorithmic process to verify its performance. We conducted thorough scrutiny of every part of our system from facial recognition, to estimating the position of the learner in the classroom, and finally, the result of classifying the behavior of each student. This study also includes comparisons with other researches. Although the implementation conditions for each method are different, we tried to describe our systems as being adaptable to the actual environment. The remainder of the paper is organized as follows.
Section 2 describes system design and the implementation of the algorithms and its results are analyzed in
Section 3. Brief conclusions are finally discussed in
Section 4.
2. Proposed System
2.1. System Overview
The student behavior monitoring system is directly connected to the camera network and academic portal to retrieve the detailed schedule and reduce the scale of the student recognition, very similarly to Ngo et al. because their system also takes automatic attendance [
17]. It only retrieves data from these systems, and does not modify or interfere.
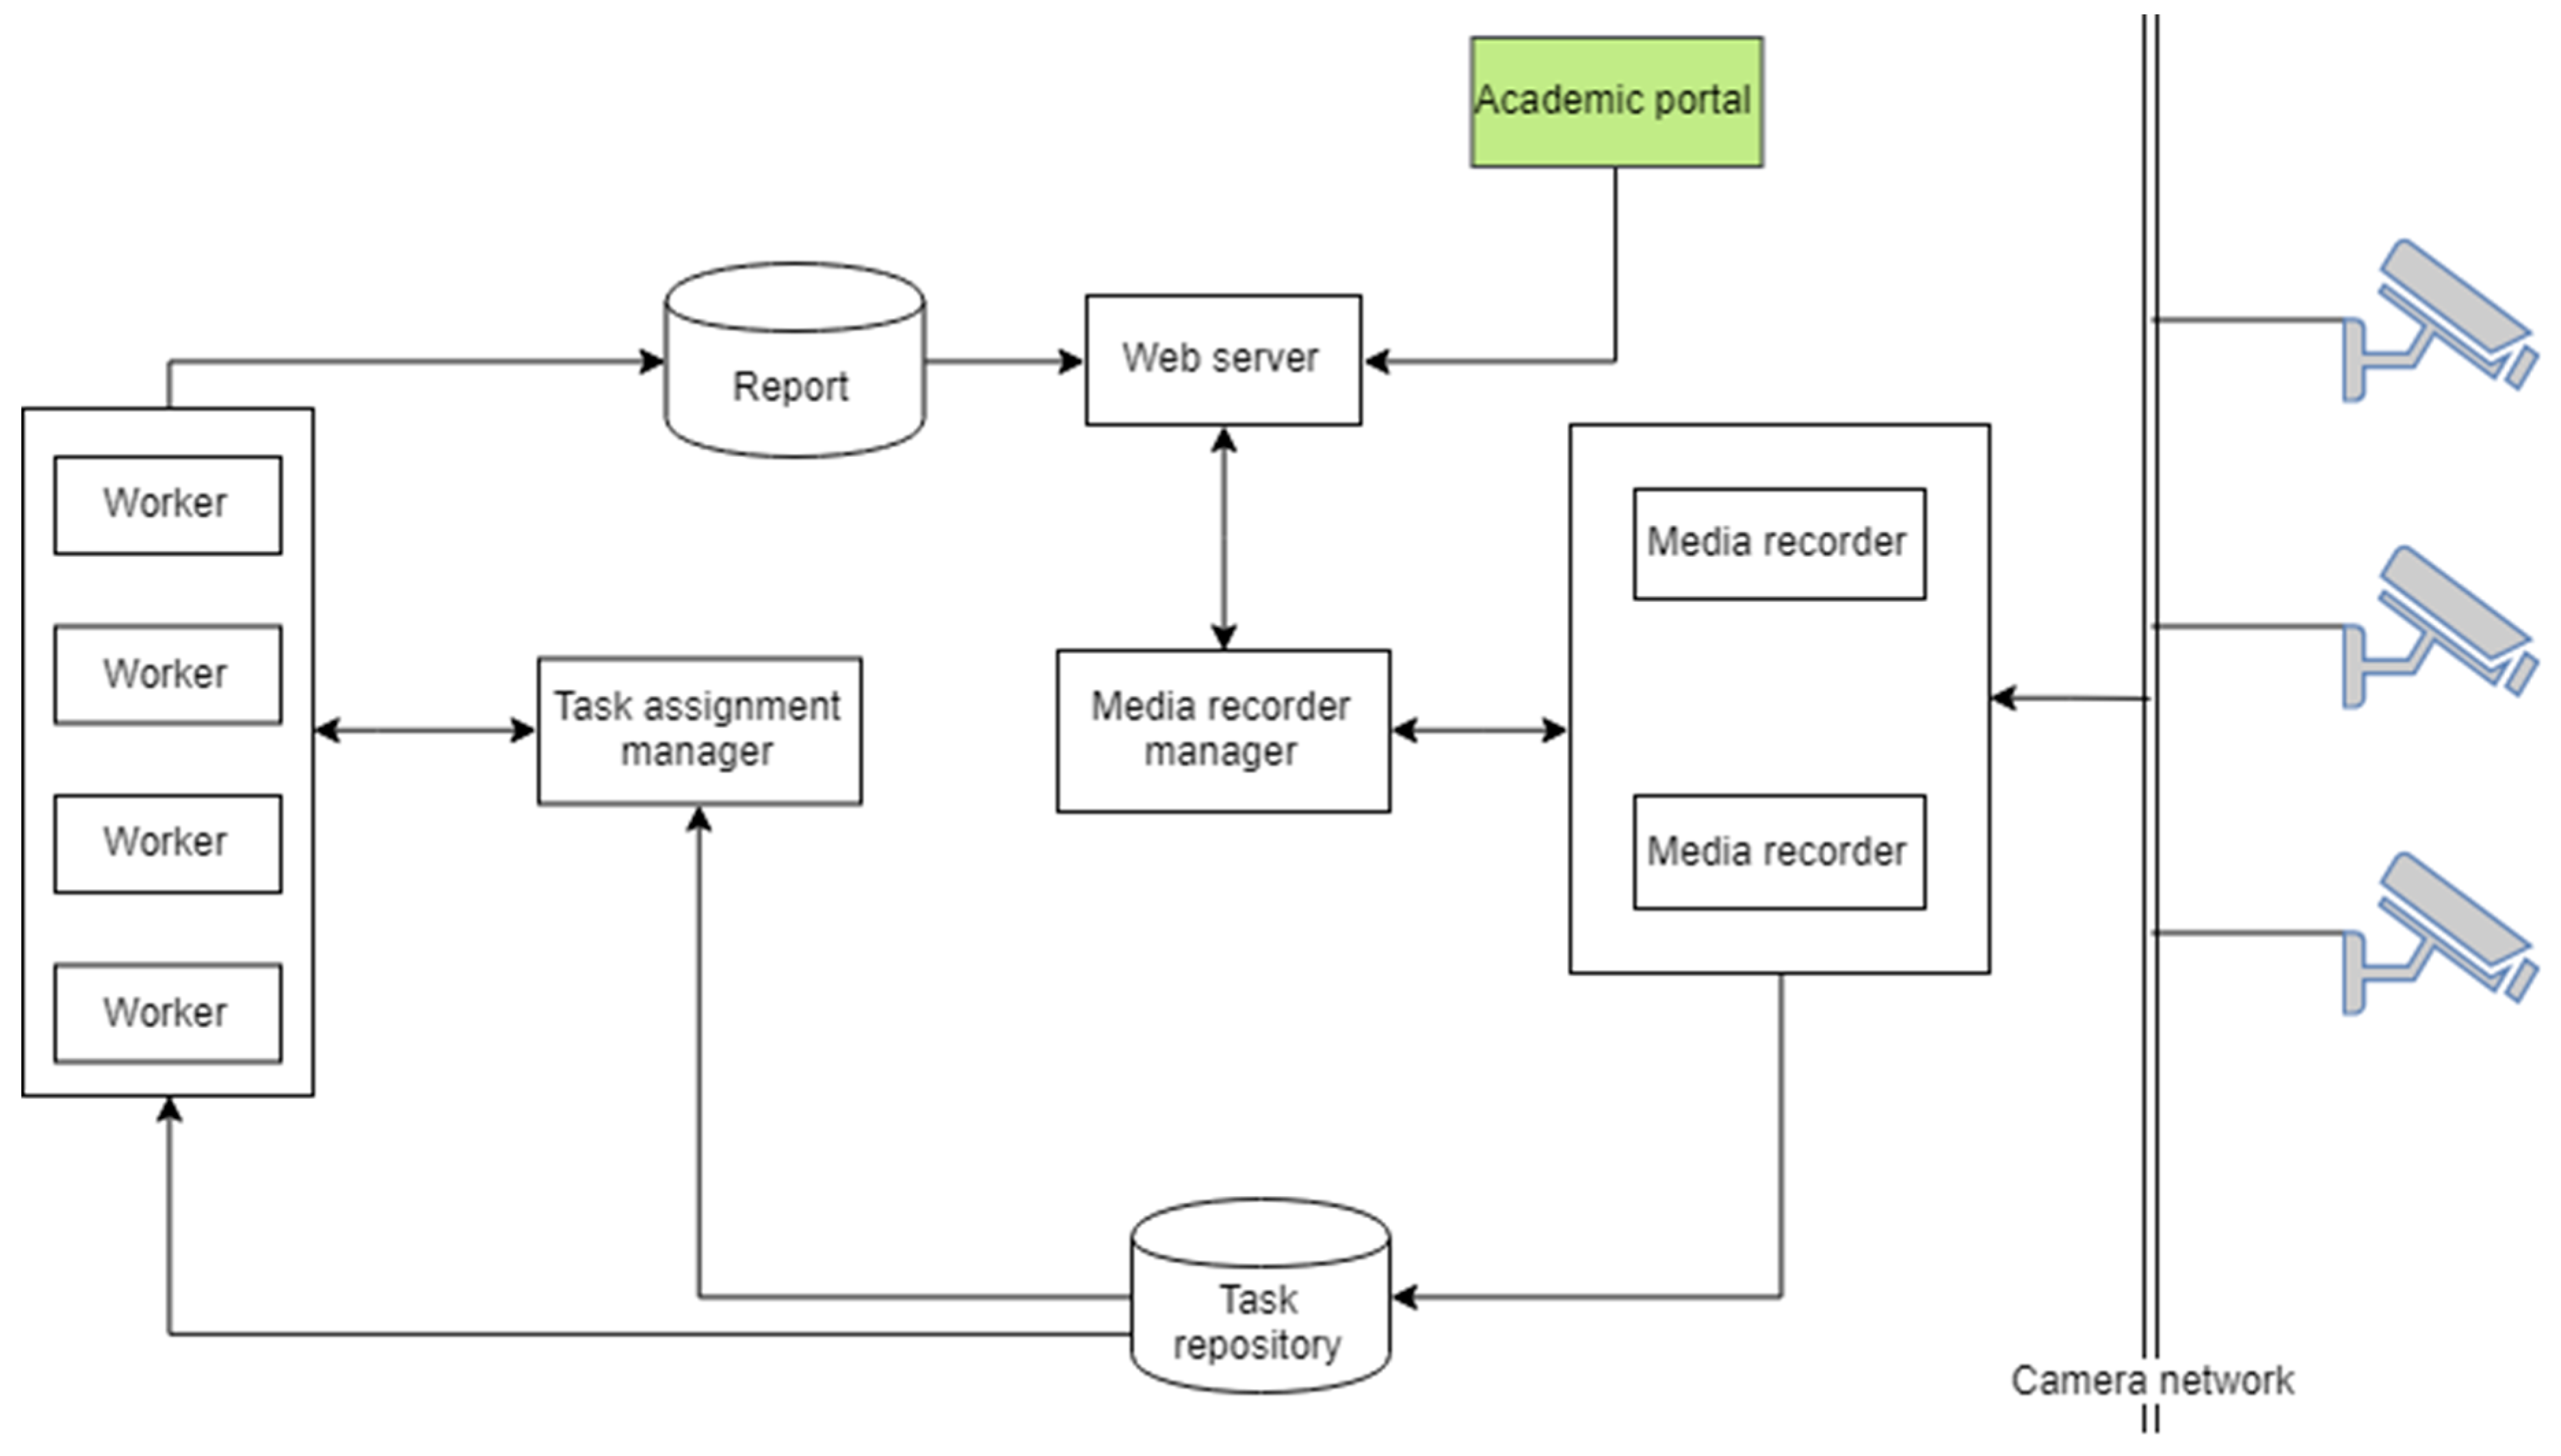
Figure 1 defines the simplified diagram of the system. It contains seven main components: recorder, recorder controller, task repository, task assignment manager, worker, report, and web server.
The recorder (or media recorder) is responsible for recording videos from the camera. The recorder controller plays the role of assigning the tasks of recording. That means assigning which recorder will record from which camera, since the video recording process is manual. Meanwhile, the signal to start/stop recording process is controlled in the webserver. The task repository is the repository to store the recorded videos and its metadata (class in the video, student list, camera configurations, etc.). The task assignment manager is responsible for automatically retrieving schedules and arranging tasks to the worker. The worker, which contains the data analysis module (or AI core), is to process given tasks assigned by the task assignment manager and write them to the report database as results. The web server visualizes data from the report database and controls the recording process.
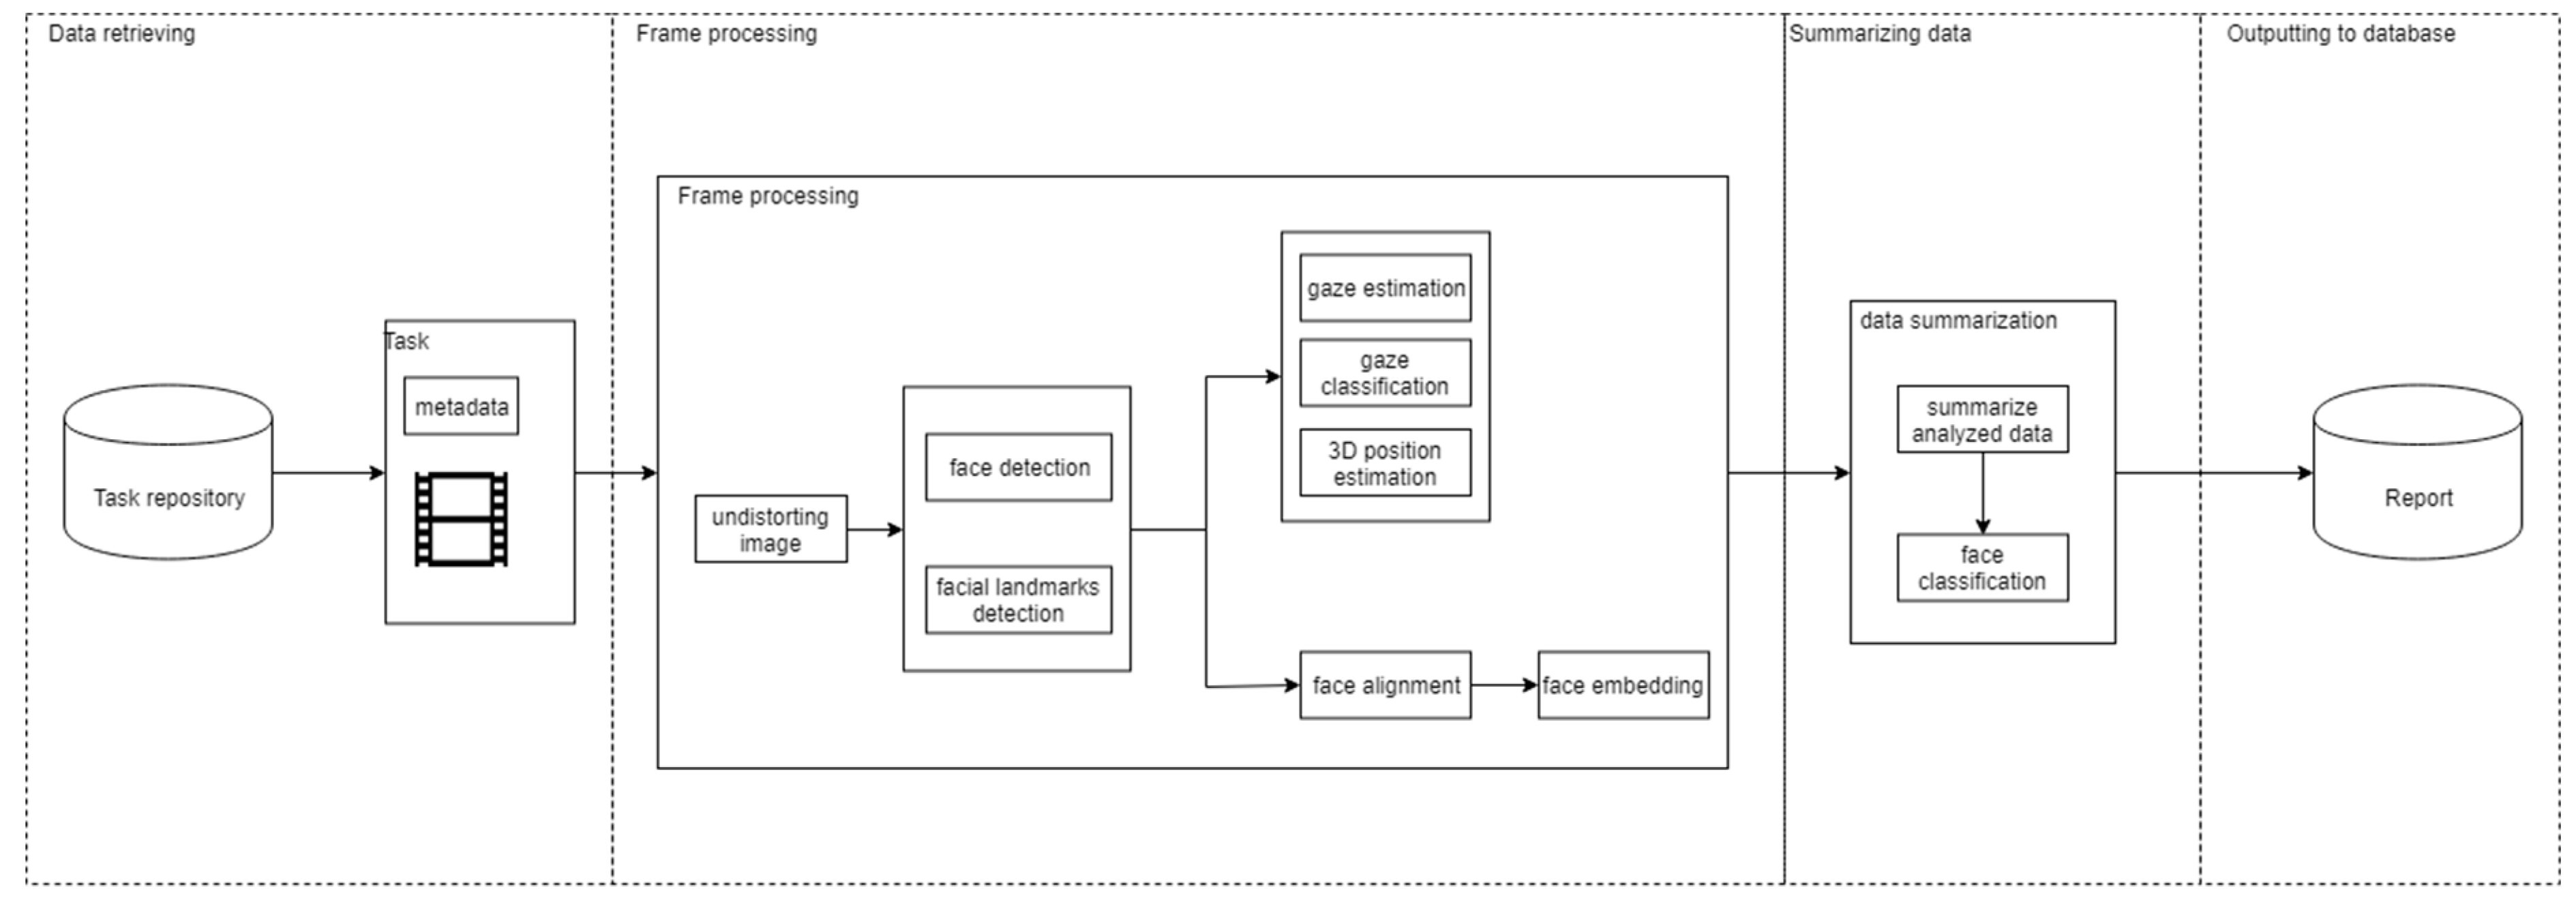
It can be seen that the soul of the system is the AI module which lies inside the module worker, which can be divided into four stages: data retrieving, frame processing, summarize, and output to the database, as shown in
Figure 2.
The data retrieving stage retrieves all task information (recorded video, student list, camera configurations, etc.) given by the task assignment manager. The video inside retrieves data and metadata is fed into the frame processing stage. The frame processing stage processes each video frame and outputs the facial bounding boxes, facial landmarks, face embedding using the video frame image only, gaze vector, gaze classification, and the 3D position estimation. Furthermore, these outputs are retrieved by using video frame image and camera configurations (position in 3D space, rotation vectors, etc.) which came from task’s metadata. The summarize stage is responsible for summarizing all data from stage 2 to write to a database. It contains two components: summarize analyzed data and face classification. The summarize analyzed data component is responsible for summarizing data from the previous stage. The face classification component uses the student list from the task’s metadata and facial data to do the final classification after data summarization is done. Finally, all the output from the previous stage is written to the database.
2.2. Face Detection and Face Alignment
Face detection is a process of detecting faces that appear in a given scene [
18]. It is an indispensable part of most of the identity authentication systems. Face detection is a branch of general object detection. General object detection is divided into two types [
19]: two stages and one stage object detection. General object detection can be used for a face detection task by training it on facial datasets. A two-stage detection algorithm divides the detection process into two steps: scan for interesting regions and classify these regions. There are some popular two-stage detection algorithms, such as R-CNN [
20], Fast R-CNN [
21], Faster R-CNN [
22], R-FCN [
23], and Mask R-CNN [
24]. There are also specified algorithms for face detection, such as MTCNN [
25]. Differing from two-stage detection, a one-stage detection algorithm directly maps the input image pixels to bounding box coordinates and class probabilities. Some recent one-stage detection algorithms are YOLO [
26], YOLOv2 [
27], YOLOv3 [
28], SSD [
29], RetinaNet [
30], SSH [
31] face detector, and RetinaFace [
32] face detector. The face alignment is responsible for detecting facial landmarks. There are some separate facial landmark detectors like OpenCV landmarks detector [
33] and DLib landmarks detector [
34], and built-in facial landmark detectors, such as those of MTCNN and RetinaFace.
2.3. Face Embedding and Recognition
Identifying a particular student allows the decision-maker to grasp the actual situation for each individual. Instead of just following the behavior of the whole class or unidentified individuals, each student’s profile is created.
Face embedding is the process of representing the facial image as a vector of numbers. Face embedding plays the role of feature extraction in the facial recognition system [
35]. Face embedding algorithms can be divided into three types based on their loss metrics:
Euclidean-distance-based metric.
Angular/Cosine-margin-based metric.
Softmax and its variants.
There are some popular, recently-developed face embedding algorithms, such as DeepFace [
36], FaceNet [
37], VGGFace [
38], SphereFace [
39], and the state-of-the-art ArcFace [
40] which scores 99.83% accuracy on Labeled Faces in the Wild Home (LFW) dataset. The next step of face embedding is face classification that is a part of the facial recognition system [
35]. A face classification algorithm takes the embedding vectors from face embedding algorithm in and outputs the ID classes (or identities) of given embedding vectors. The most used method to do face classification tasks is the nearest neighbor (NN) [
35,
41] with the given metric and the Support Vector Machine (SVM) [
35].
2.4. Gaze Estimation
As described in many pieces of research [
12,
13,
15], eye-gaze and face-gaze are of great importance for assessing the cognitive engagement or inattention of students. Some methods [
42,
43] have been developed to estimate eye-gaze. However, the ability to extract eye-gaze might be limited due to blurry images, camera resolution, etc. This raises the requirement for using the head-pose as an alternative approach. For head-pose estimation, 3DDFA [
44] and KEPLER [
45] detect facial landmarks then fit them via a convolutional neural network (CNN) or its modified version. However, using landmarks could be a minus point. As with low-resolution images, the incorrect detection of landmarks could lead to worsening results. Hopenet [
46] combined ResNet50 with a multi-loss architecture. Each loss contained a binned pose classification and regression, corresponding to yaw, pitch, and roll individually. It showed that it can directly predict head rotation and highly outperform landmark-to-pose methods using state-of-the-art landmark detection methods. FSA-Net [
47] provides attention for pose estimation and even proved to be a slight improvement over Hopenet [
46].
2.5. Position Estimation
Two students may have two similar view-directions, but the objects being observed may be different. It depends on the position of the students. For example, two tablemates (left and right) look to the left, but one student can look at the board while the other is looking out the door. Therefore, determining the relative position of students directly affects the prediction of where students are observing. In our camera model, a scene view is formed by projecting 3D points into the image plane using a perspective transformation [
48]. In order to convert coordinates of a projection point in pixels to its coordinates in the world coordinate system.
We measure the angles x and z axes of camera coordinate system made with x, y, and z axes of the world coordinate system (normally, the original matched with the classroom corner) to compute extrinsic parameters R and t. Since if , β, and are the angles a vector made with the x, y, and z axes, respectively, then is a unit vector in that direction. Thus, we can obtain the unit vectors and in the direction of the x and z axes of the camera coordinate system. The remaining unit vector can be obtained by taking the cross product of and (). After the transformation from the world coordinate system to the camera coordinate system, these basis vectors and respectively, have the new values of , , and . Solving the system of linear equations, we have and where are the coordinates of the camera in the world coordinate system.
Consider two upper points of the bounding boxes of two detected faces. We made an assumption that the distance between them has the value of . We also assumed that the coordinates in the camera coordinate system of these two points are and . It can be seen that the vector created by these two points is perpendicular to the normal vector of the camera lens. Or in other words, it is parallel to the plane z = 0 of the camera coordinate system, which means must be equal to . Solving the system, we have the value of and . Then, we can obtain the coordinates of and in the world coordinate system: .
From the values of those two points, we can approximate the location of a student by taking the coordinates of the midpoint of
. In our problem, we assume that
has a value of 14 cm.
Figure 3 illustrates an output example of the algorithm. We have there, an image frame acquired from a lecture video and two diagrams alongside it represent the approximate locations of students in the sample image frame, as pairs of
points. Another approach is to consider two landmark points representing two eyes in a face. In this case, the vector created by these two points is perpendicular to the head-pose vector of the face (in this case,
). We also assumed that the known distance between these points is fixed at
.
2.6. Summarize Analyzed Data
A face classification can misclassify a person due to pose variant, blurry image, etc. This algorithm is to summarize the results analyzed and improve the face classification by only using a strong, confident classification which can reduce the miss-classification problem. Consider a face and its extracted data (bounding box, facial landmarks, gaze, etc.) in a frame as an entity. A person will be represented as a sequence of appearances.
2.6.1. Uniting the Appearances into a Sequence
The method to unite appearances was based on the kernel method of object tracking [
46,
47]. Consider that frame
is the image frame at time
. It contains
appearances. Frame
at time
contains
entities and
is close to
. Consider an appearance
from frame
, and
from frame
.
and
are united if:
, where is a pre-defined hyper-parameter which defines the time (in milliseconds) to search the suitable appearance to unite with.
with .
All appearances will be united and now they become
separated sequences of entities.
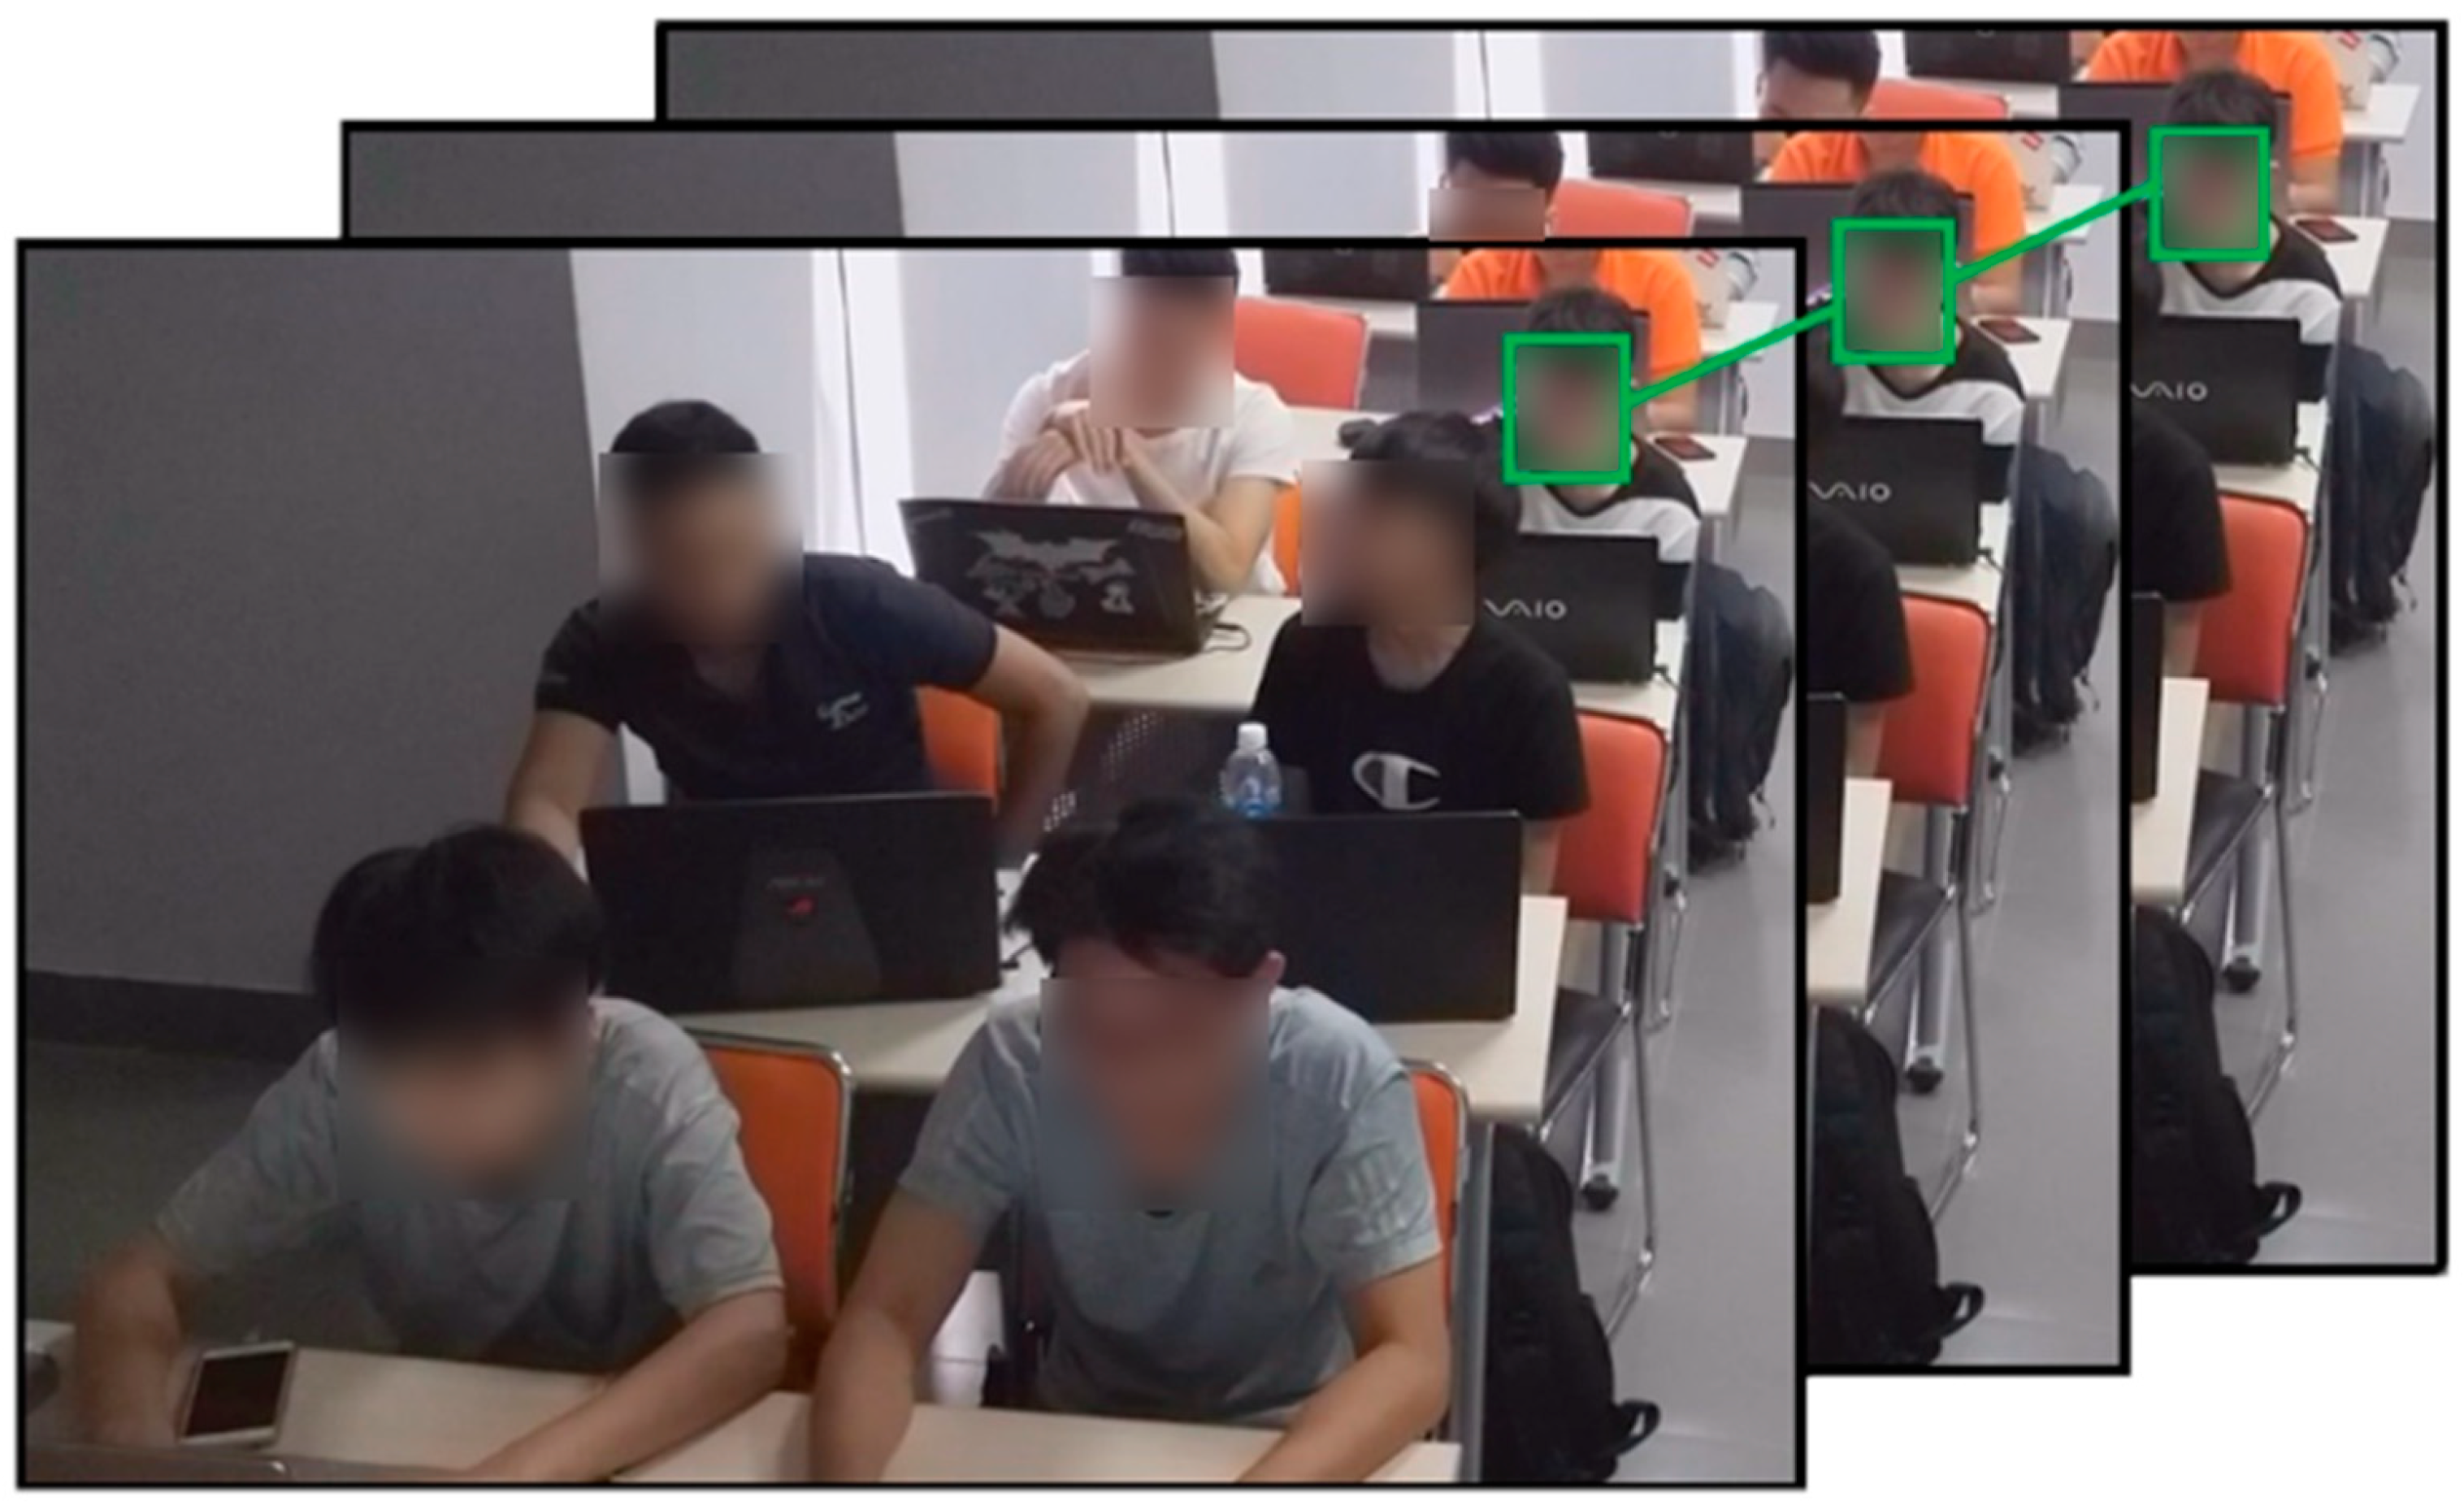
Figure 4 shows an example of a sequence of appearances of three consecutive image frames. These appearances are united by the algorithm that determines them as the same person.
2.6.2. Unite Sequences into Sets of Sequences
Consider two sequences of appearances and . and are united if:
with
- ▪
.
- ▪
.
All sequences will be united into set of sequences.
2.6.3. Classify a Set of Sequences
We will perform classification on the embedding vectors of each set of sequences. Consider a set of sequences
. The class of
can be determined by:
with
- ▪
.
- ▪
is the function to handle face classification.
4. Results and Discussion
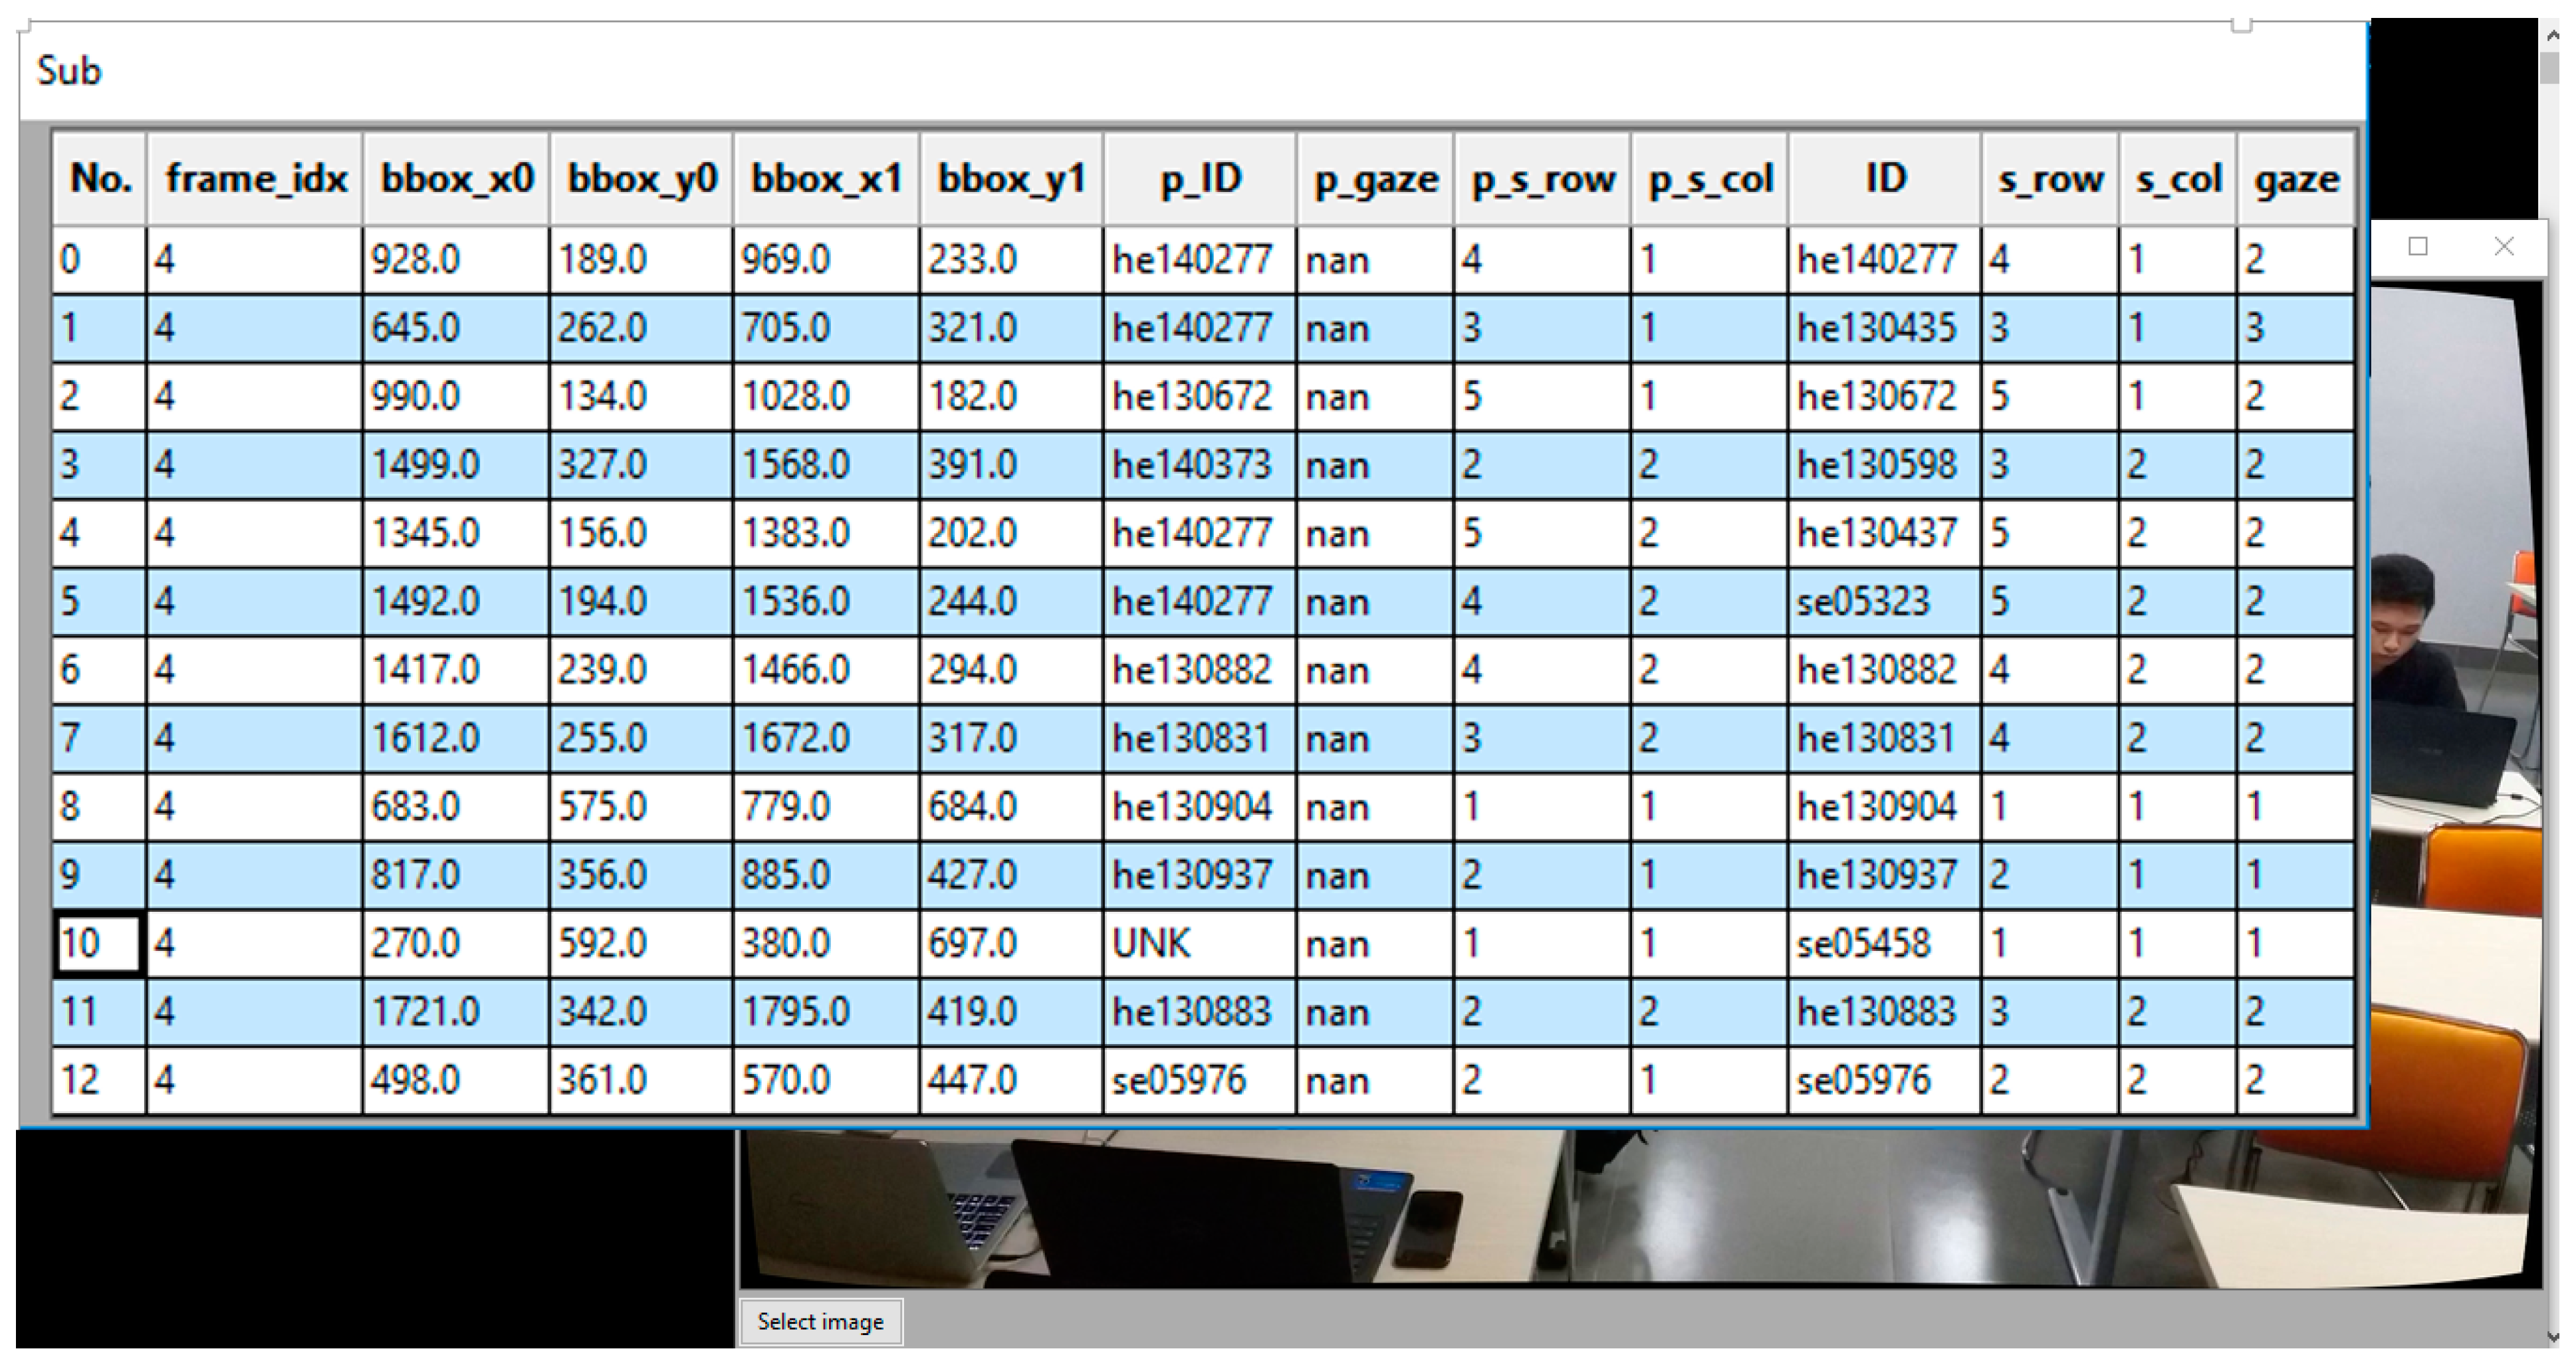
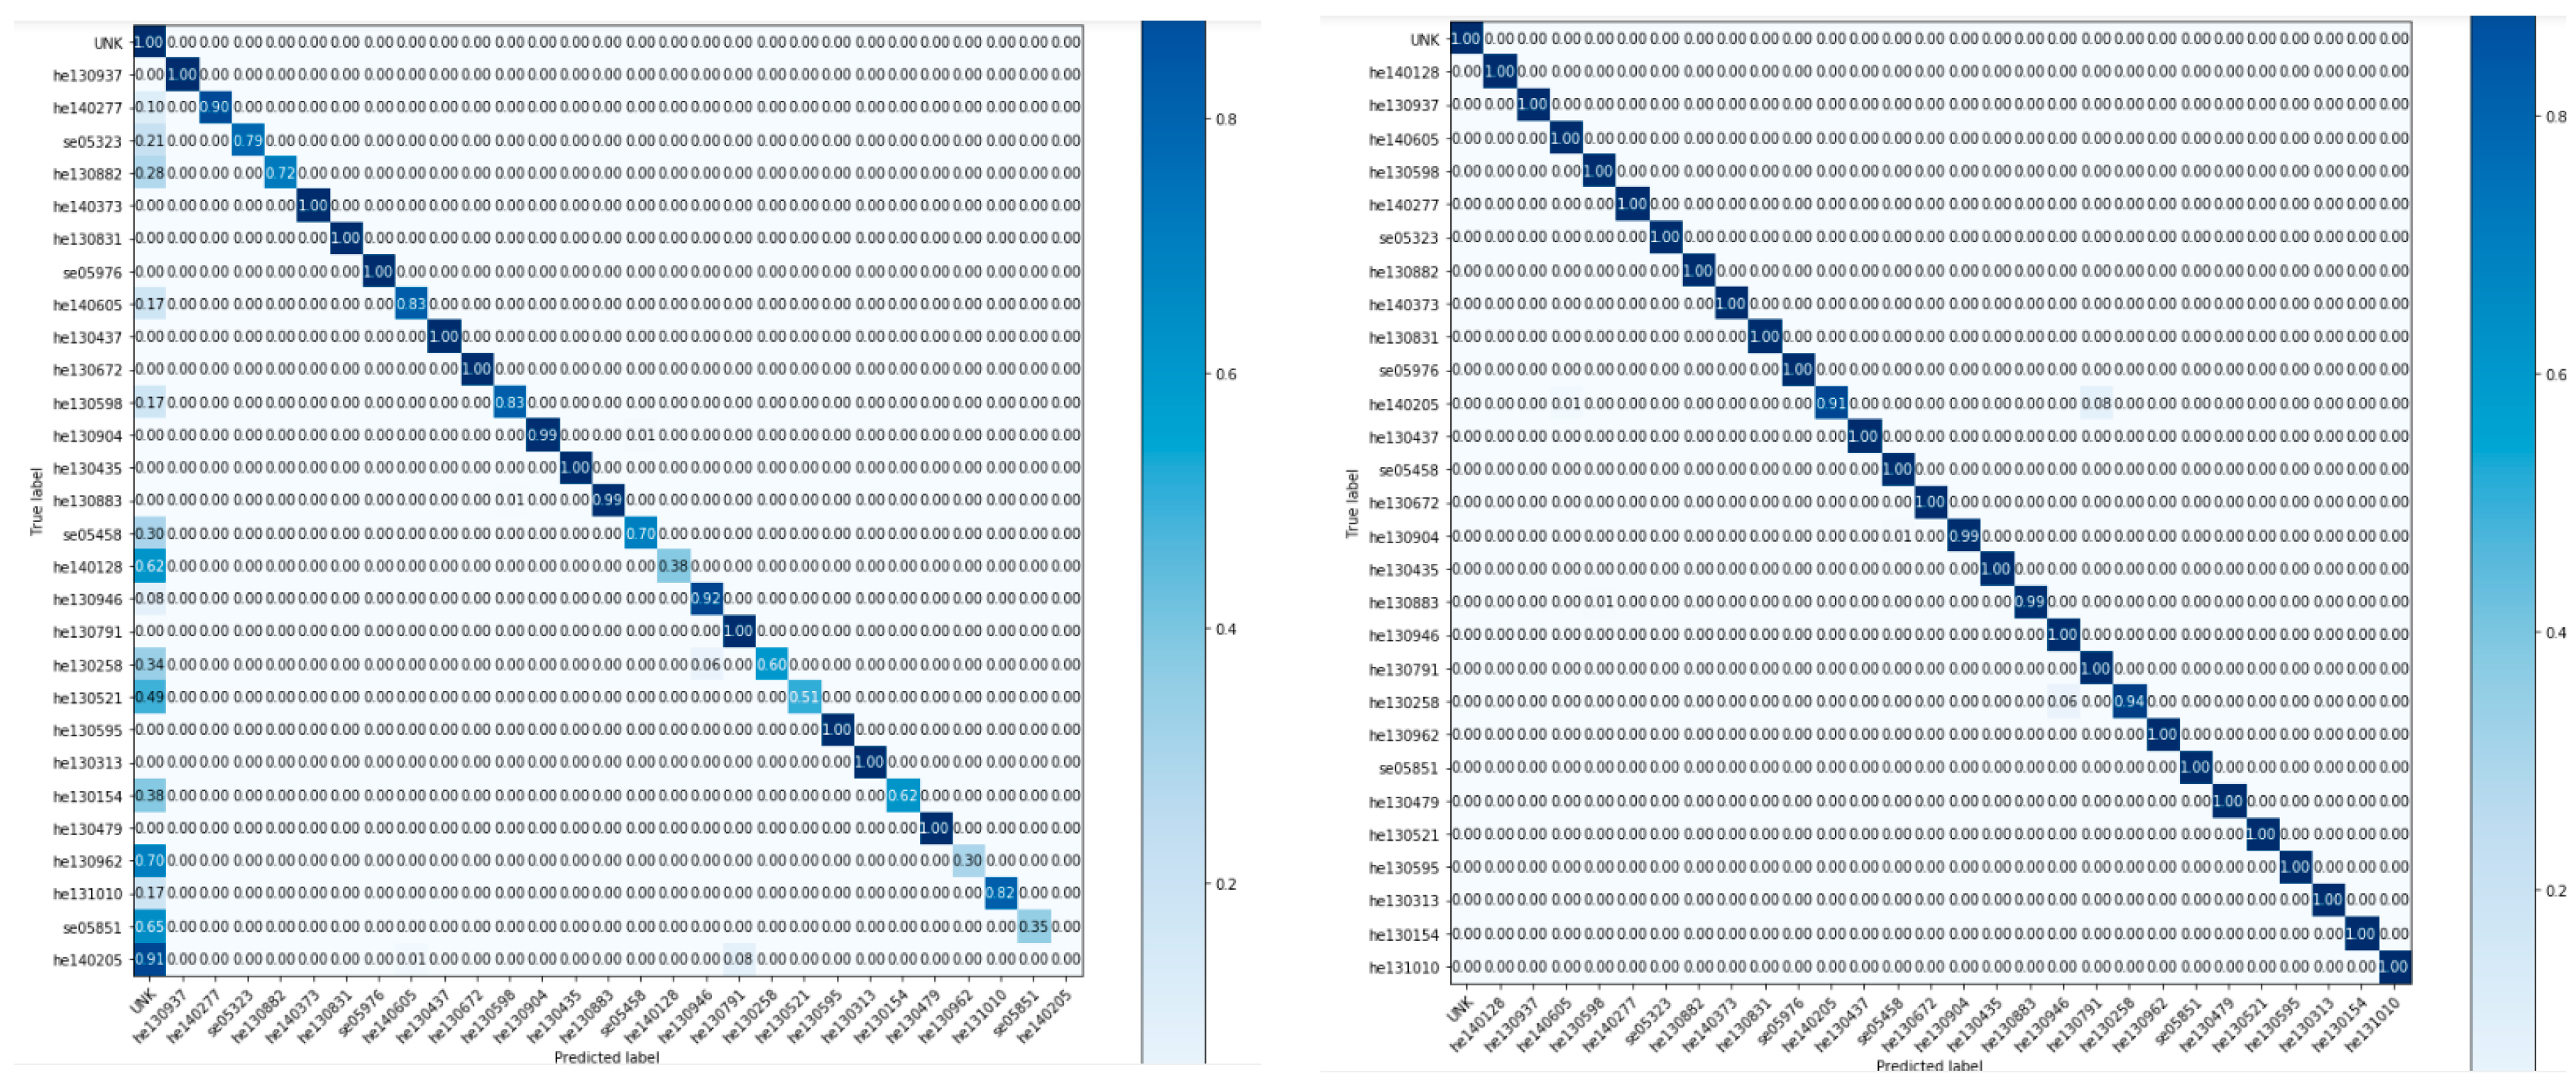
We did the evaluation to verify the results in three main phases: student ID, the position of the student (via row and column), and gaze. First, it is the student ID that needs to be detected primarily. The student IDs maintain an important role in this context. Once all student IDs have been identified and located, the tracked data of individuals’ behaviors will be attributed to them later. Student ID identification is evaluated through all the data of the dataset. Because the data are imbalanced, F1-scores are necessary. A confusion matrix is also plotted. The first column and row represent the label of “unknown,” and the other columns and rows show the results of corresponding student IDs. Secondly, row and column are evaluated. The row and column represent the current position of the student in the class which is going to be combined with the head-pose direction to denote the origin and the direction of the gaze vector. The row and column are evaluated with MAE (mean absolute error). Besides, confusion matrices are also constructed for those estimations; vertical and horizontal values of the matrices are matched with the ranges of parameters. Finally, the gaze plays the most pivotal role in the system, to check if the students are focusing on the board/slides, on laptops, or on other things. The summarized statistics of gaze could be exhibited for educators to observe the behaviors of attention over the studying period. Gaze estimation is acquired through re-trained models. Hence, the dataset is divided into training and testing sets, and then one-third of the dataset (7556 rows) is used for evaluation. The F1-score is also applied to evaluate the result of gaze estimation.
We observe from
Figure 6 that the confusion matrix for student ID identification shows a reliable result; the diagonal is deeply colored. Moreover, we get an F1-score that is 82.81% if using our summarization algorithm and 72% if not. If we manually label the unknown set of sequences that are produced by the summarization algorithm, which can be called “semi-assist” labeling, the F1-score can be up to 99.23%. The results of this facial recognition are nearly equivalent to the results of the arc face; however, we used our application in the real world instead under ideal conditions. Facial recognition and behavior detection seem to be poorly interrelated. However, tracking the behavior on an identified student is important. It provides many levels of detail (granularity) when building a decision support system.
We used the mean absolute rrror (MAE) to evaluate the performance of the 3D coordinate estimation task. The results are shown below:
We can observe from
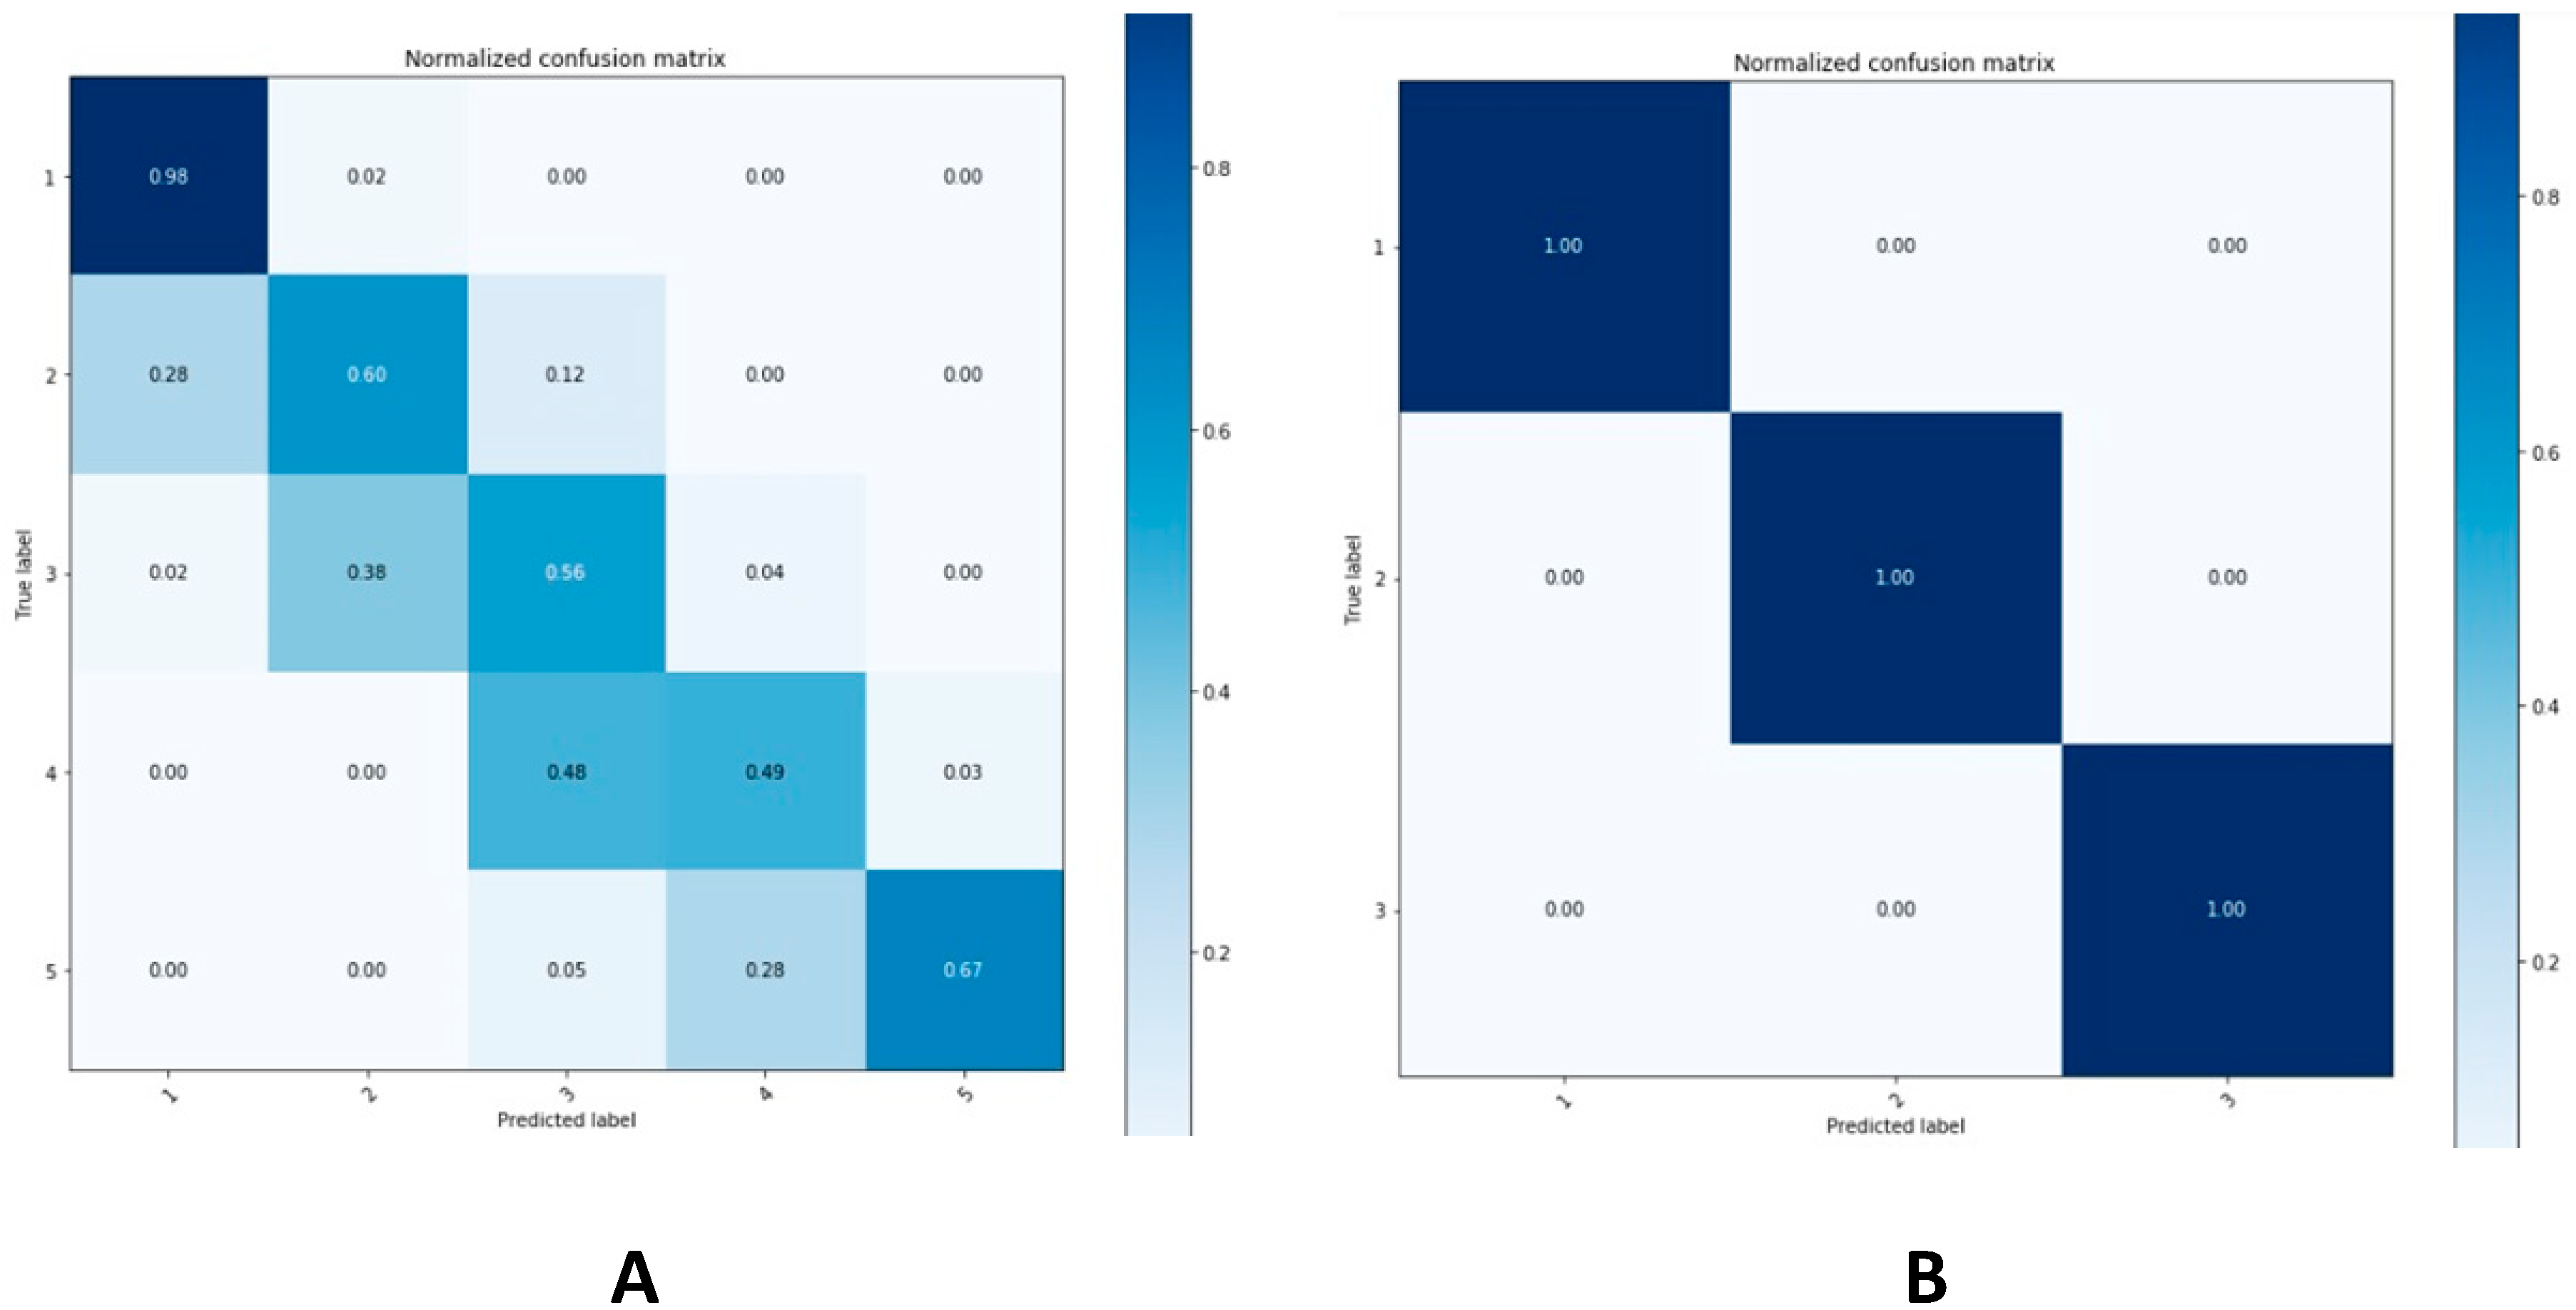
Table 1 that column estimation gets an infinitesimal mean error, which represents a reliable outcome. For row estimation, this difference is trivial. Moreover, the confusion matrices (
Figure 7) have shown that the error is often one that is acceptable for the expectation of estimating an approximation of seat position. In this context, different positions have the same vision direction but may not look at the same object. This result may not be a highly accurate result for the problem of 3D scene construction using two-dimensional images because the actual error is large. However, it may be acceptable for solutions that are only concerned with using the relative position of the estimated position object. When dealing with different parameters such as the size of the classroom, the distance between tables, and the layout of the classroom, it is useful to combine them with the eye-gaze to determine the target being observed by the students. Multiple cameras could provide better results but the cost is also higher.
For the gaze classification task,
Table 2 shows our results. It is immediately obvious from the table that our best outcome was achieved with random forest and SMOTE helped slightly to improve the result. Those outcomes certify a strong possibility for applying of gaze for our system.
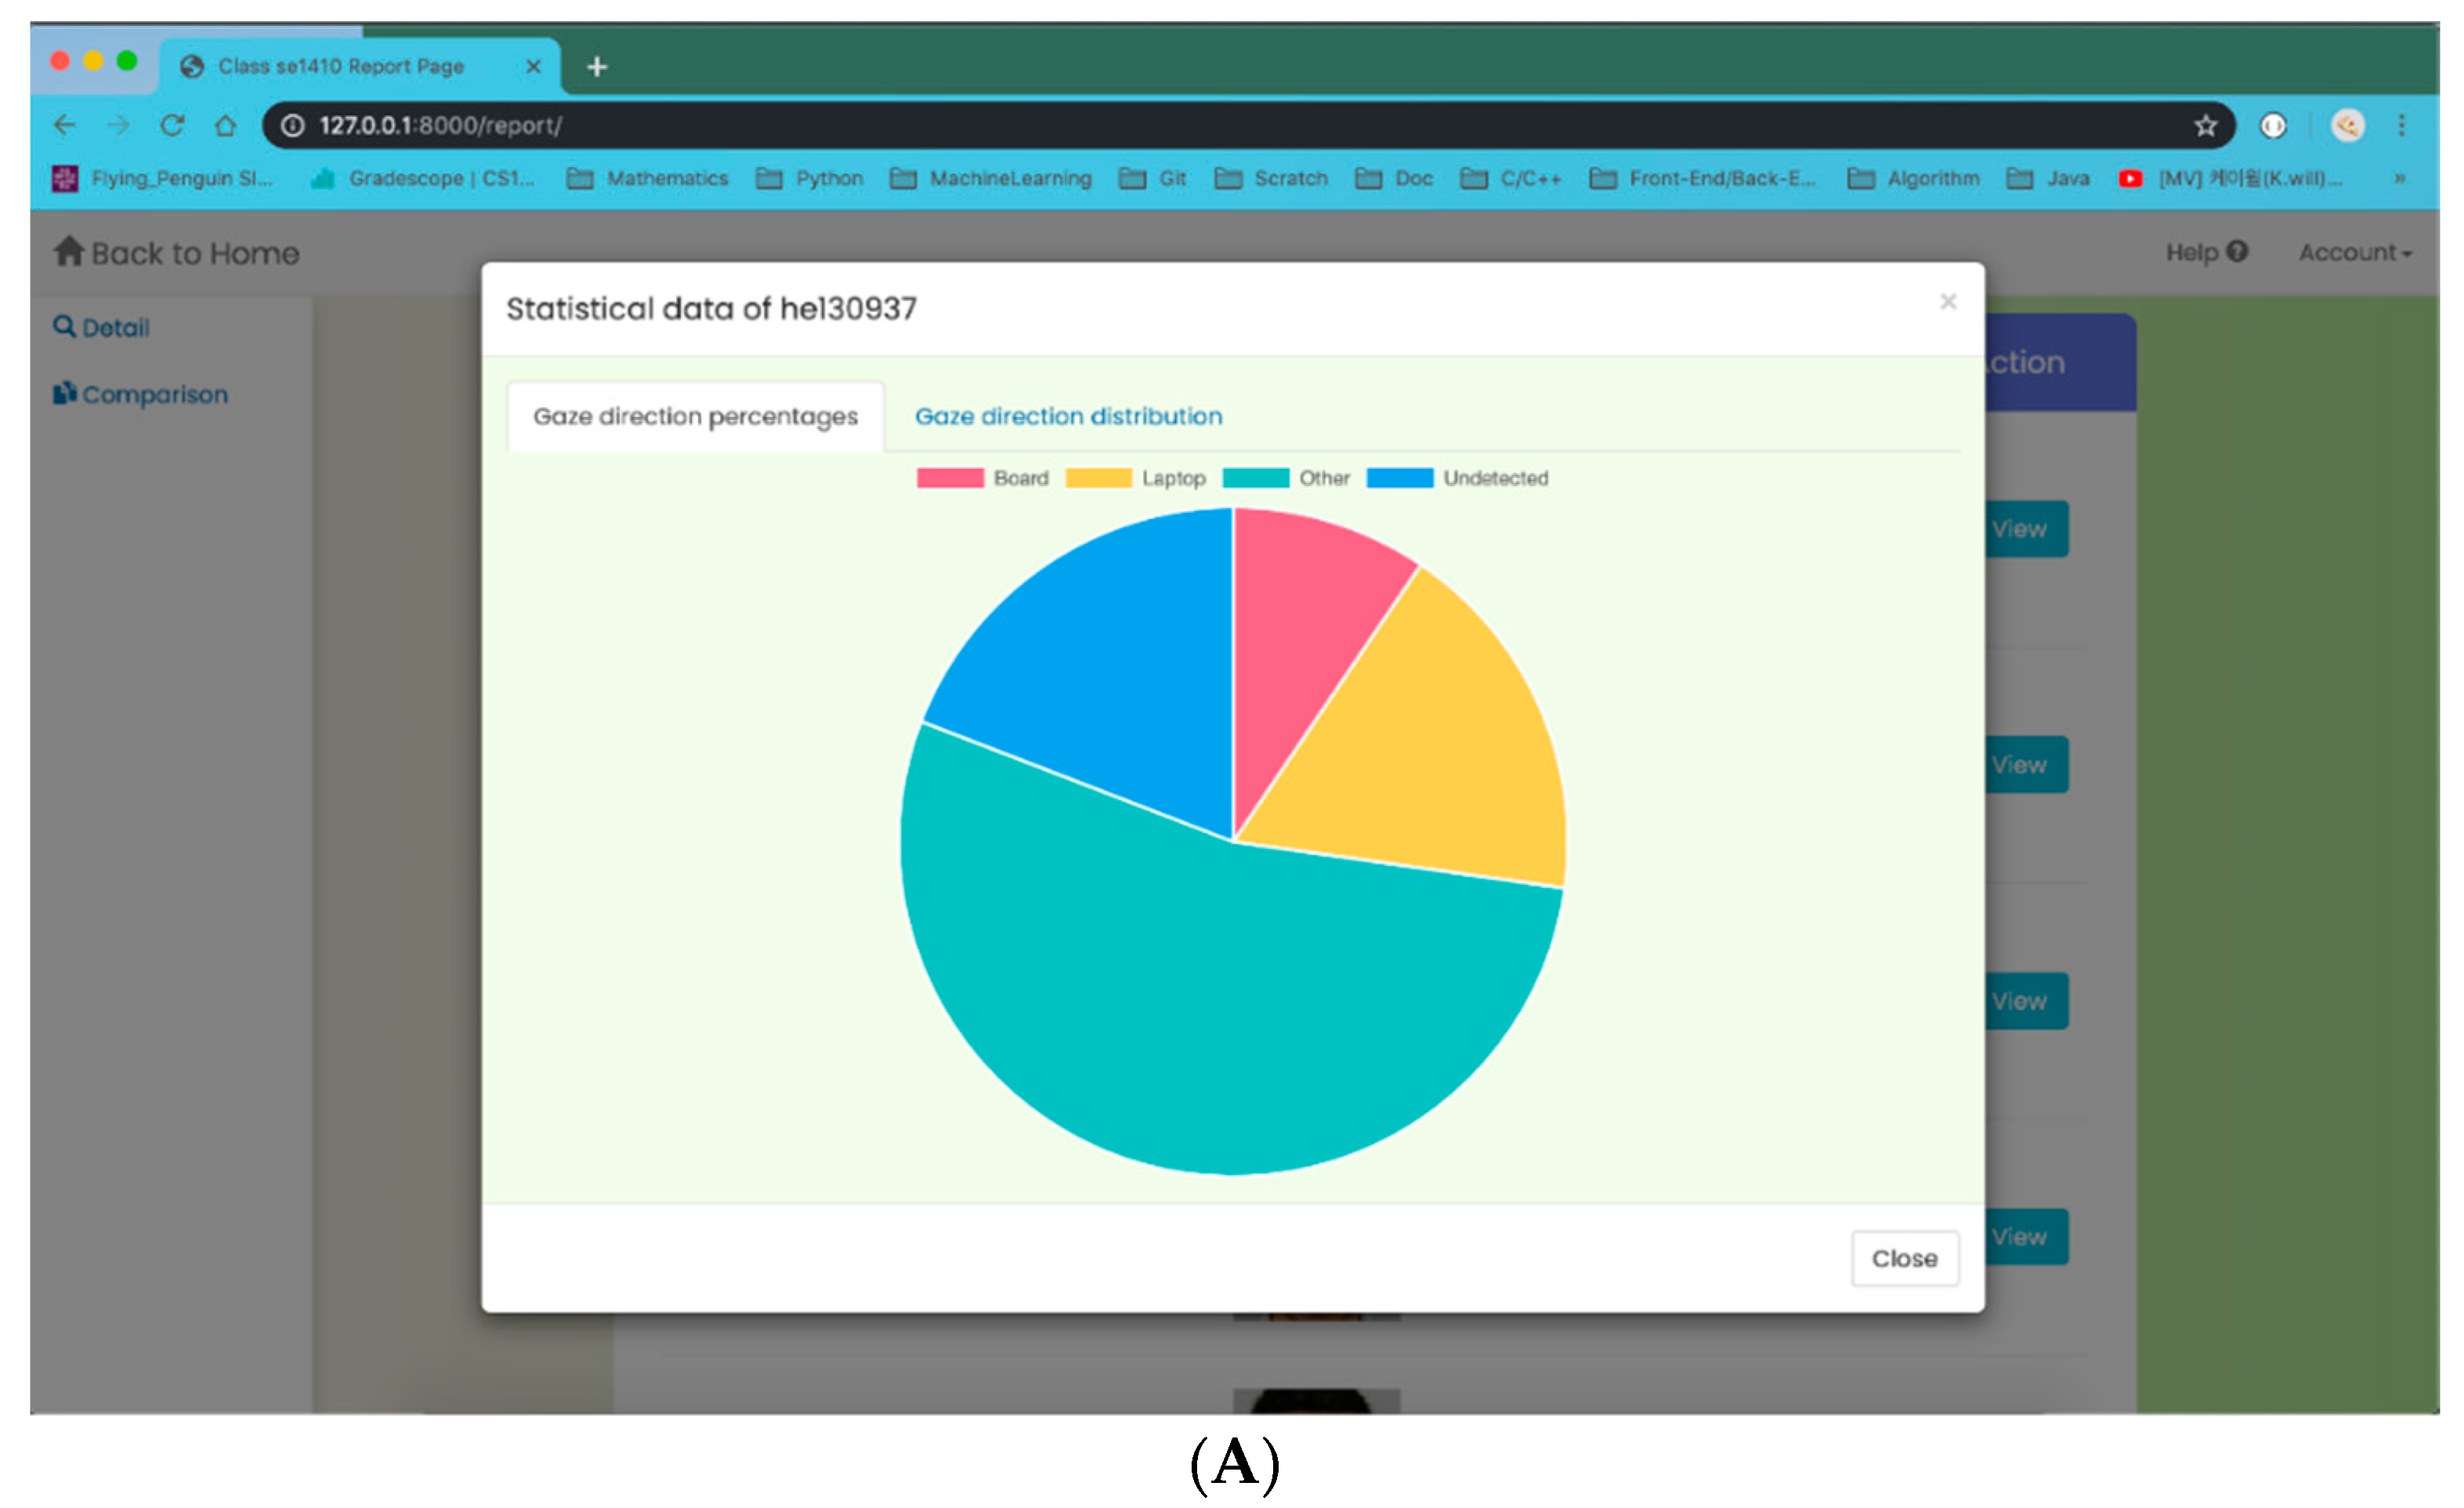
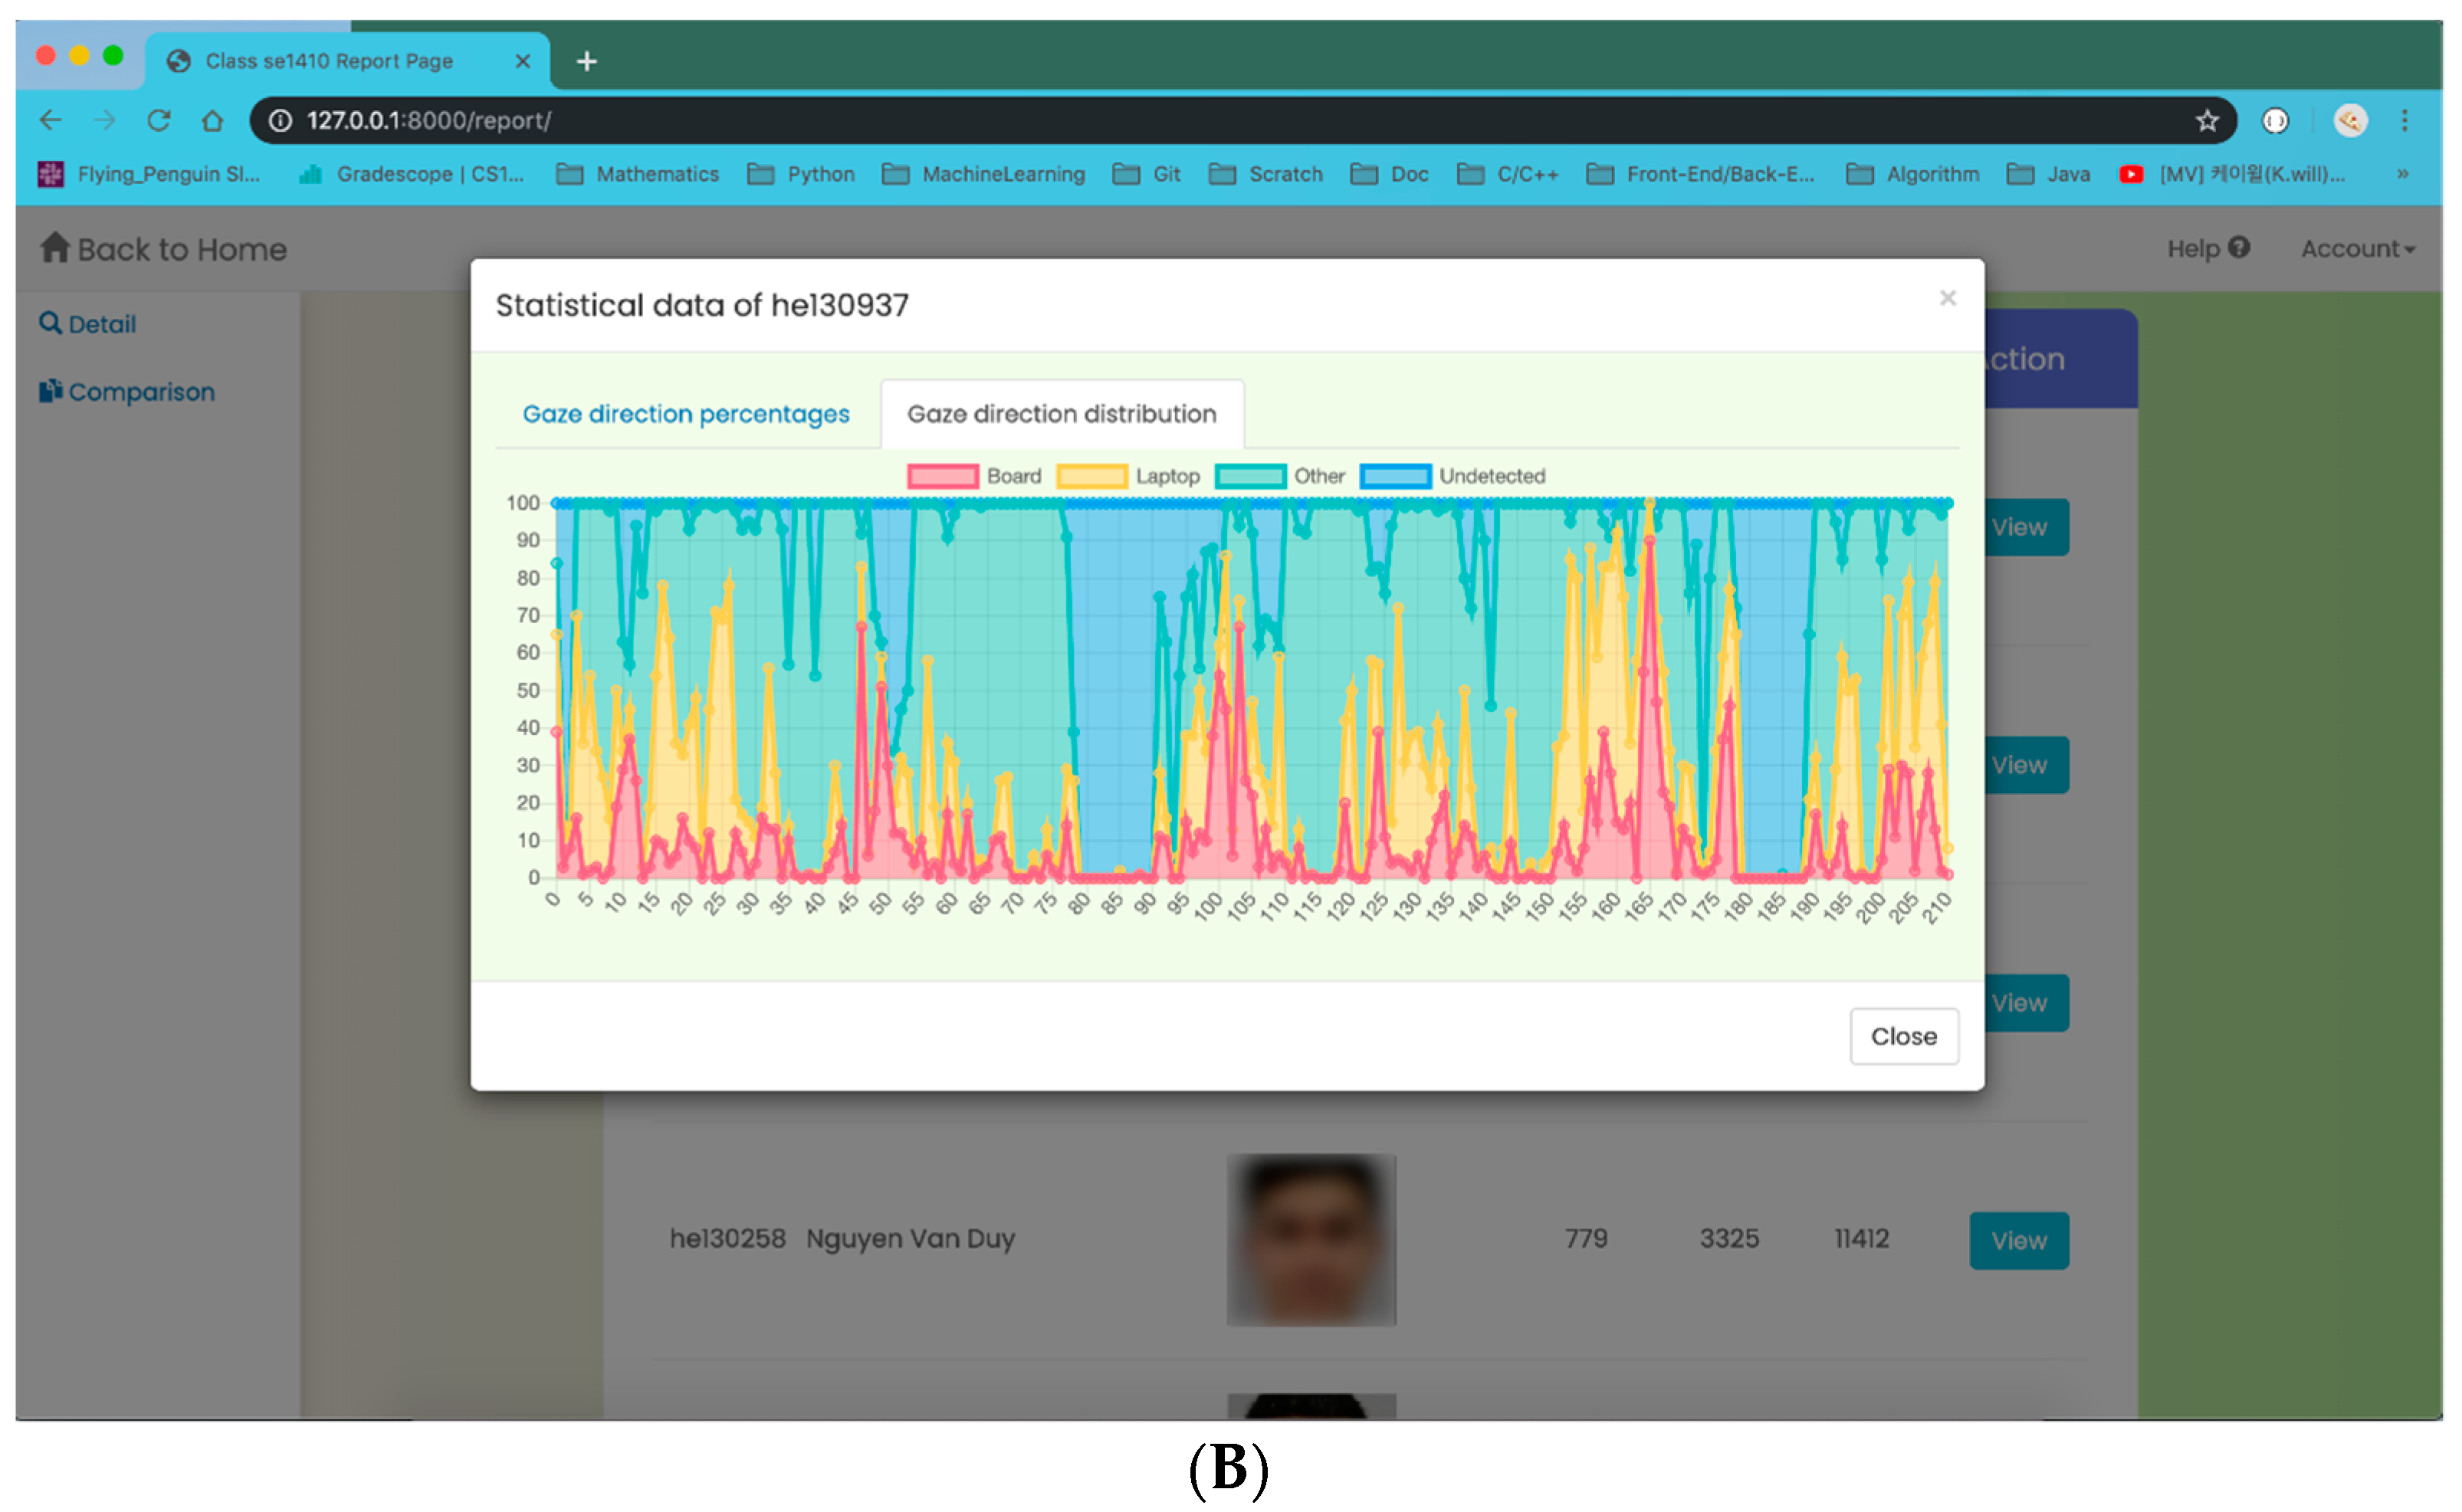
For the result-visualization task, combined with gaze classification, we divide our dataset into four classes: board (student gazes at the board), laptop (student gazes at the laptop), other (student gazes at the others), and undetected (student is undetected). In order to make the data visualization task clearer and more understandable, we propose two types of charts—a pie chart and an area chart, as in
Figure 8. The pie chart (
Figure 8A) illustrates the numerical proportion of gaze direction data during the class. The arc length of each slice (or its central angle and area) is proportional to the quantity of corresponding class it presents. From the chart, we can see that the “other” gaze class has the greatest quantity, while the class of “board” takes the least amount. The percentages of “laptop” and “undetected” classes are quite similar. The area chart (
Figure 8B) represents cumulated total number of appearances of gaze classes over time. With the chart, we are able to observe how just one quantity of class changes, or it will show us the changes in many quantities over time. Concretely, we divide each lecture duration into time windows, as horizontal axes (e.g., 211 windows in the above area chart). On each time window, we proceed to take a fixed number of gaze evaluations. In particular, there are 100 gaze evaluations on each window in the chart 8B, corresponding with 100 total appearances of gaze classes, as the vertical axis. On the window 100 (with 0-index), for example, the number in the “board” class is approximately 50; it is about 40 for “laptop”; the amount is over 10 for the “other” gaze class; and for class “undetected,” there is no recorded result. Just a quick glance at the aggregated results from the web app teacher can capture the overall situation of each individual student in the classroom, which they can hardly achieve by a manual process when the number of students is large.
The data collected from the system brings information about the attention of identified learners. For different subjects and curriculums, or different type of users, the data bring valuable information from different aspects depending on how they are used. For example, in the theoretical classes of the data shows that identified students were less focused on the board/slide than their classmates. This is most likely an indication of a lack of concentration during class. The teacher could take action to bring each student’s concentration back. In our institution, we have two types of ICT classes: lab and theory, with the detailed plan of implementation for the course already declared as a part of teaching material. The training department and quality assurance may link the student behavior observed with the plan of implementation to consider whether the course was implemented as planned (in the theoretical class, the student may focus on the board more. Meanwhile, in the practical class, they may focus on their laptops more. If no student is identified in a class, and the academic portal still shows that the class was actually taken, there is a high possibility of a lack of communication between the lecturer and the training room). Even when the decisions made based on student observation data are hard and not sufficiently convincing, it can be used for notifying them about outliers. Studies related to student behavior analysis in the classroom can benefit from these results.
5. Discussion and Conclusions
This research aimed to build a system that automatically supports teachers and related educational faculties with monitoring student behavior. We focused on the observation targets of the students across time. The system works as an assistant for the decision-making process. The strategic information may be discovered and delivered to the decision-makers automatically. We accomplished the building of an entire system that supports recording student behaviors, proceeding statistics, and visualizing the data. We provided the details of development and experiments and show the feasibility of combining model techniques to solve the student-behavior-tracking puzzle.
Previous works have not taken advantage of deep learning for statistical analysis [
12] or have only applied old computer vision models [
13,
14]. We successfully applied the most recent, state-of-art deep learning models. Furthermore, a combination of those models and our methods for 3D coordinate estimation as well as gaze estimation was proposed to improve the performance. We applied the SSH face detector for the face detection module, that is, basically a combination of O-Net and L-Net (MTCNN), for facial landmark detection; Arcface for facial representation; and Hopenet for gaze estimation. For the face classification task, different learning algorithms were implemented. Instead of requiring specific devices and being restricted by their limitations [
15], our outcome succeeded in dealing with a more realistic context. Although there was a limited range of behaviors detected compared with the ones in [
16], we concentrated on the real educational environment, in which classrooms have a wider range of recording devices and greater number of students.
Since the student behavior monitoring problem is bonded with many strict and tight requirements, there is a need for more investigation. Our first limitation includes the lack of monitoring of other useful information, such as emotions. More behavior-detection methods, such as facial expression, body pose, etc., are very suitable for the next improvement of the system. Another issue that we want to investigate more clearly, is the level of correlation between behaviors and the outcomes of students. This system could be utilized as the basis for further studies about those correlations in different environments. Our graphs displayed on the web application were said to be difficult to use for non-technical users. We are conducting a search for more suitable data visualization techniques. Besides, the current architecture requires a high-cost processing system. This is one of the barriers in the road to production. We need to build a better platform to reduce usage and maintenance costs.
